Easily visualize your processes and workflows with smart automation.
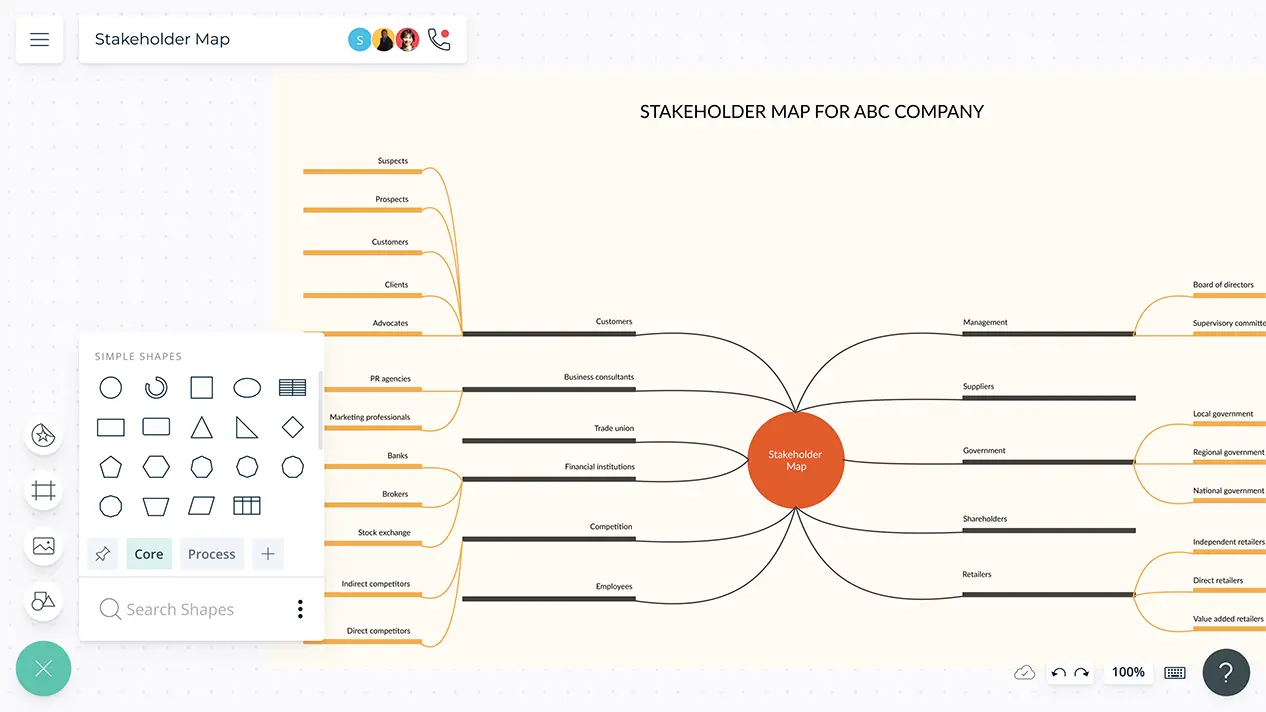
Create visual organizational structures with images and detailed profiles.
Visualize concepts and their relationships on an infinite visual canvas.
Map family history and understand the relationships with detailed genograms.
Visualize relationships between entities using Crows Foot or Chen notation.
Visualize your network infrastructure. Support AWS, CISCO, Azure and more.
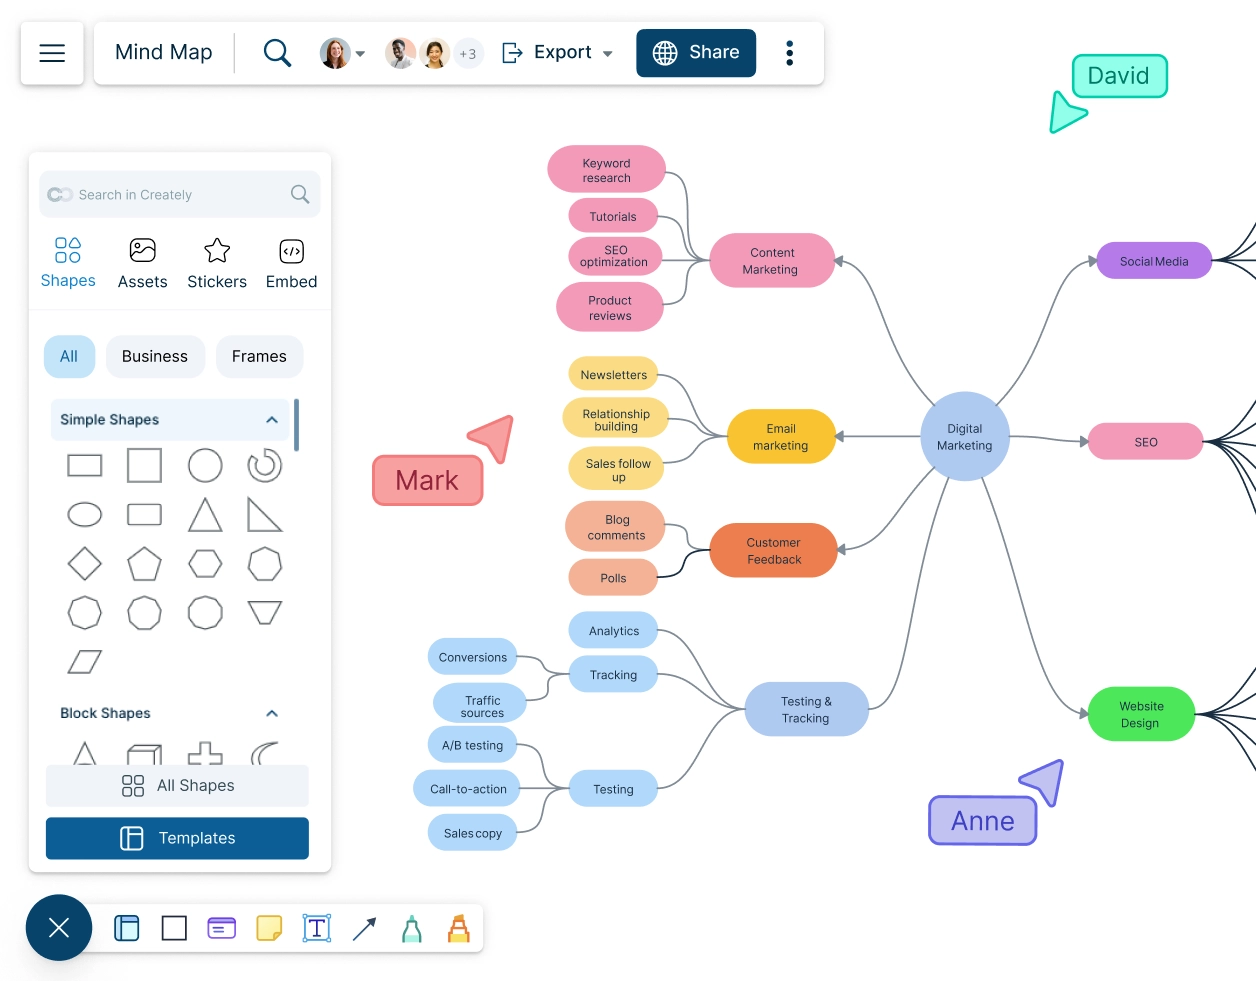
Visualize and expand your ideas using our powerful mind mapping tool.
Easily create family trees with our professionally designed templates.
Infinite canvas to add diagrams, images, sticky notes and more.
Run collaborative meetings, workshops or brainstorming sessions.
Collaborative diagramming for educators and students at discounted rates.
Log In
Sign Up Free
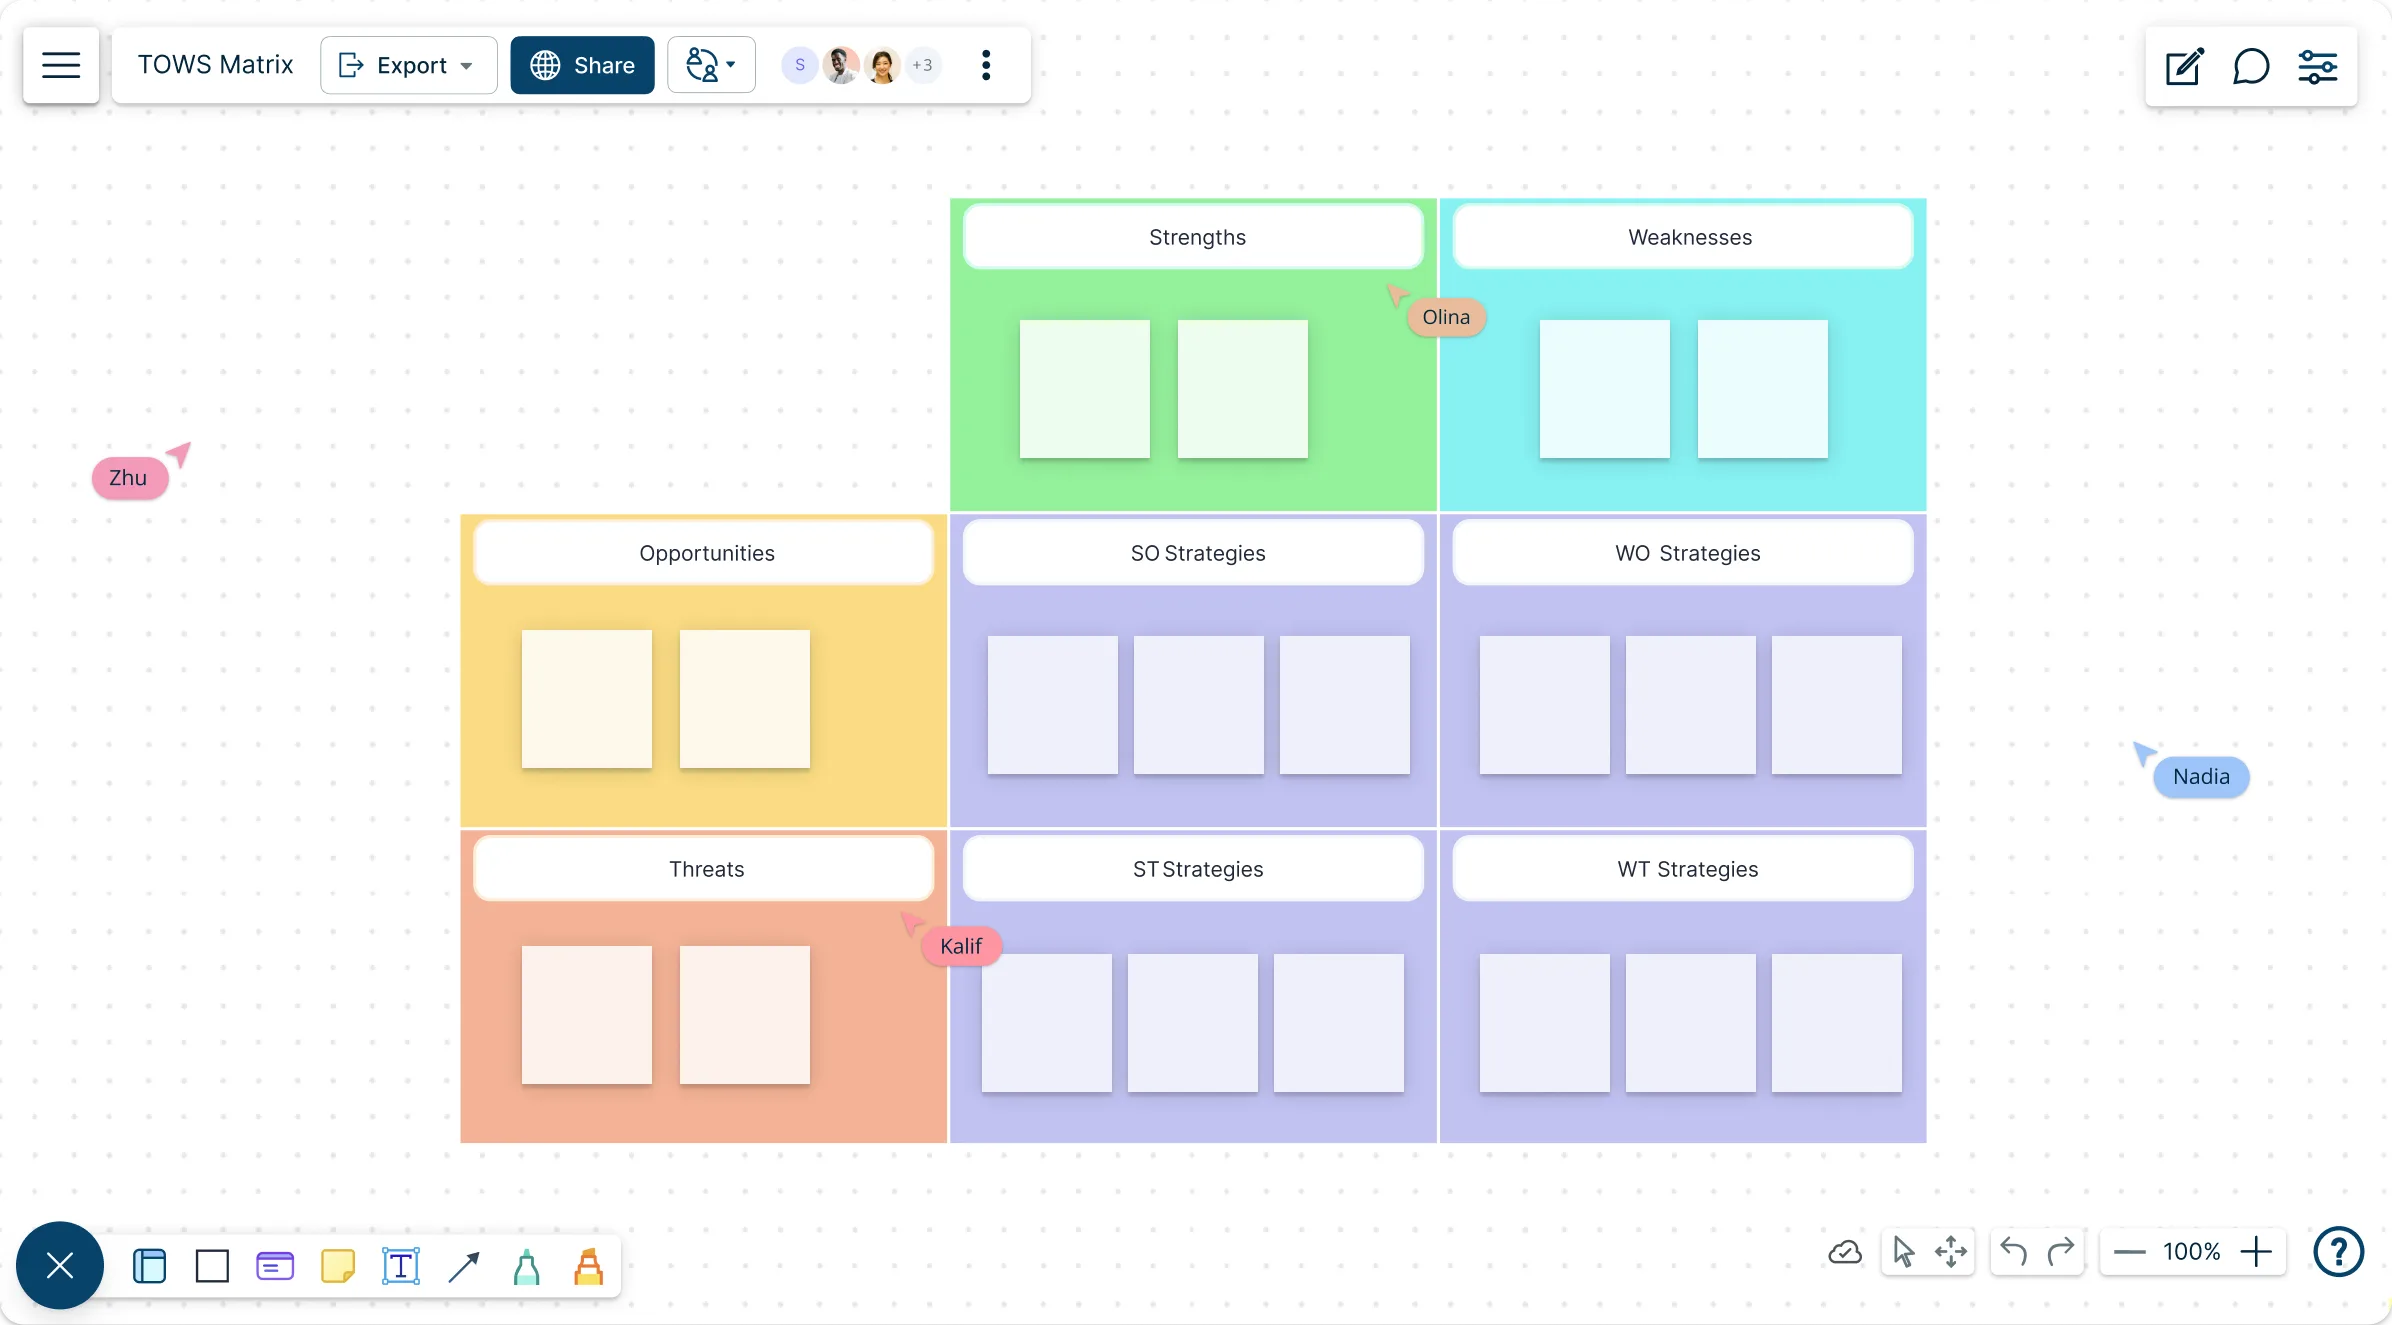
Identify key strengths, weaknesses, opportunities, and threats, combine them into clear TOWS strategies, and uncover the best actions to take next.
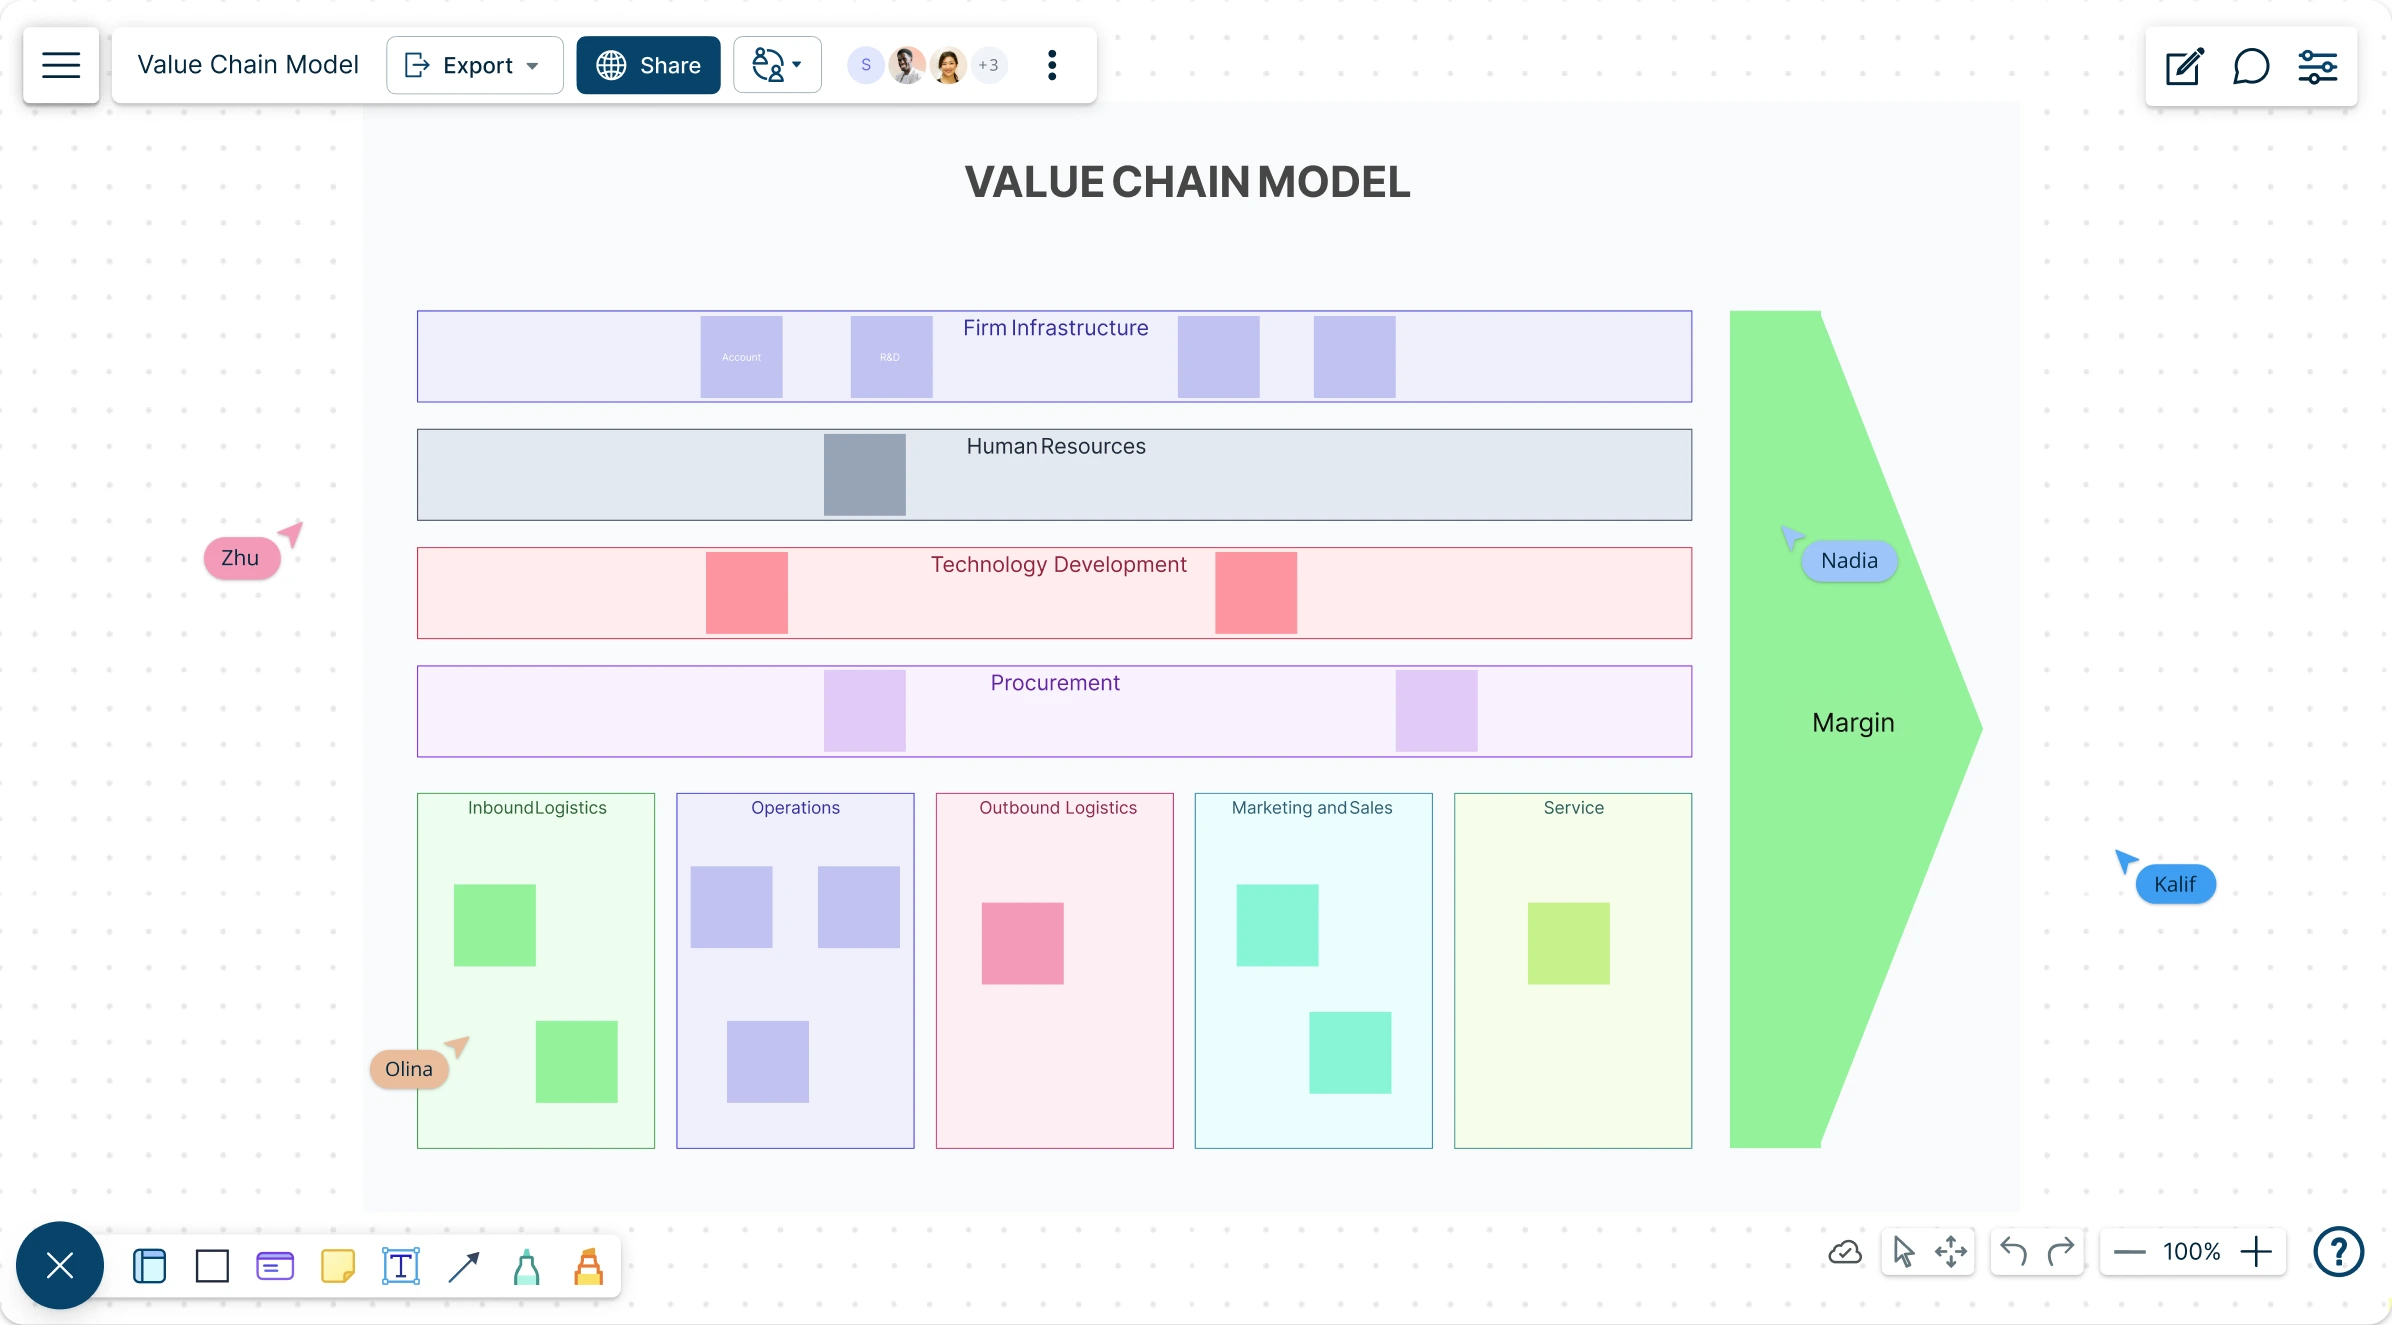
Map out your value chain easily to identify ways you can improve processes to add more value to your products & customers.
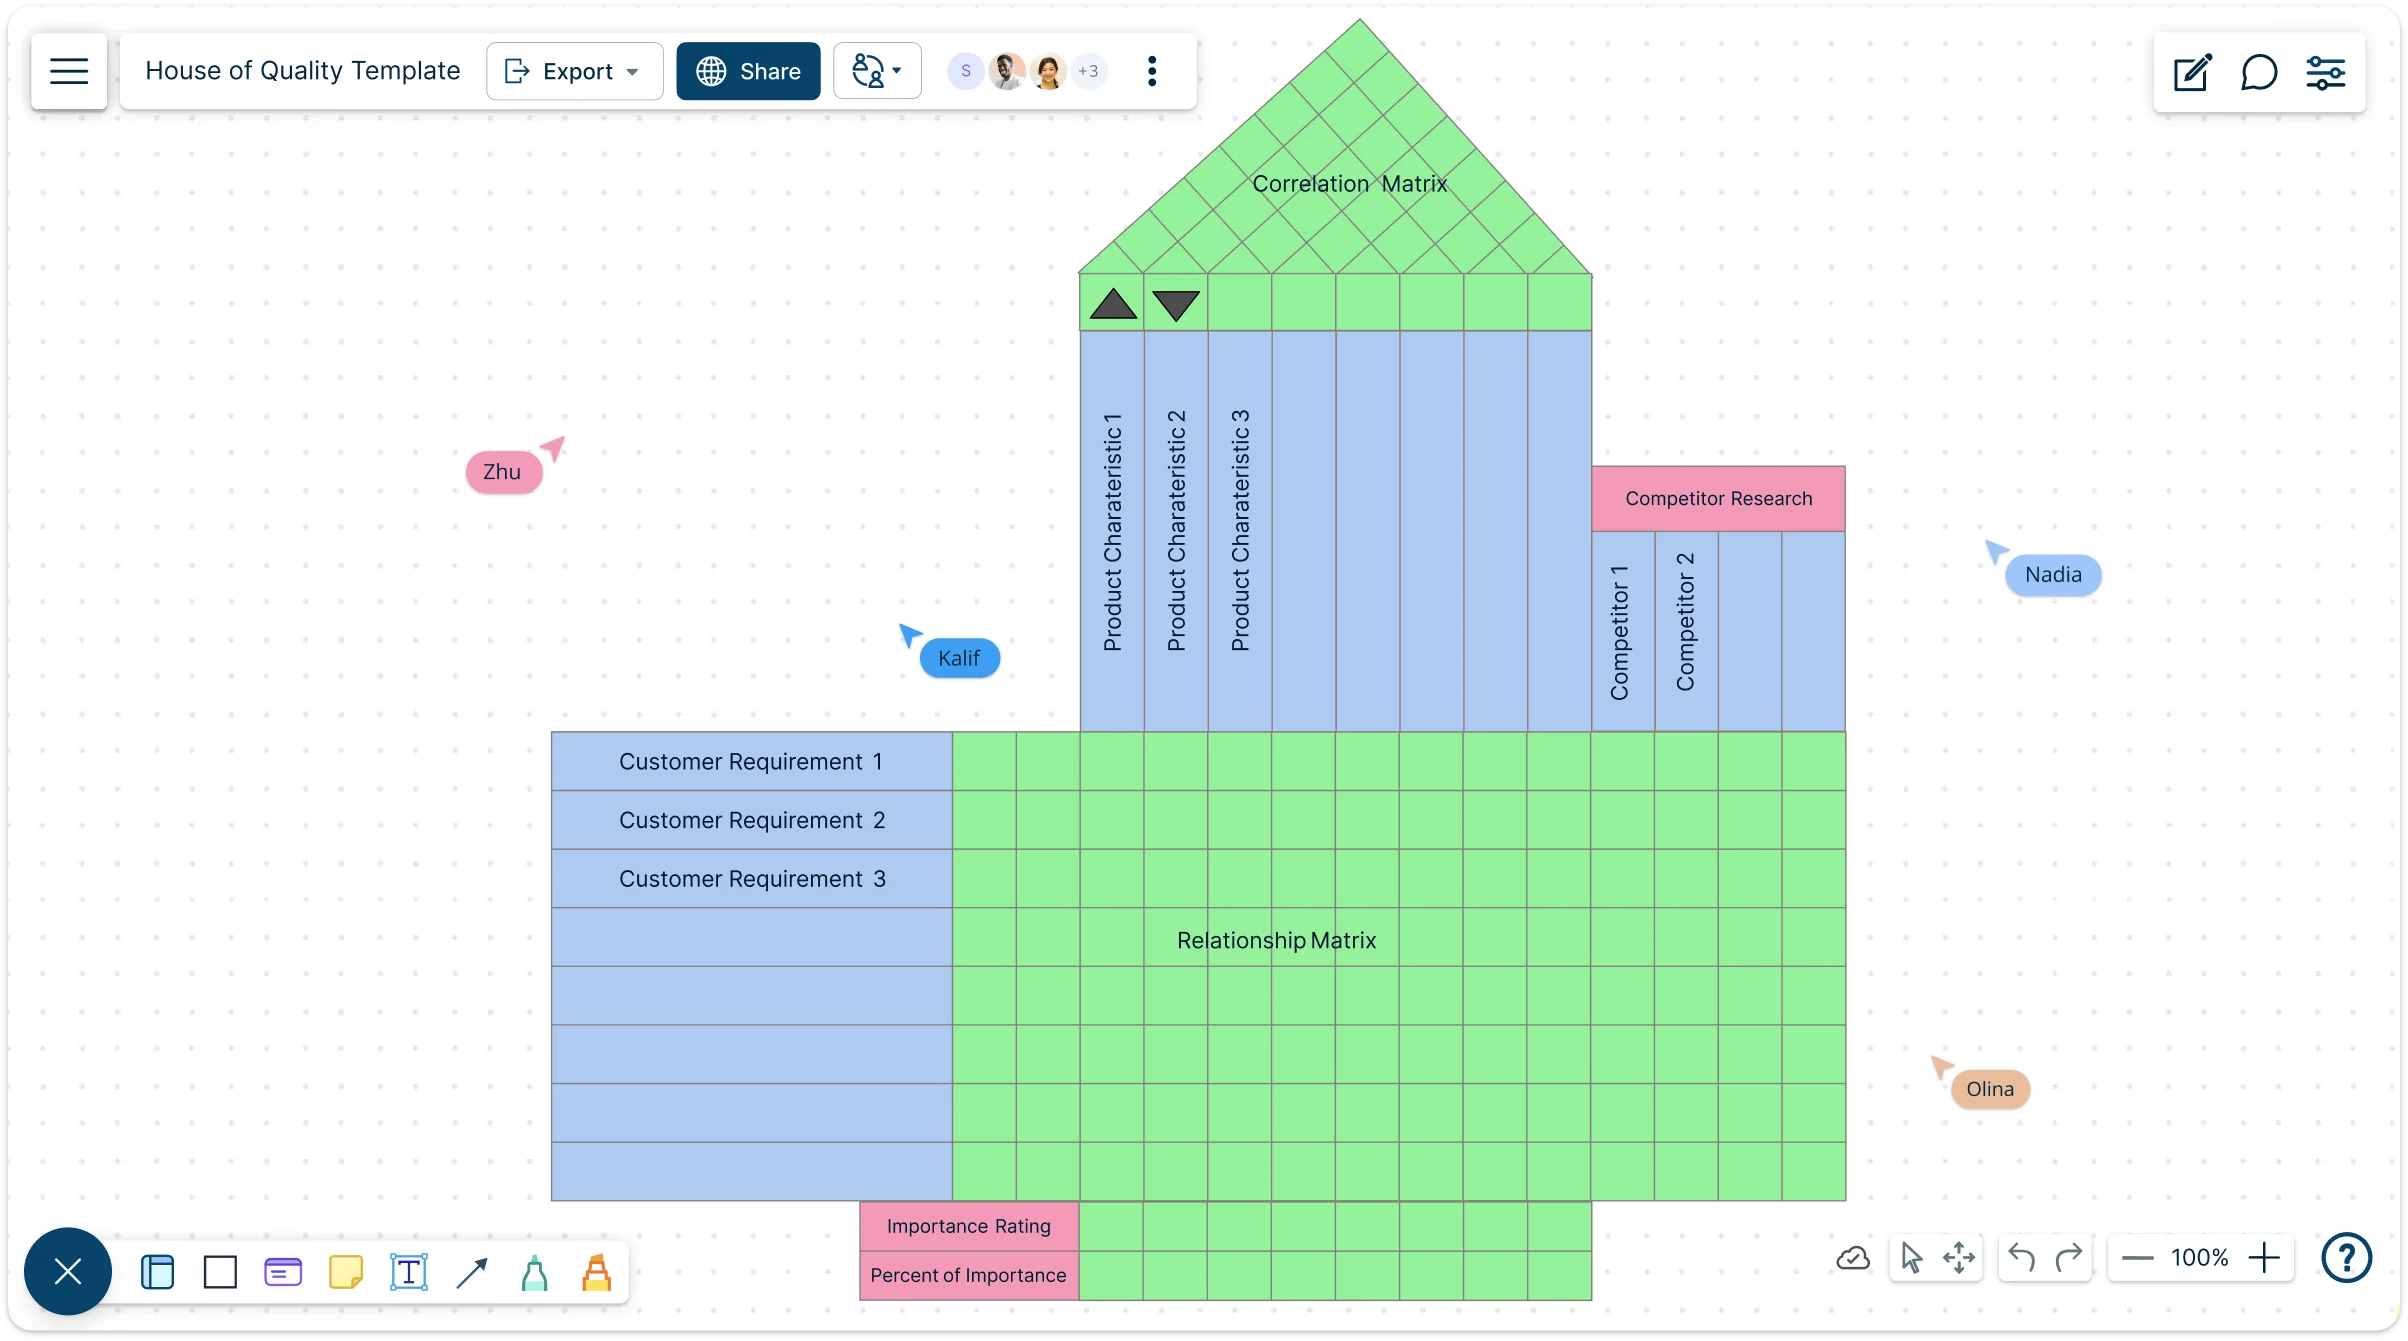
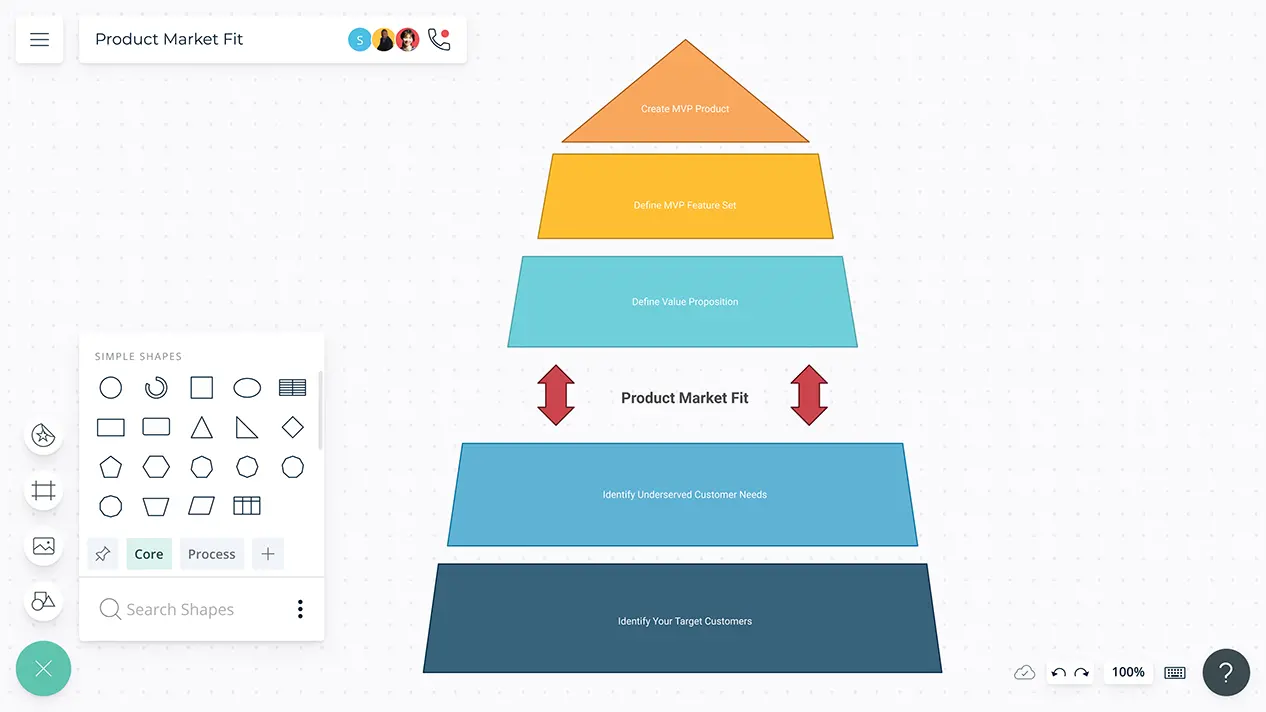
Use this visual framework to understand customer needs, ratings and develop products that resonate with users
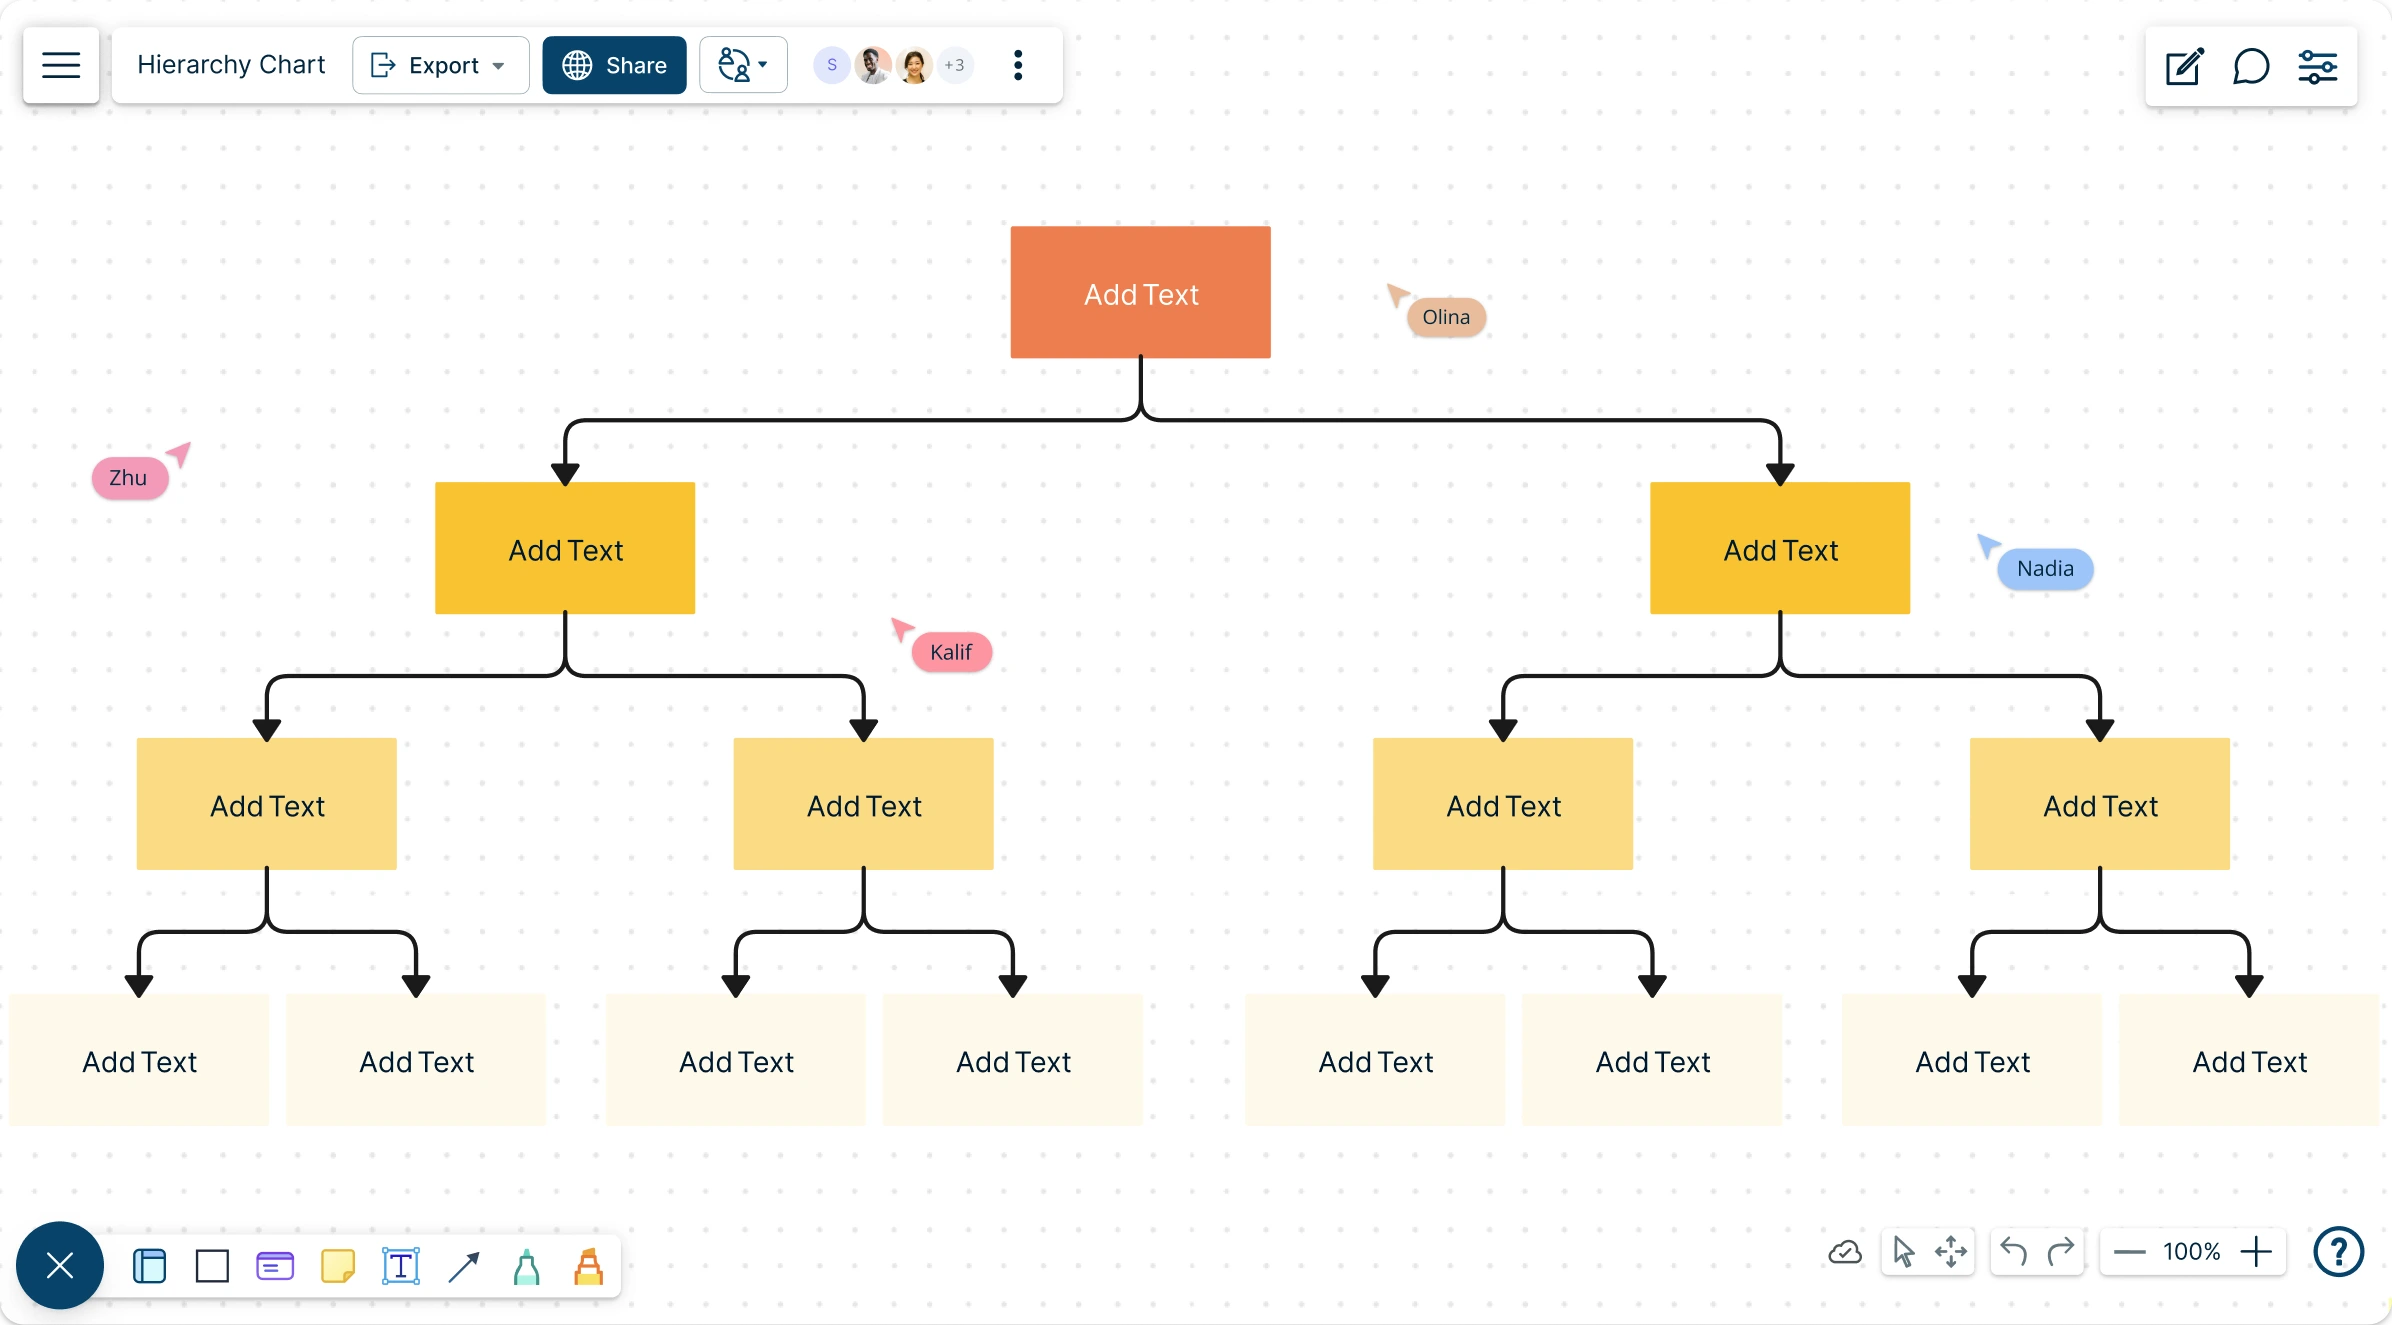
Quickly build and visualize your hierarchies with Creately hierarchy chart maker. Get clear, actionable insights into your team's structure in no time.
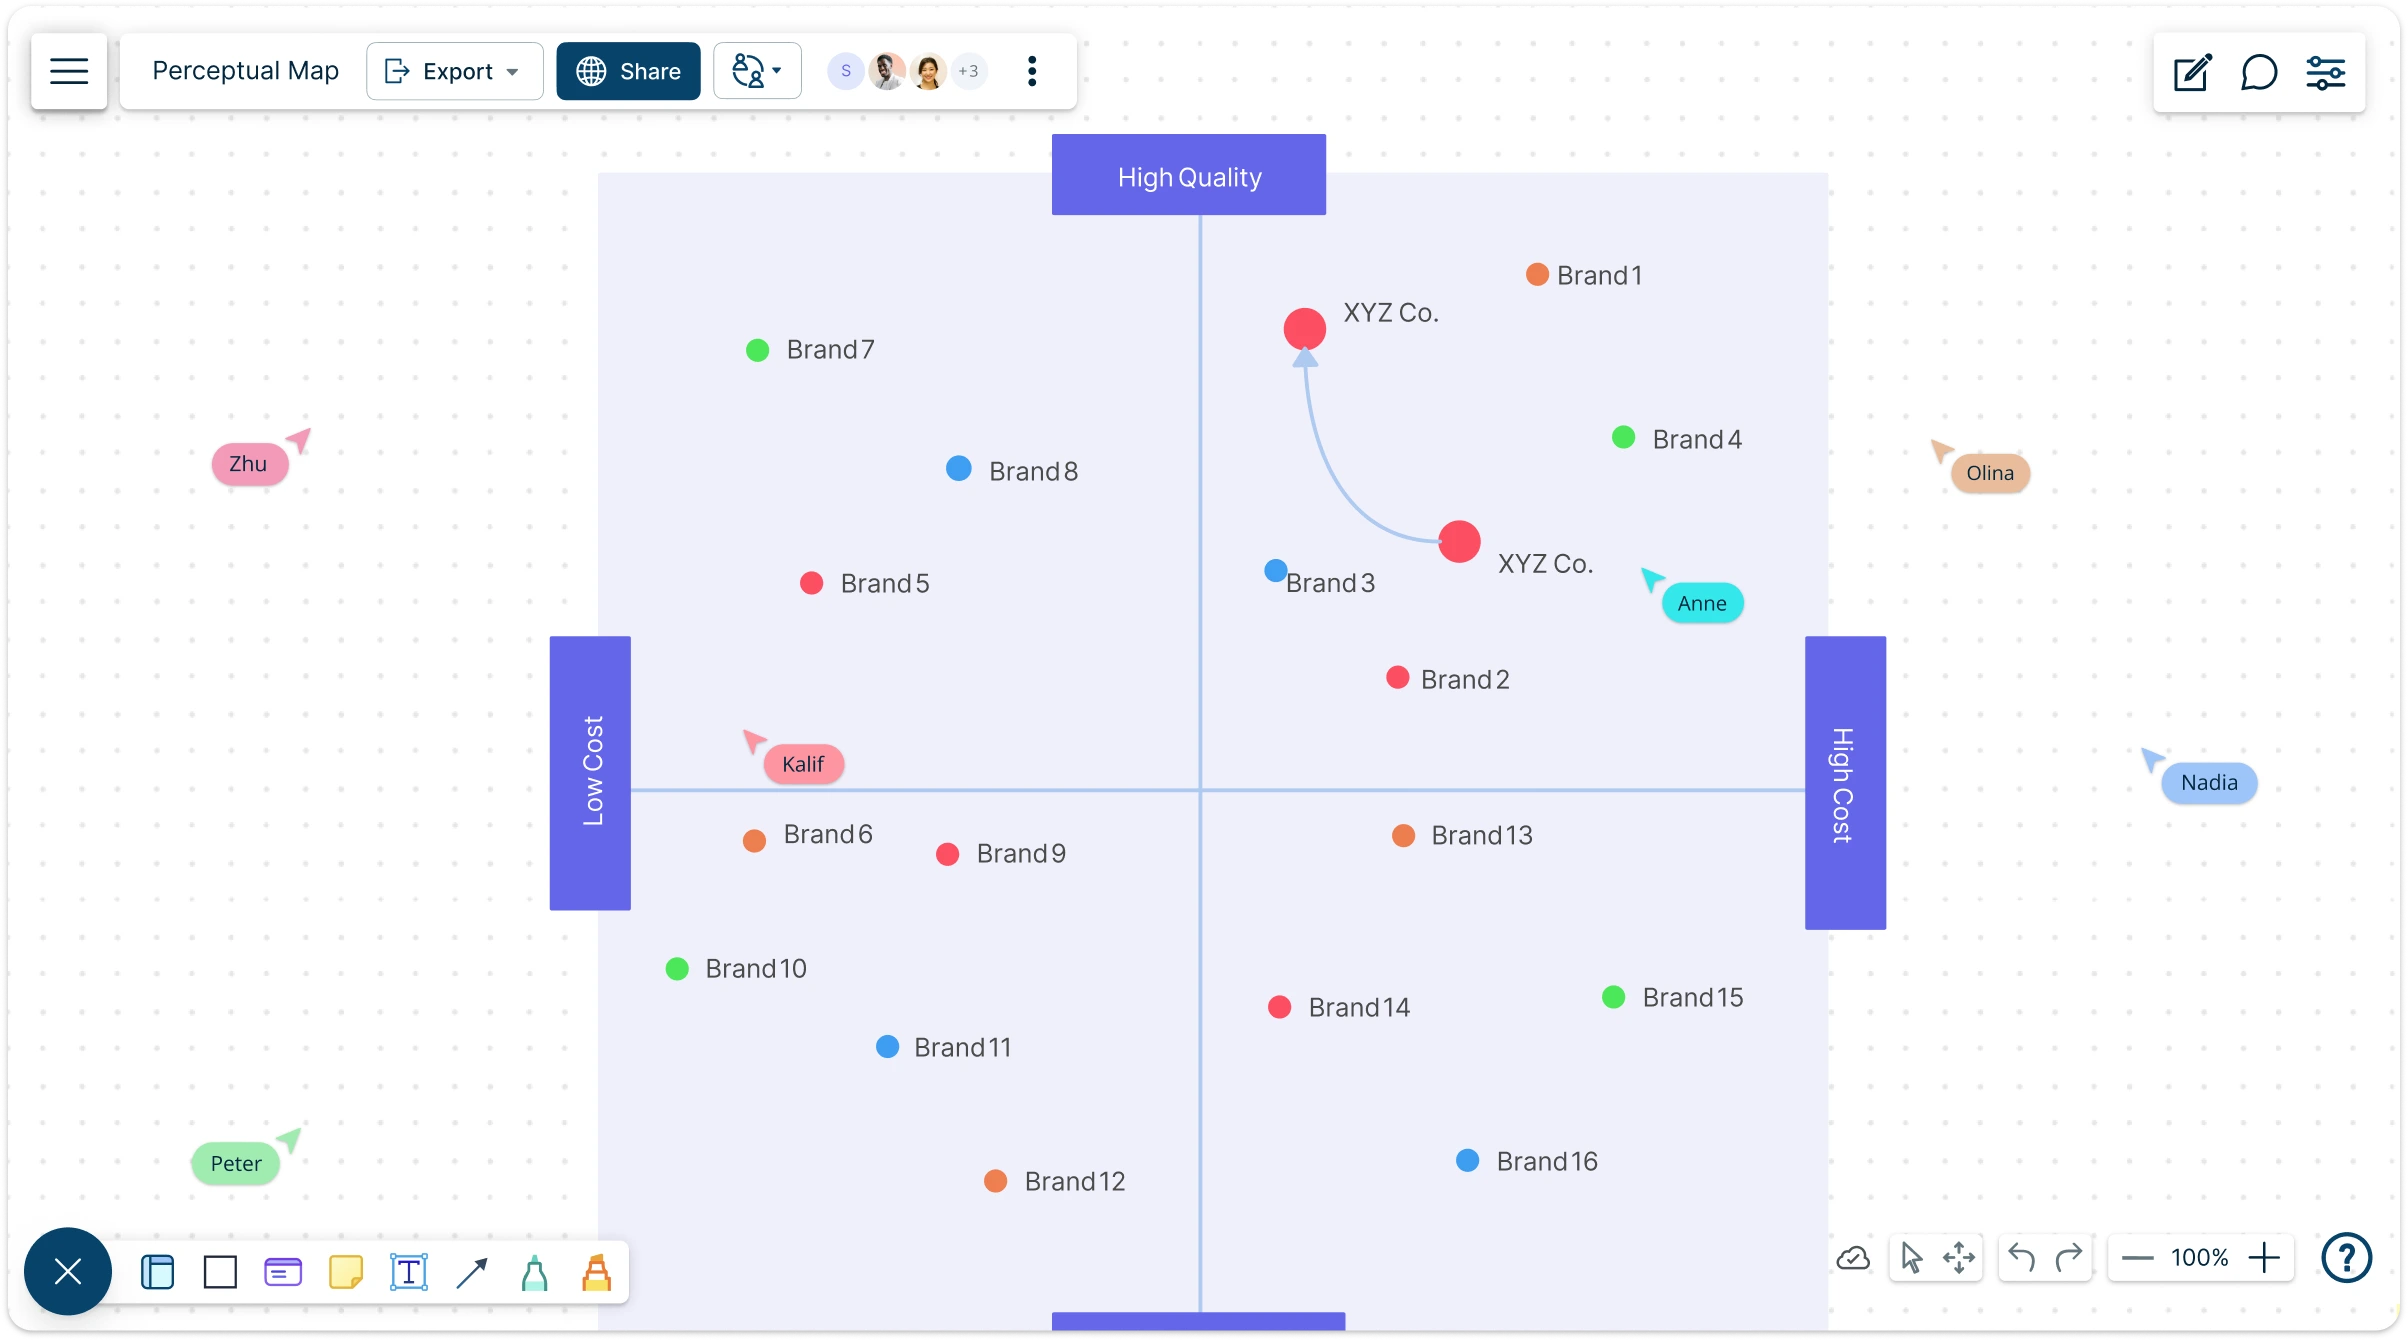
Online perceptual map tool built for marketers, product managers and brand strategists to help understand consumer perceptions and competitor positions at a glance and develop innovative strategies to compete better. Invite colleagues for discussions and brainstorming sessions to bring in multiple perspectives and determine optimal strategies.
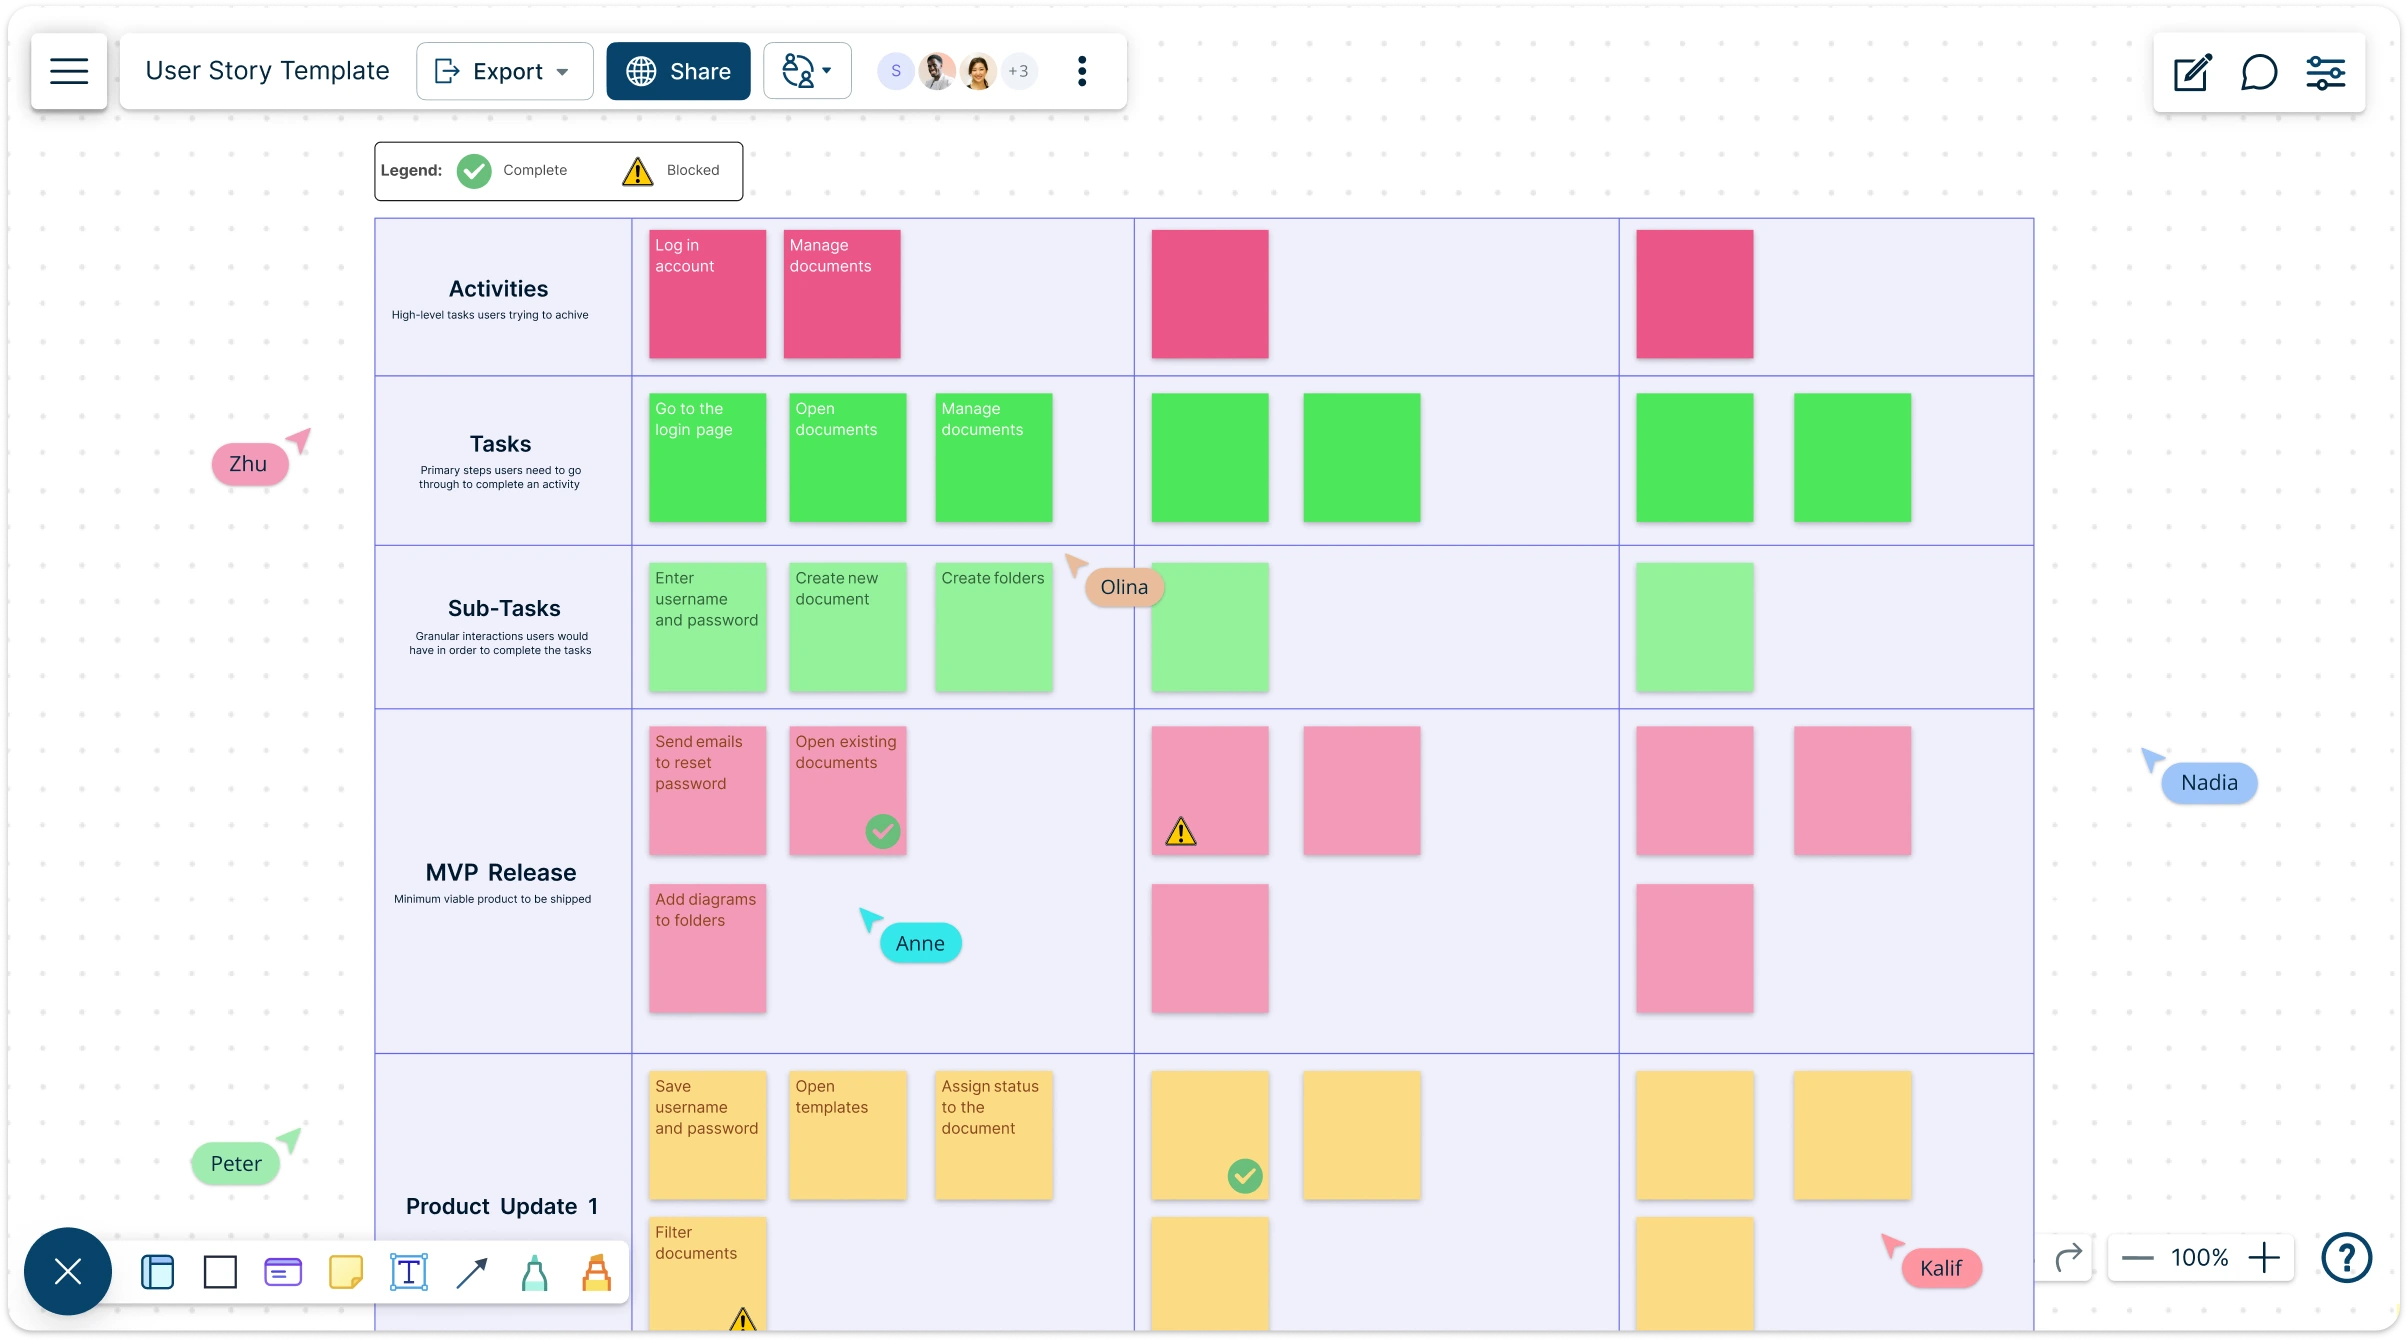
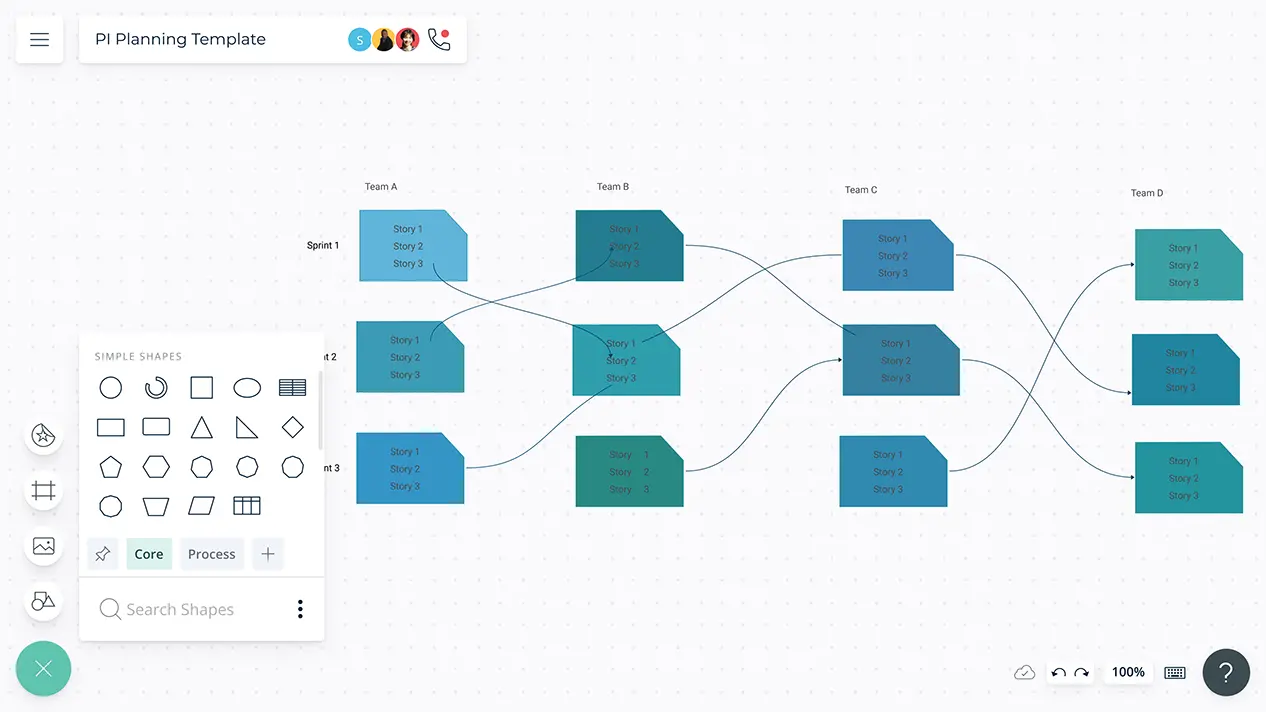
Visualize your user story structure, collaborate seamlessly, and create clear, actionable requirements that guide successful product development.
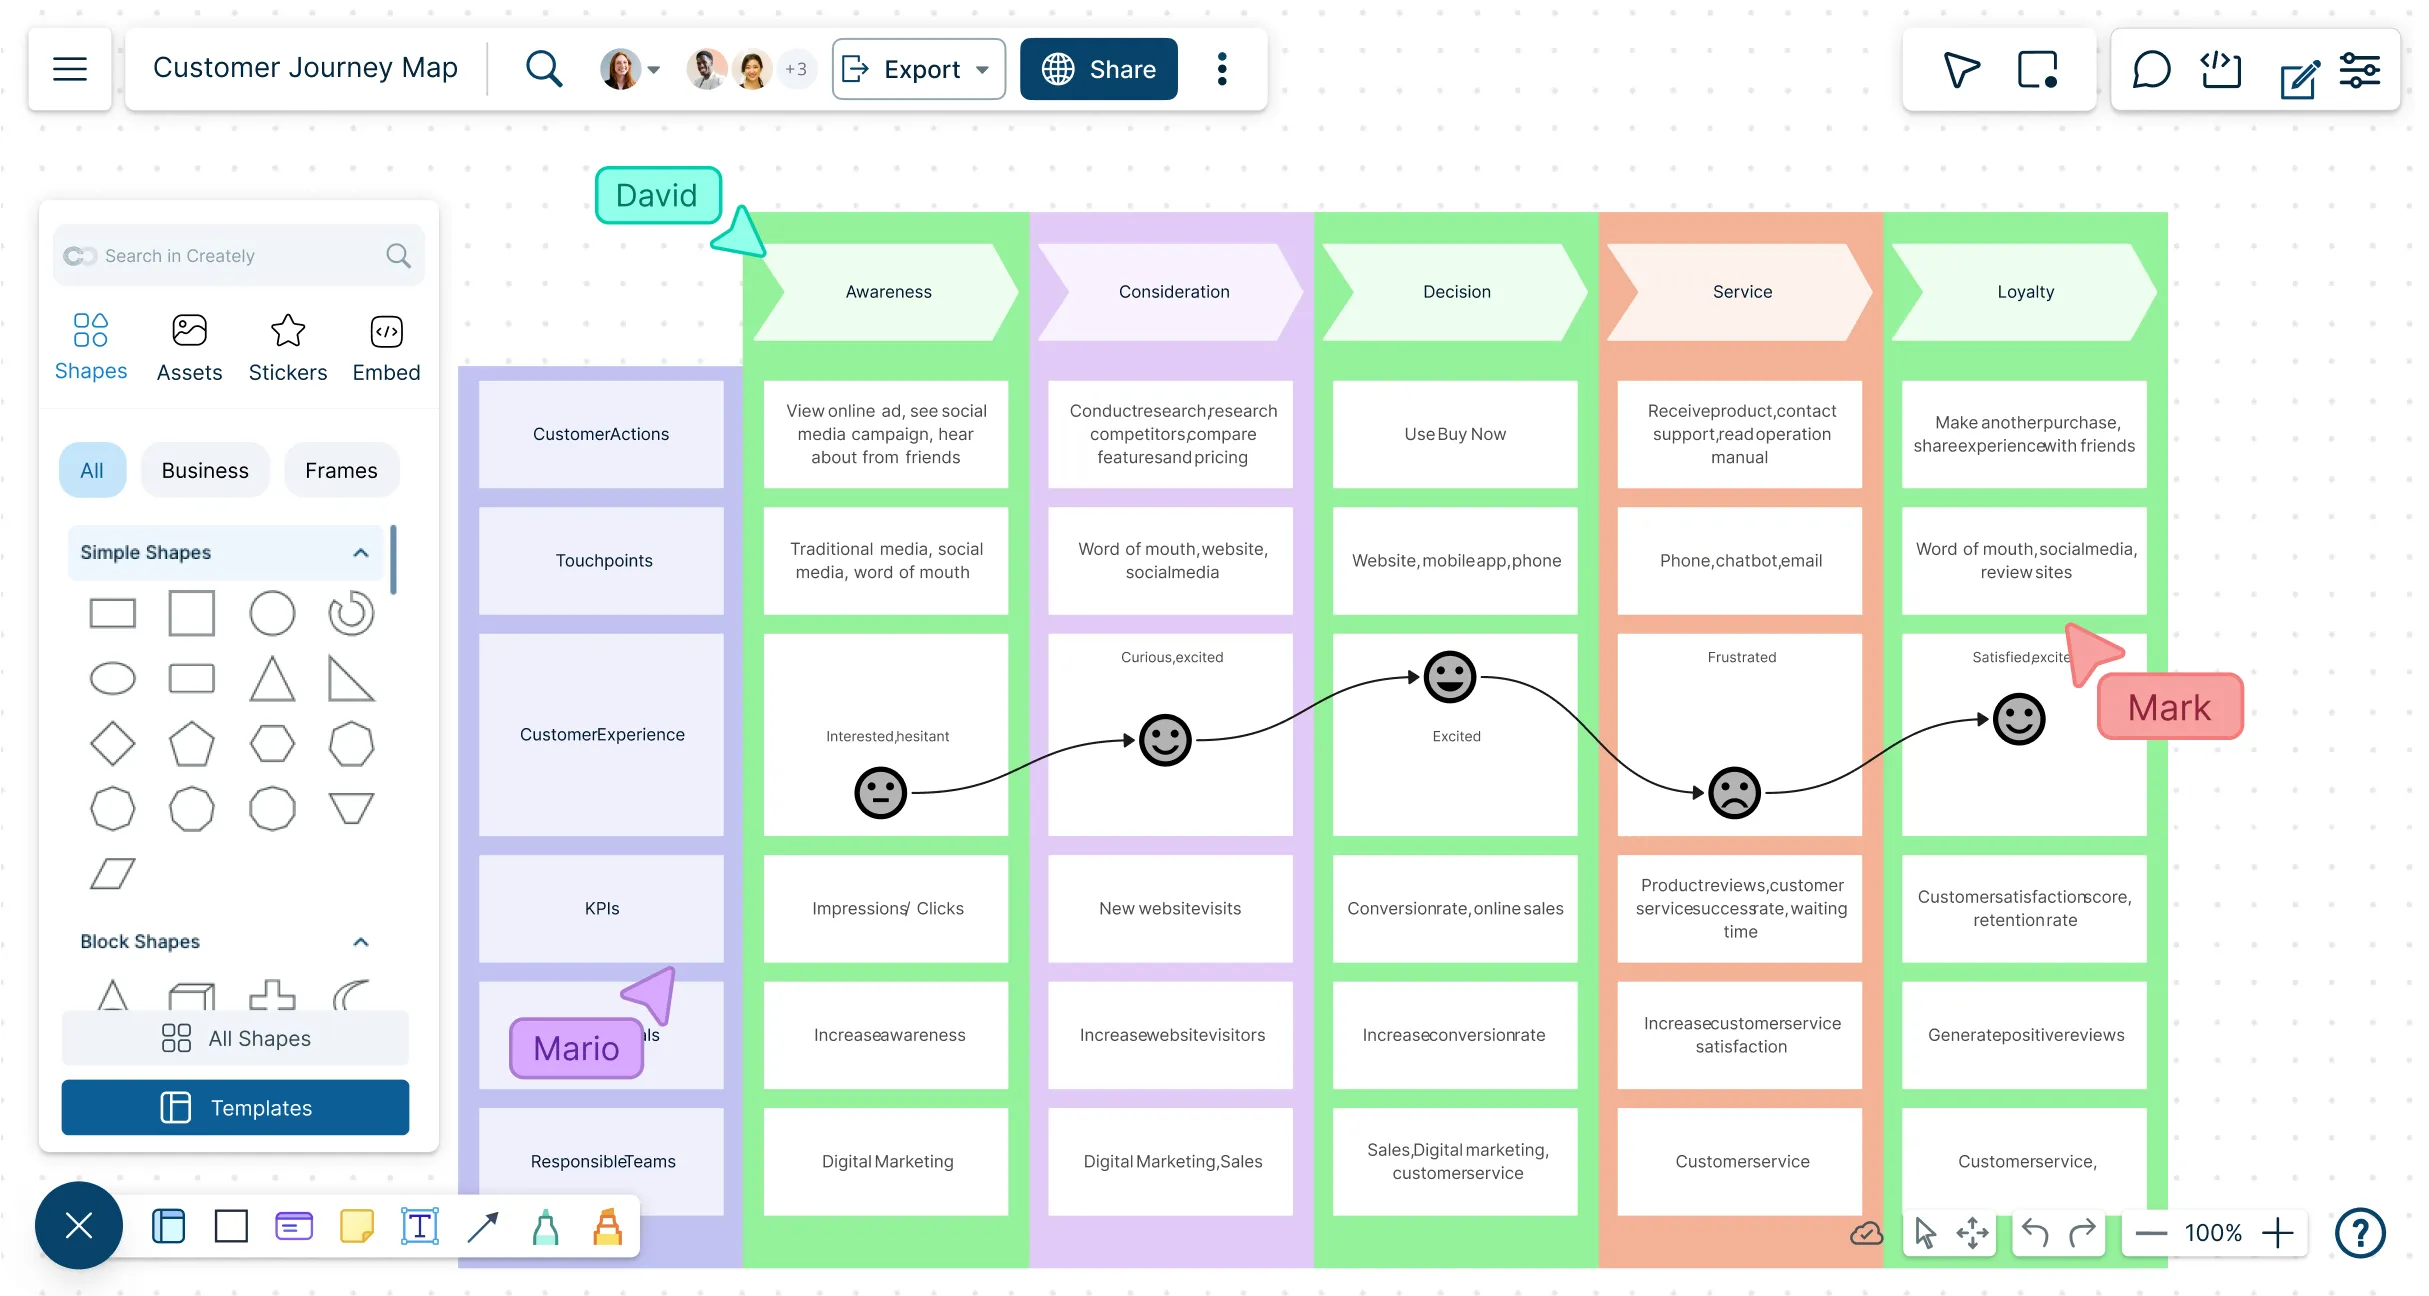
Understand your customers’ interactions, identify pain points, and turn insights into actionable strategies—all with an intuitive, collaborative platform.
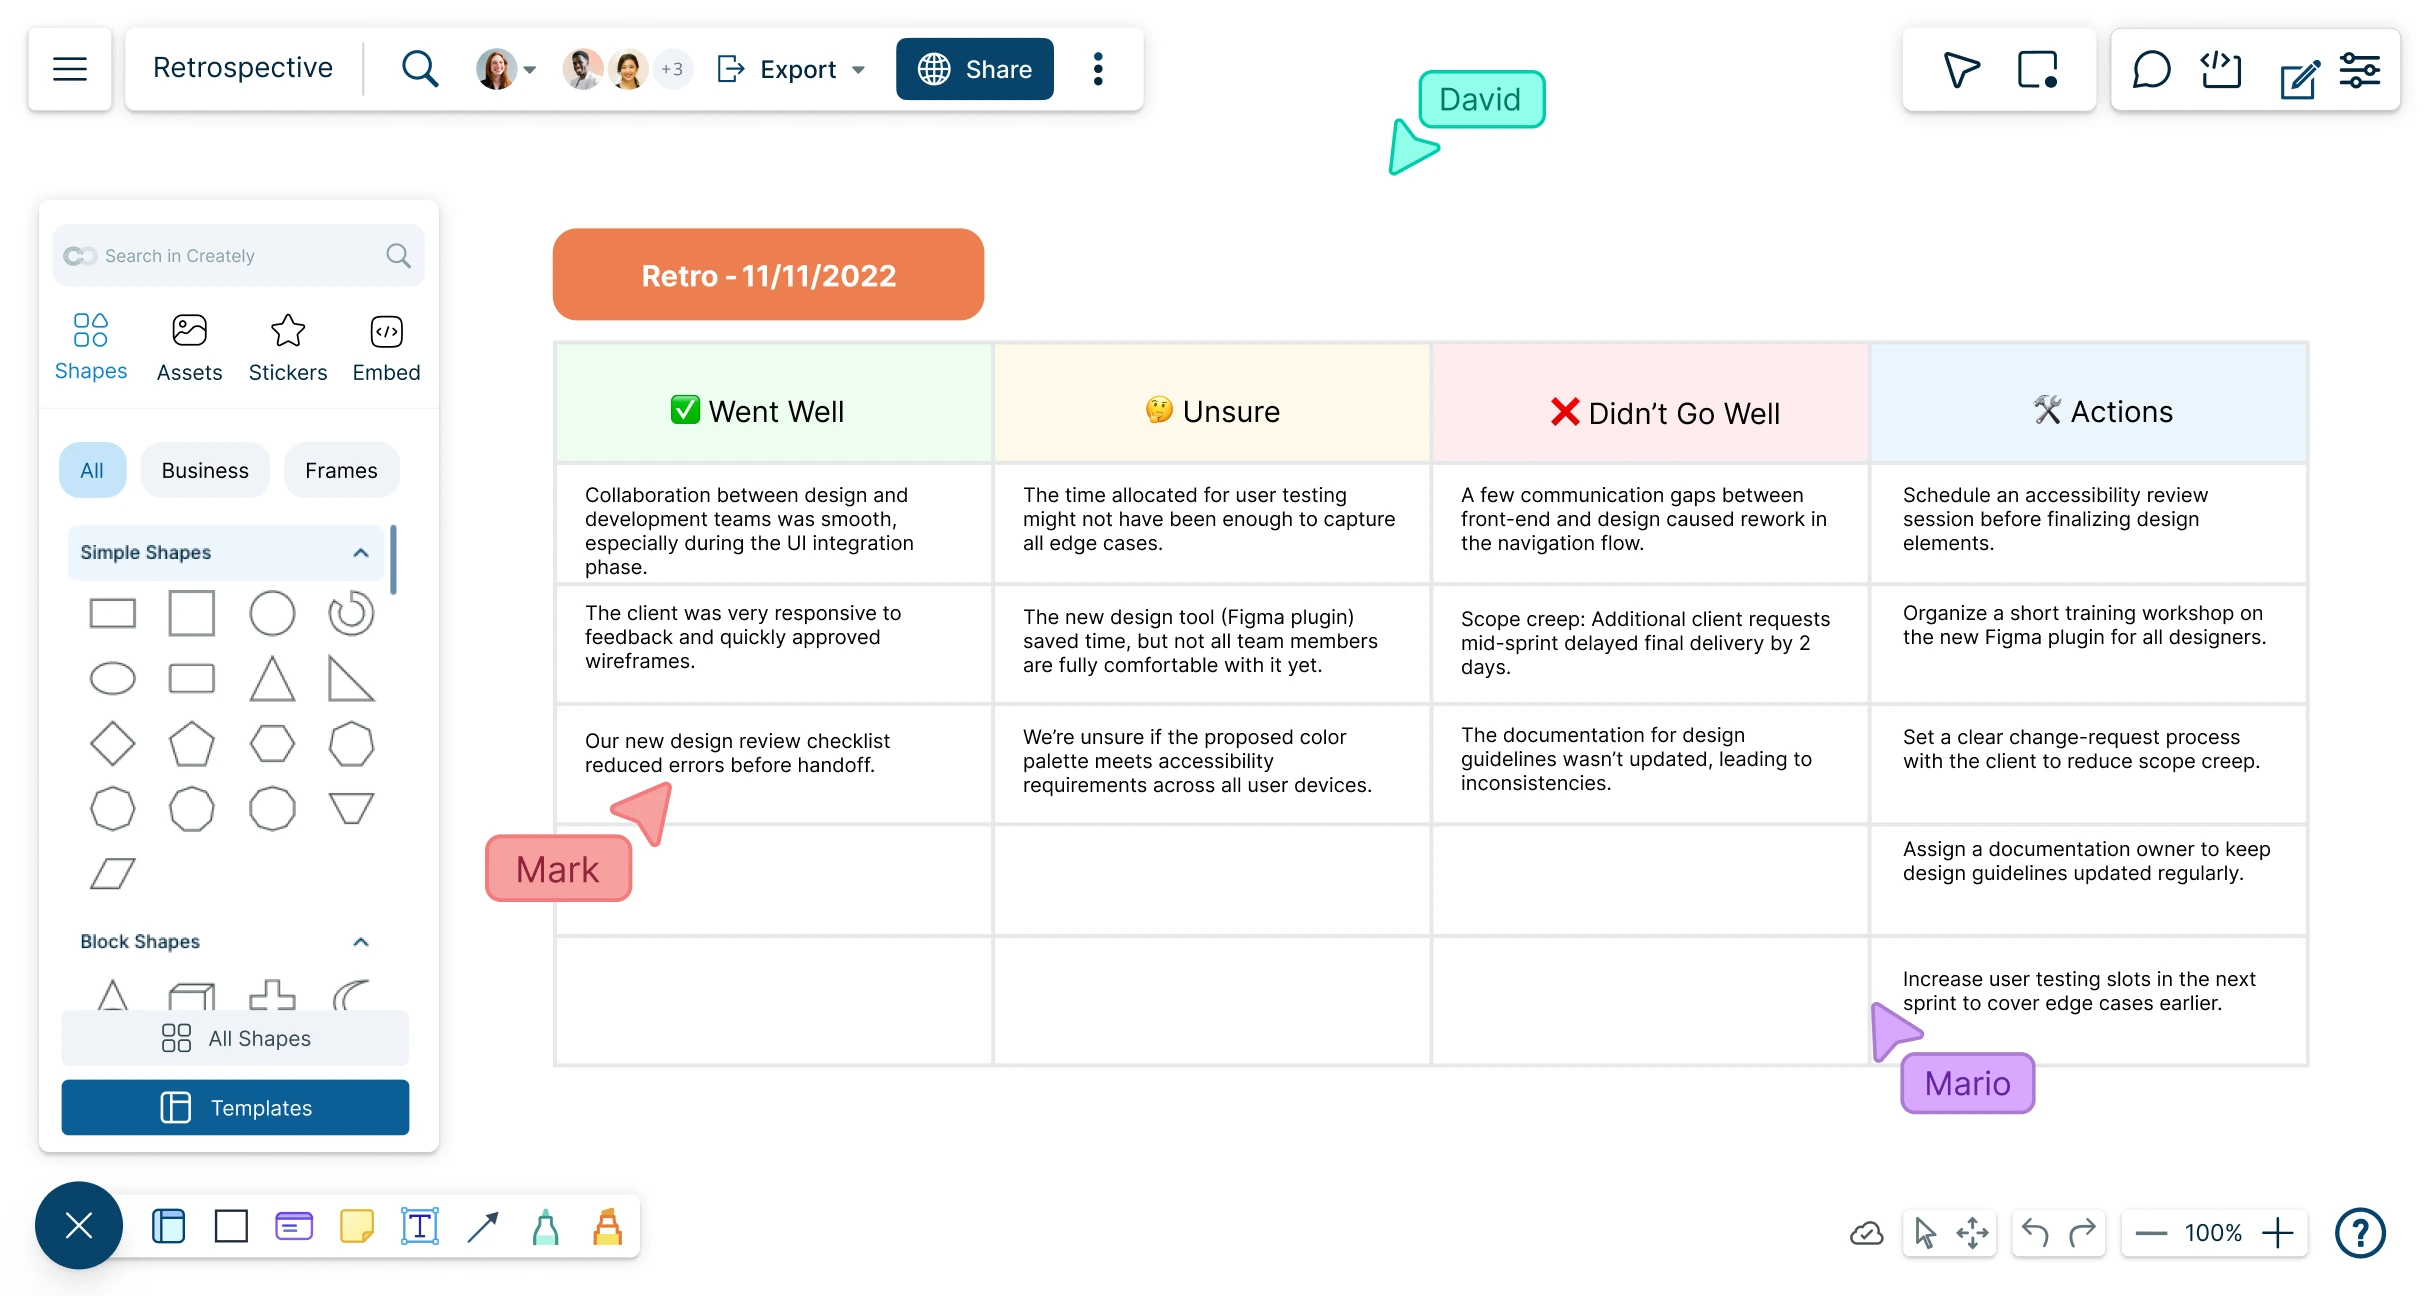
Plan, schedule, and manage collaborative retrospective meetings. Use Creately’s retro software to analyze project progress, uncover blockers, and streamline workflows with customizable retro boards.
Collaboratively map processes and workflows with Creately’s flowchart software for Mac, delivering a smooth, optimized experience on Safari, Chrome, and other macOS browsers.
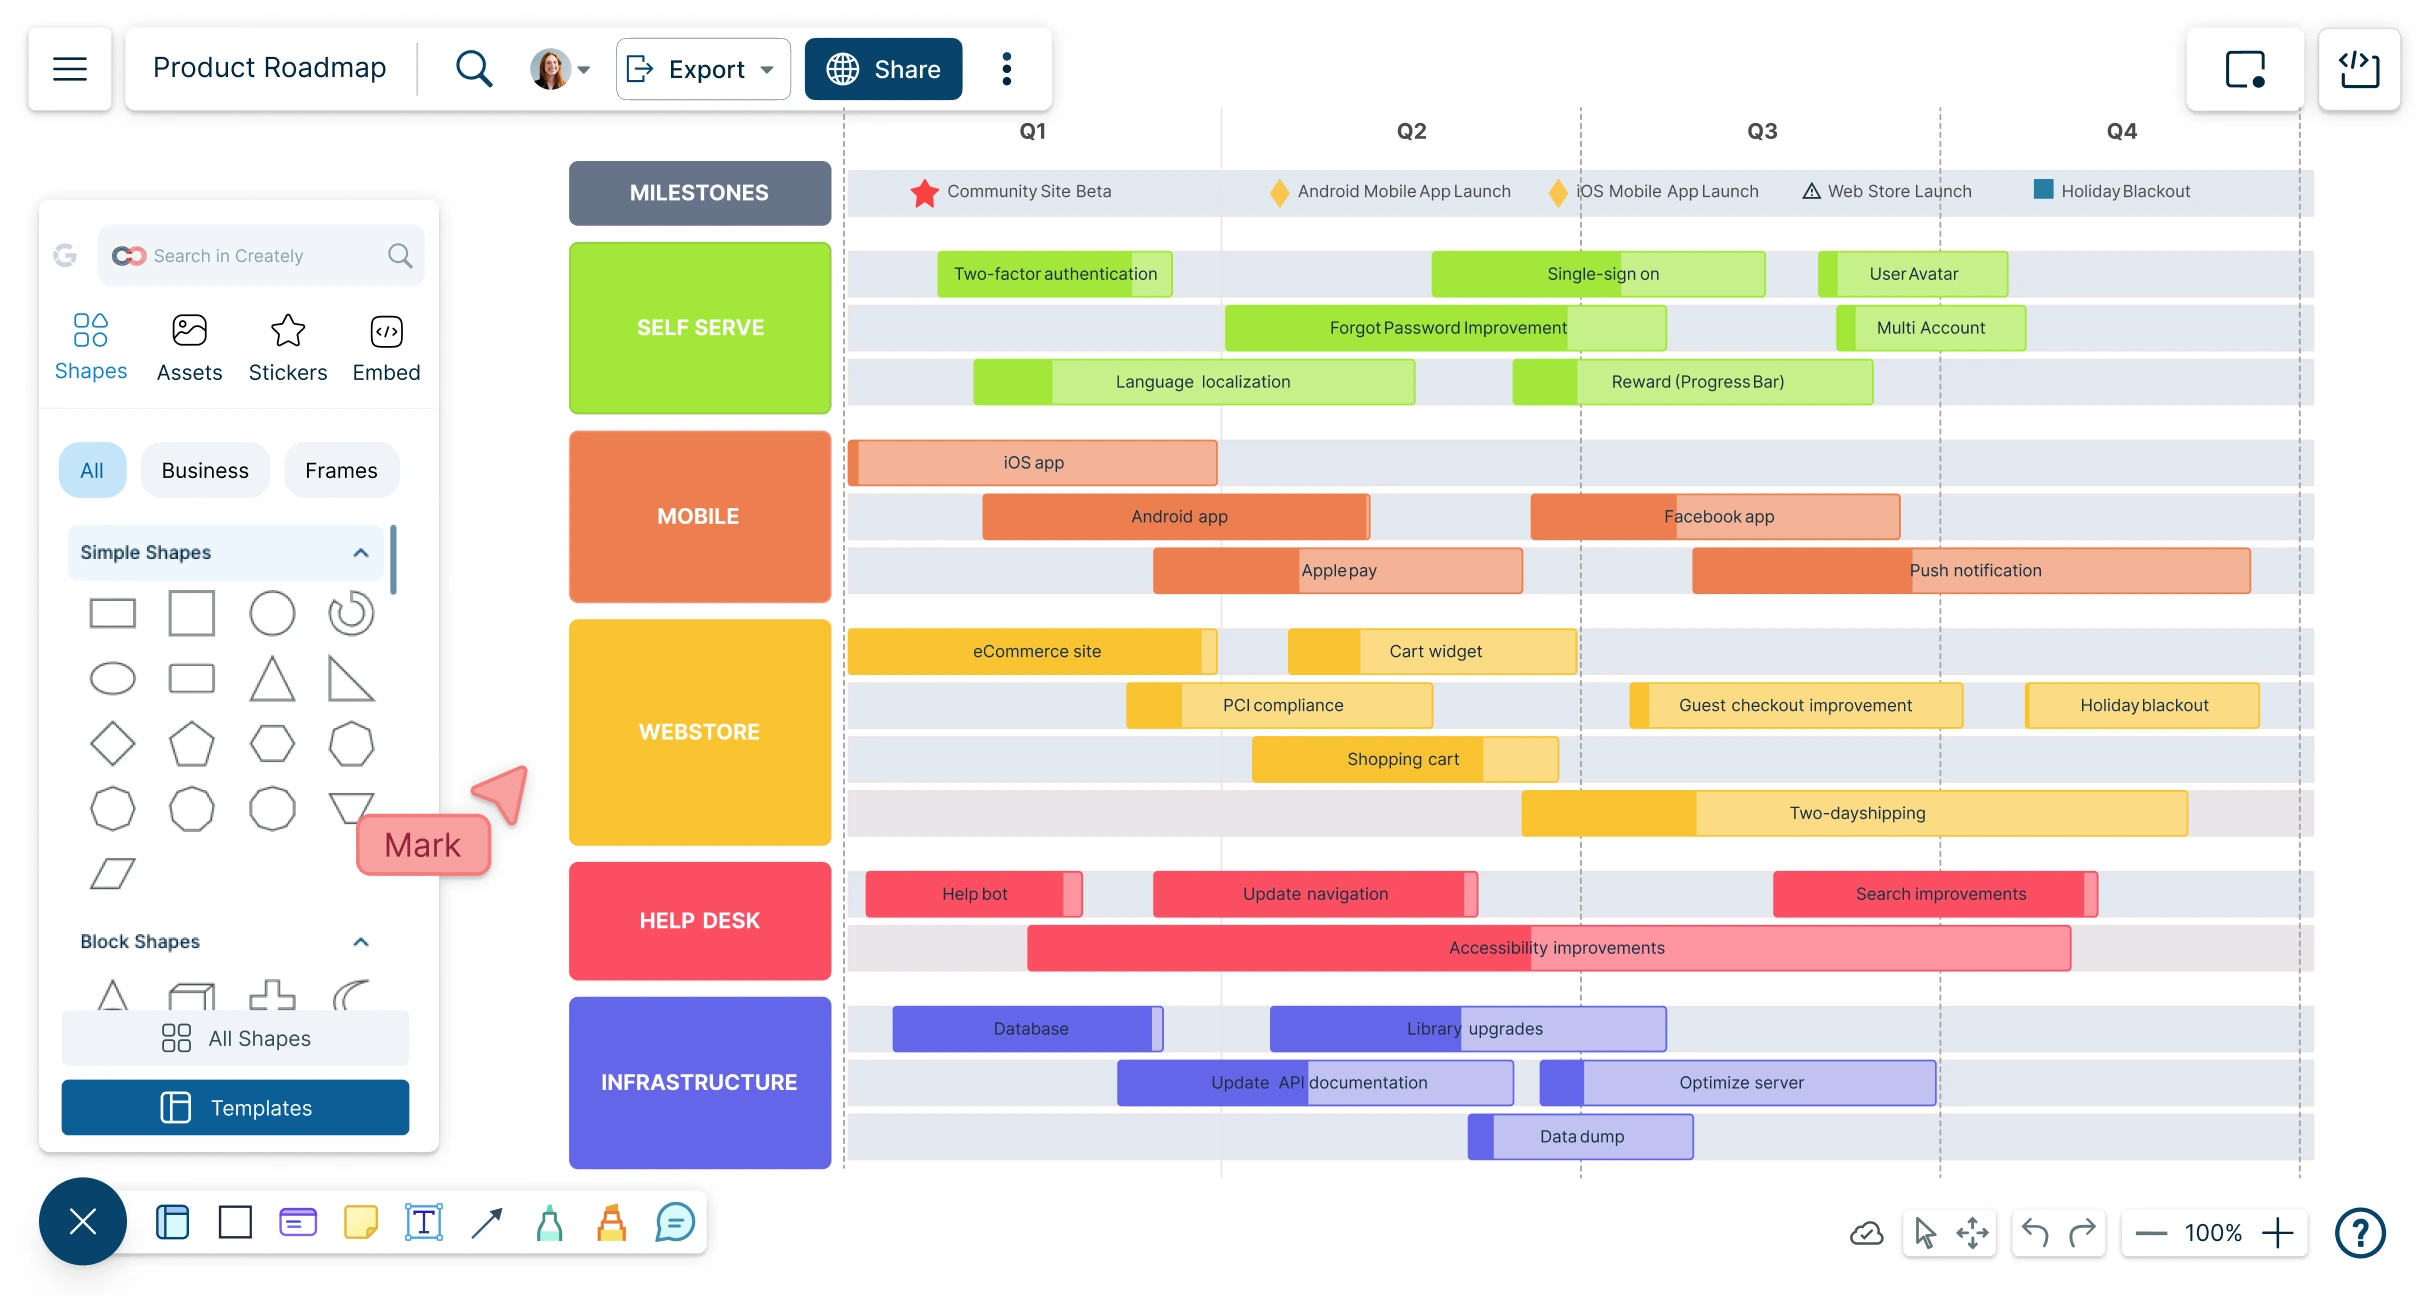
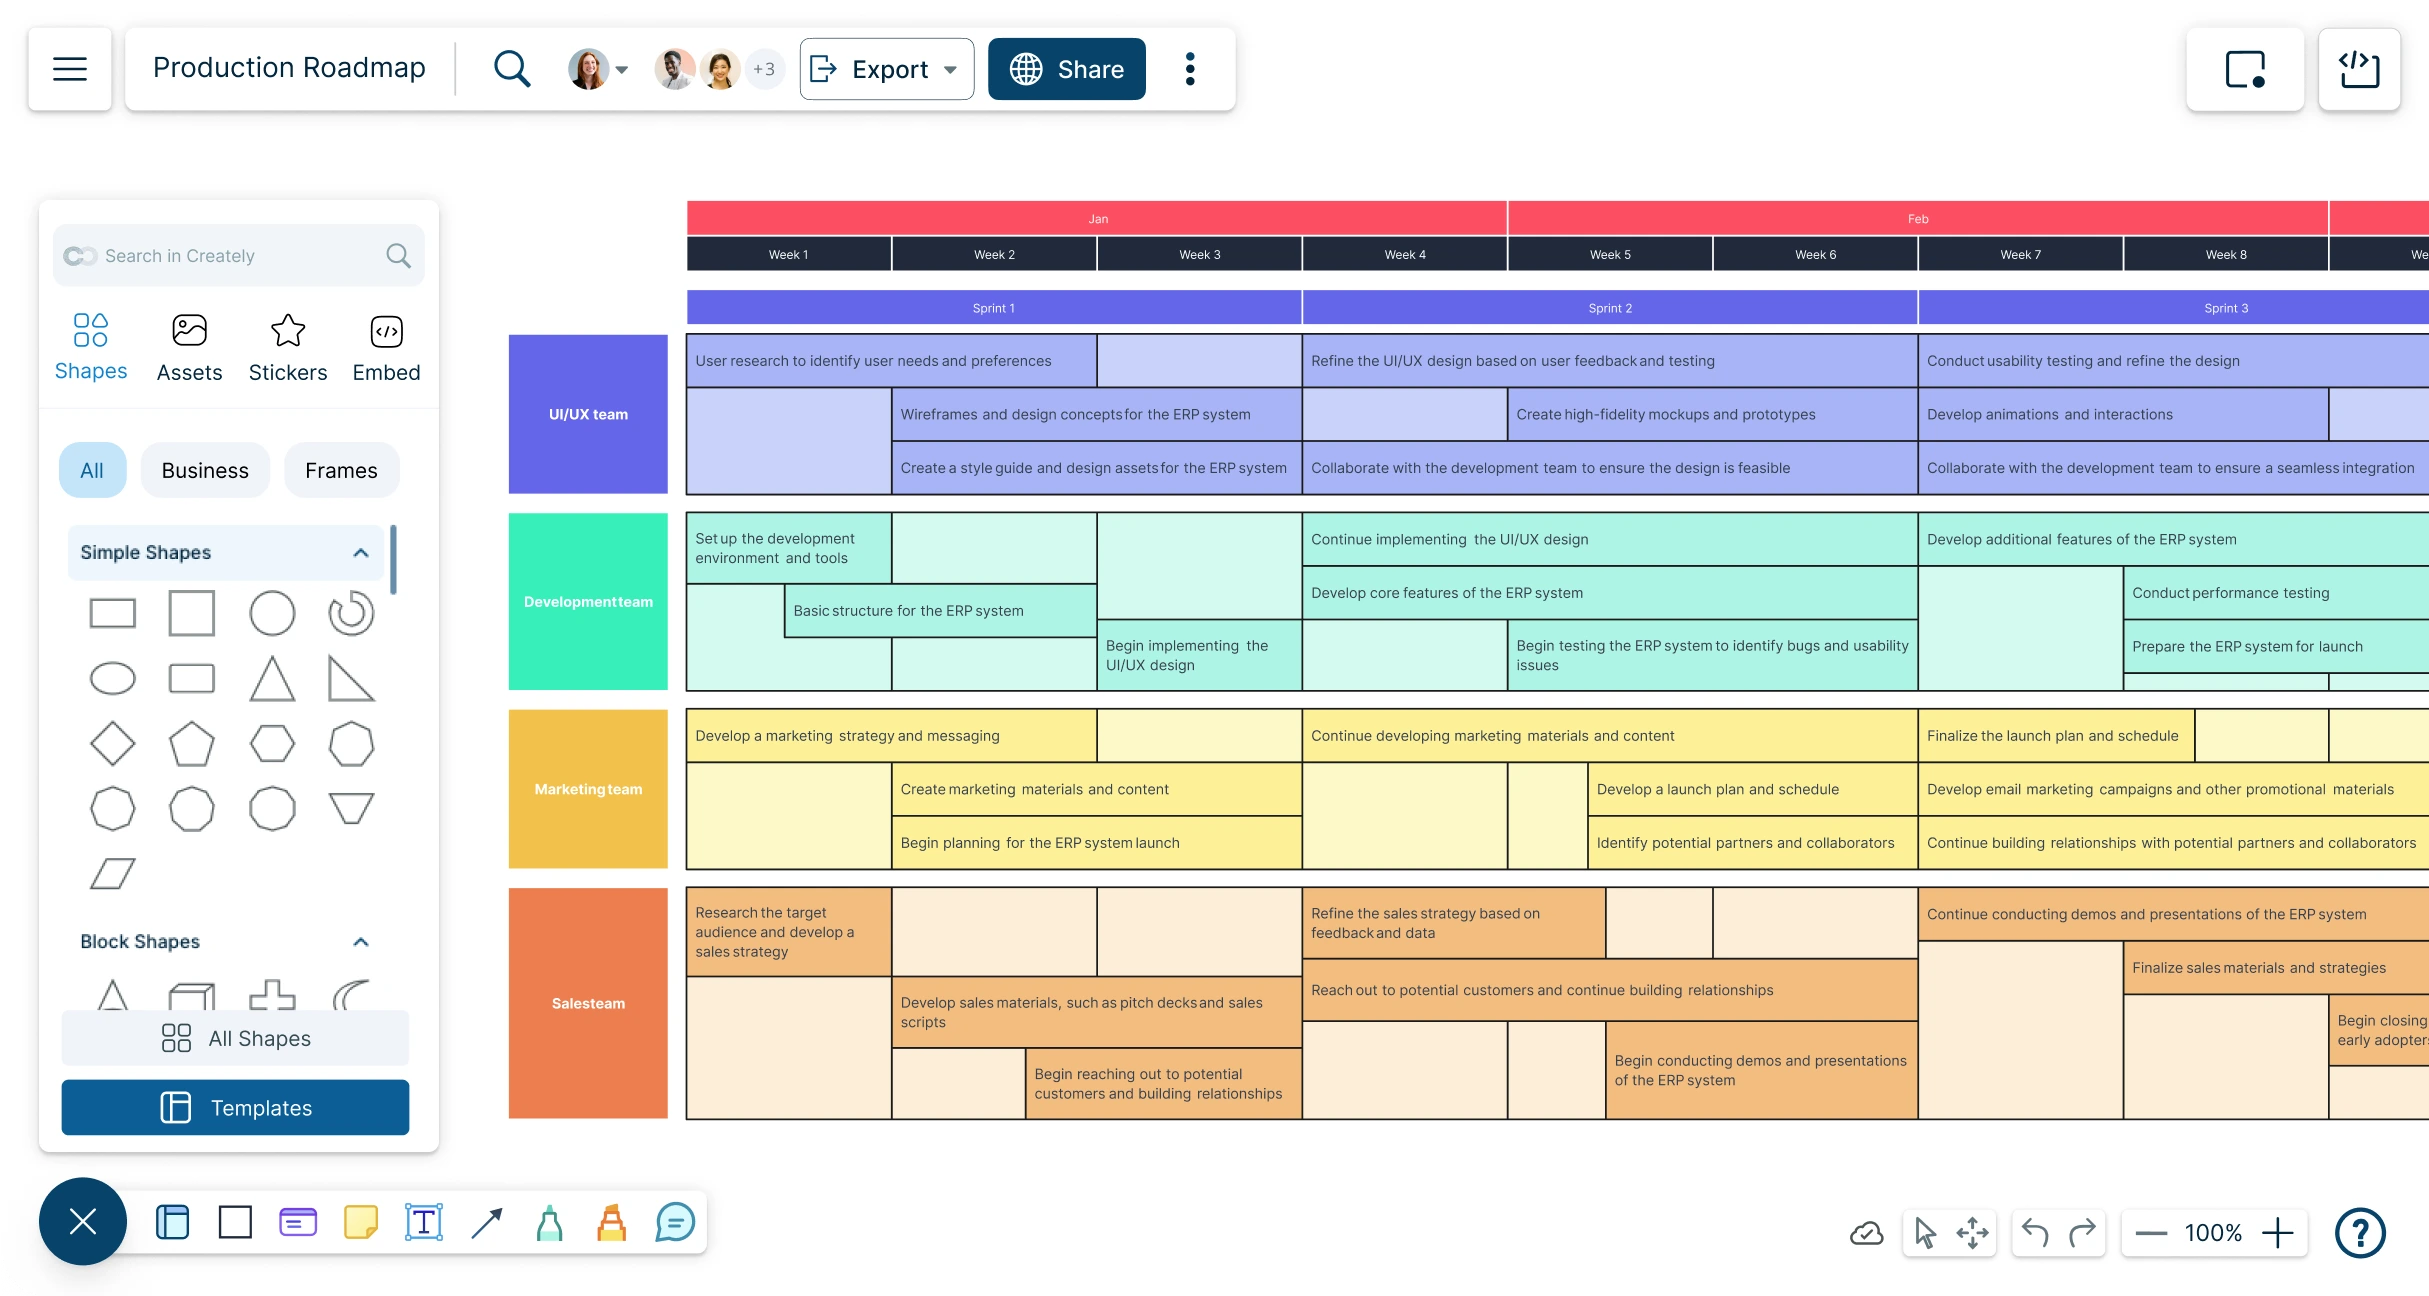
Align team efforts from product ideation to launch, synchronize efforts and communicate vision and progress with Creately’s product roadmap software.
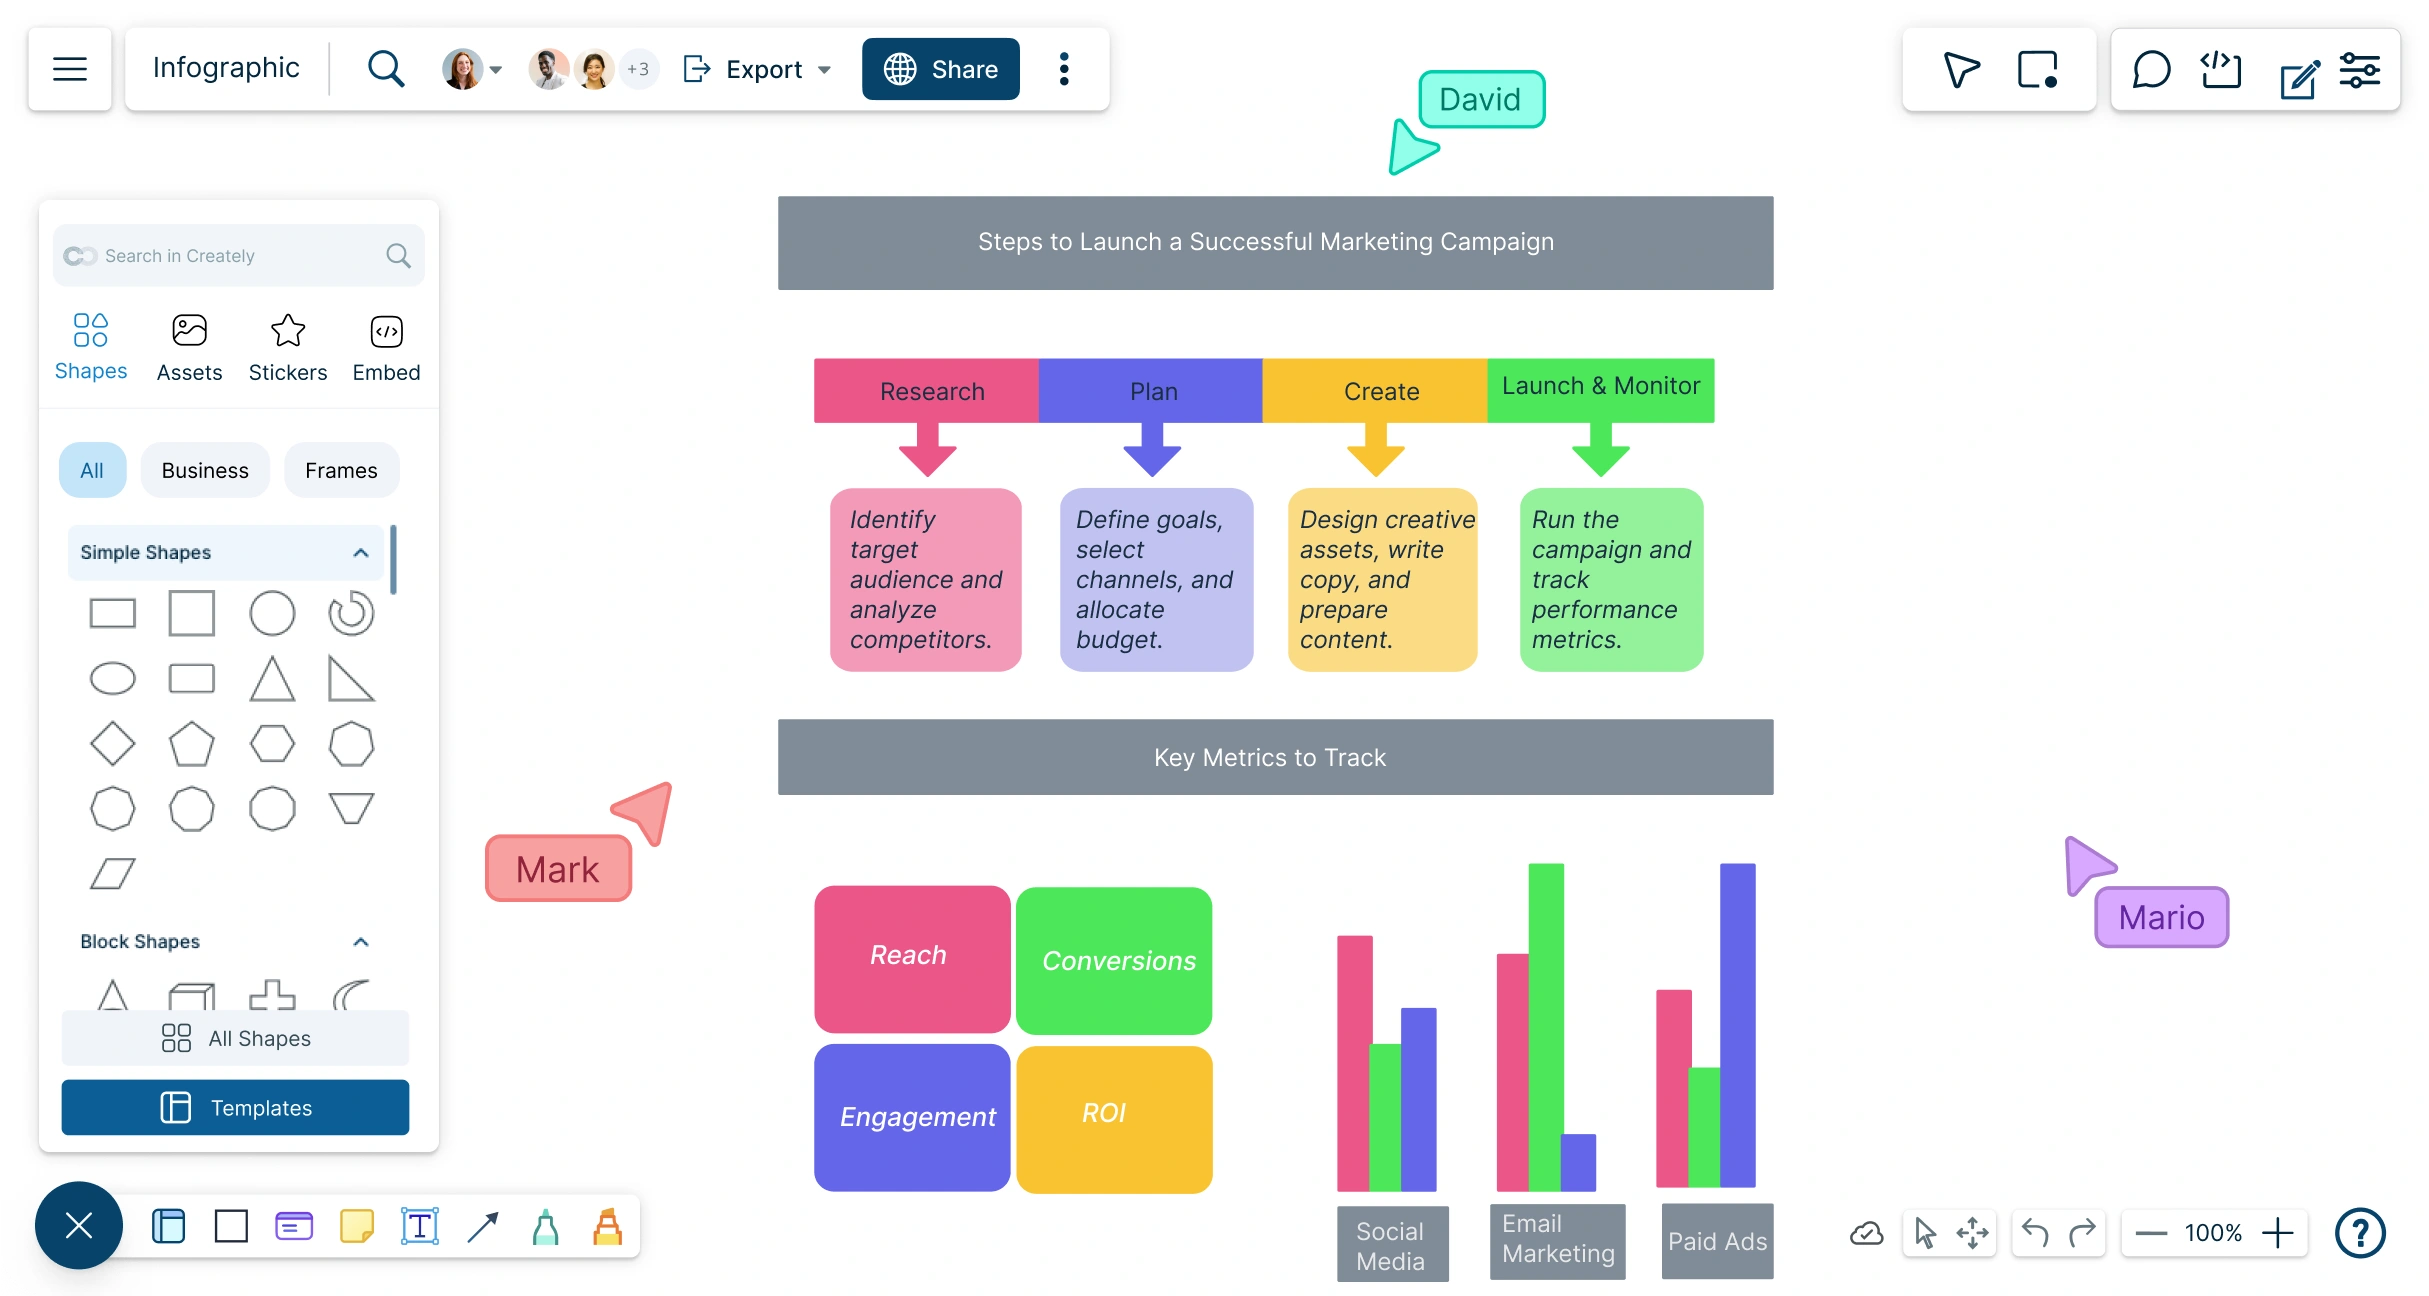
Generate interactive infographics with Creately’s easy-to-use infographic creator. Customize templates, collaborate with your team, and illustrate complex data or information.
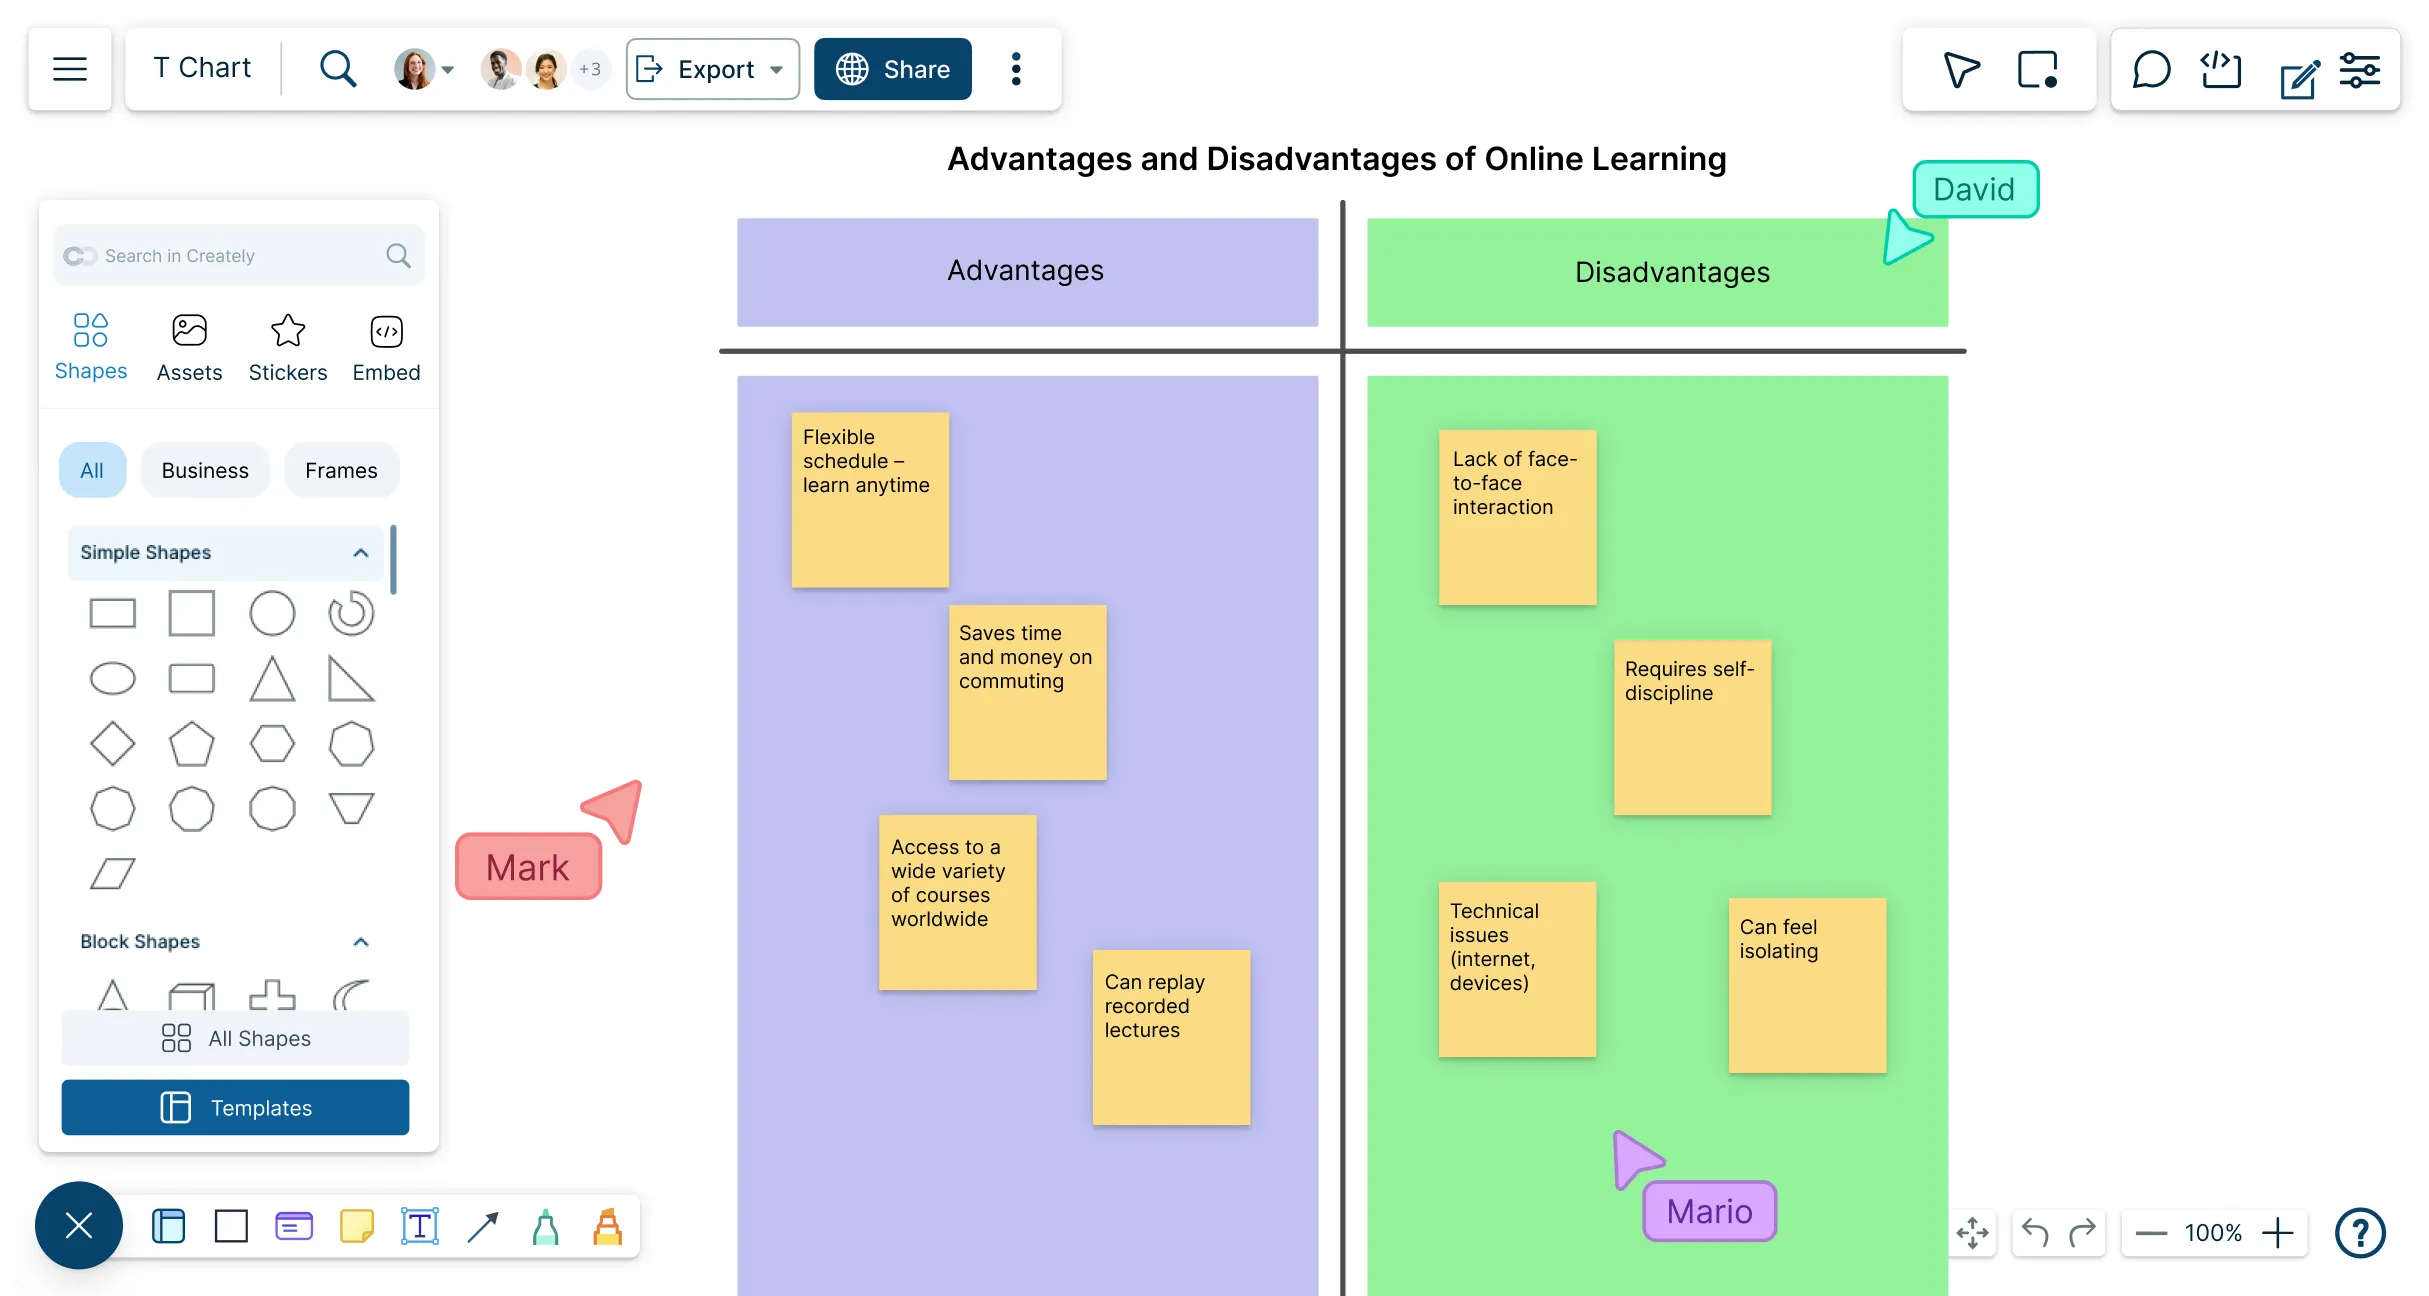
Compare and contrast opposing views, including facts vs. opinions, advantages vs. disadvantages or strengths vs. weaknesses, with our free intuitive T chart creator.
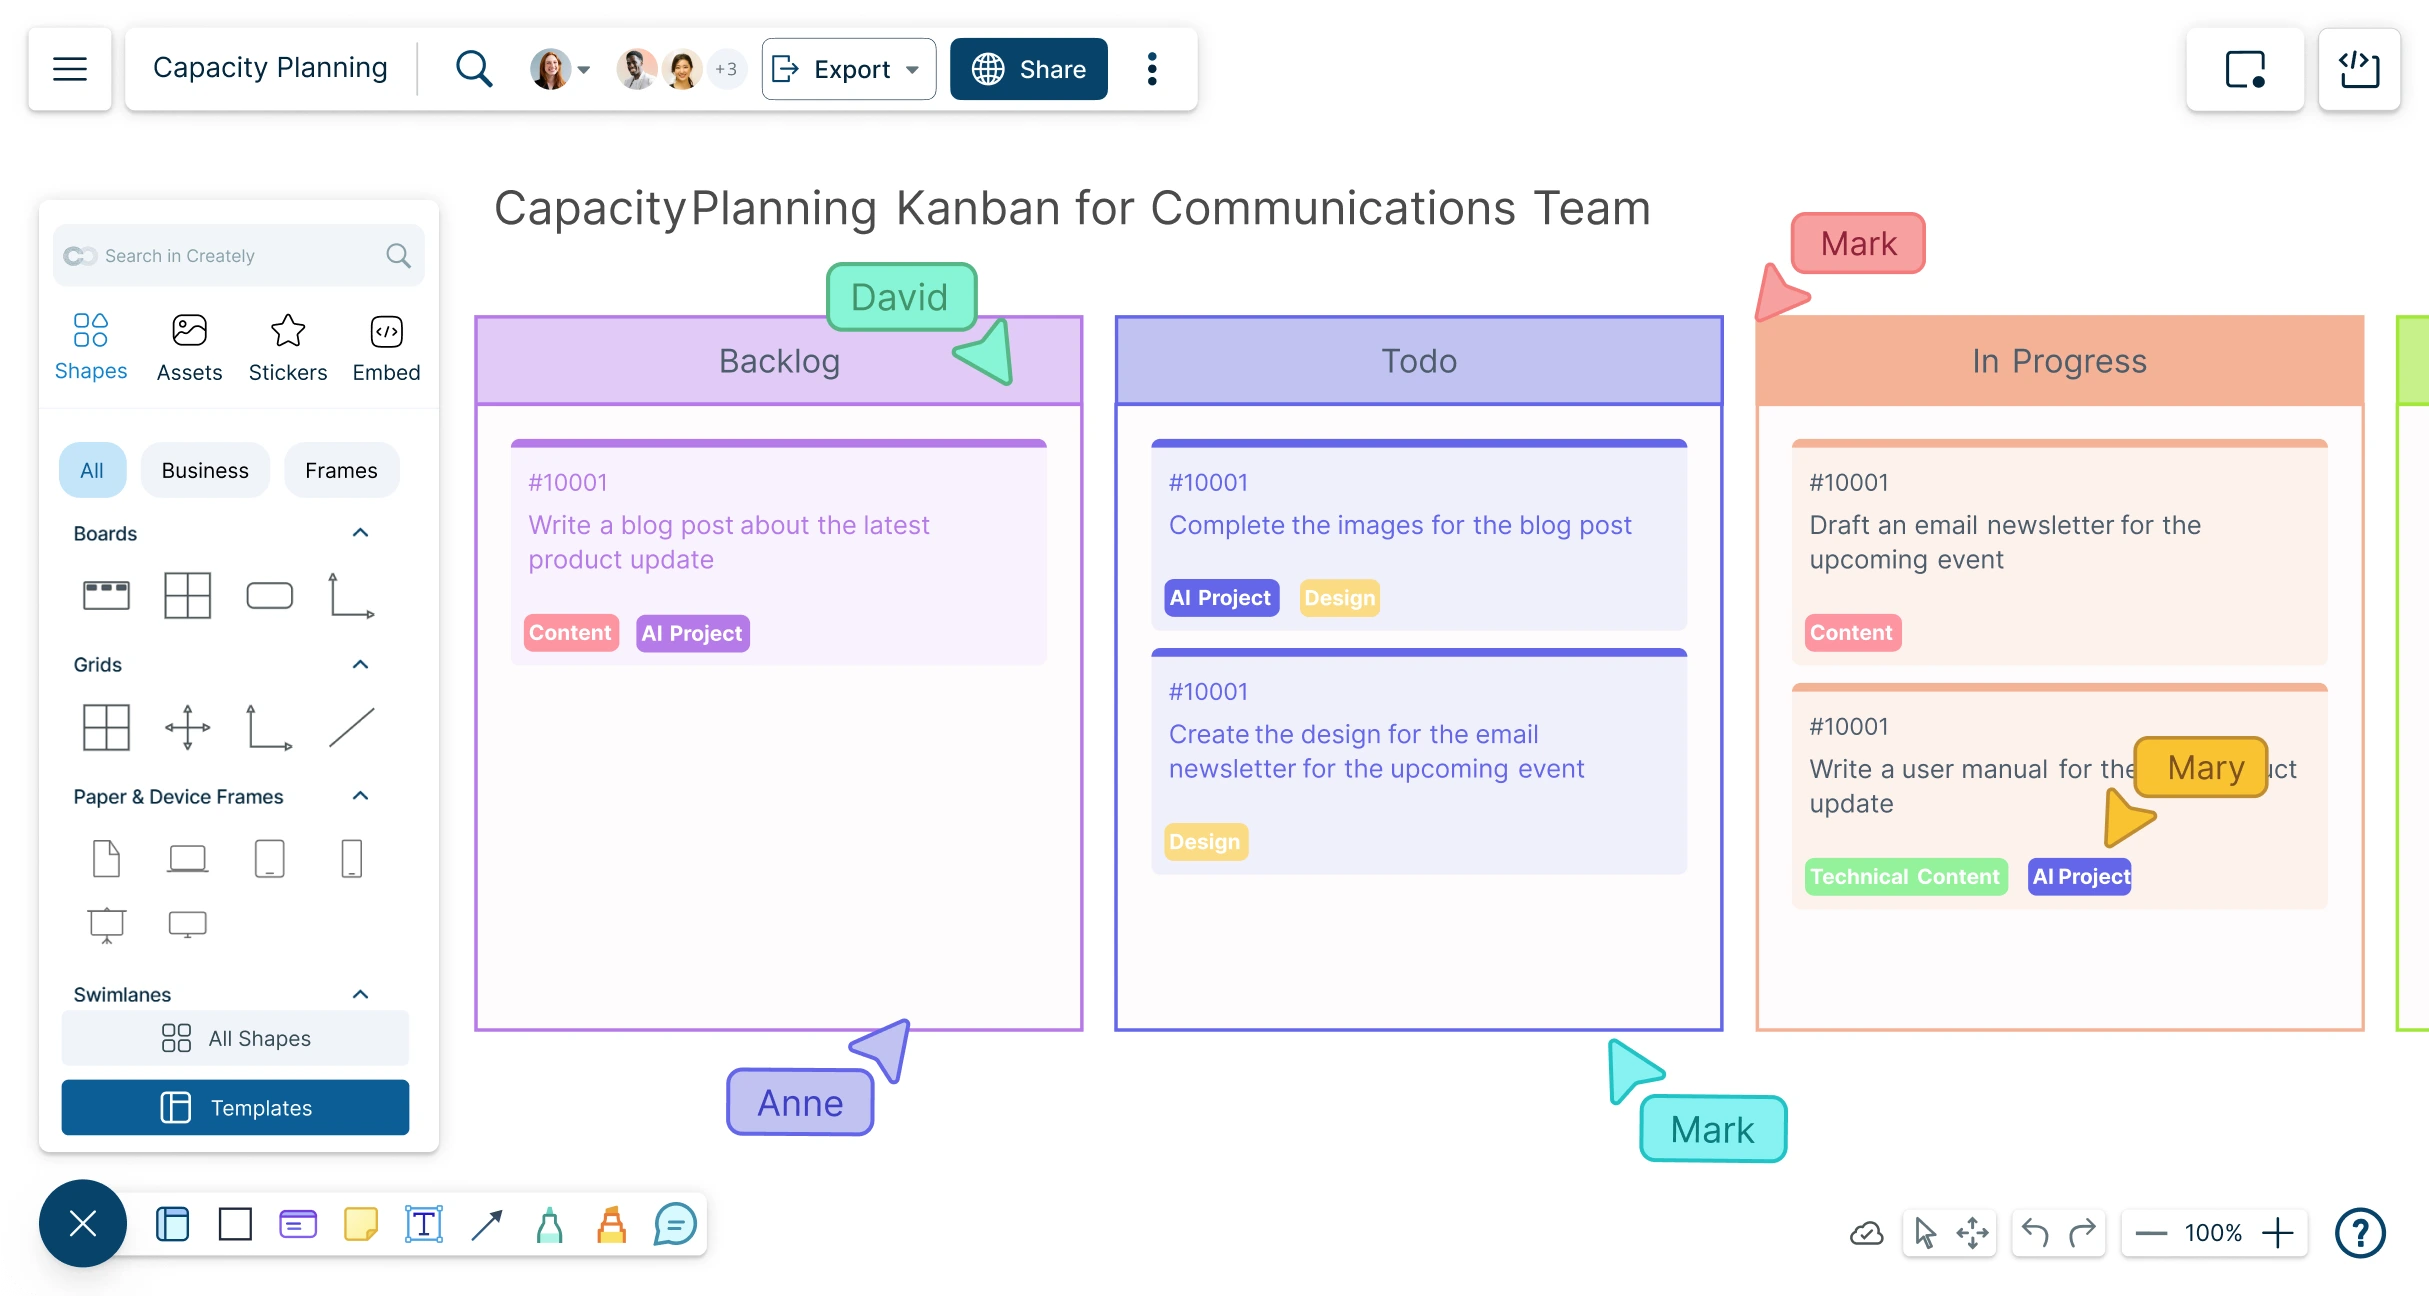
An online Kanban board to streamline projects, track task progress, and collaborate in real-time. Plan, prioritize, and get work done, visually and efficiently.
Make clear, goal-driven roadmaps that align vision, enhance communication, and improve execution for your business with Creately’s Roadmap Maker.
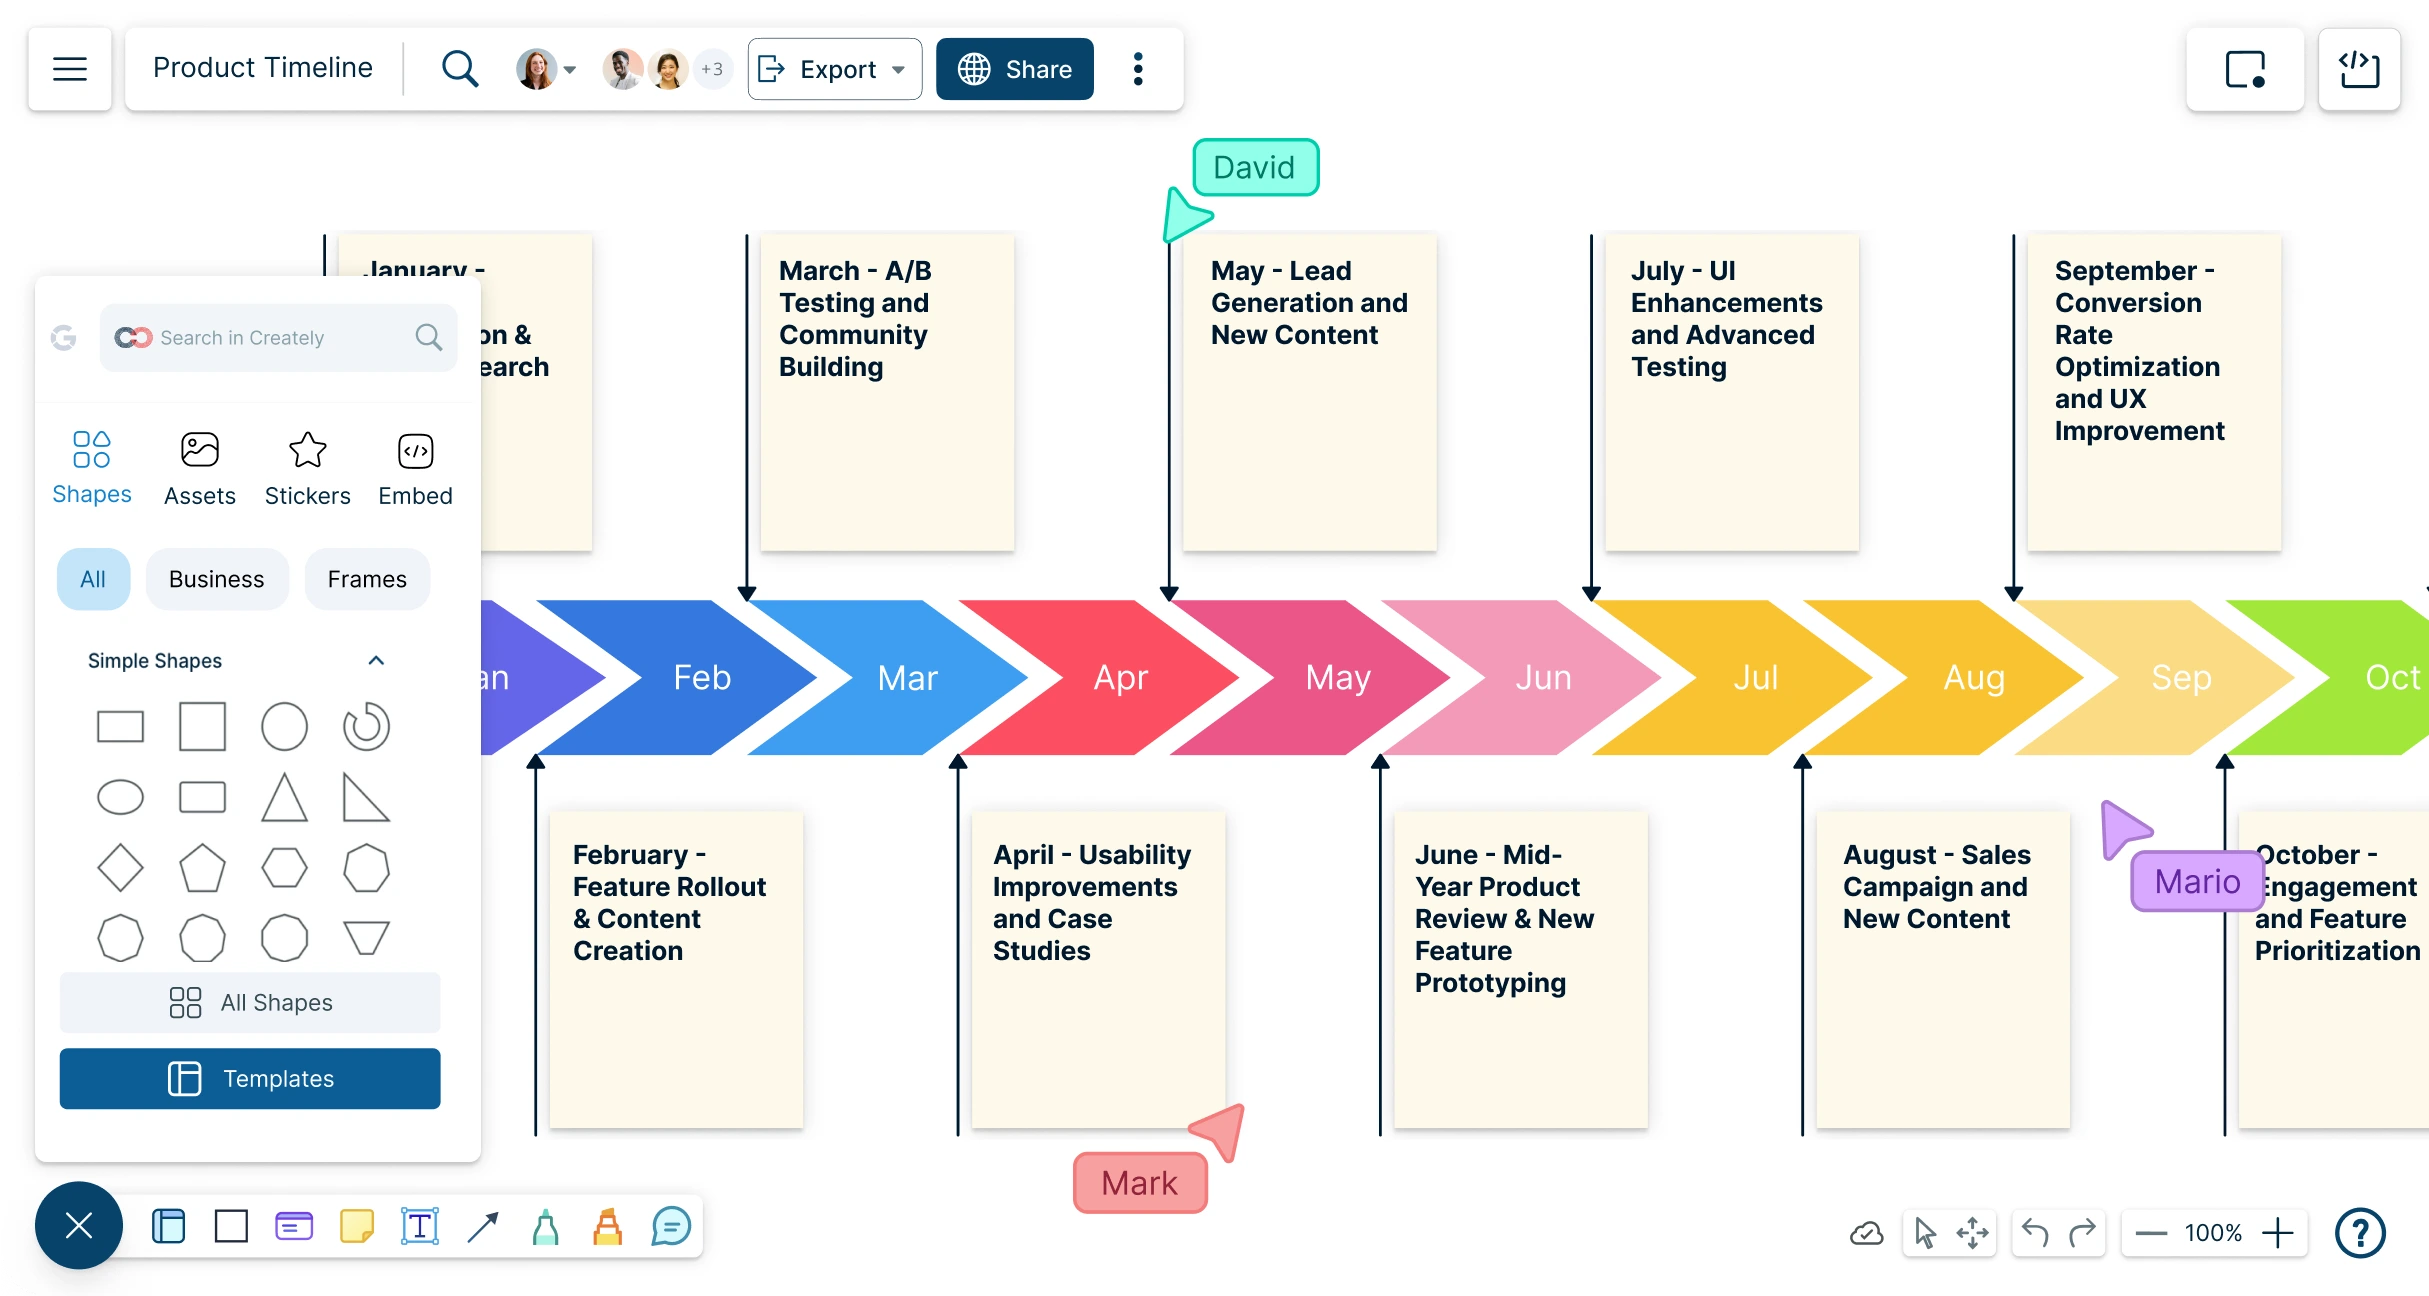
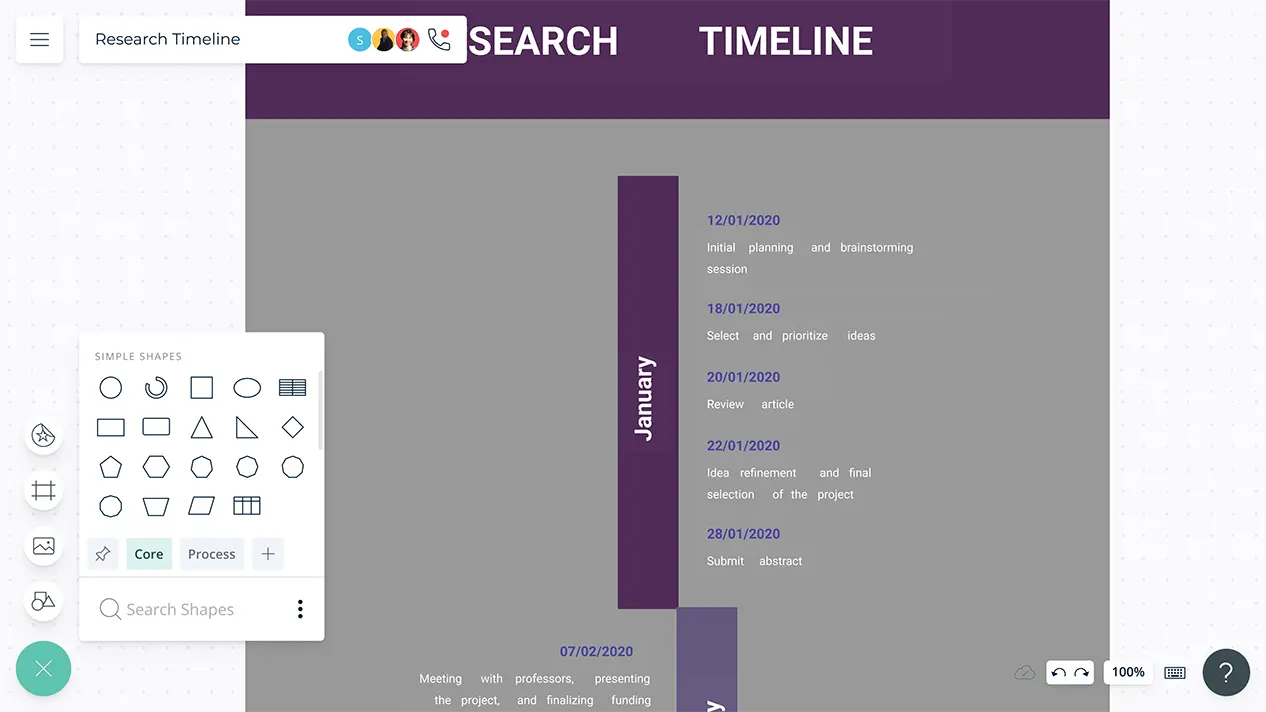
Create project, history, event, research, or campaign timelines without scattered notes or messy slides. Map dates, milestones, tasks, and context in one visual workspace you can edit, review, present, and share.
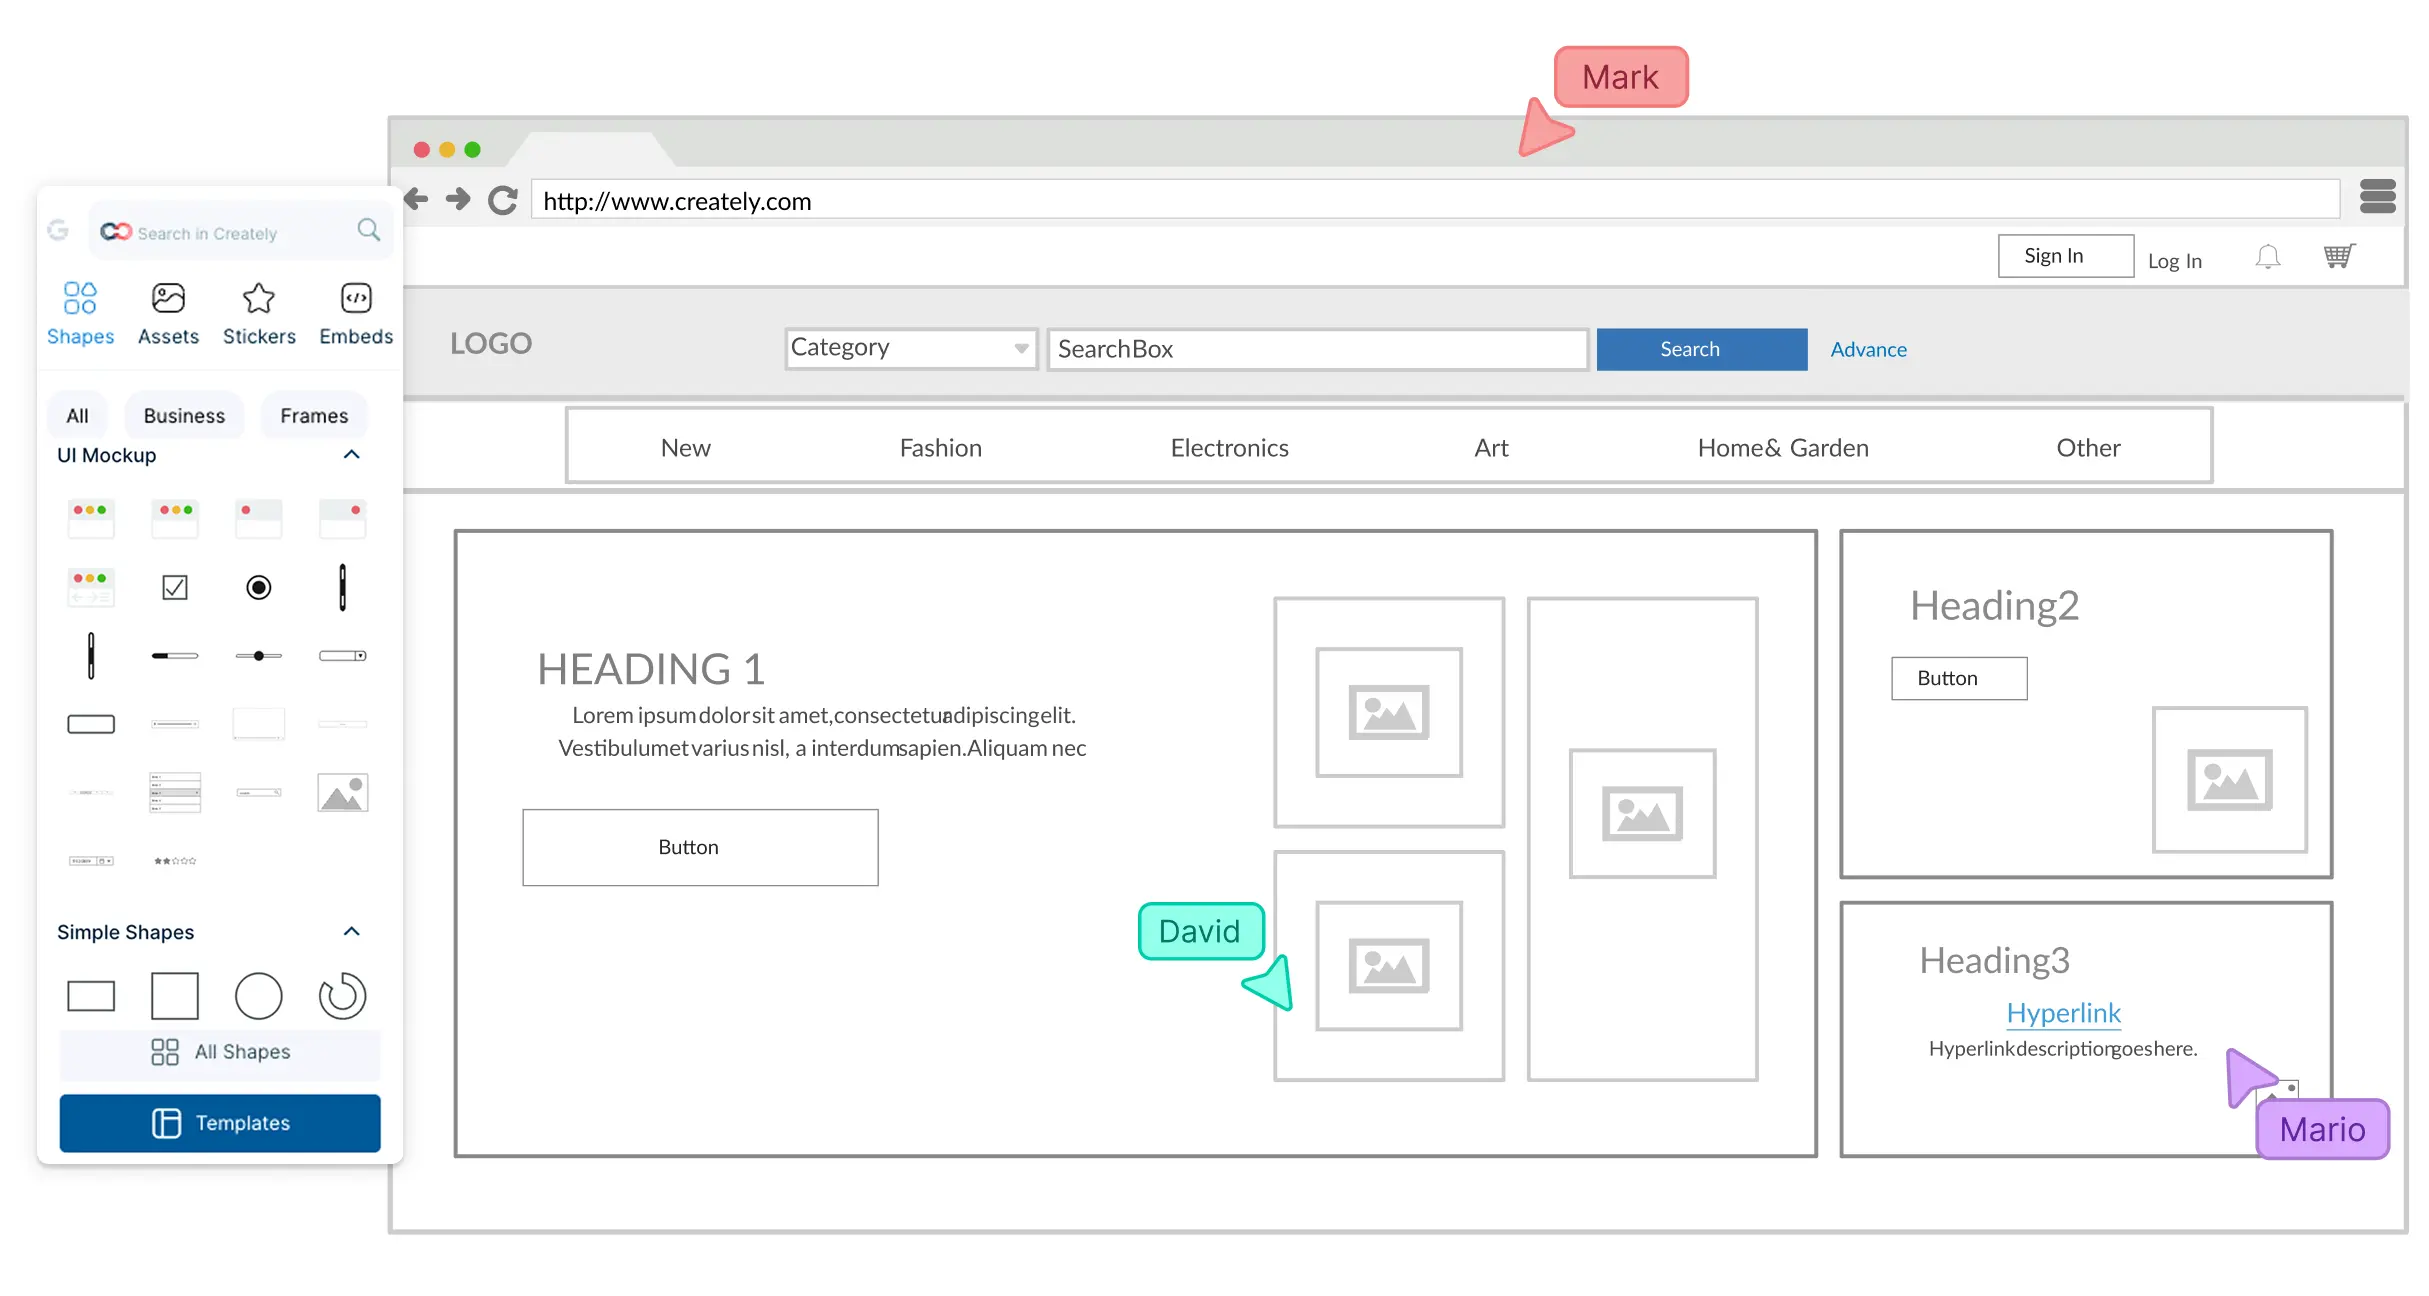
Collaborate with your team and create visual sketches of app layouts to effectively connect information architecture to visual designs with Creately’s online wireframe tool.
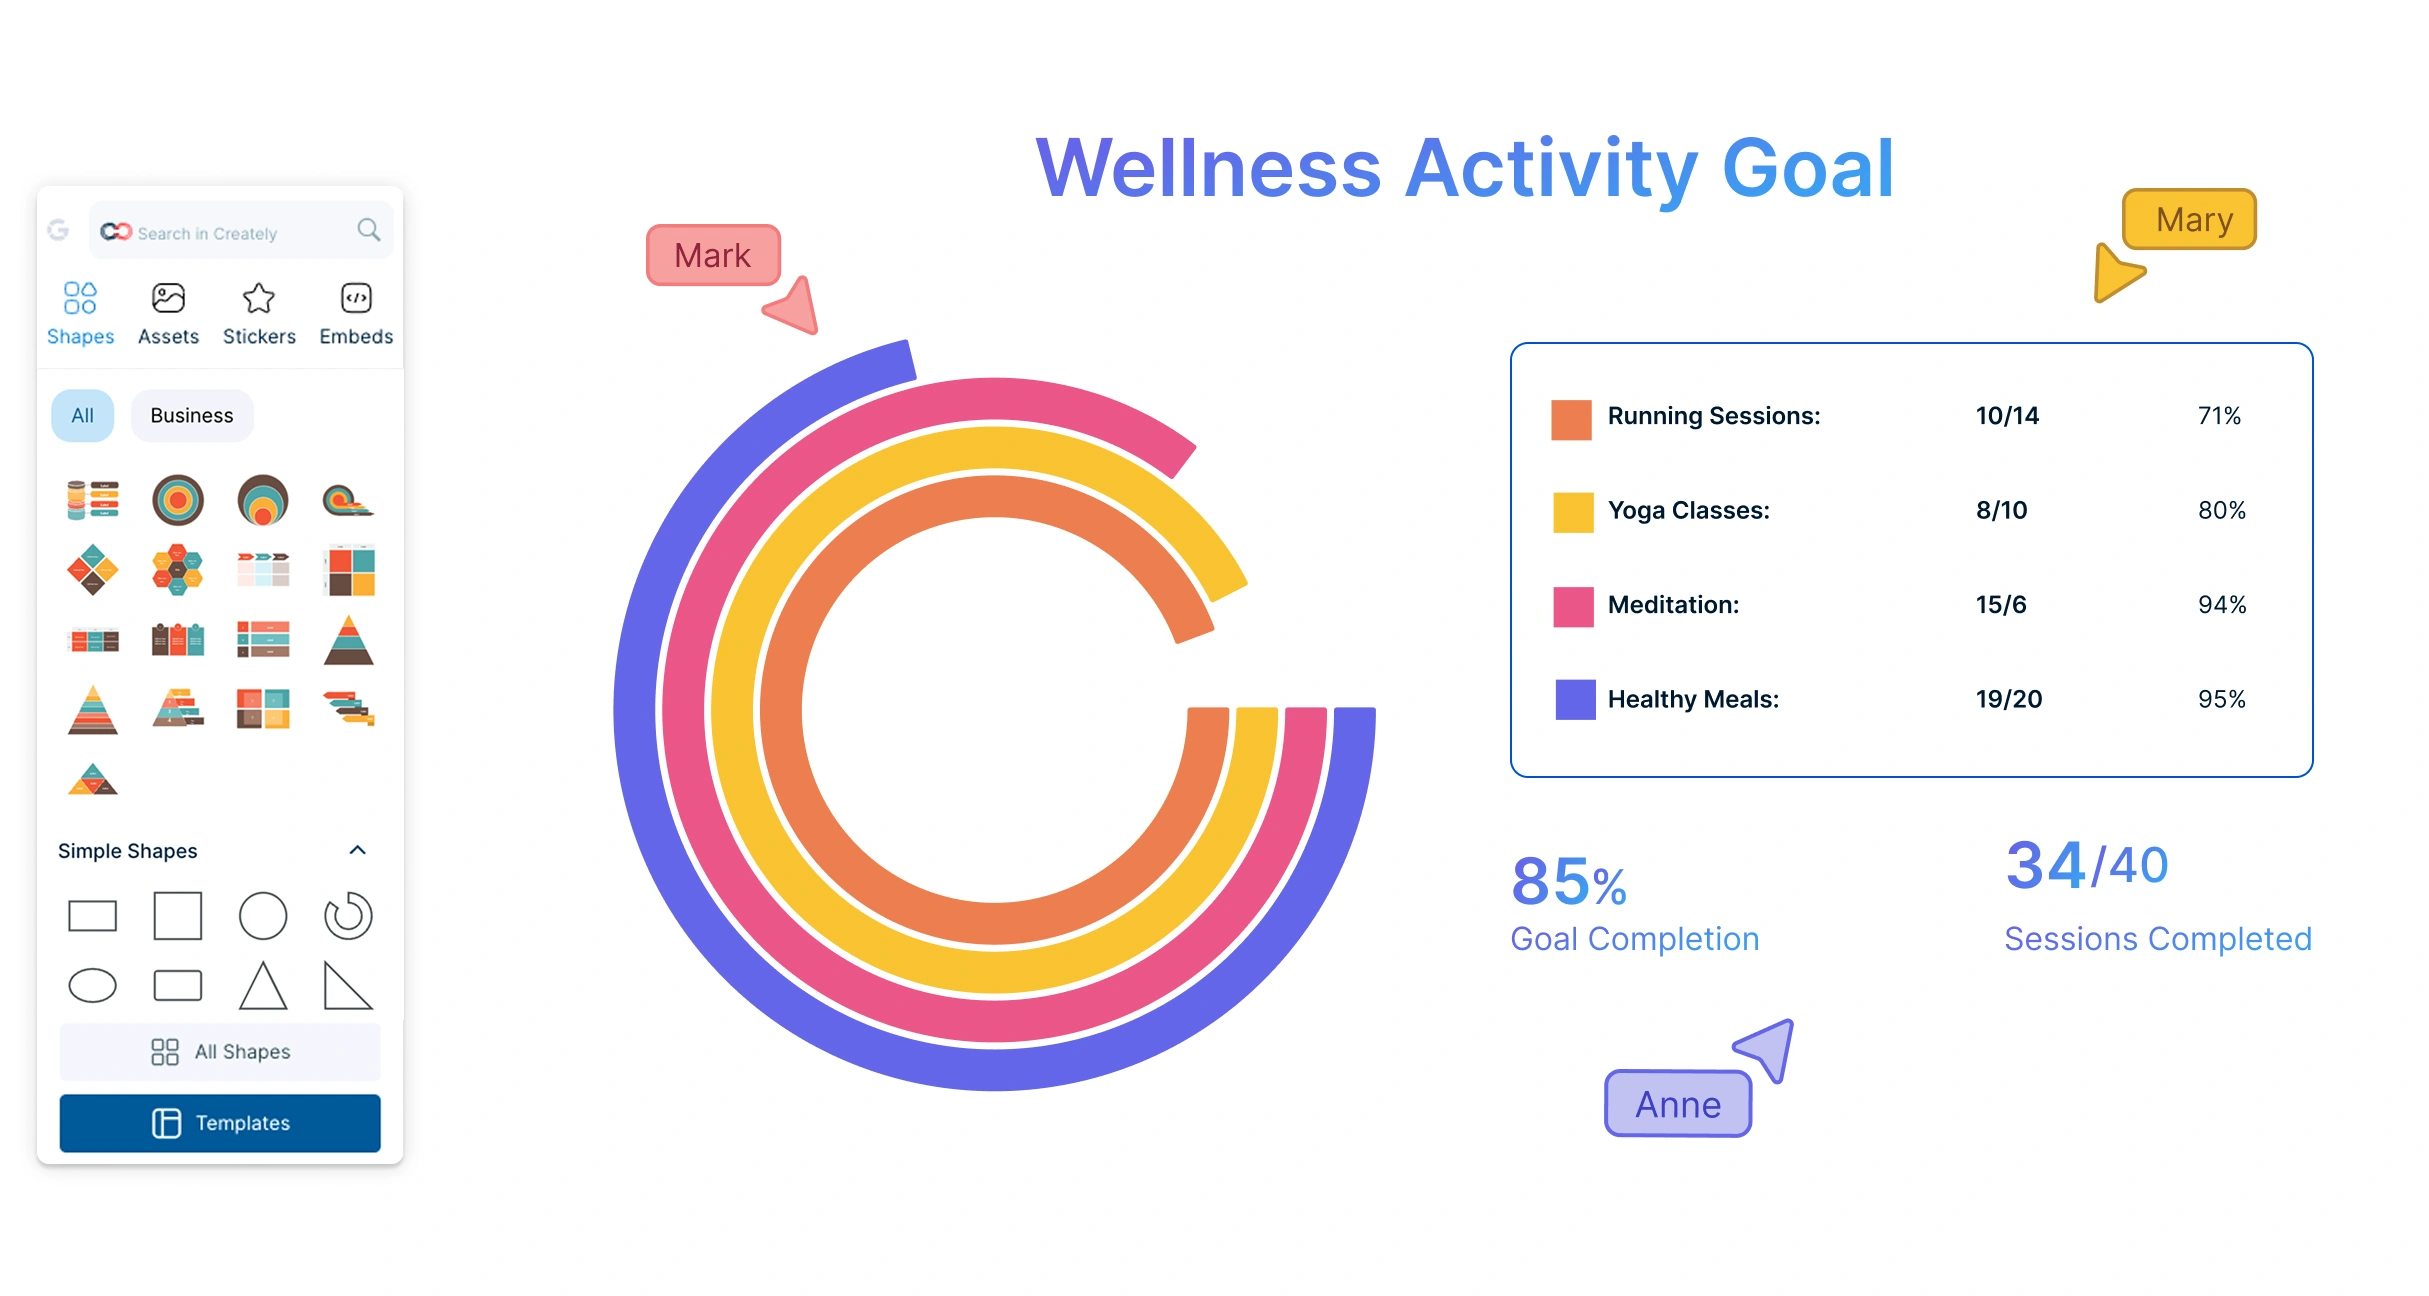
Effortlessly transform your data into visually engaging donut charts. Visualize sales data, project progress, or survey insights with clarity.
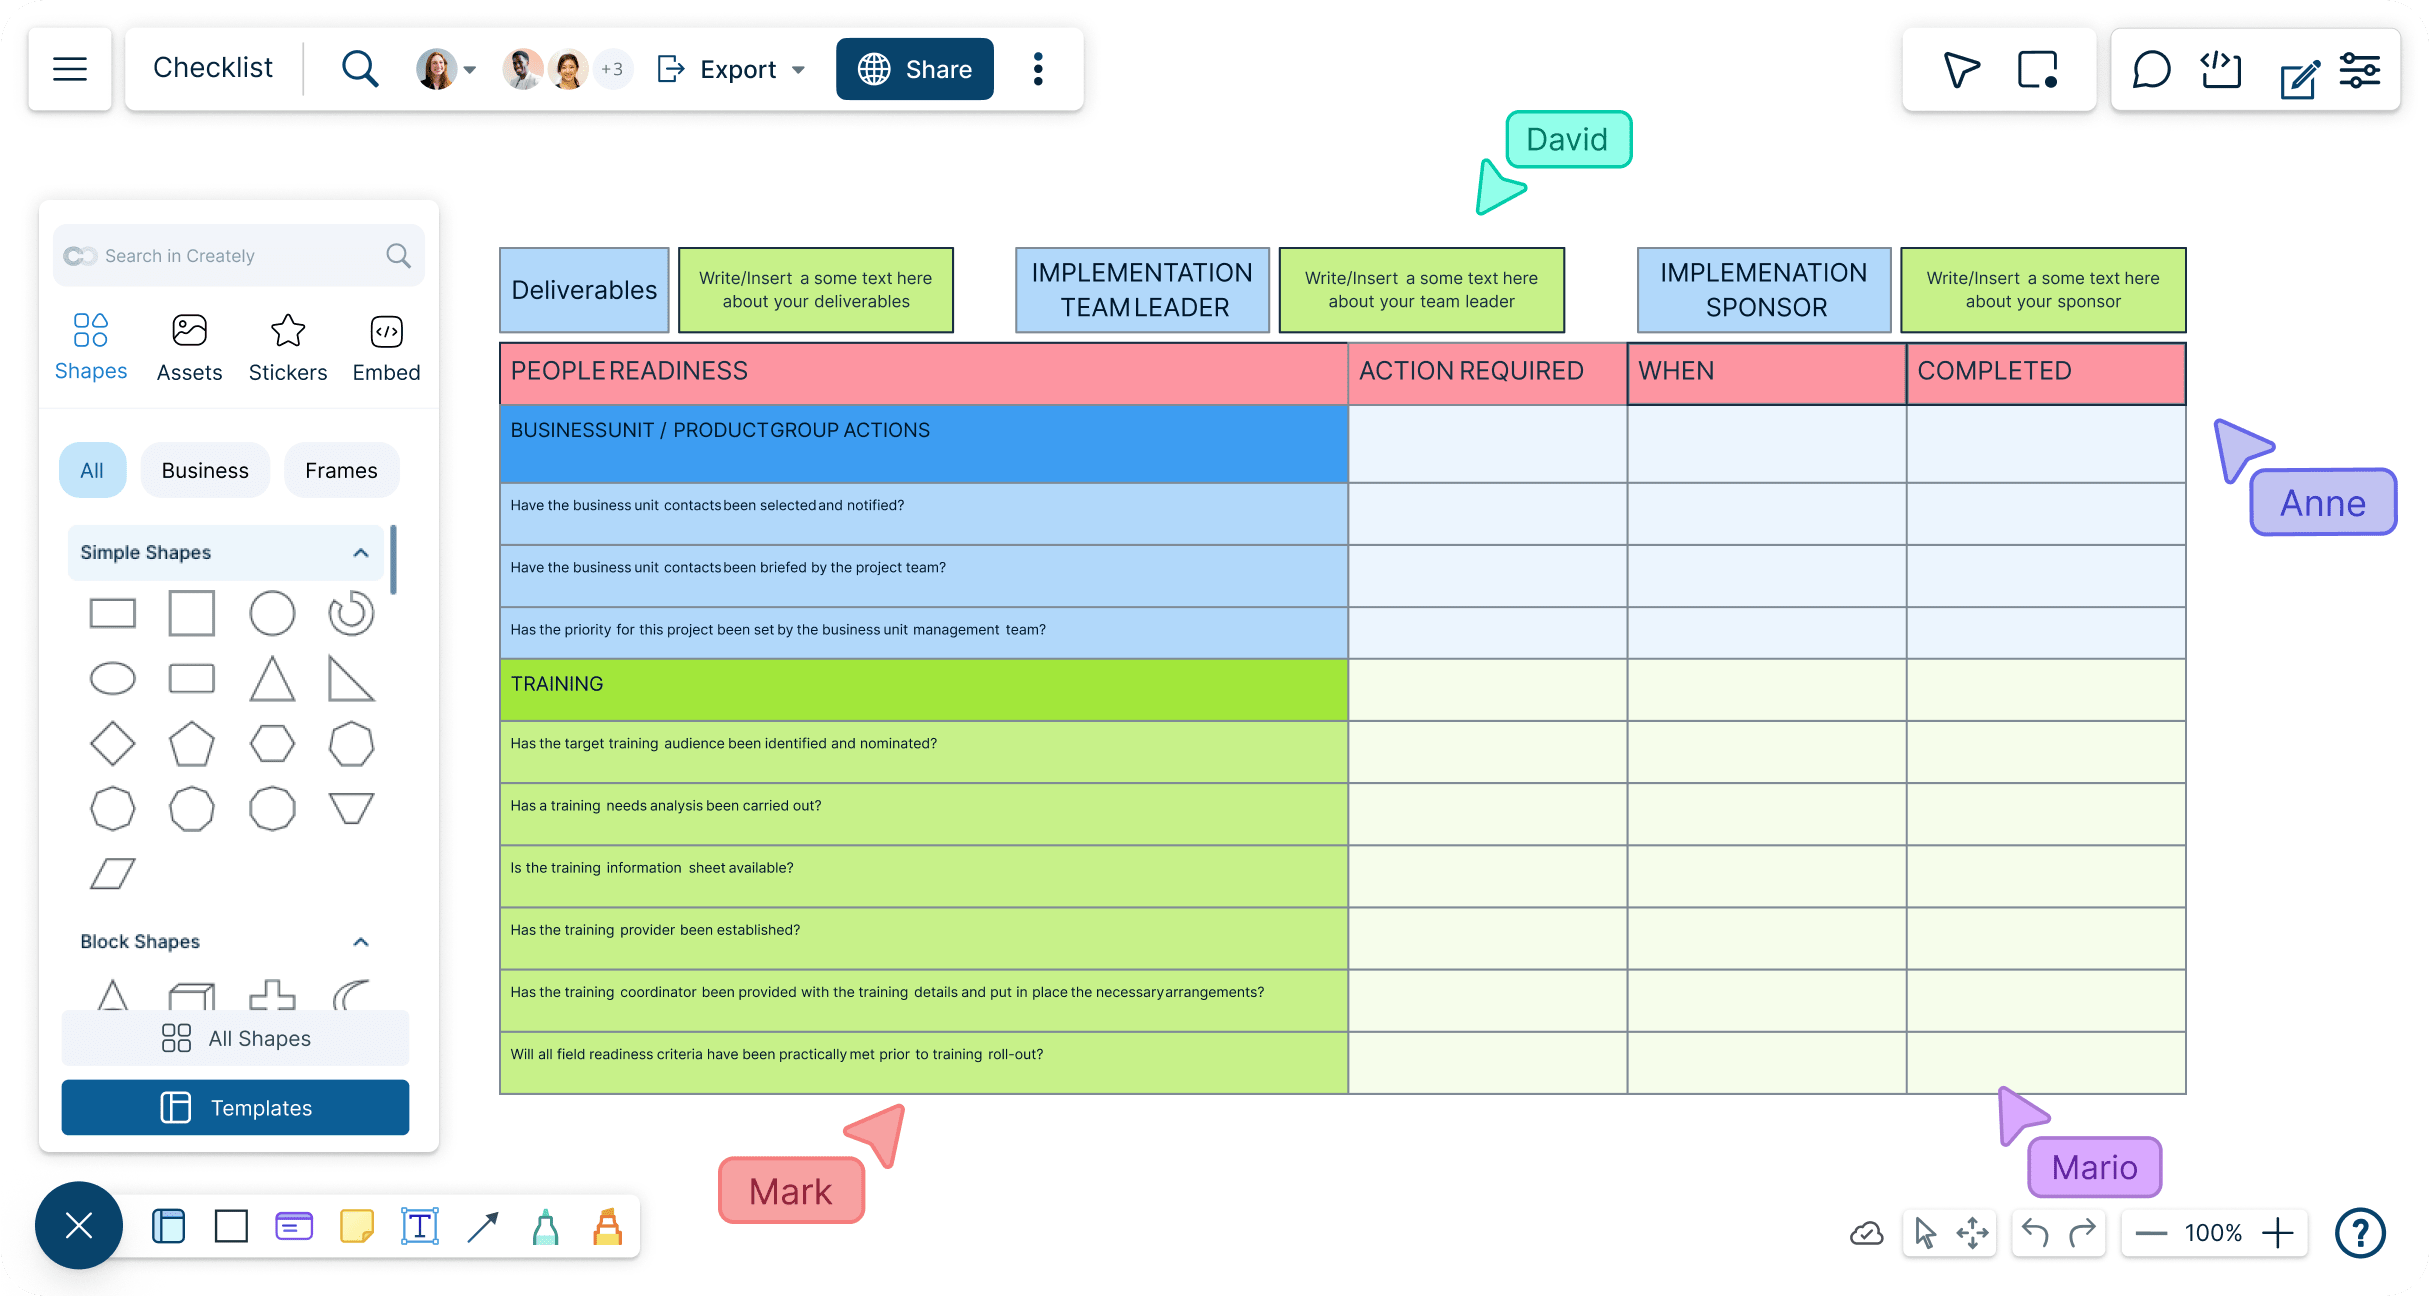
Turn scattered tasks, deadlines, owners, and updates into one organized checklist. Plan repeatable work, track progress, collaborate with others, and keep every step easy to review and complete.
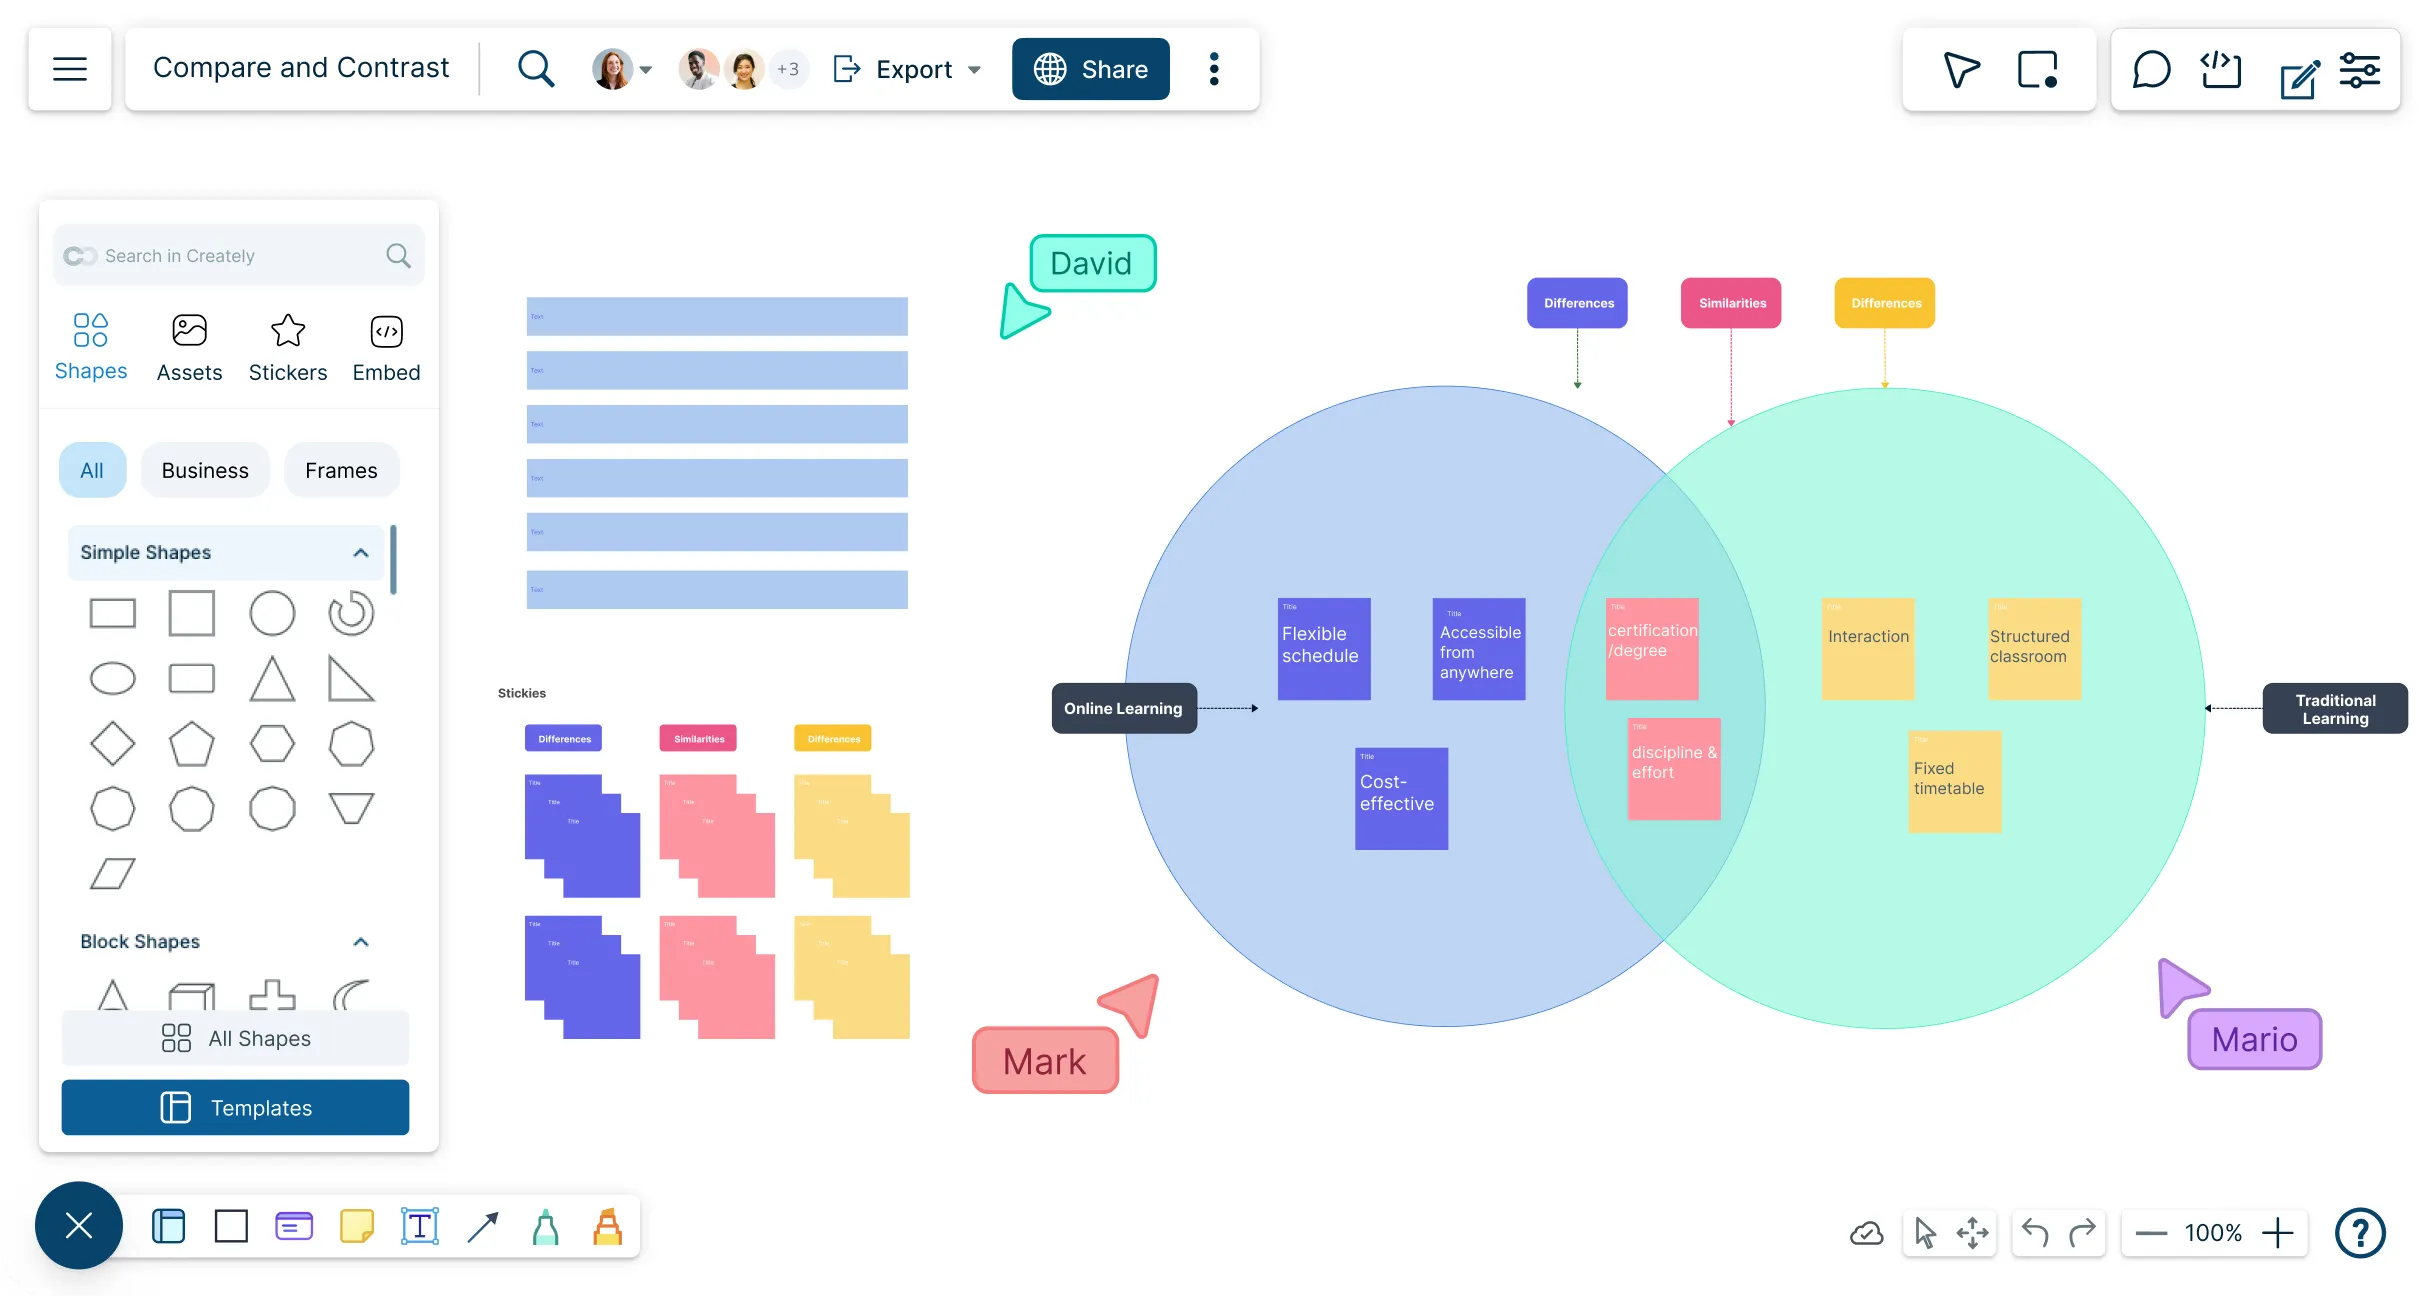
Visualize similarities and differences in one workspace with Creately’s Compare and Contrast Chart Maker to map ideas, brainstorm, and present clearly.
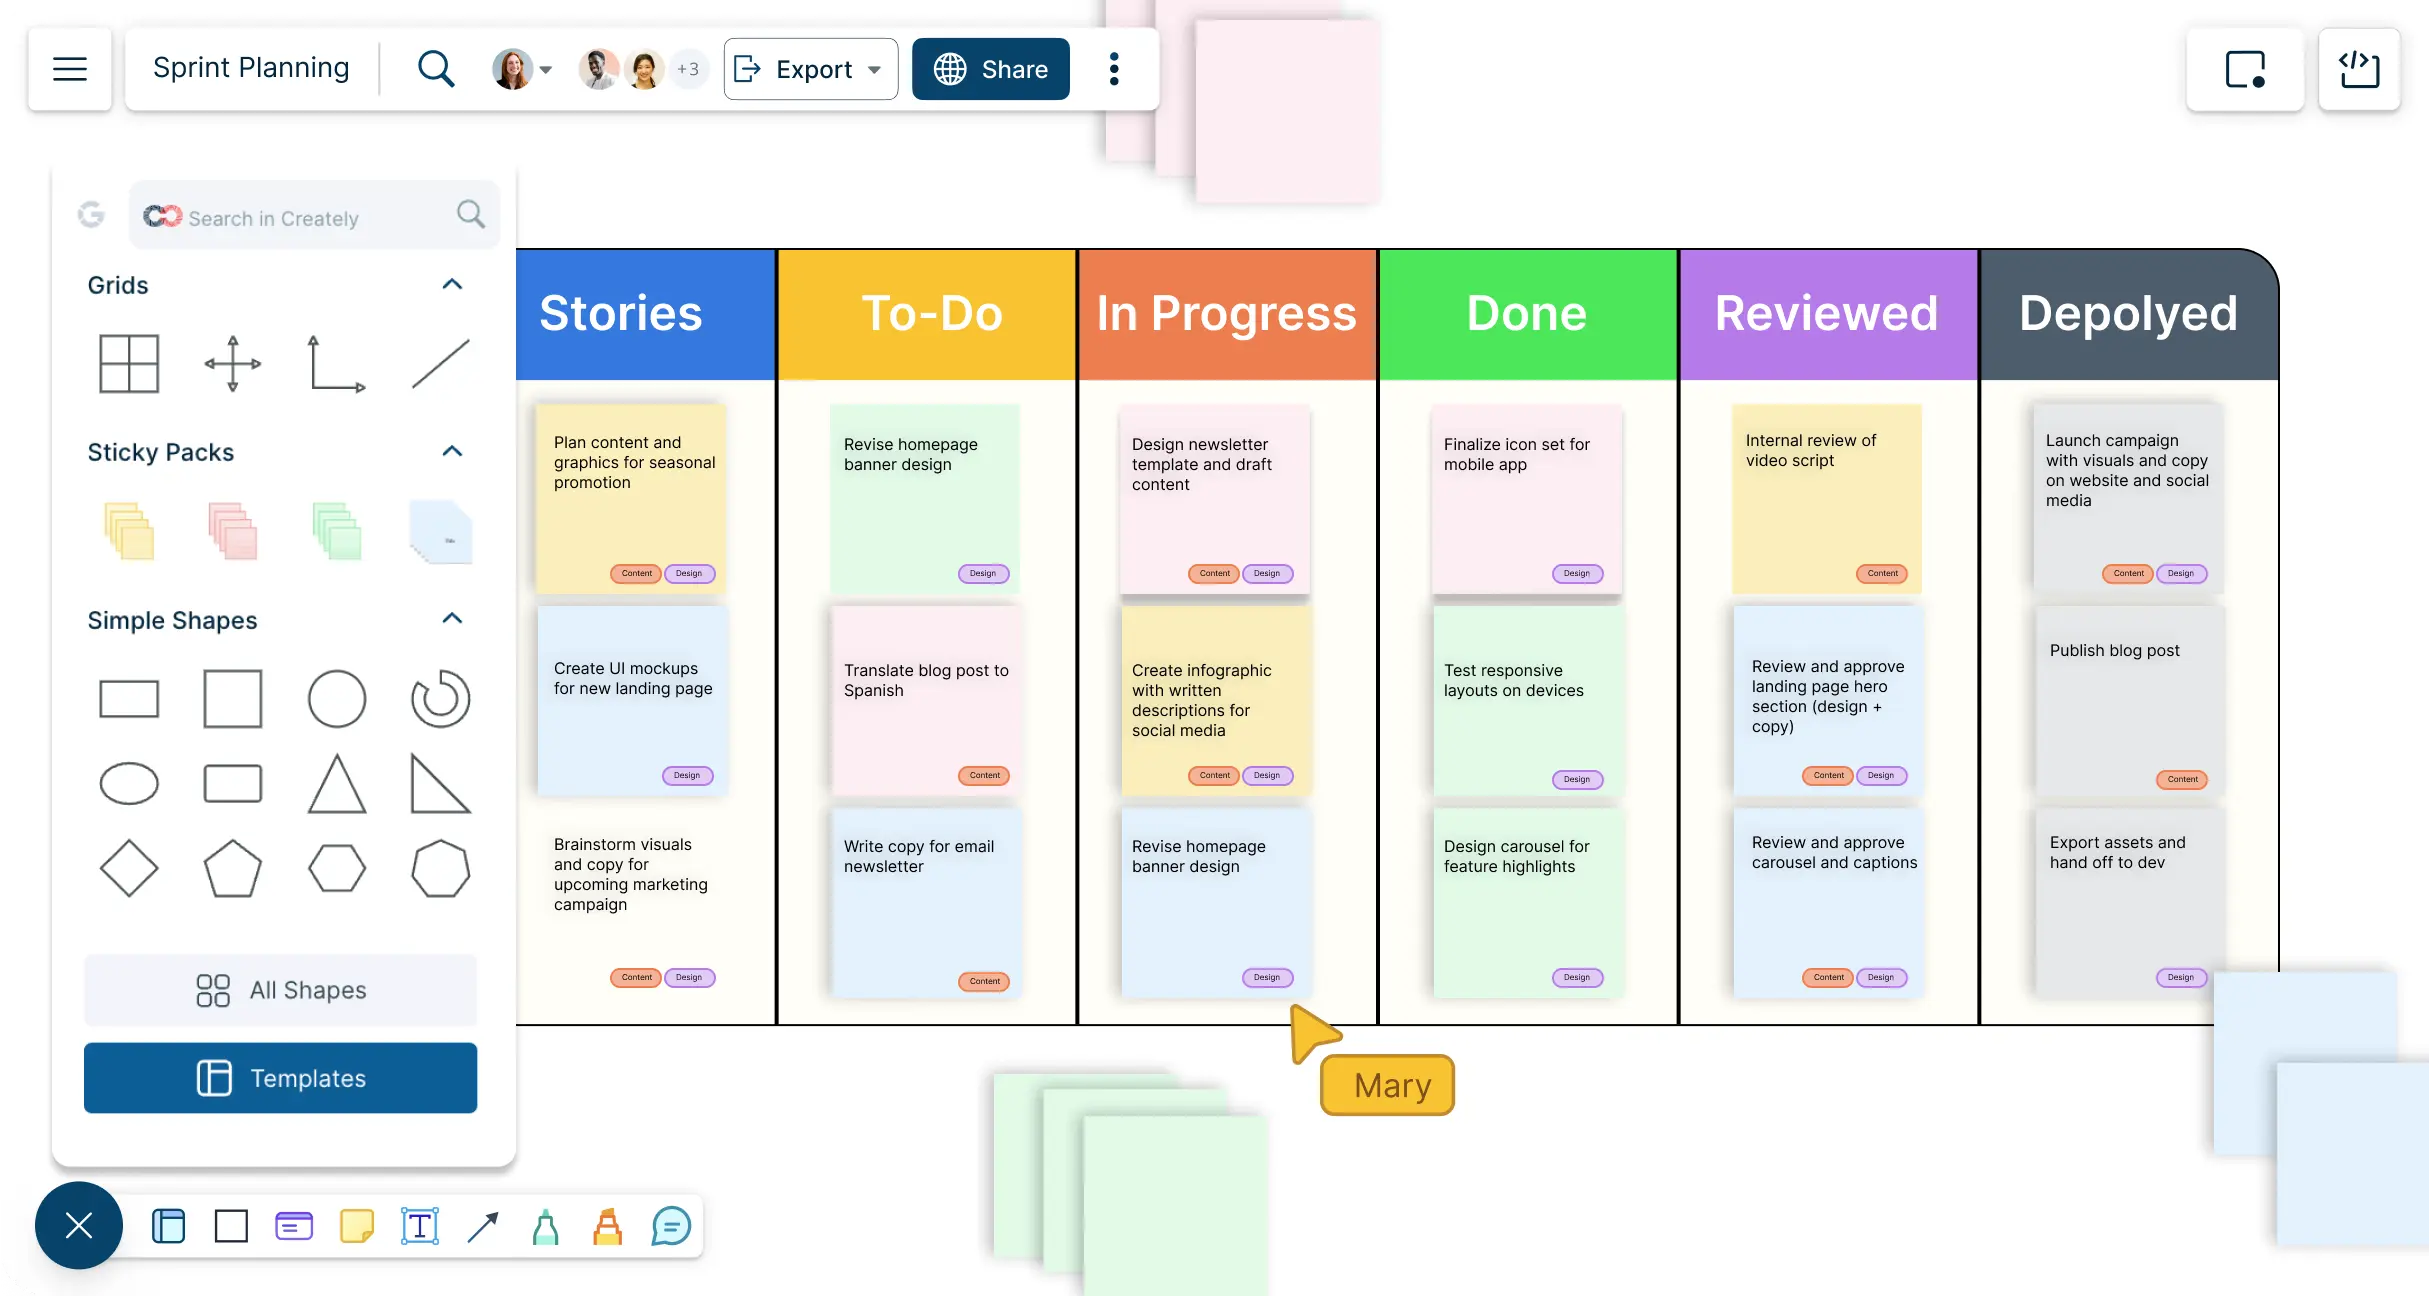
Streamline your Agile workflow with Creately’s online scrum board. Plan sprints, track dependencies, and keep teams aligned in real time.
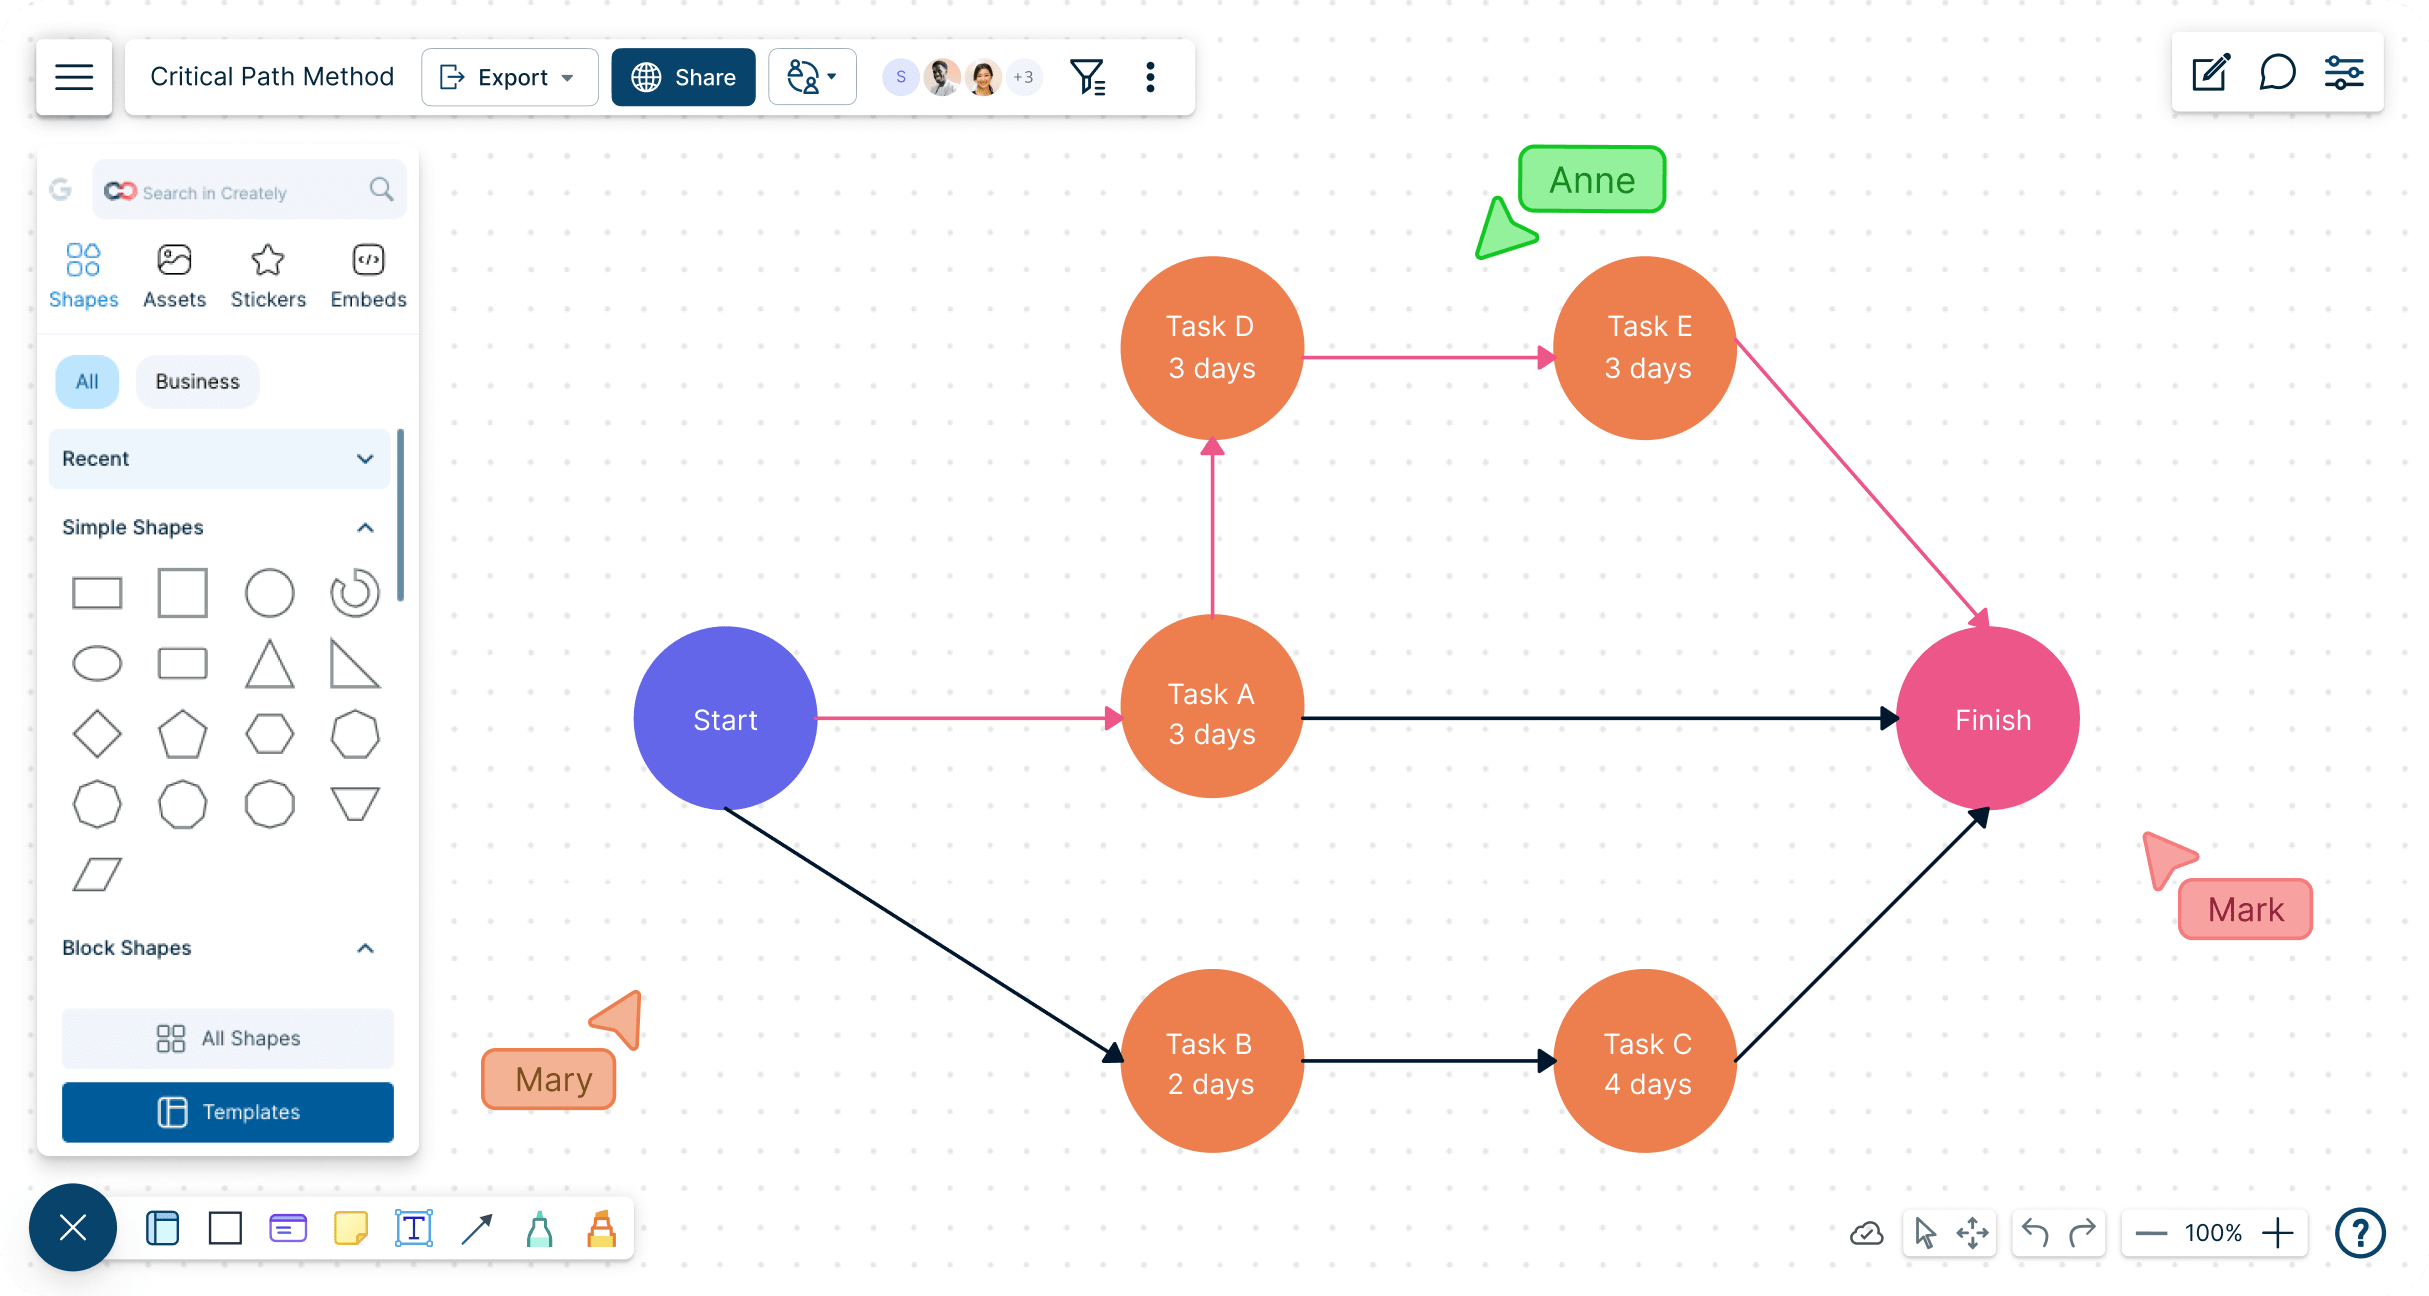
Go beyond basic Gantt charts with Creately’s CPM Maker to pinpoint key tasks and dependencies, ensuring projects stay on schedule.
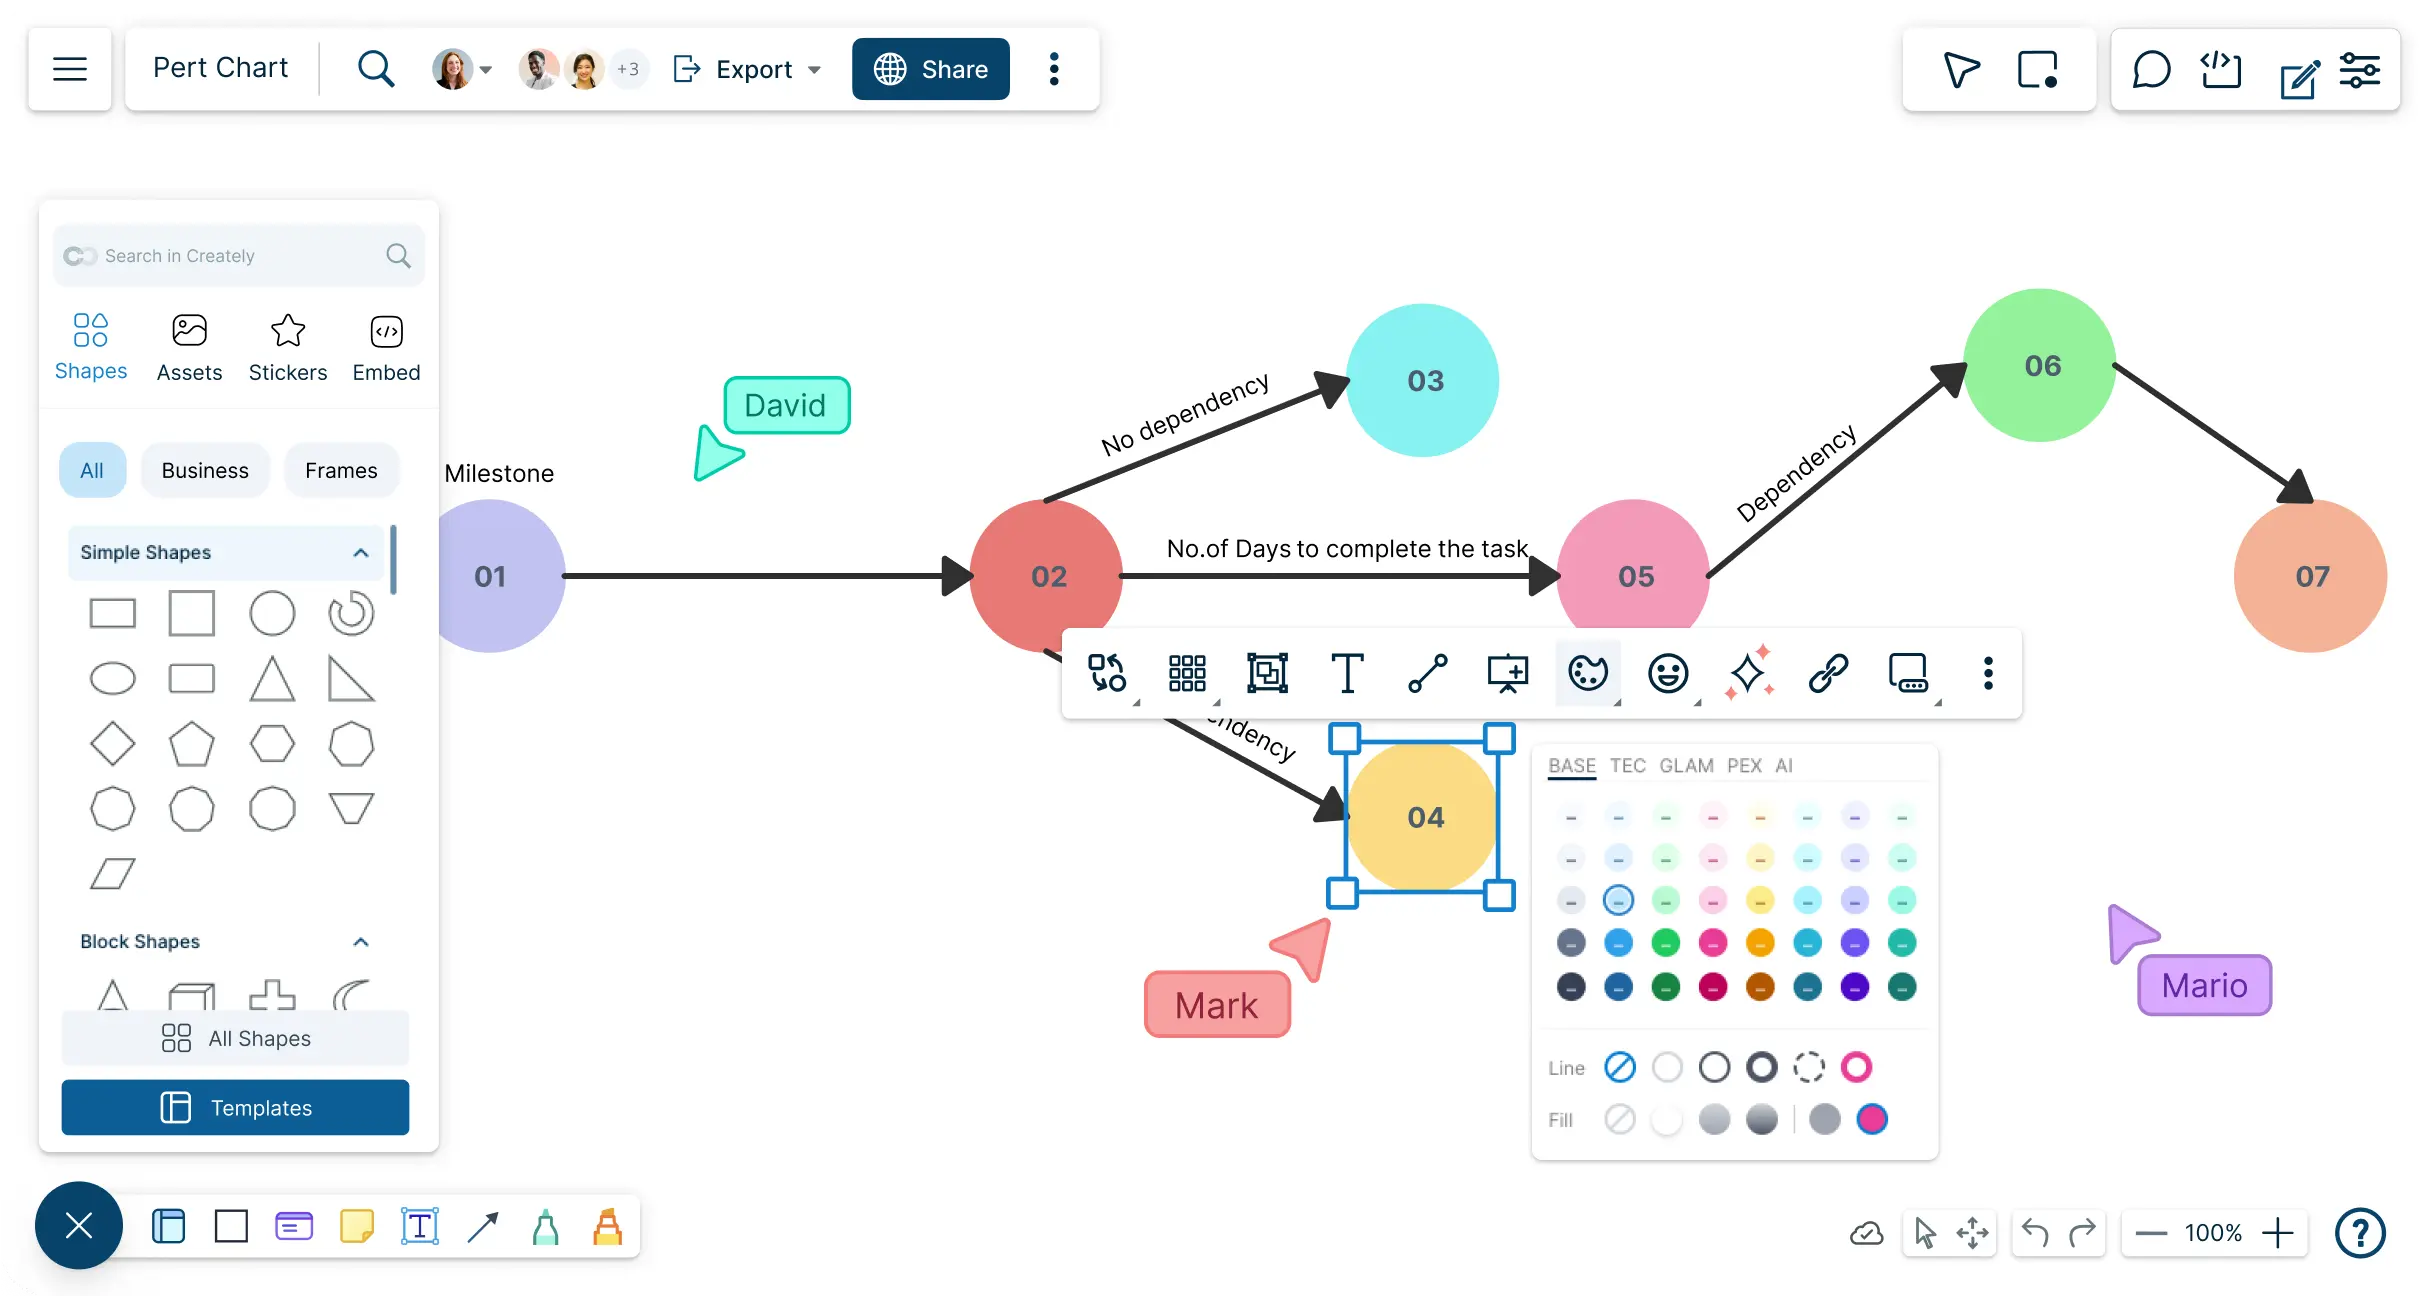
Easily schedule, organize, and map project tasks and keep track of dependencies in a single collaborative, visual platform with Creately’s best PERT Chart Maker.
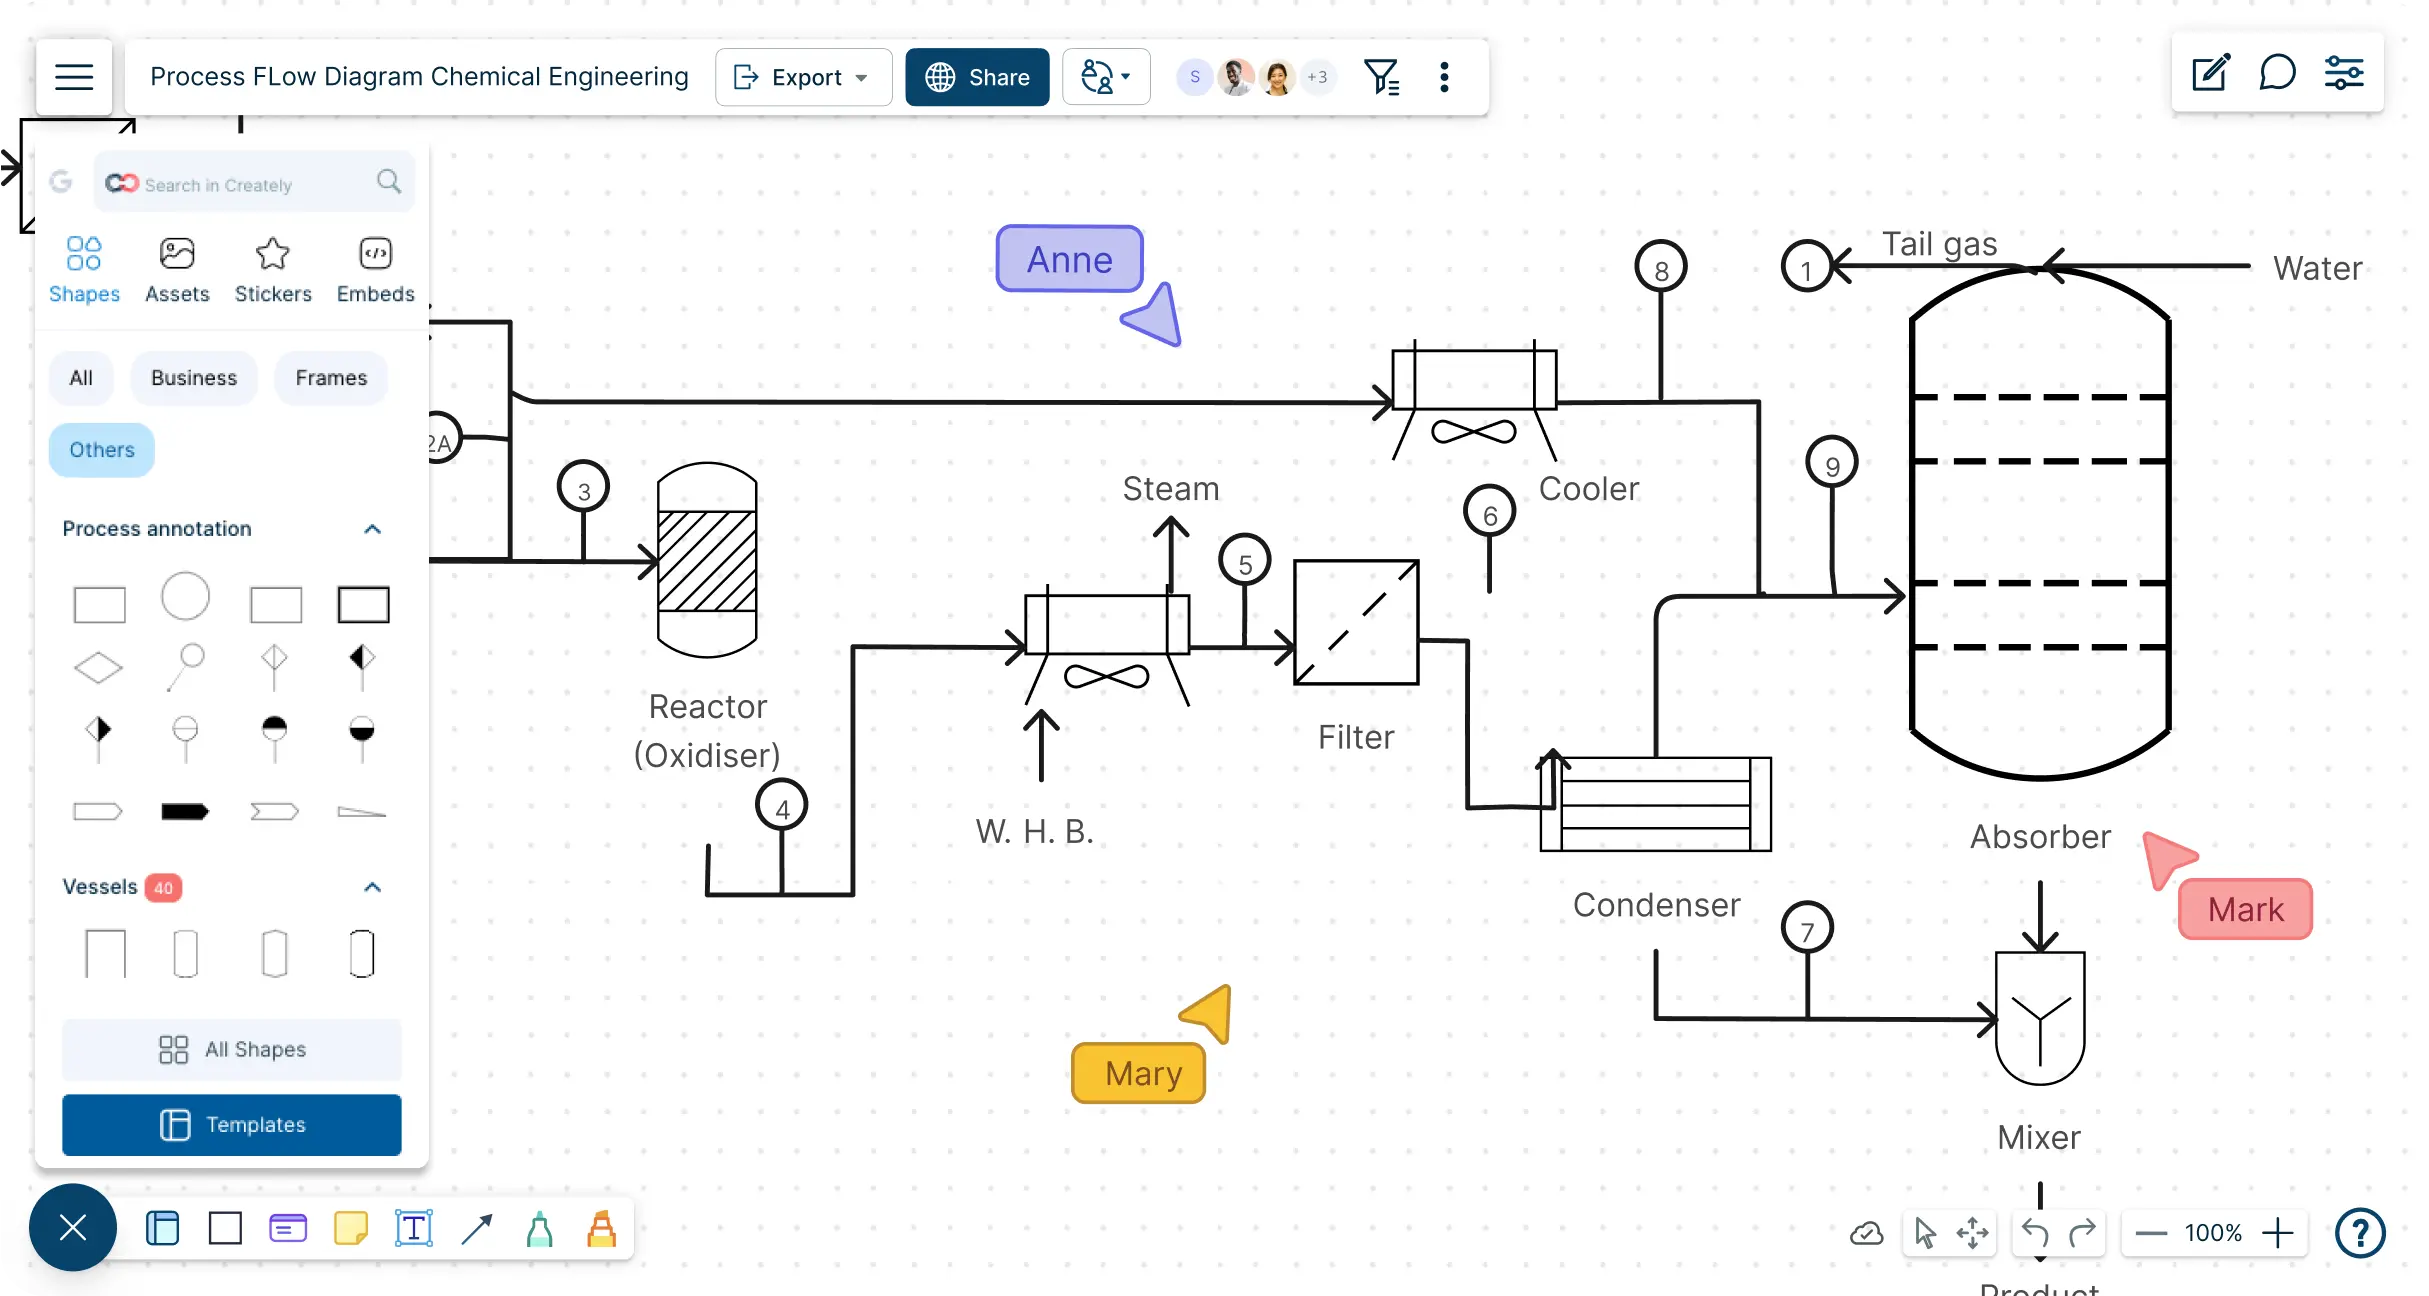
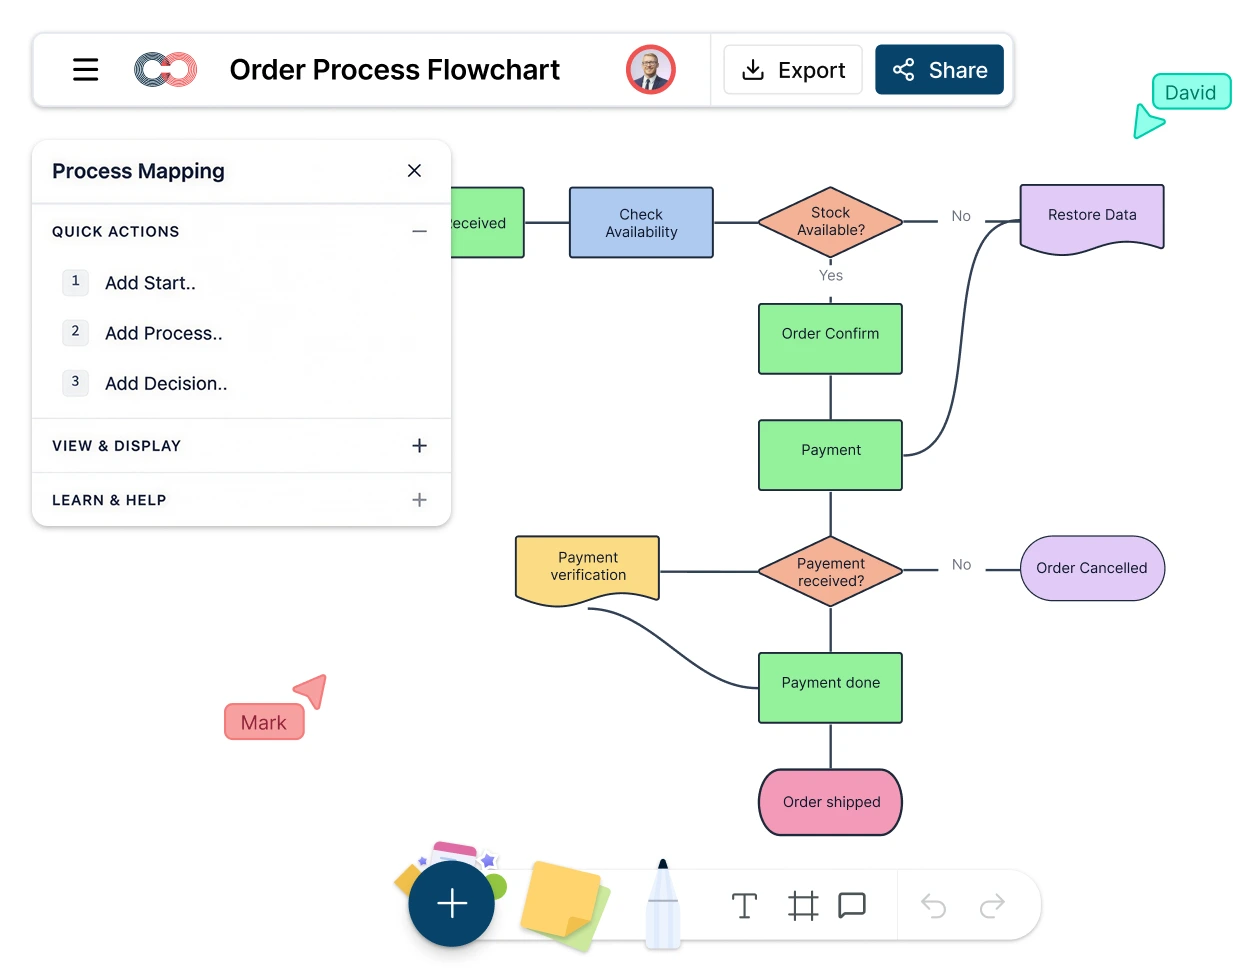
Easily visualize and streamline complex processes with Creately’s process flow diagram software. Design professional workflows, identify inefficiencies, and improve decision-making with customizable, collaborative diagrams.
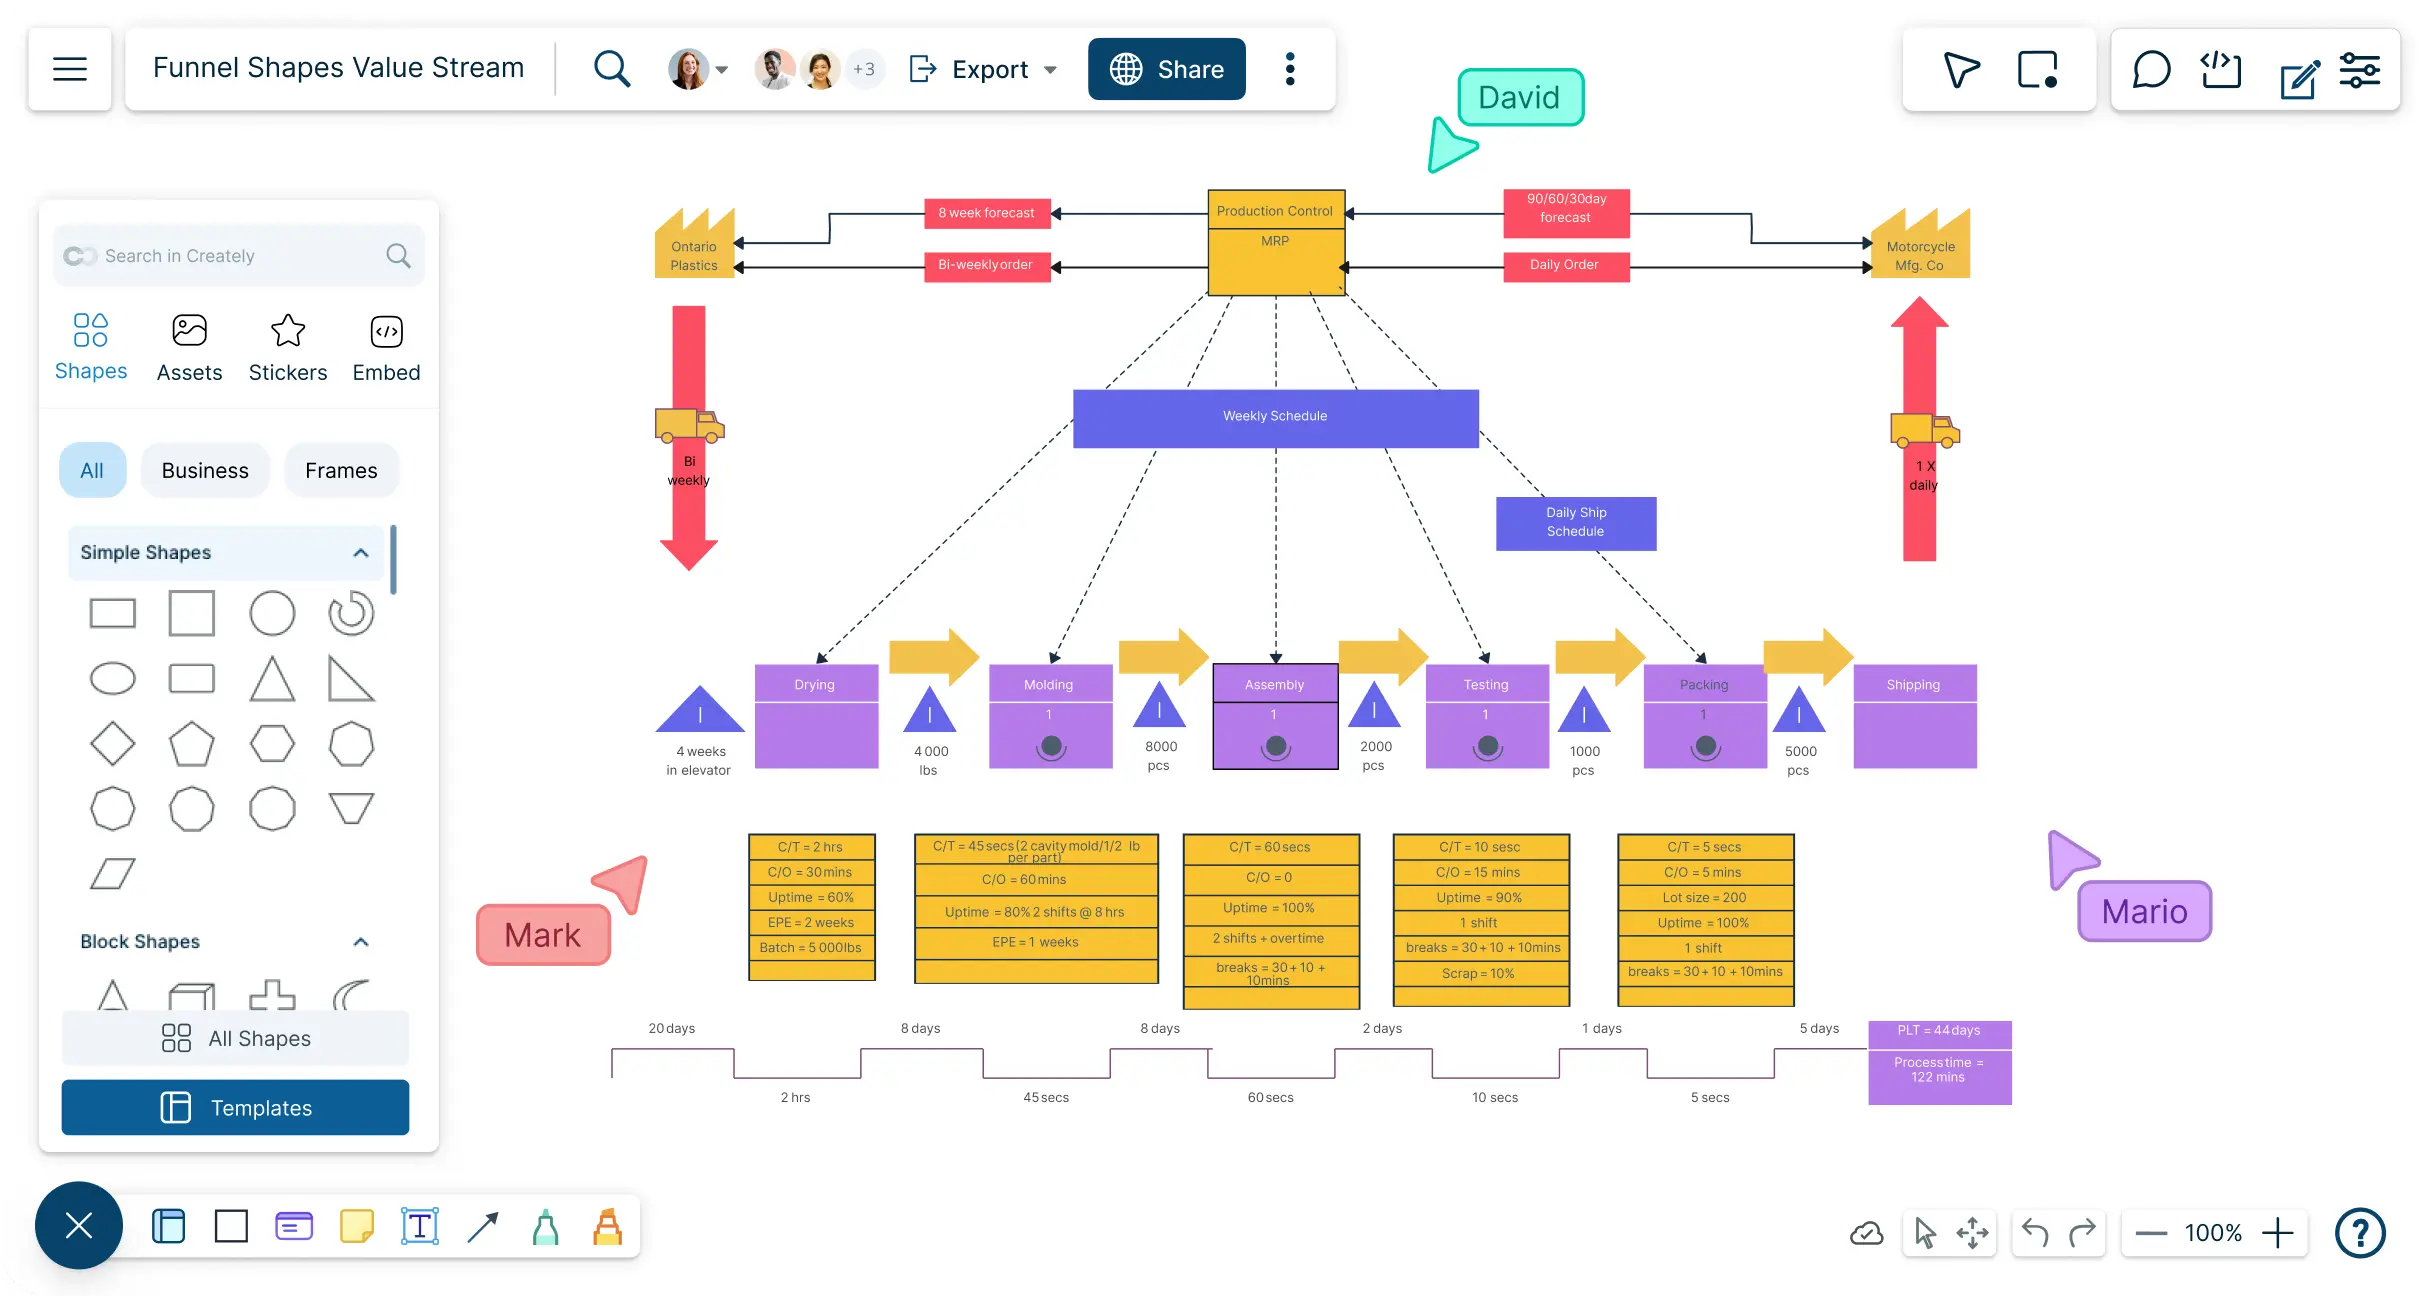
Identify waste and inefficiencies in your existing processes and collaborate to develop solutions for improvement using our advanced value stream mapping online.
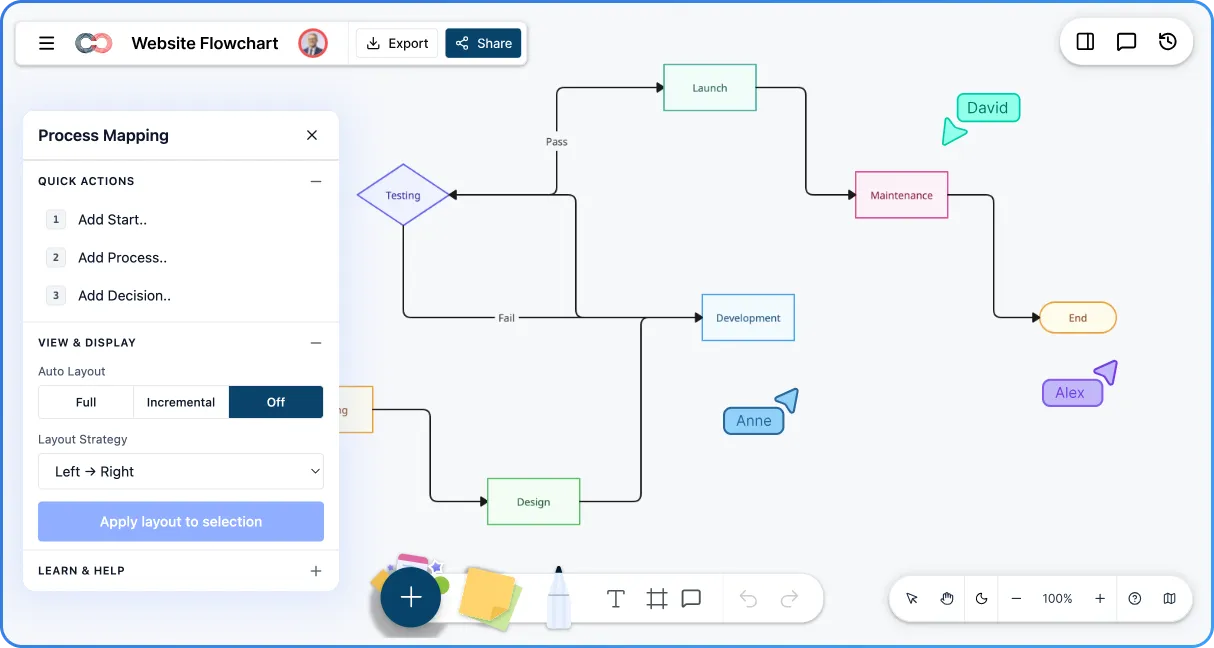
Plan and visualize every page and interaction with Creately’s Website Flowchart Creator. Streamline your website design, keep your team aligned, and bring your web projects to life effortlessly.
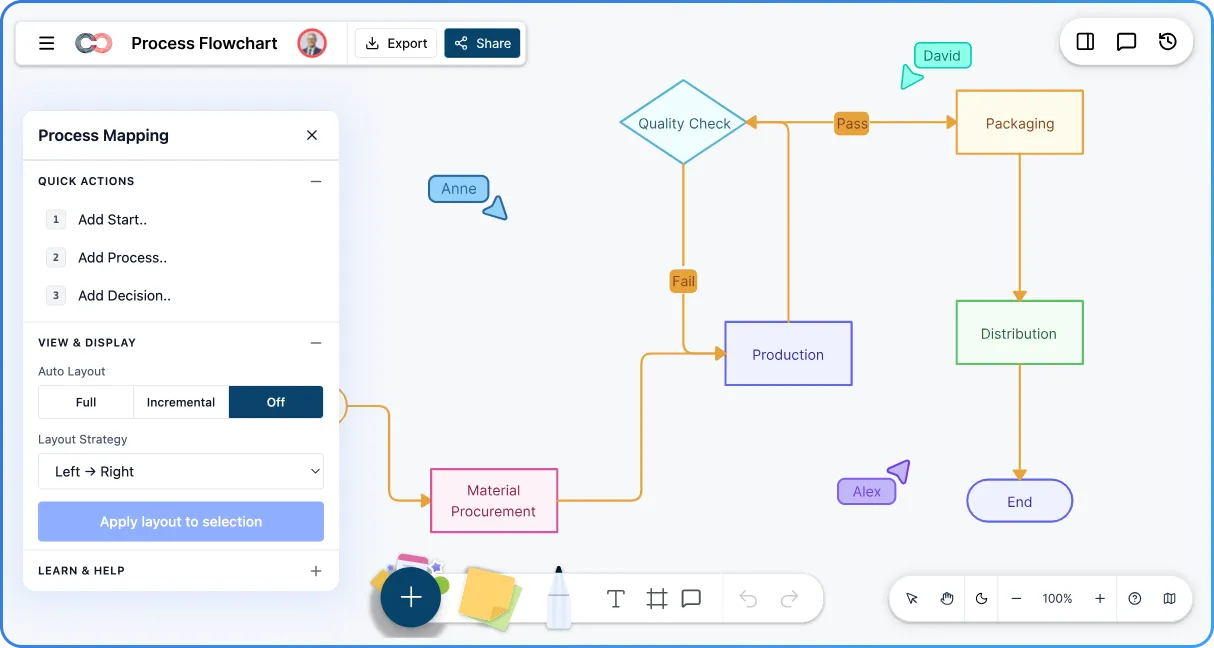
Plan, organize, and execute every task with ease using Creately’s process flowchart tool. Collaborate online in real time, simplify complex workflows, and ensure accuracy and efficiency across your team’s processes.
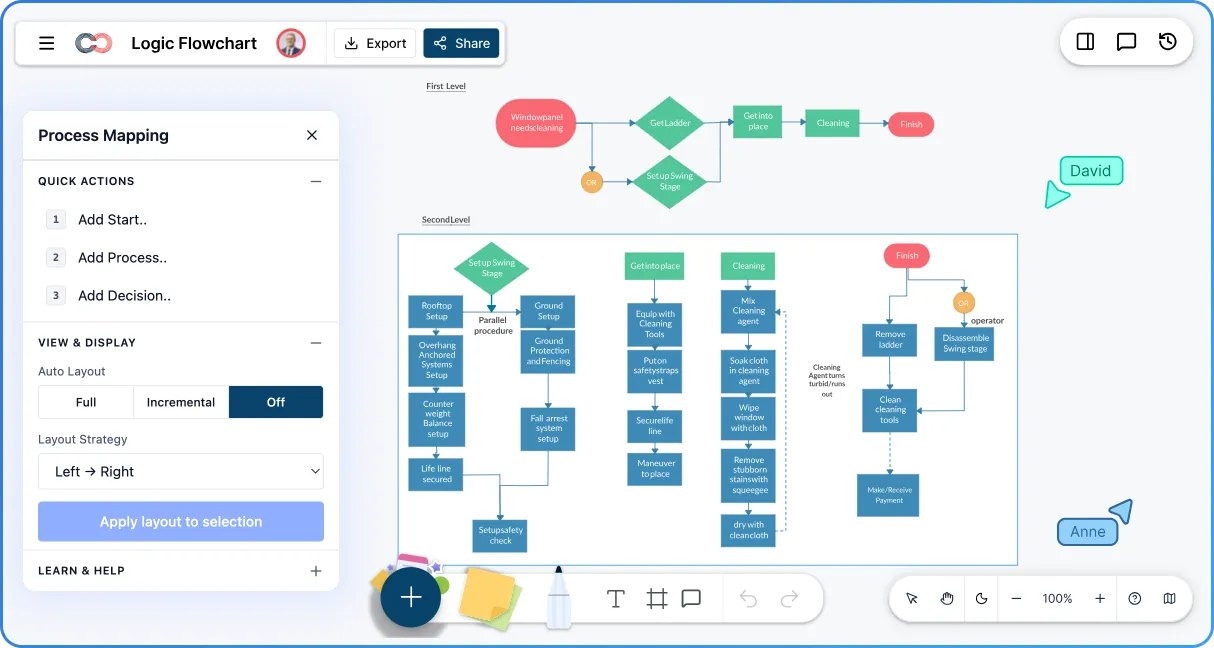
Streamline your decision-making and improve efficiency with Creately’s Logic Flowchart software. Plan, organize, and refine processes with ease, collaborate in real time, and ensure accuracy before execution—making your workflow smarter, faster, and more reliable.
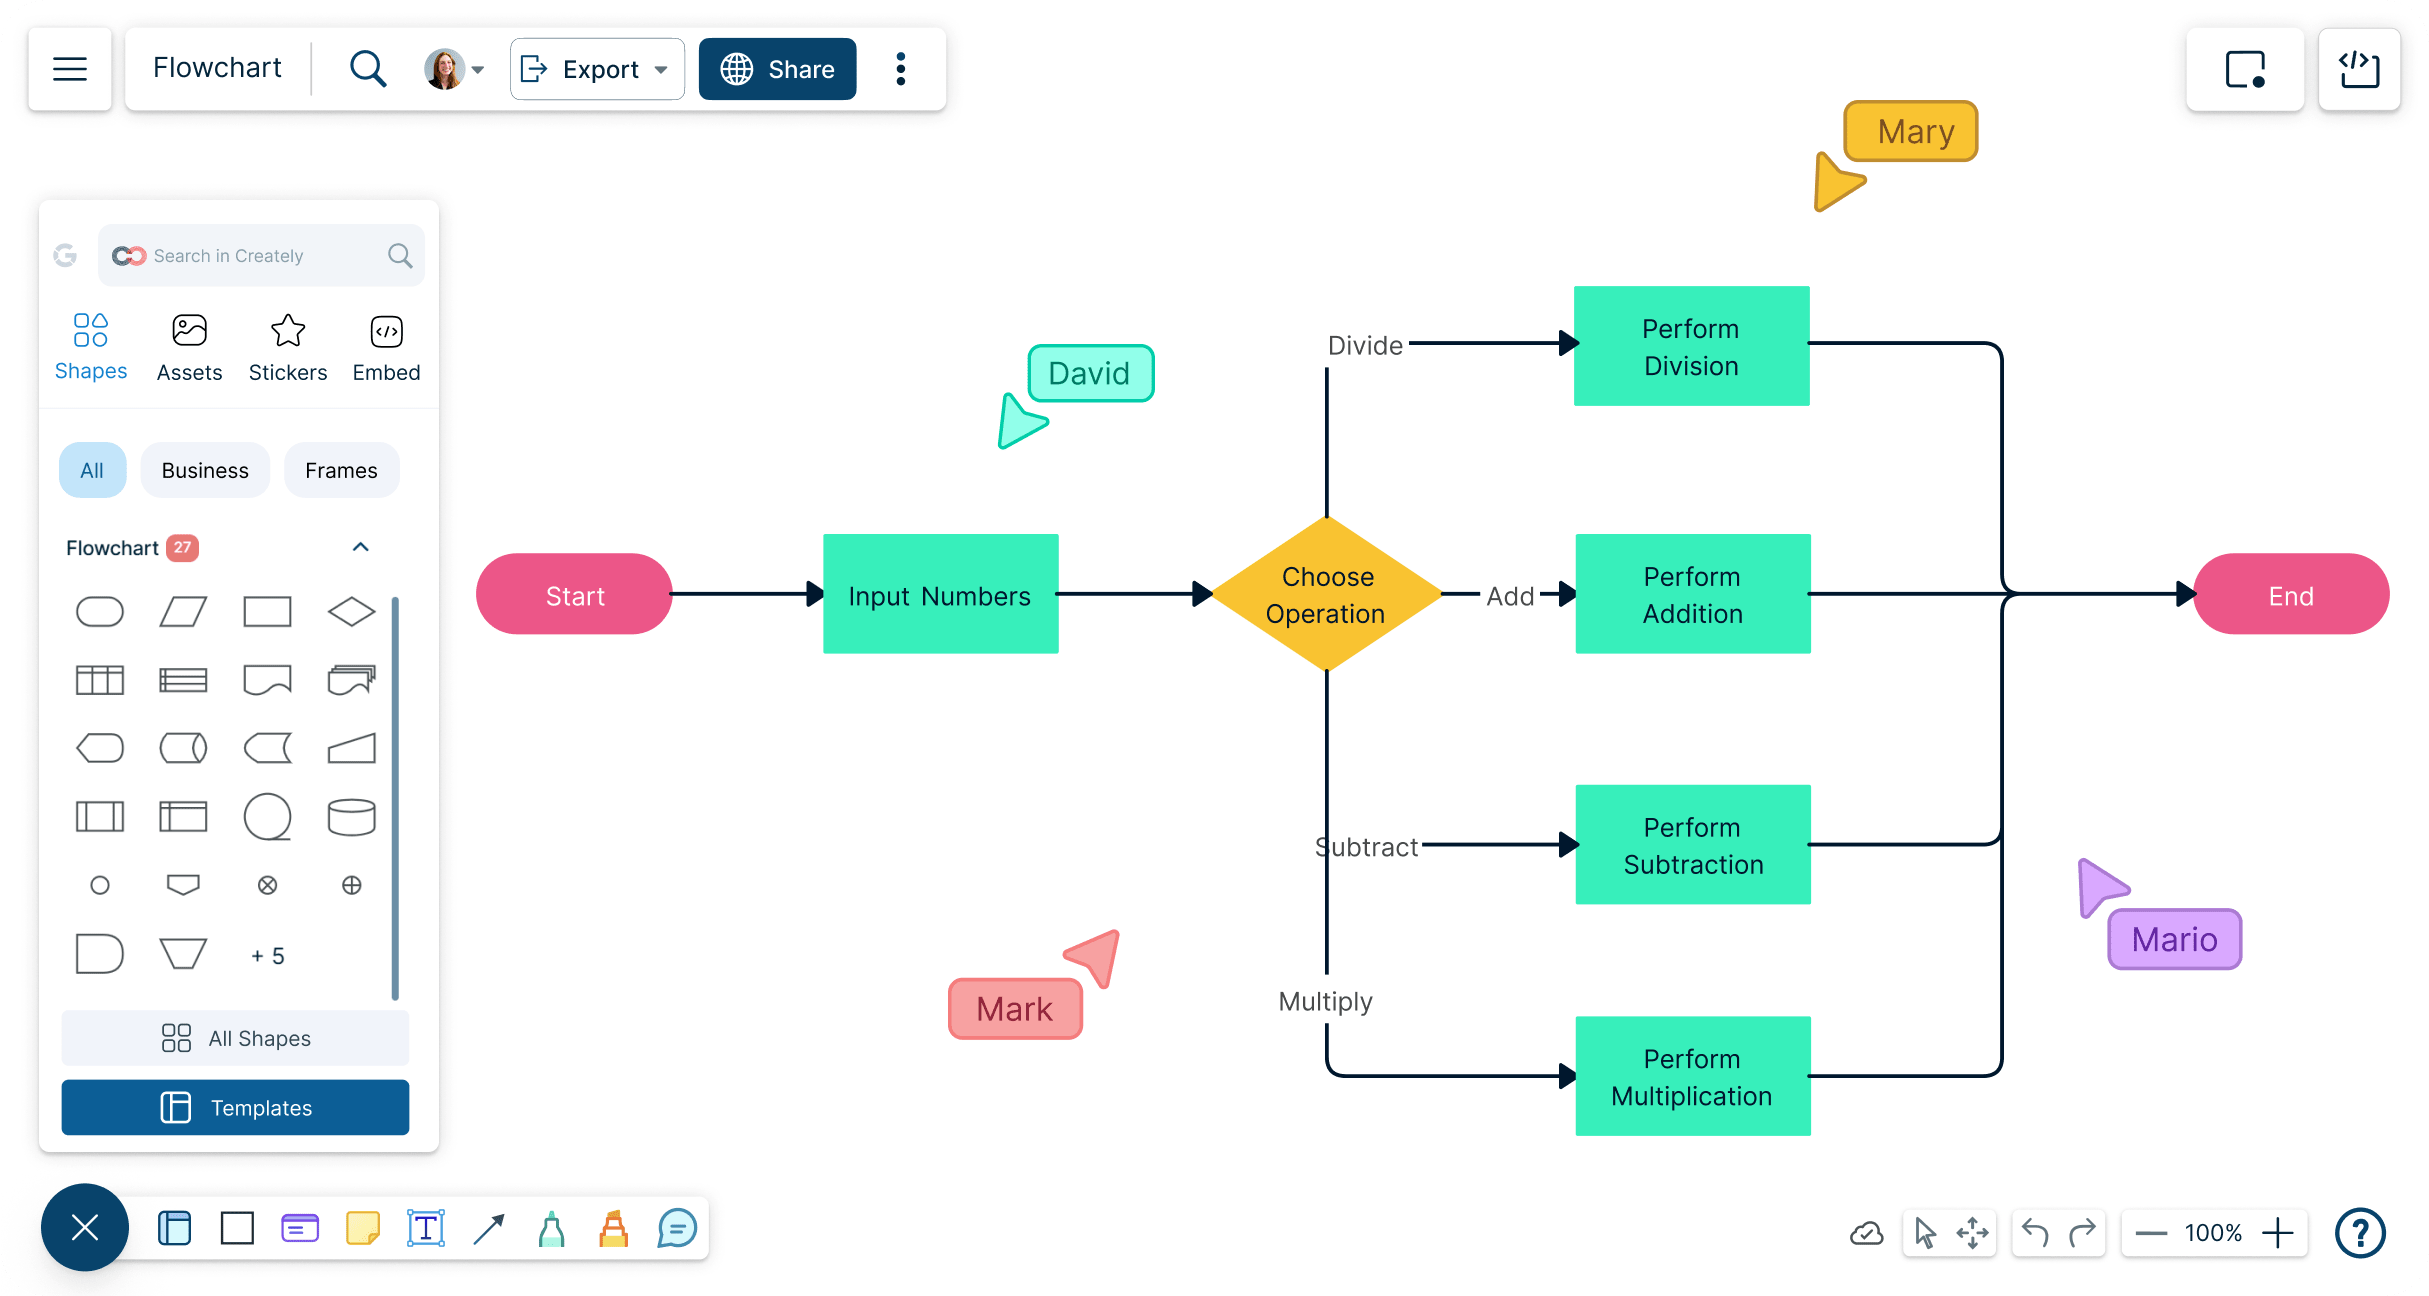
Creately’s flowchart software helps teams create process flows, SOPs, decision trees, user flows, and swimlane diagrams faster with smart connectors, auto-layouts, real-time collaboration, and easy workflow documentation.
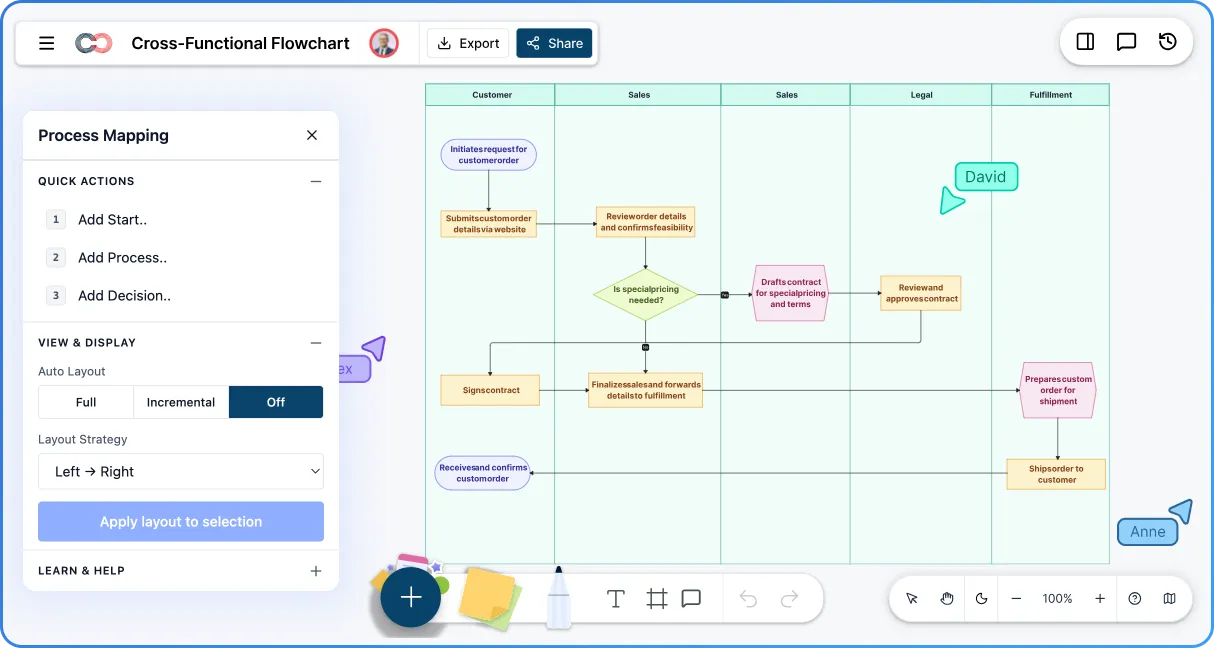
Map ownership, handoffs, and dependencies across teams with Creately's Cross Functional Flowchart Creator to improve coordination and process clarity.
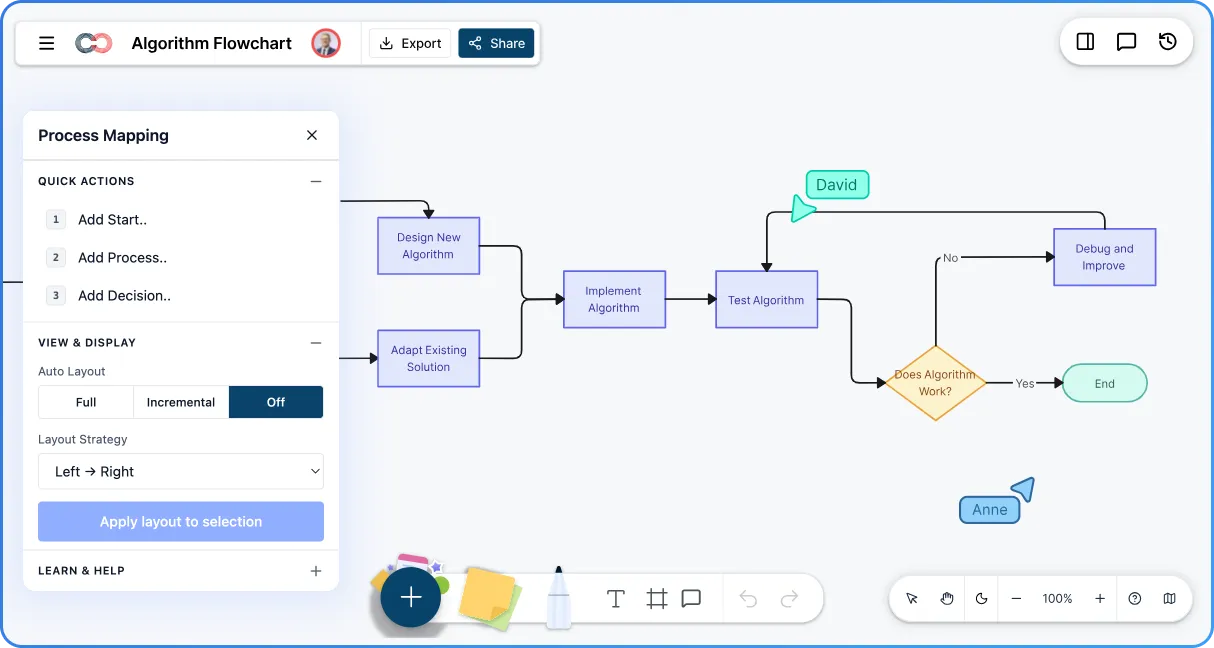
Visualize algorithms clearly with Creately’s Algorithm Flowchart Creator. Turn complex processes into easy-to-follow diagrams using drag-and-drop shapes, smart connectors, and ready-made templates.
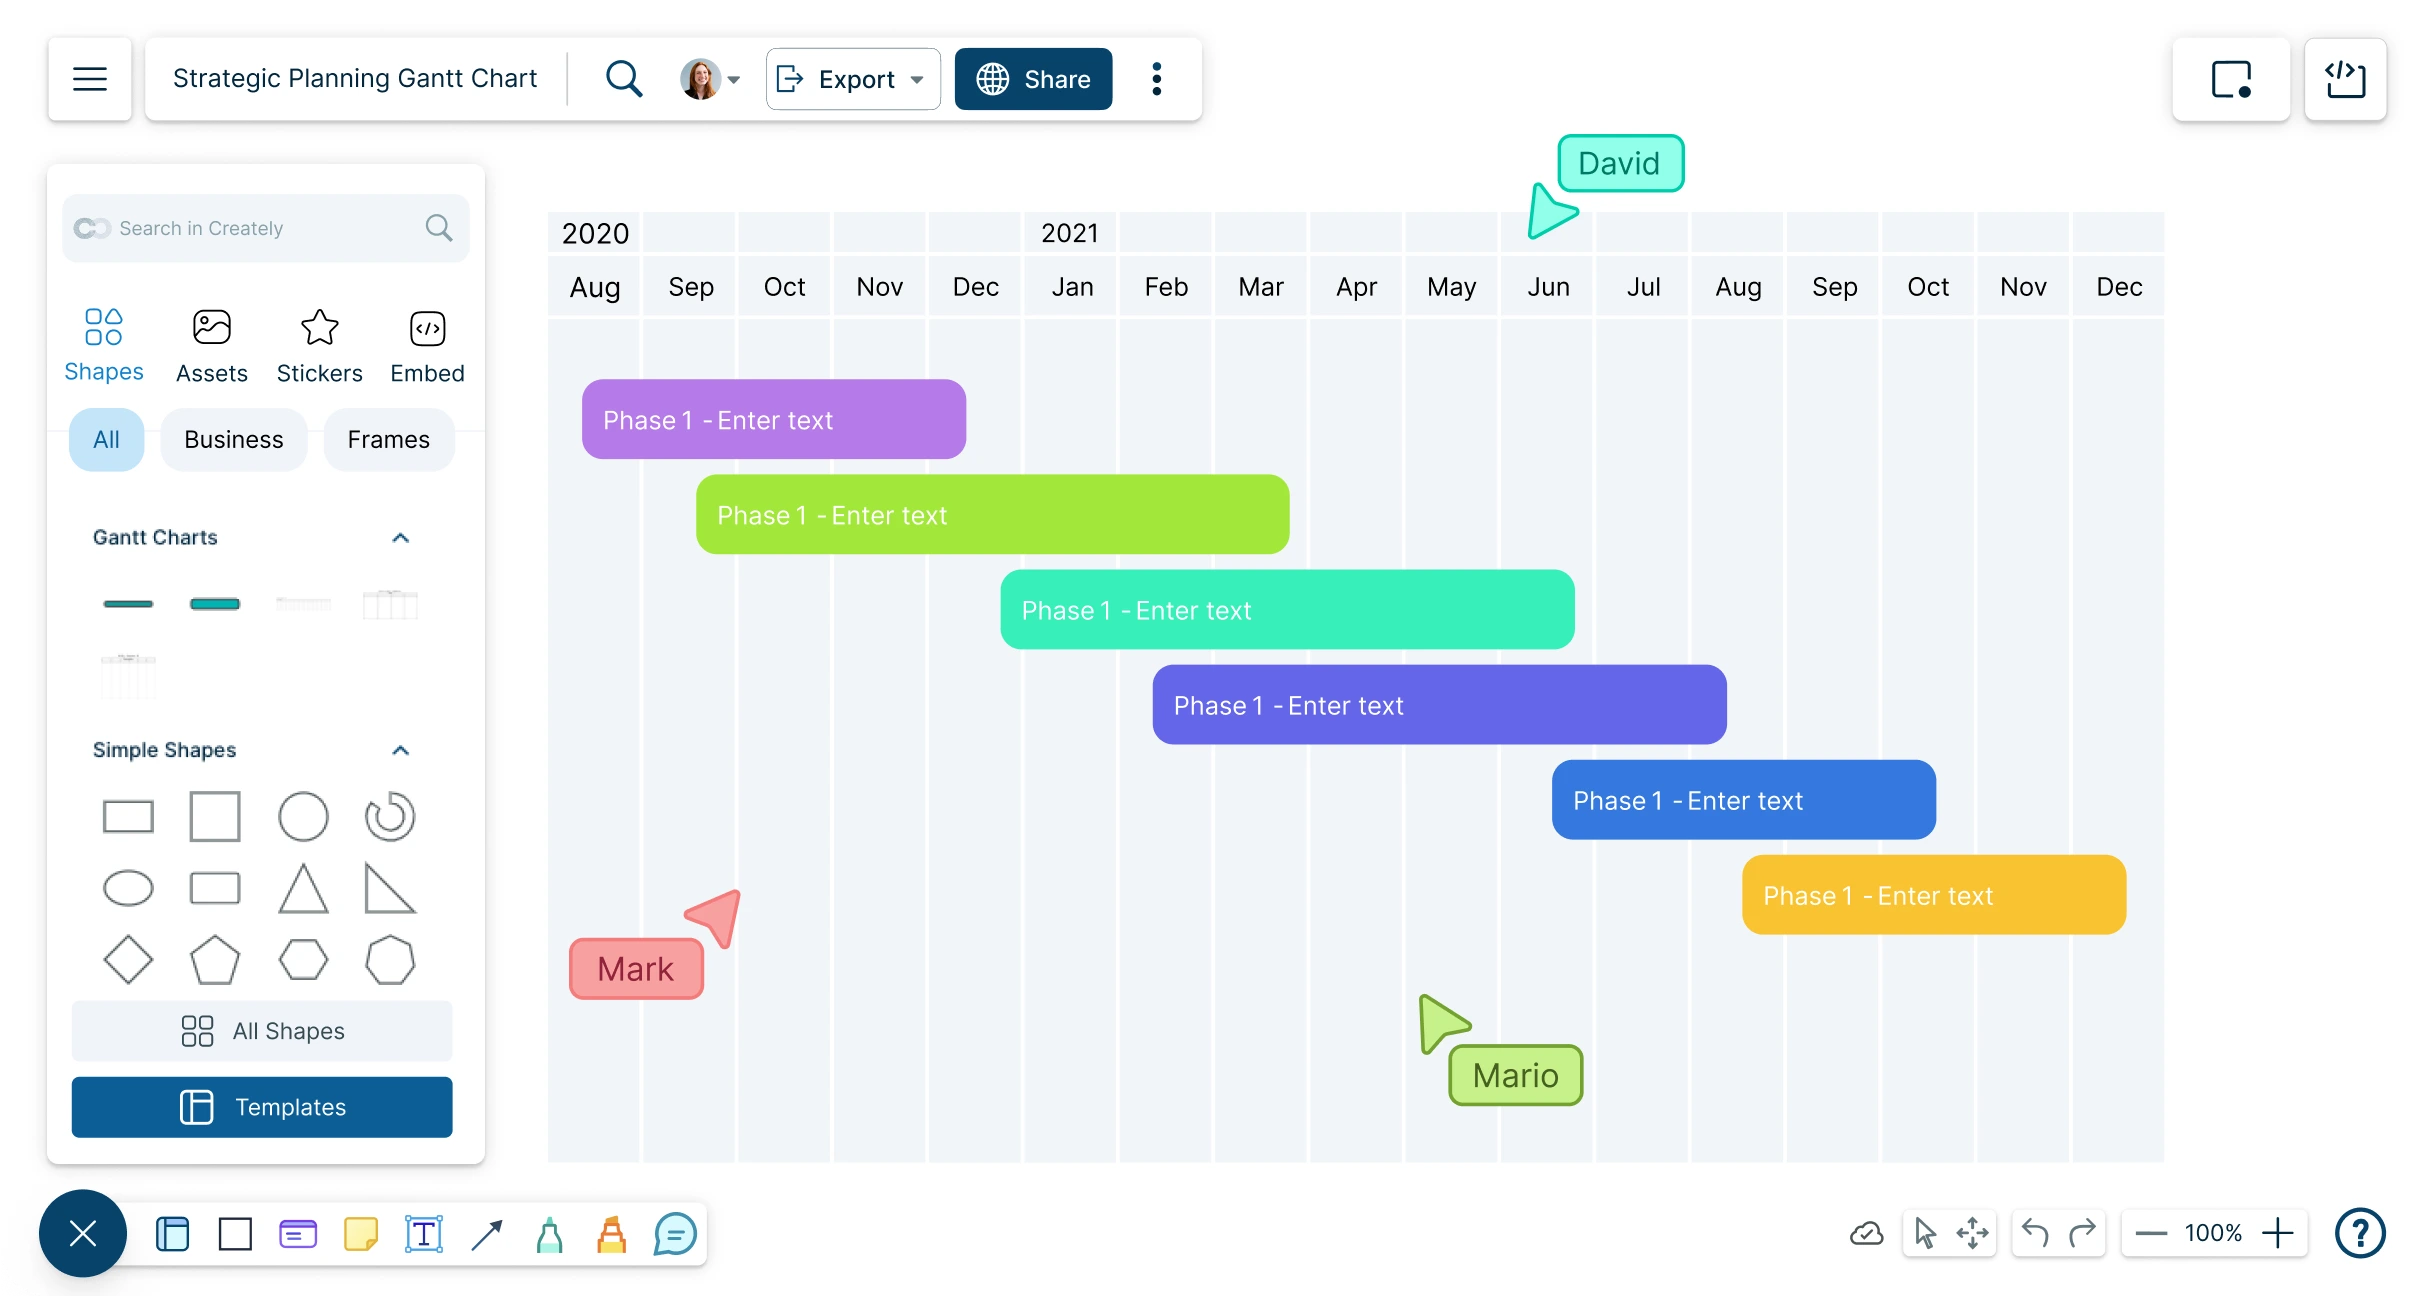
Create timelines for any event; track and analyze your team’s projects and tasks from start to finish with Creately’s Online Gantt Charts.
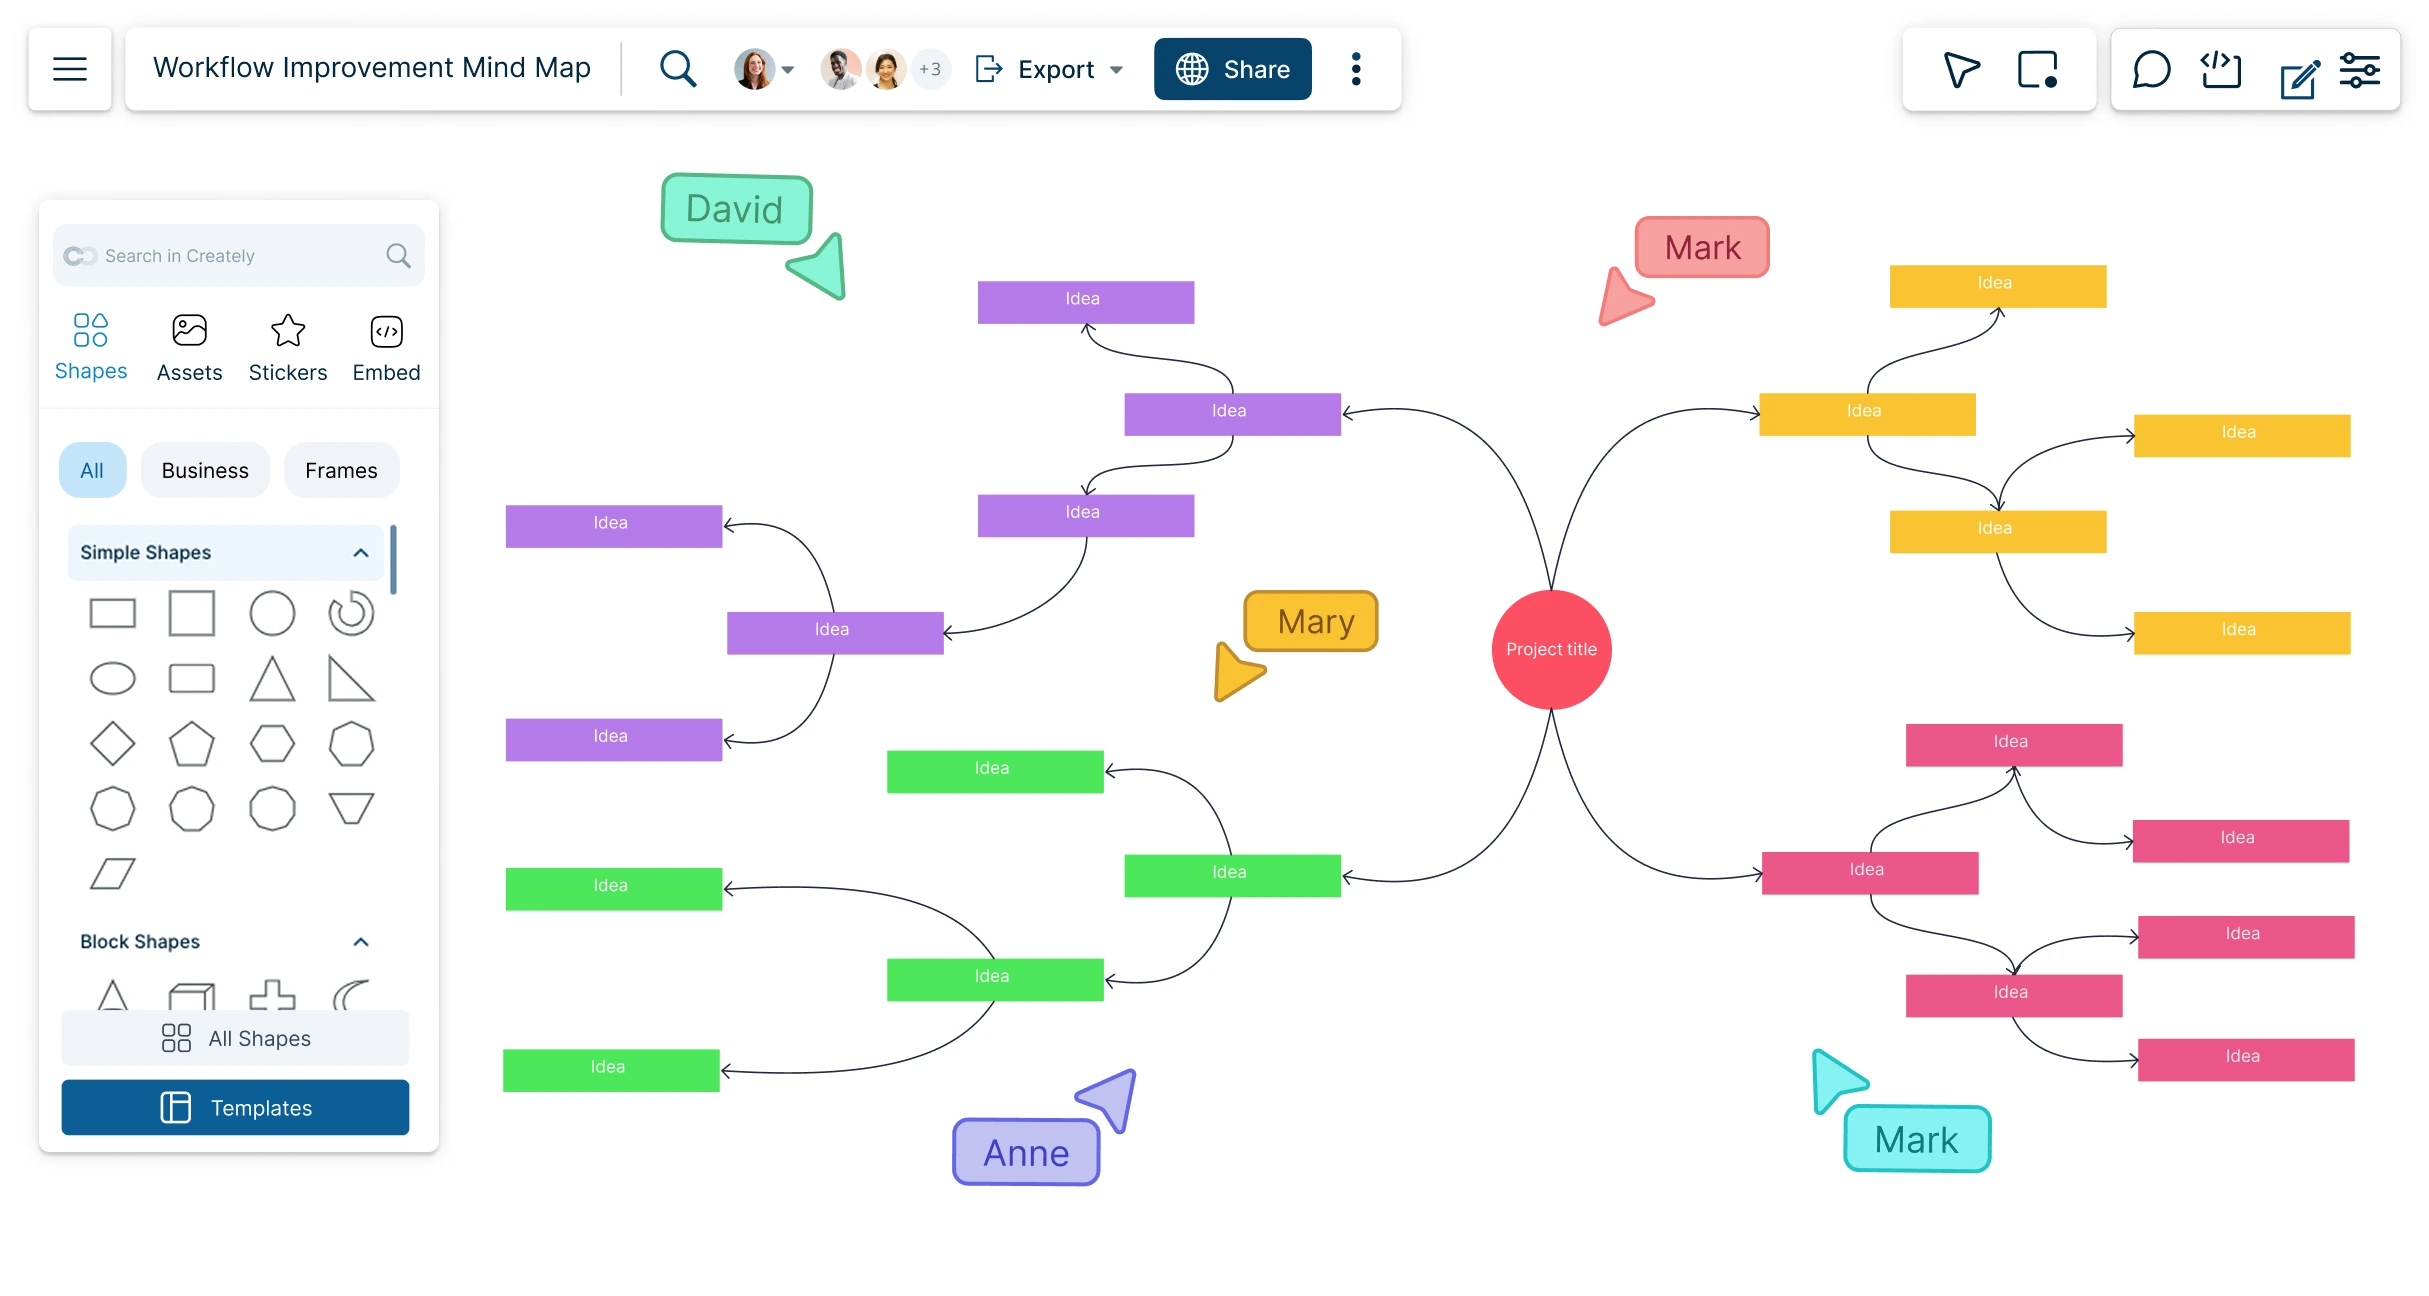
Use the mind map online tool to visualize ideas and concepts for collaborative brainstorming, creative thinking, problem-solving, and so much more.
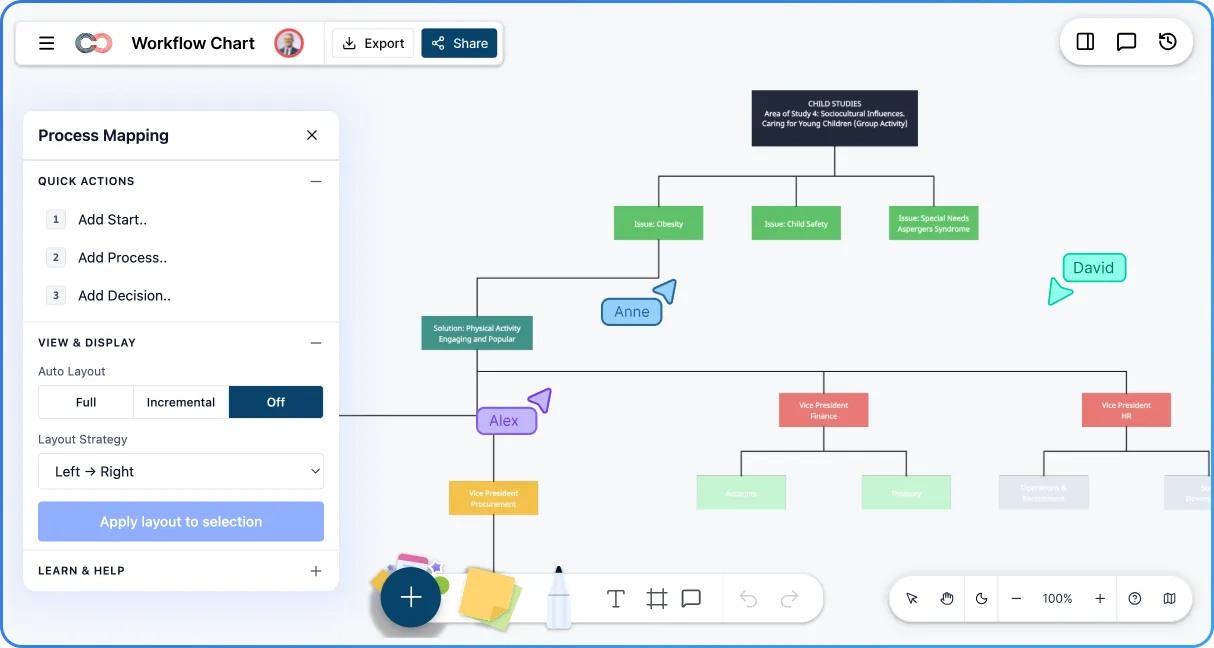
Visualize tasks, decisions, and handoffs clearly with Creately’s Workflow Chart Creator. Build professional workflow charts faster, improve team clarity, and keep every process running smoothly from start to finish.
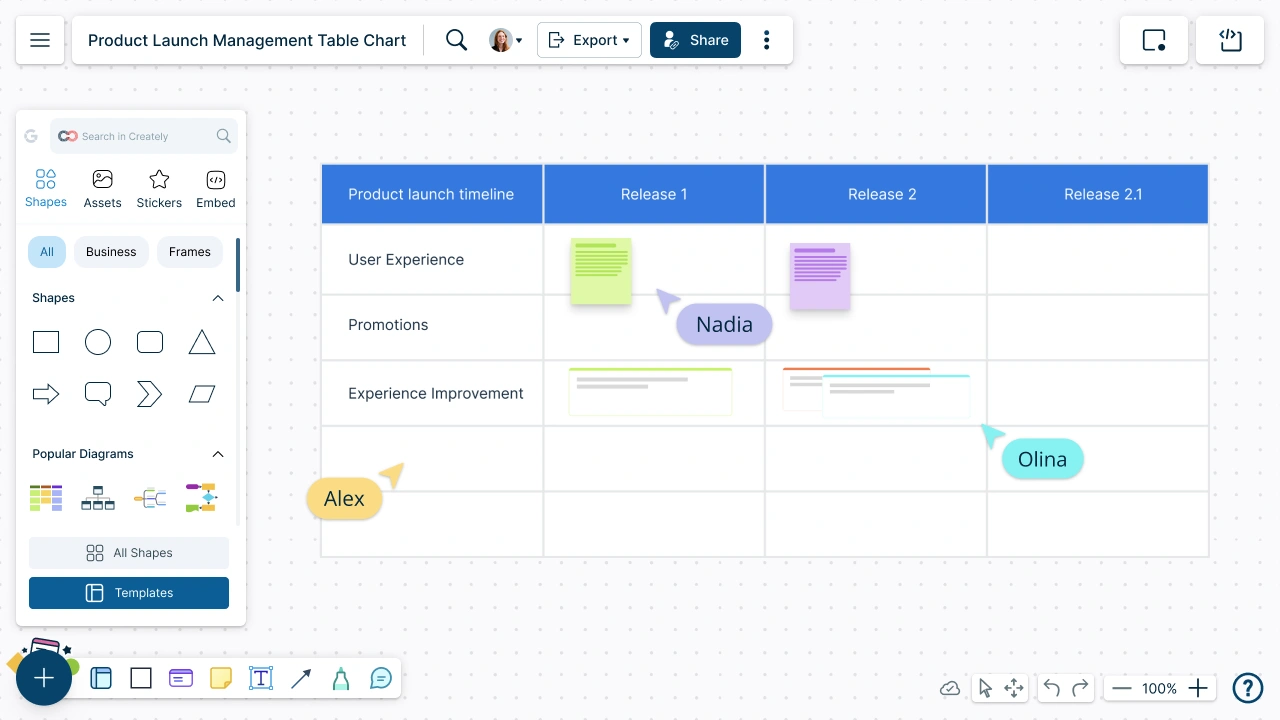
Create visually stunning table charts to organize your information and data with Creately’s table creator. Arrange your data in meaningful ways and interact with them to make effective data-driven decisions.
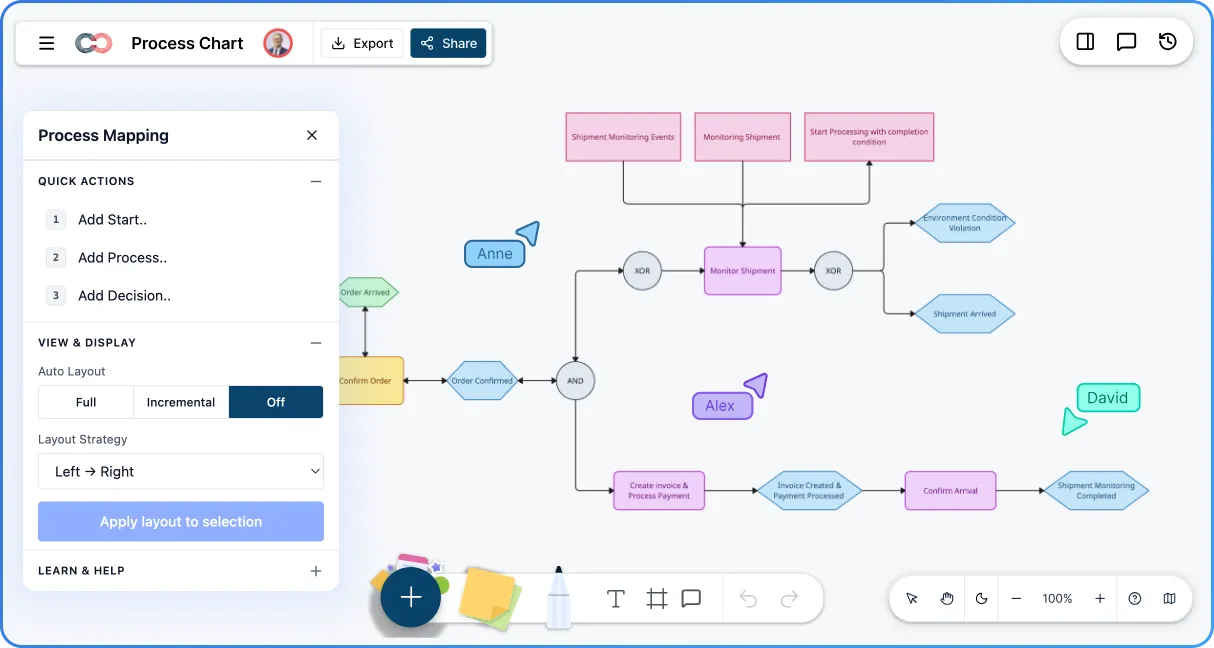
Map workflows online with clarity and precision. Creately’s process chart creator helps teams plan, refine, and execute processes efficiently—boosting collaboration and ensuring reliable results.
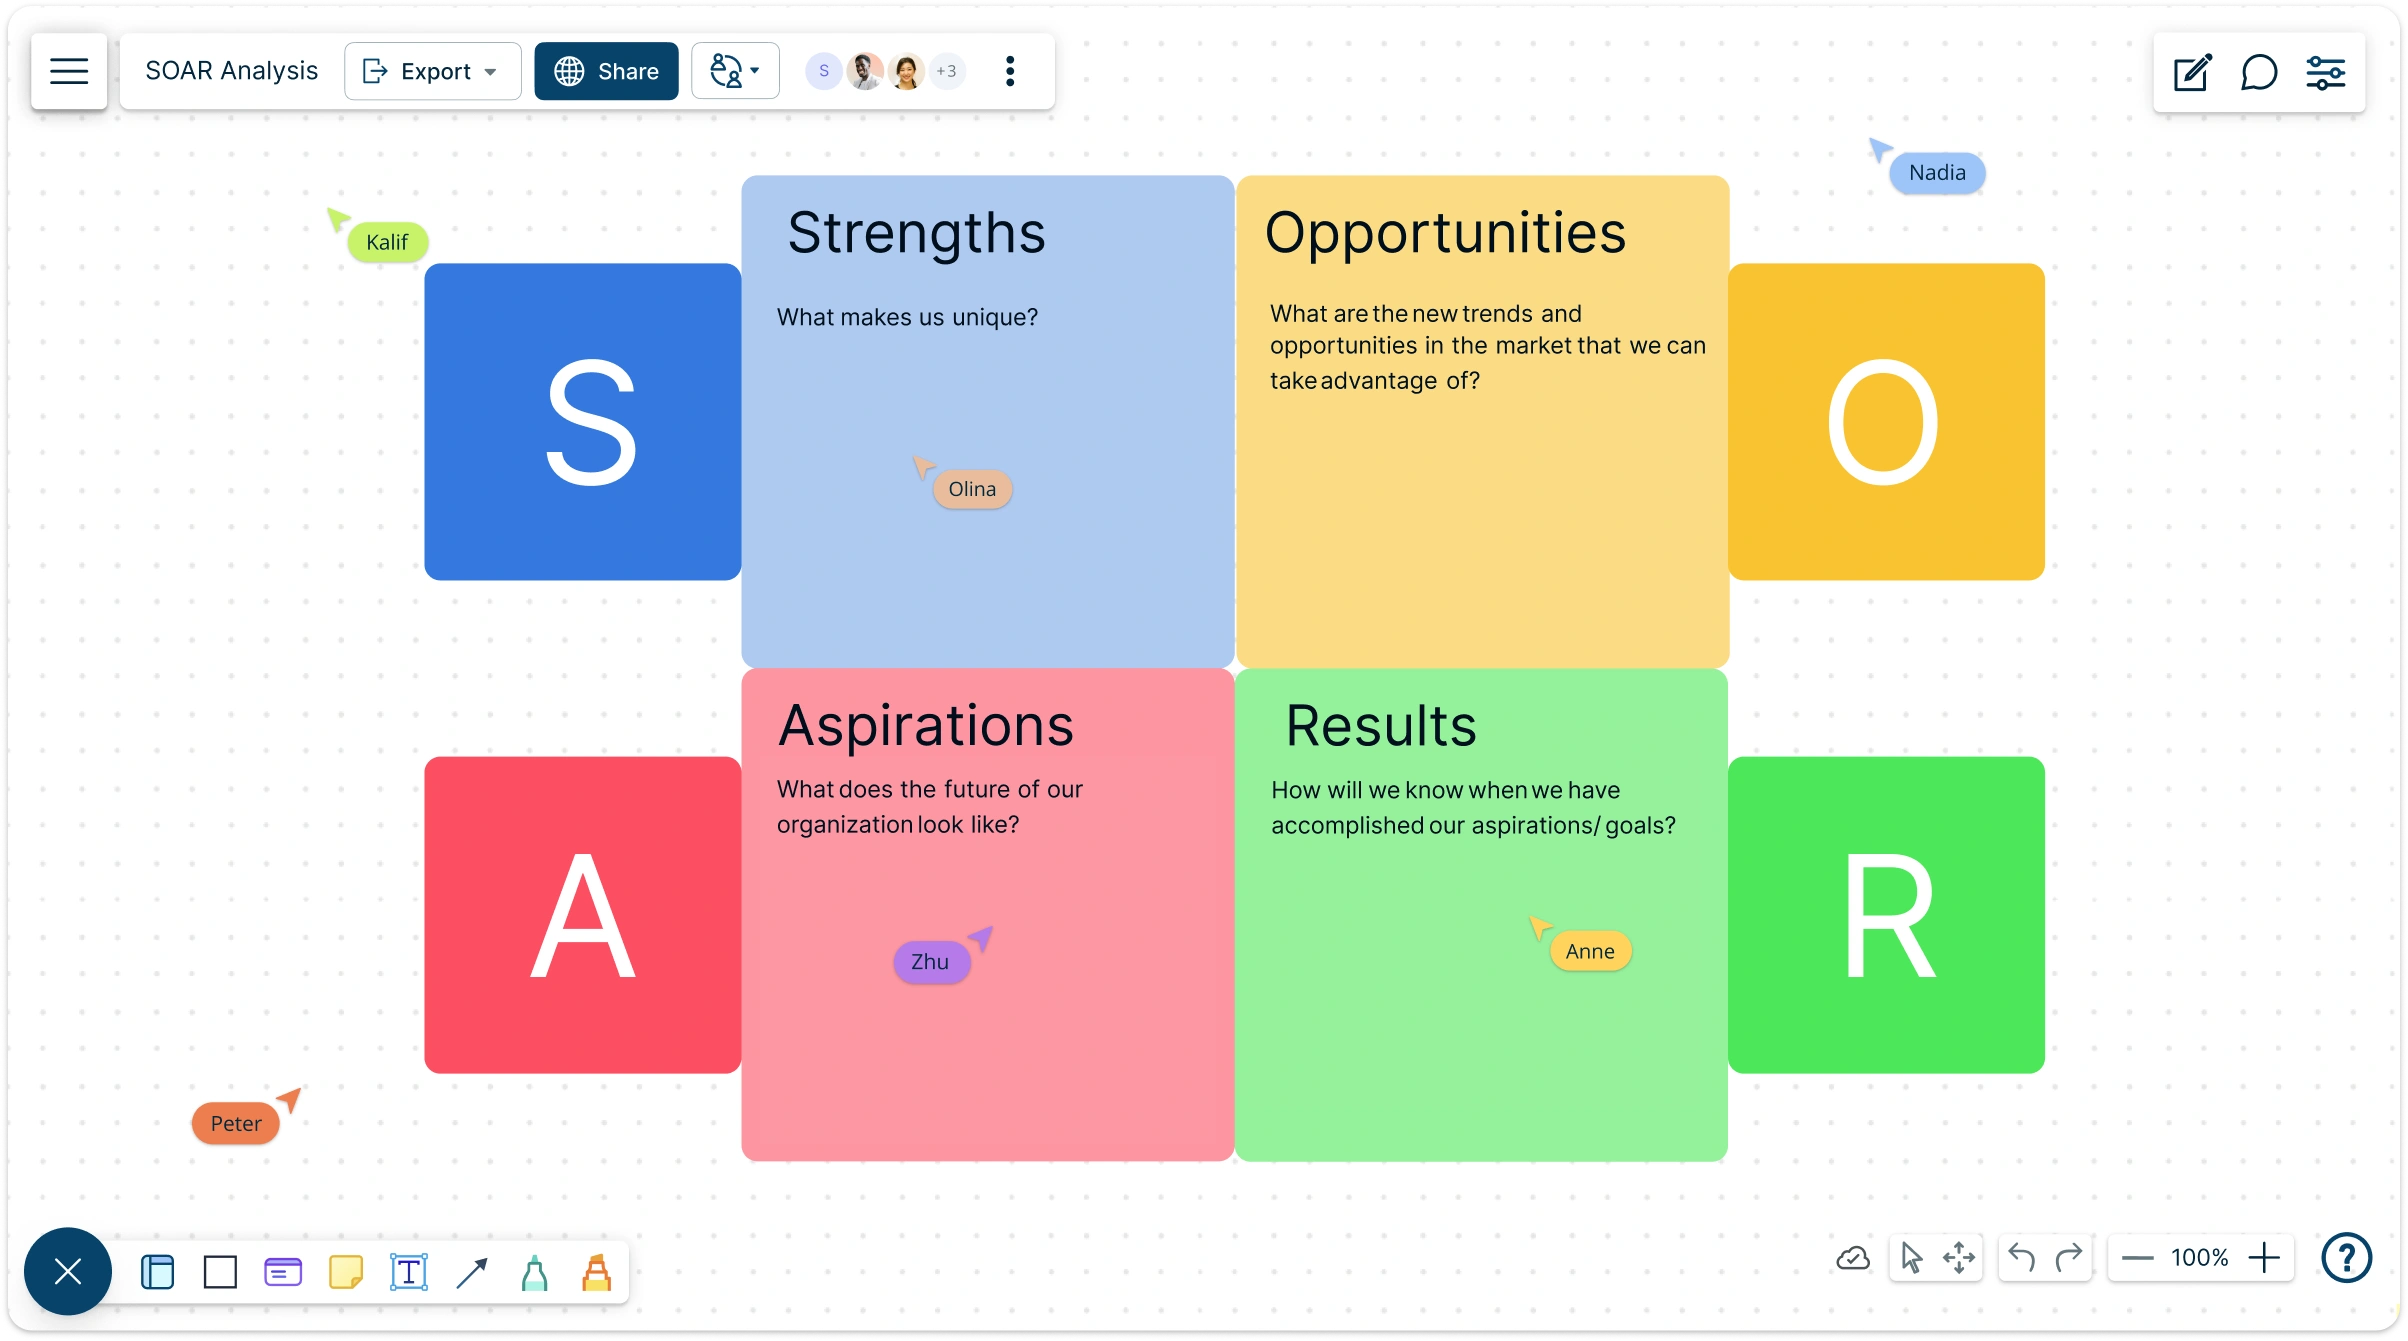
Visually analyze your organization’s strengths, opportunities, aspirations, and results to guide strategic planning.
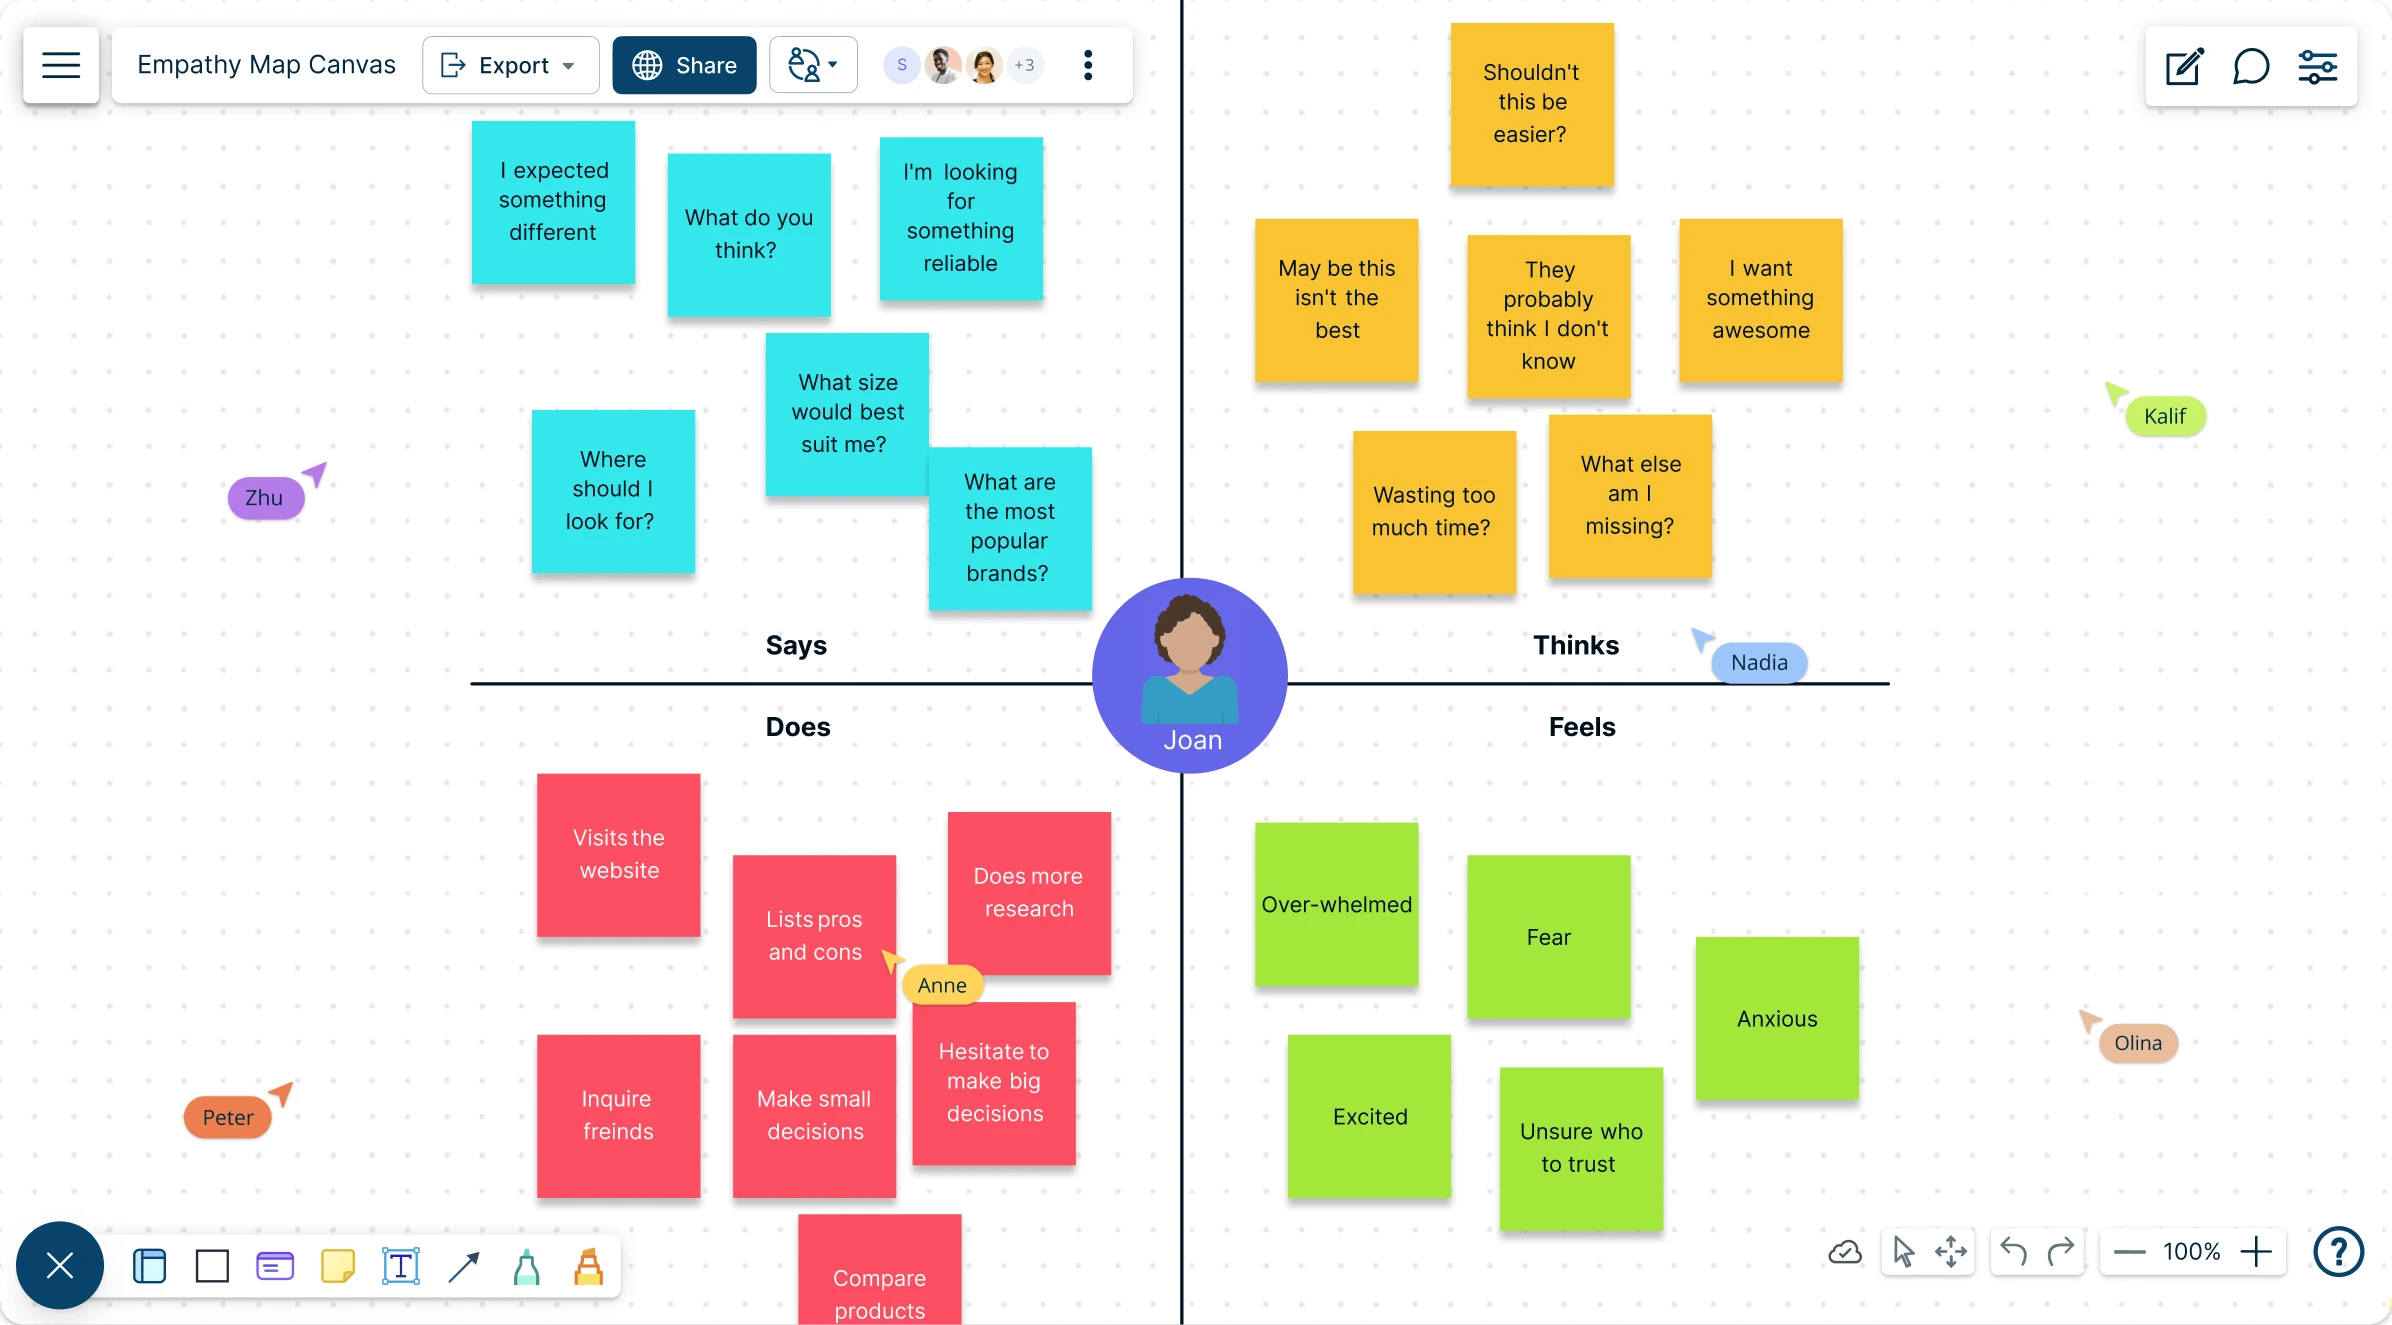
The Empathy Map Canvas helps teams build a strong, shared understanding and empathy for others. It’s used to enhance customer experience, manage internal dynamics, create better work environments, and much more.
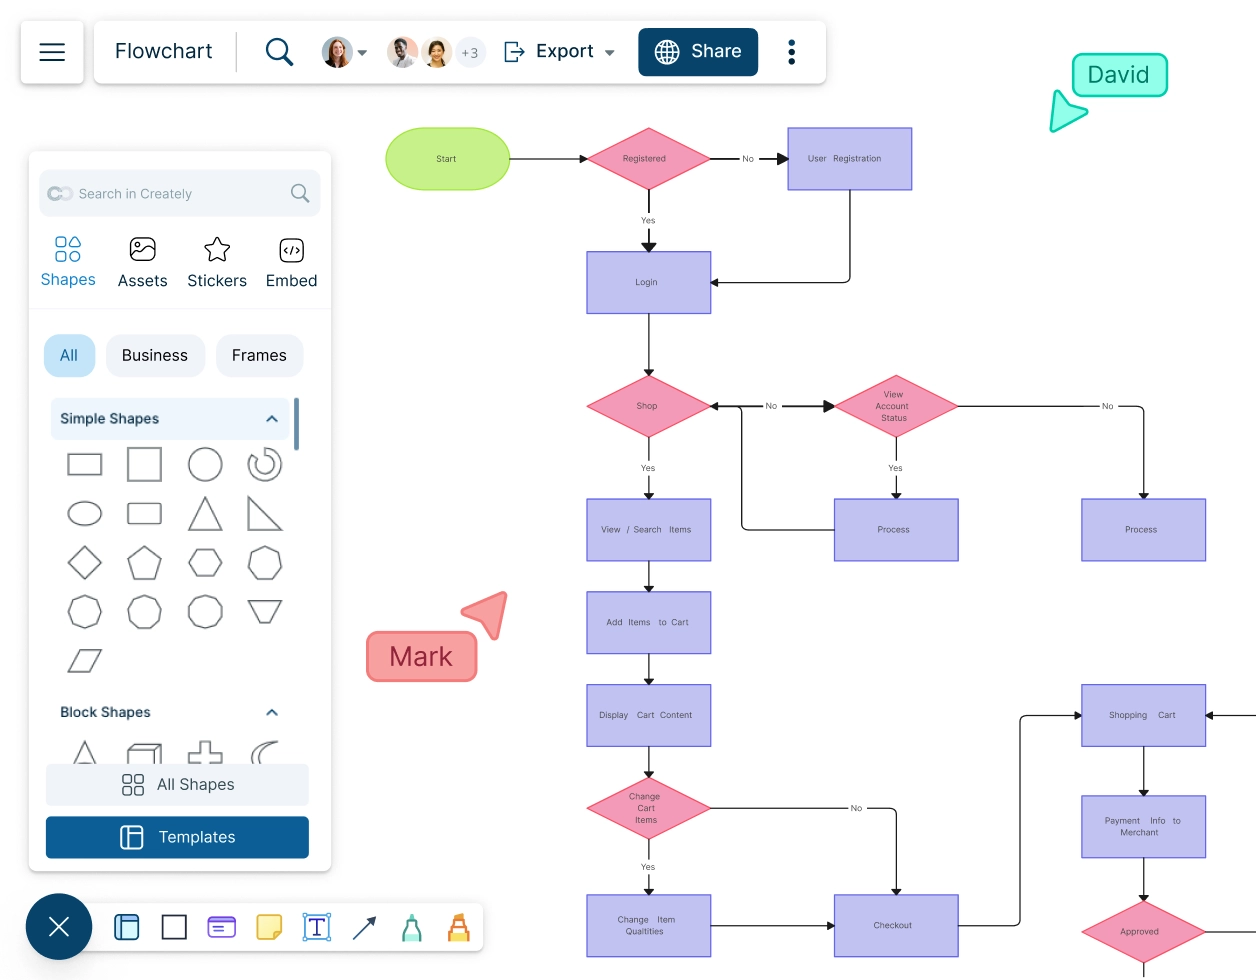
Visualize your workflows and processes to identify operational bottlenecks and areas for improvement with Creately’s Flowchart Creator.
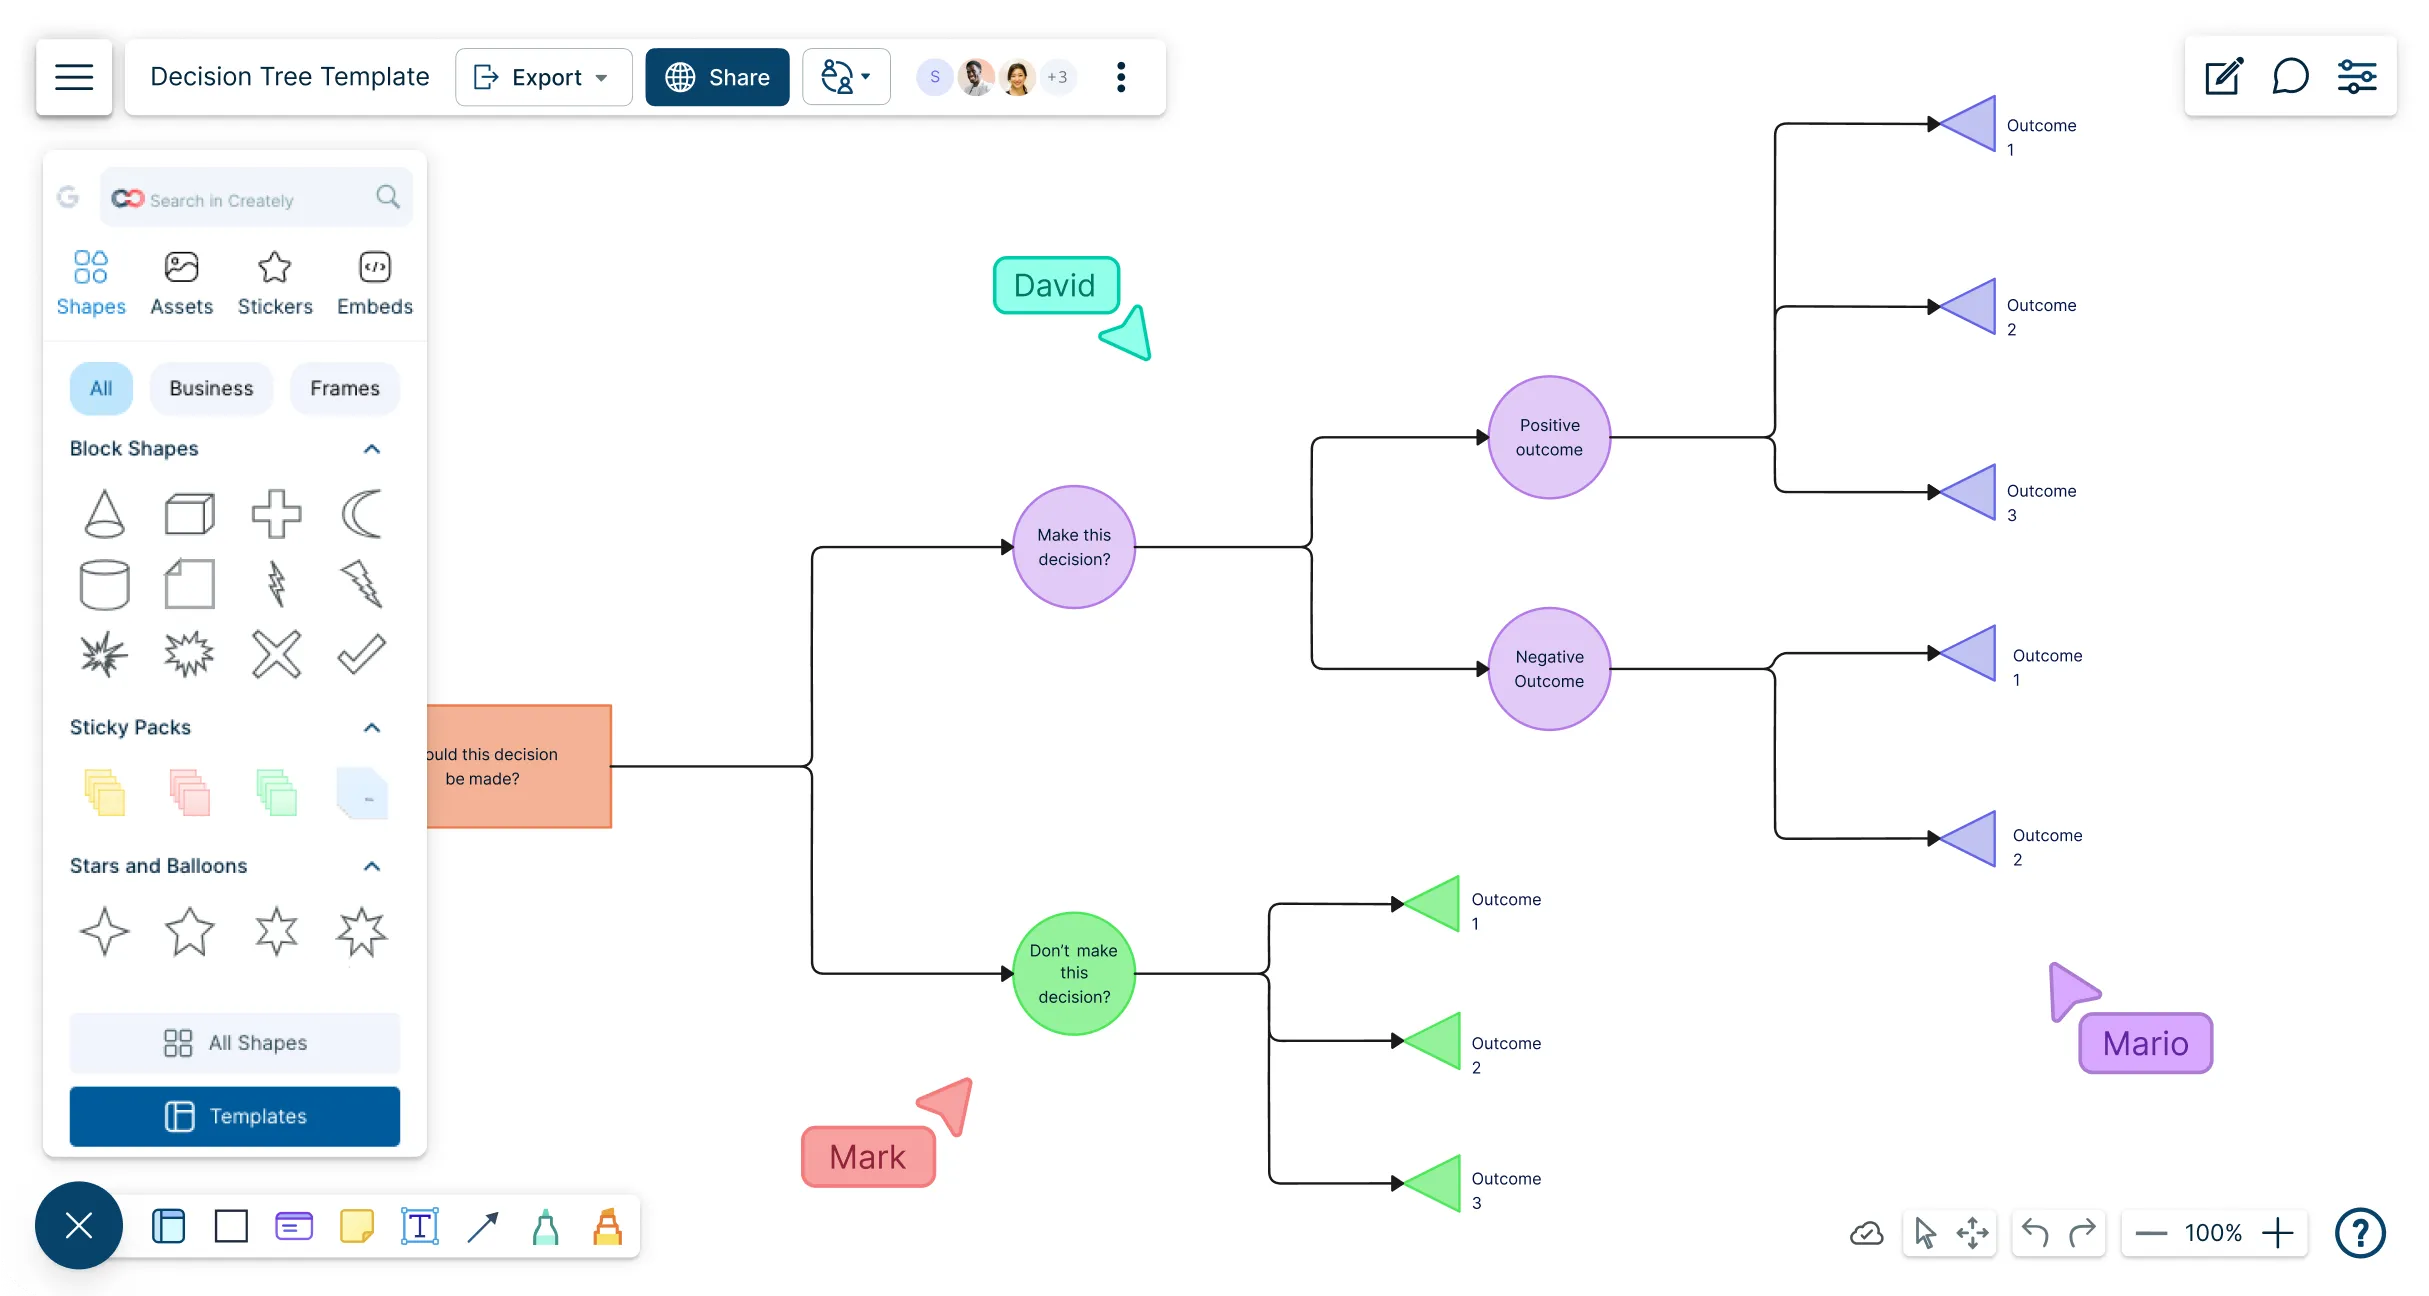
Visualize your decisions from anywhere using Creately’s decision tree diagram maker.
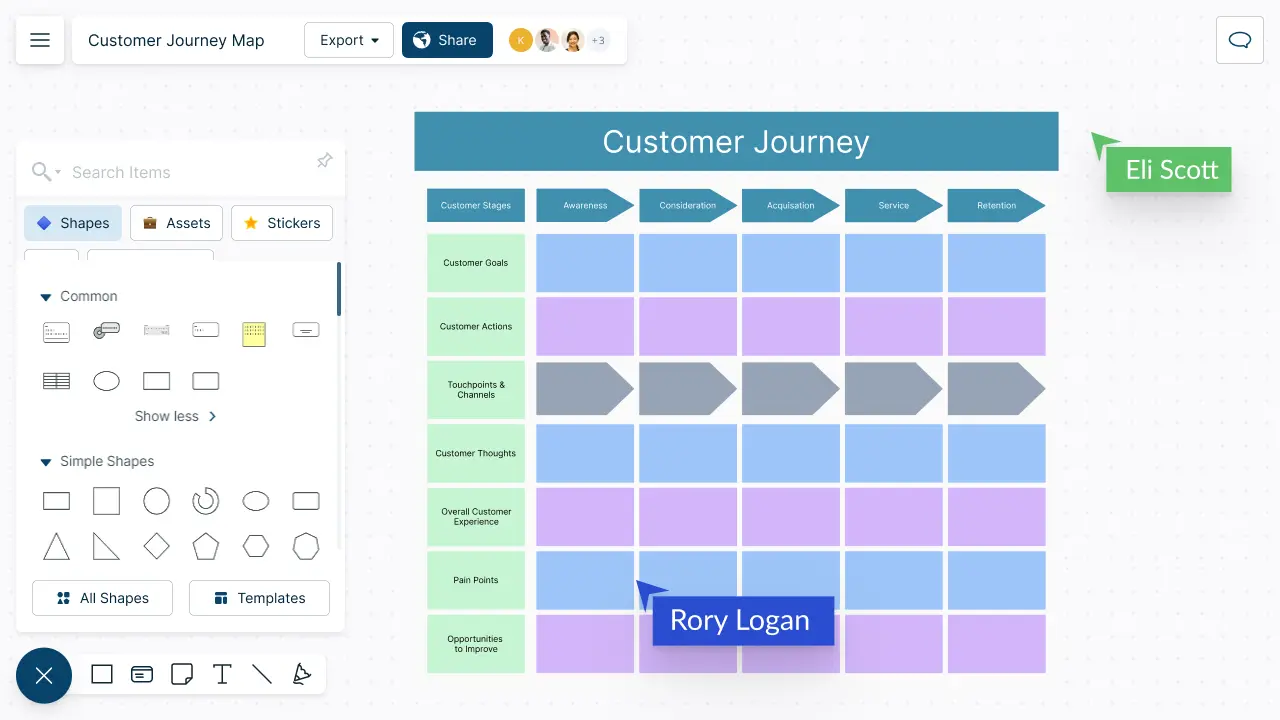
Use customer experience mapping templates to understand experiences at each stage, identifying needs, issues, and brand interactions.
Visually map out ideas and collaborate with team members to organize and structure information, innovations and processes.
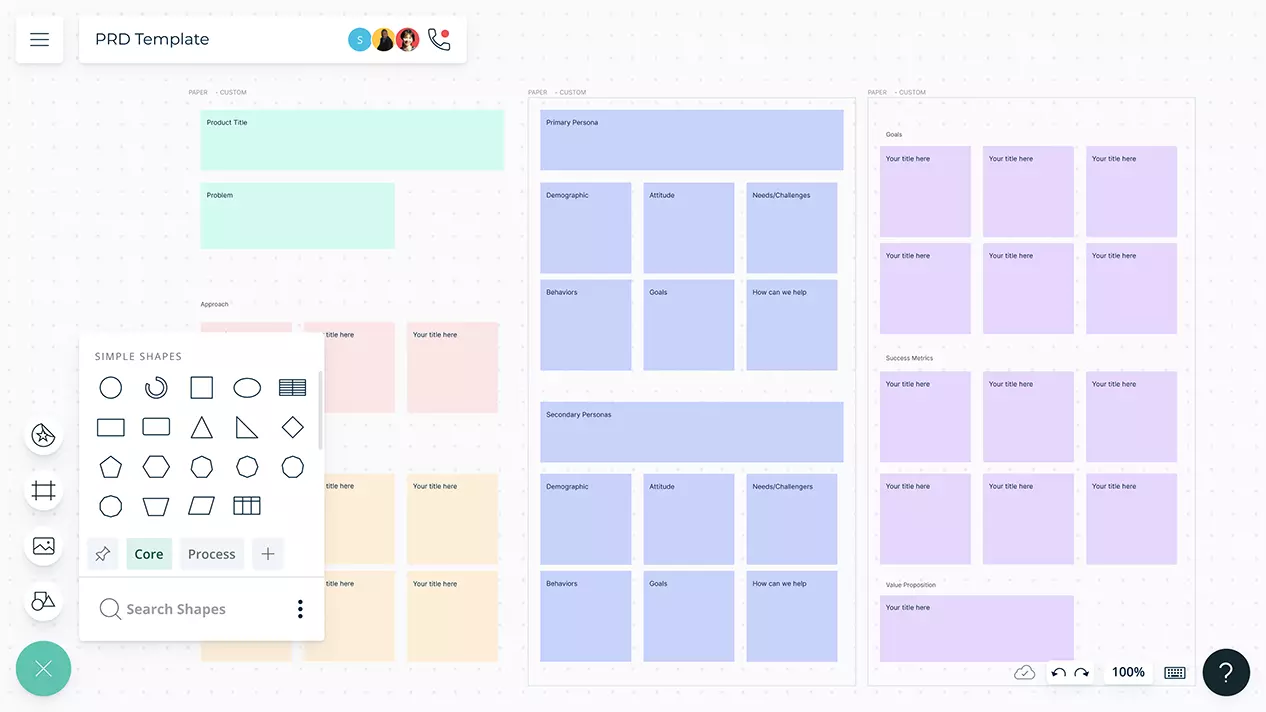
Describes the purpose, features, functionality, and behavior of the product you’re about to build.
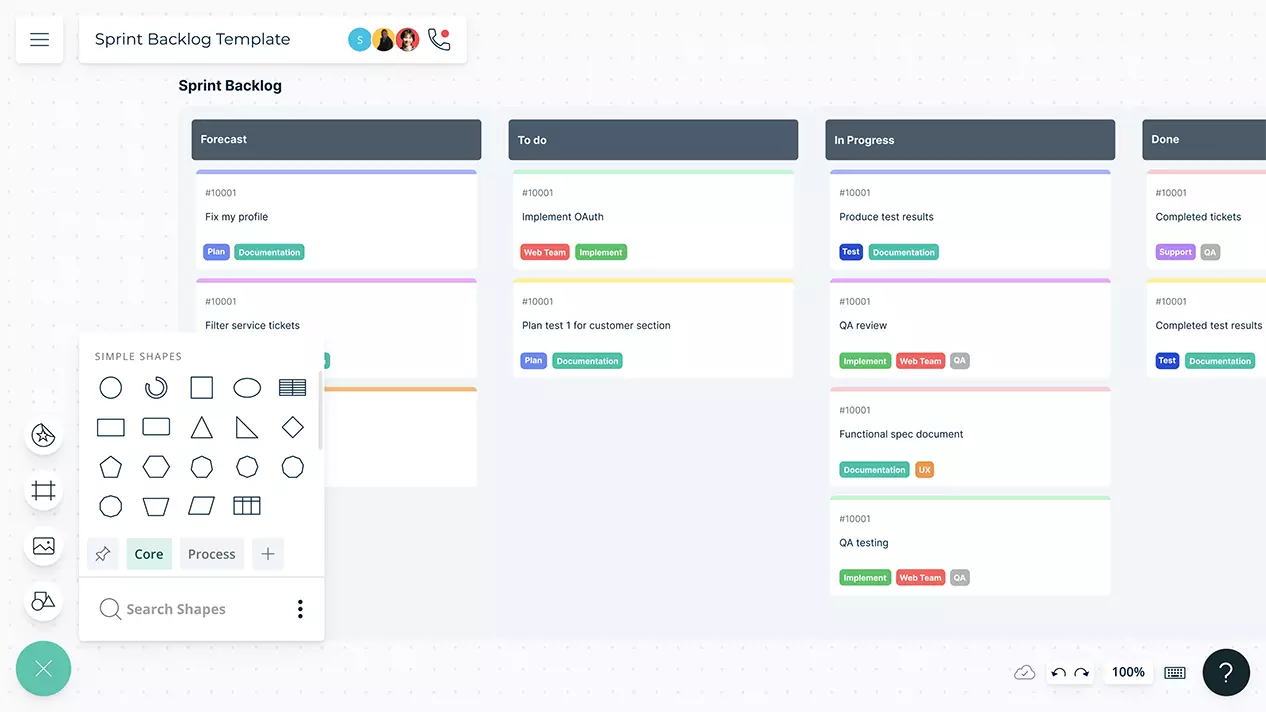
Visual framework to prioritize tasks and user stories from your product backlog to include in your weekly sprint.
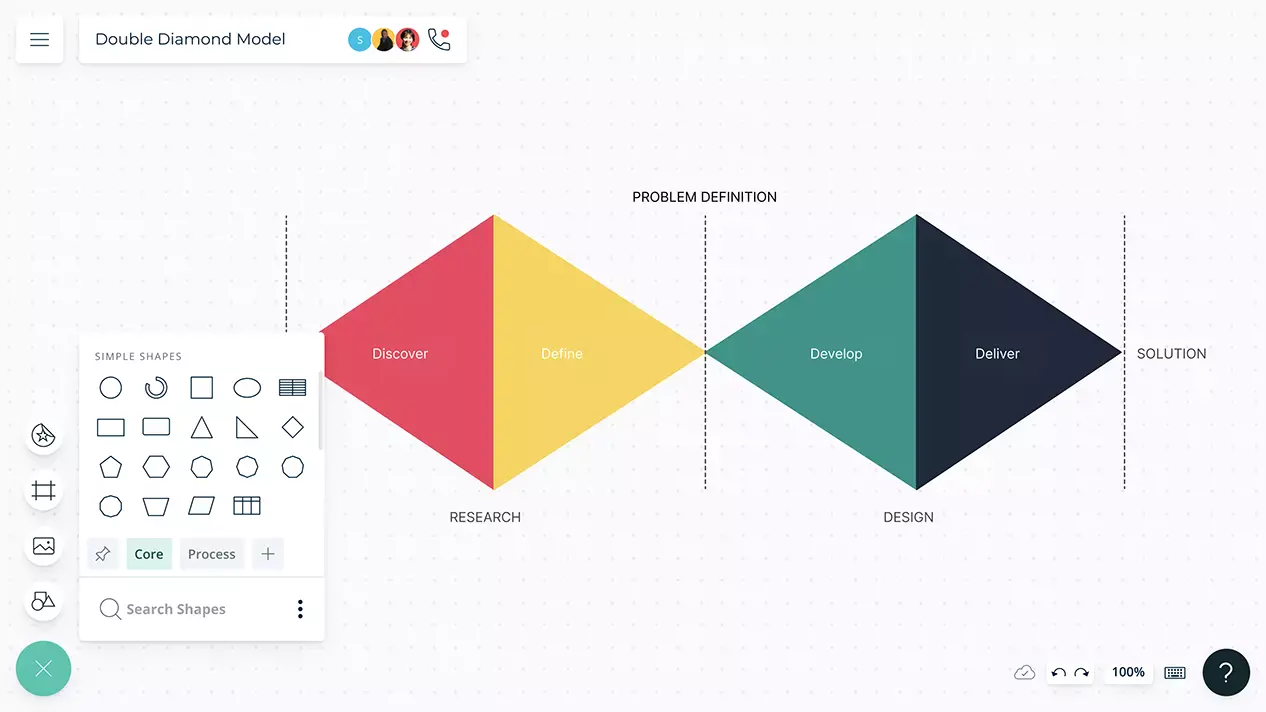
Unified workspaces with advanced real-time collaboration to organize and manage all the key design project stages.
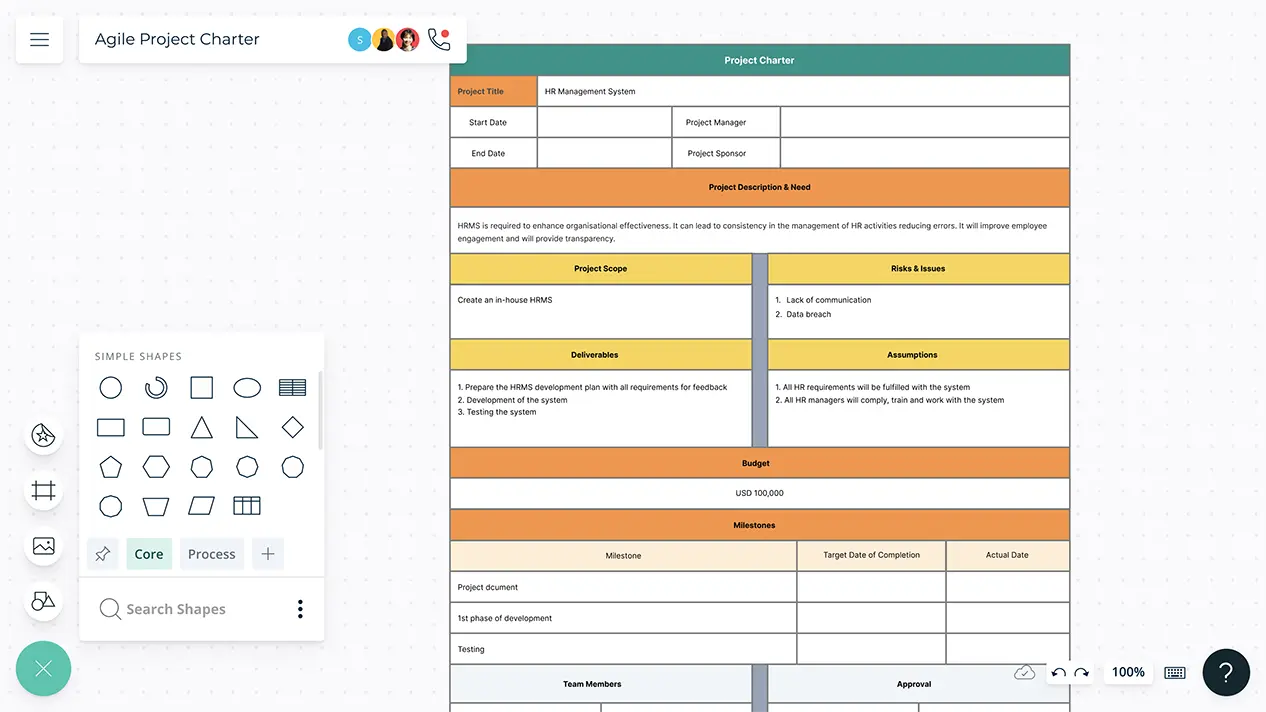
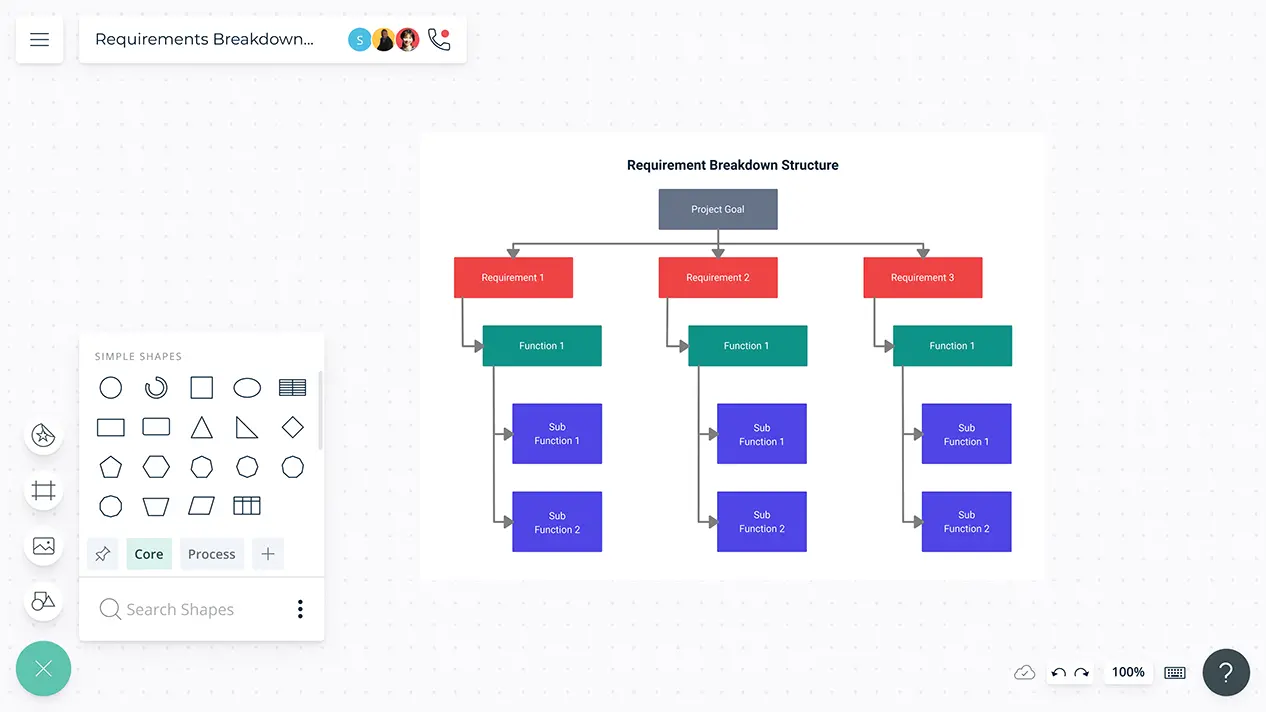
Structure your projects visually to define the project scope, goal and approach for better clarity and direction.
From ideation to release, collect actionable insights across teams to create better user experiences.
Visualize customer feedback and create a framework to translate them into product attributes.
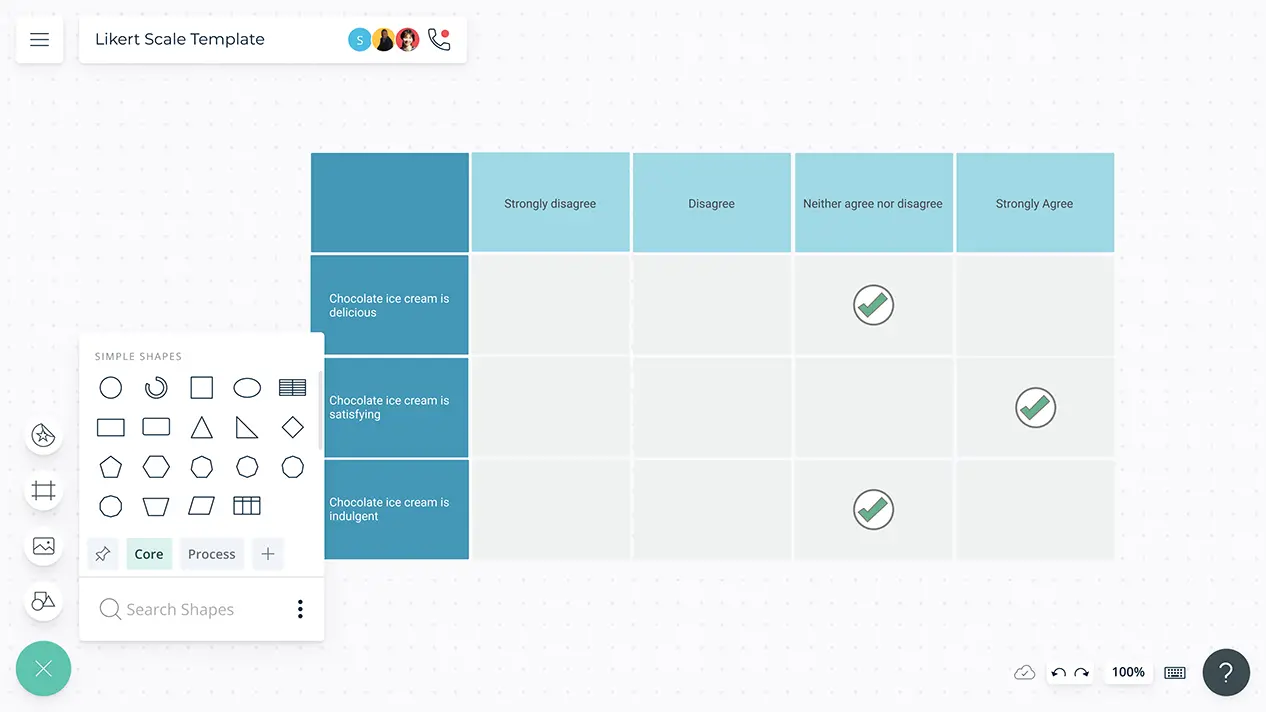
Whether you are conducting a customer survey or research-based study, the Likert scale template is an effective rating system that can be used to measure attitudes and sentiments of participants regarding a particular subject.
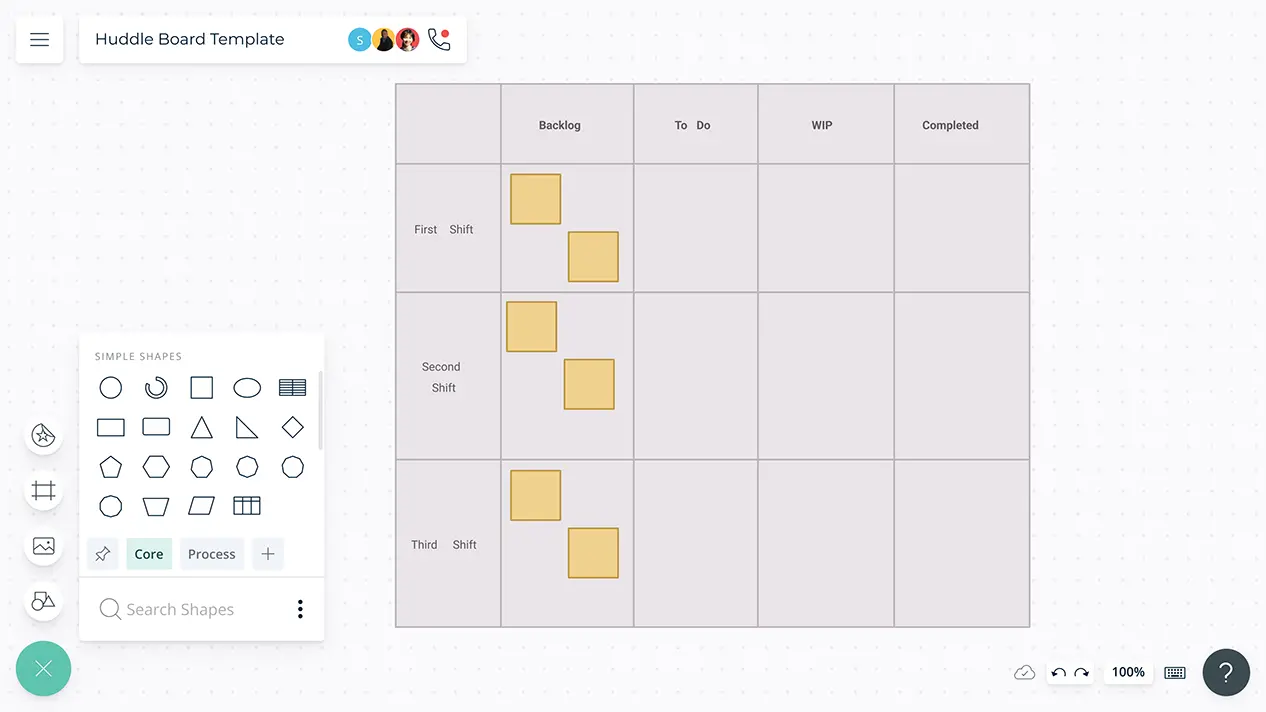
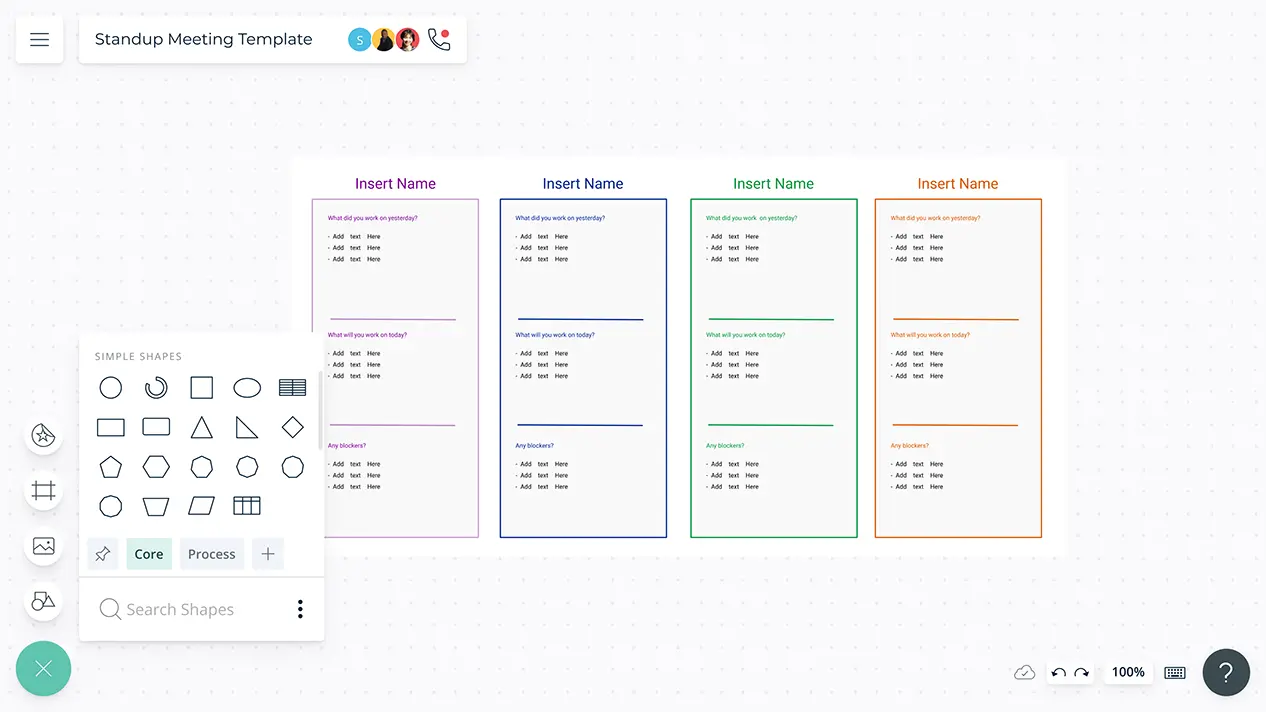
Conduct interactive team meetings that quickly take stock of project progress, identify blockers and plan next steps.
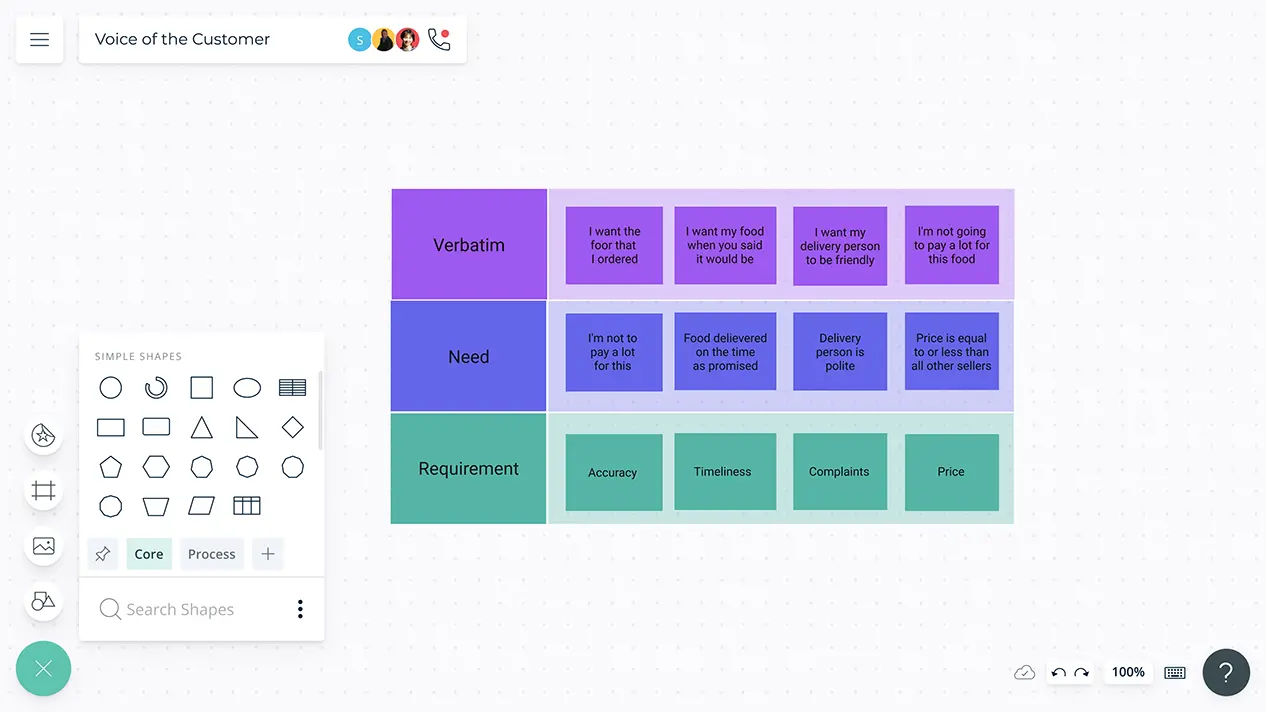
Categorize, capture, and organize all your customers’ needs to create compelling customer experiences.
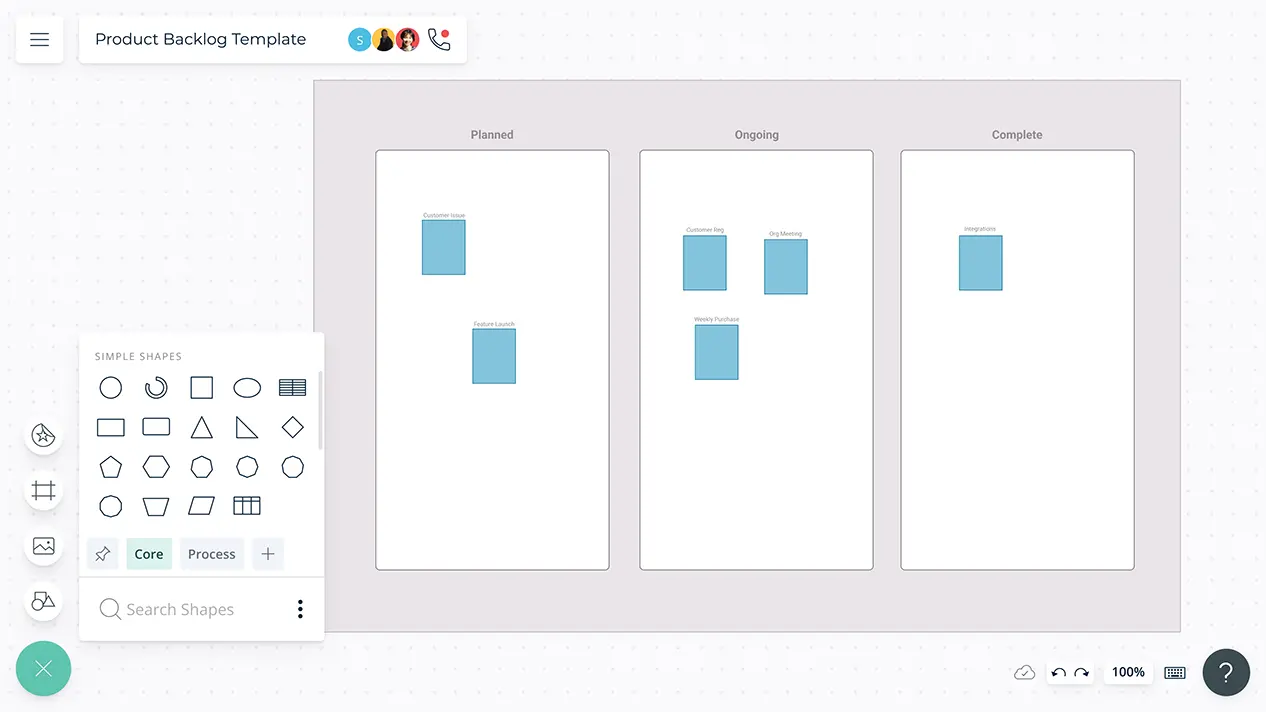
Visual framework to store and prioritize user stories and effectively manage your Agile development process.
Collaborate seamlessly on innovative new product ideas with interactive online templates.
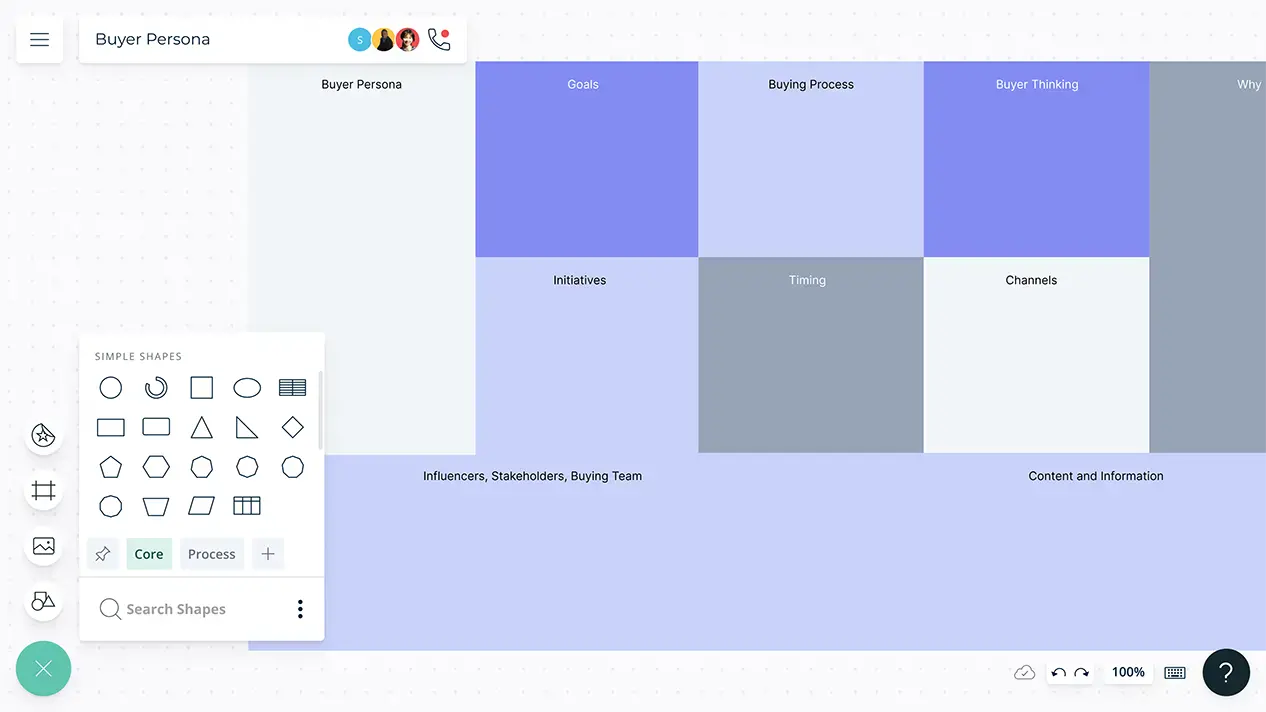
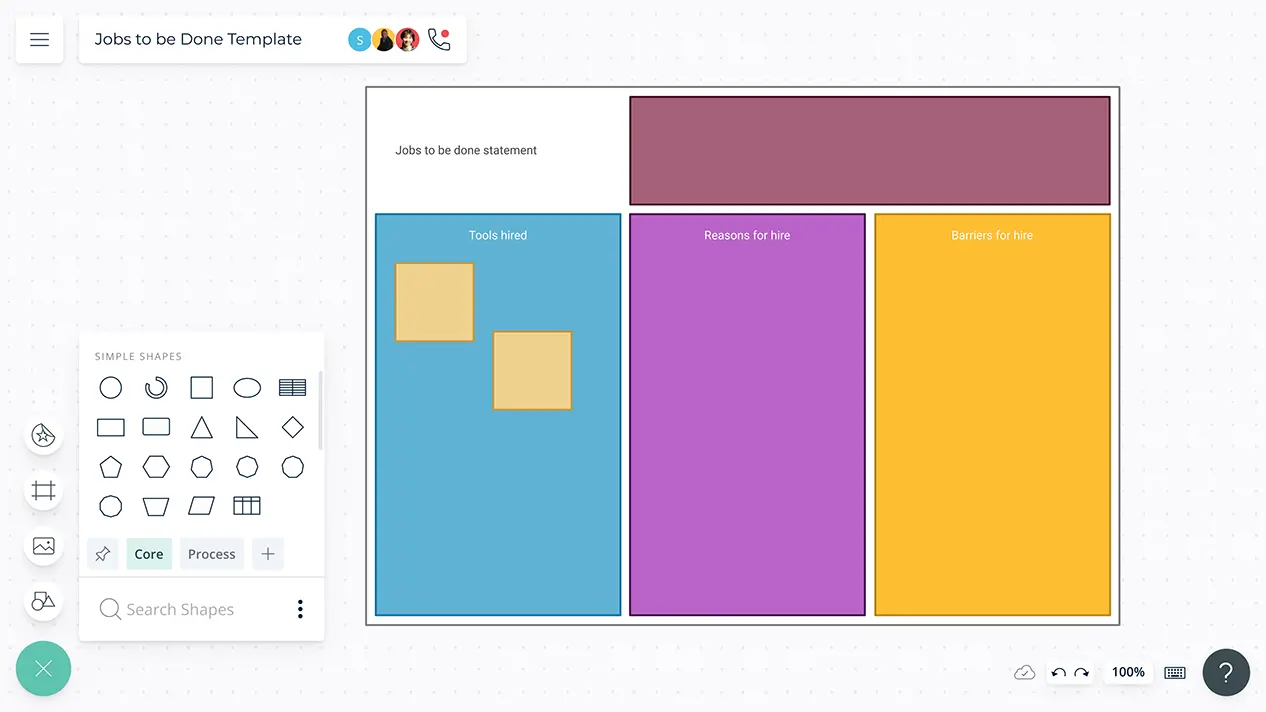
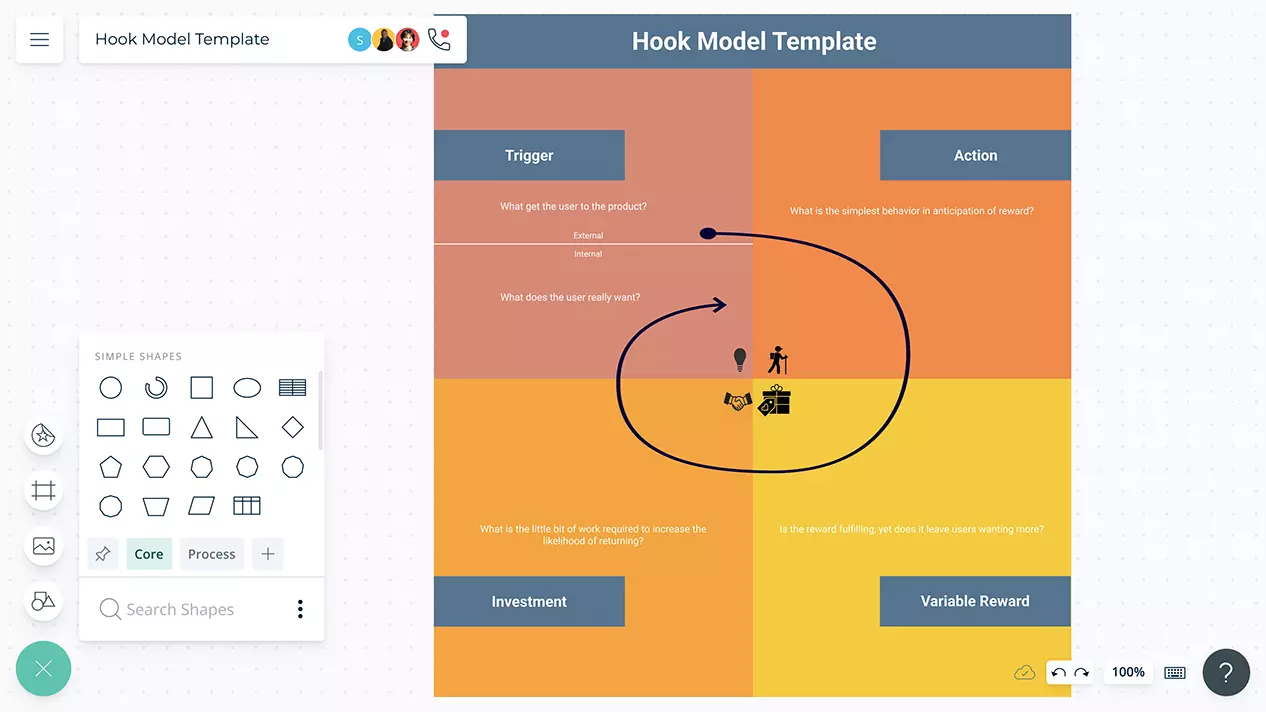
Design better products that integrate into consumer habits and routines with Creately.
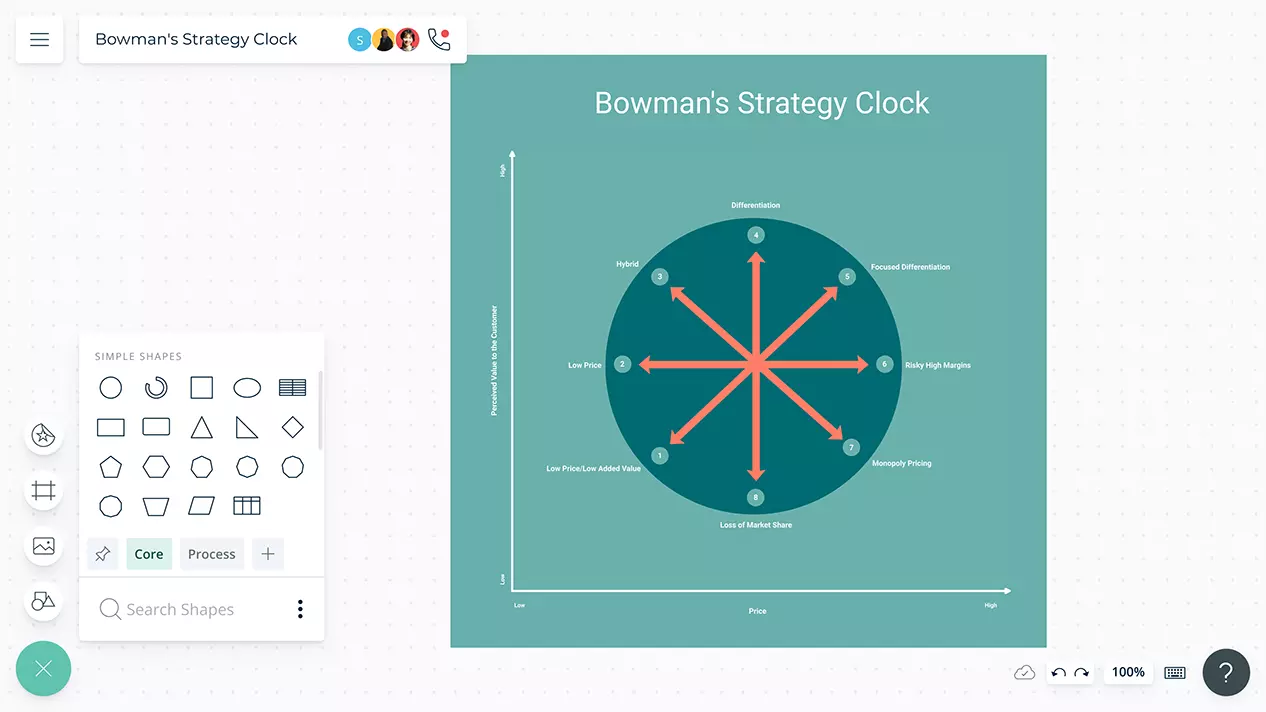
Explore potential opportunities for strategic positioning. Determine the positioning of your product or service based on the price and perceived value.
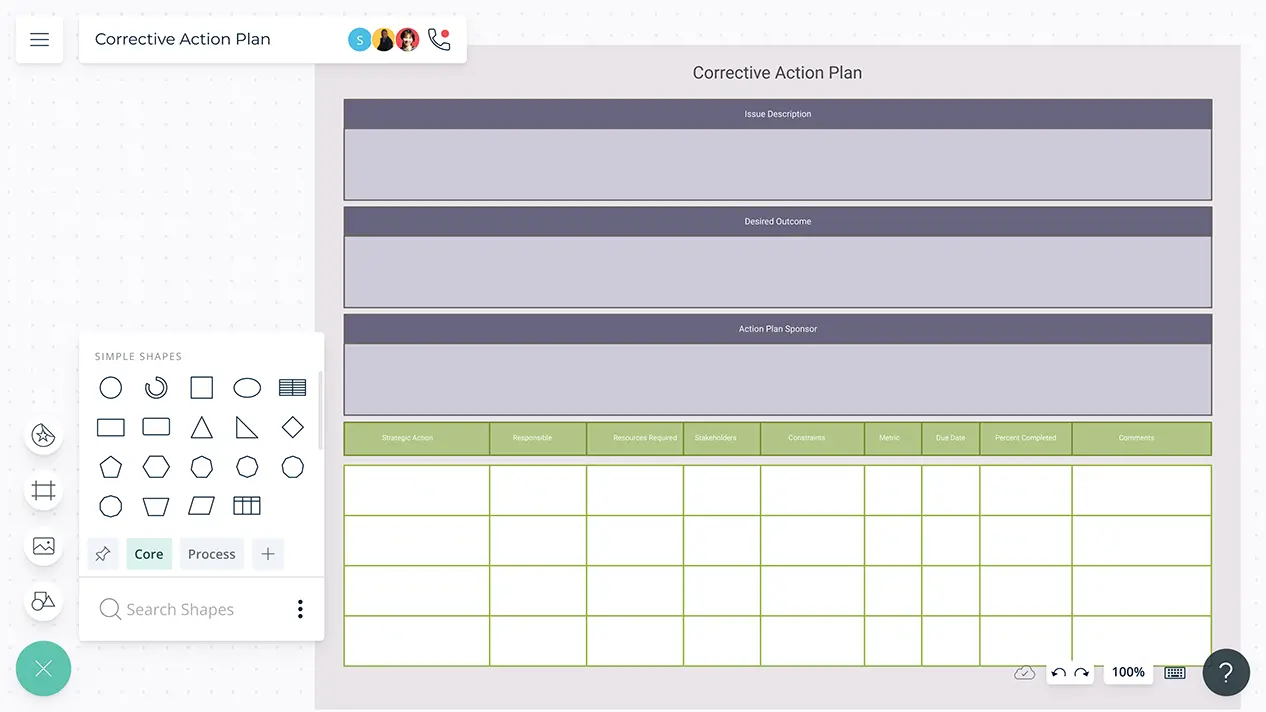
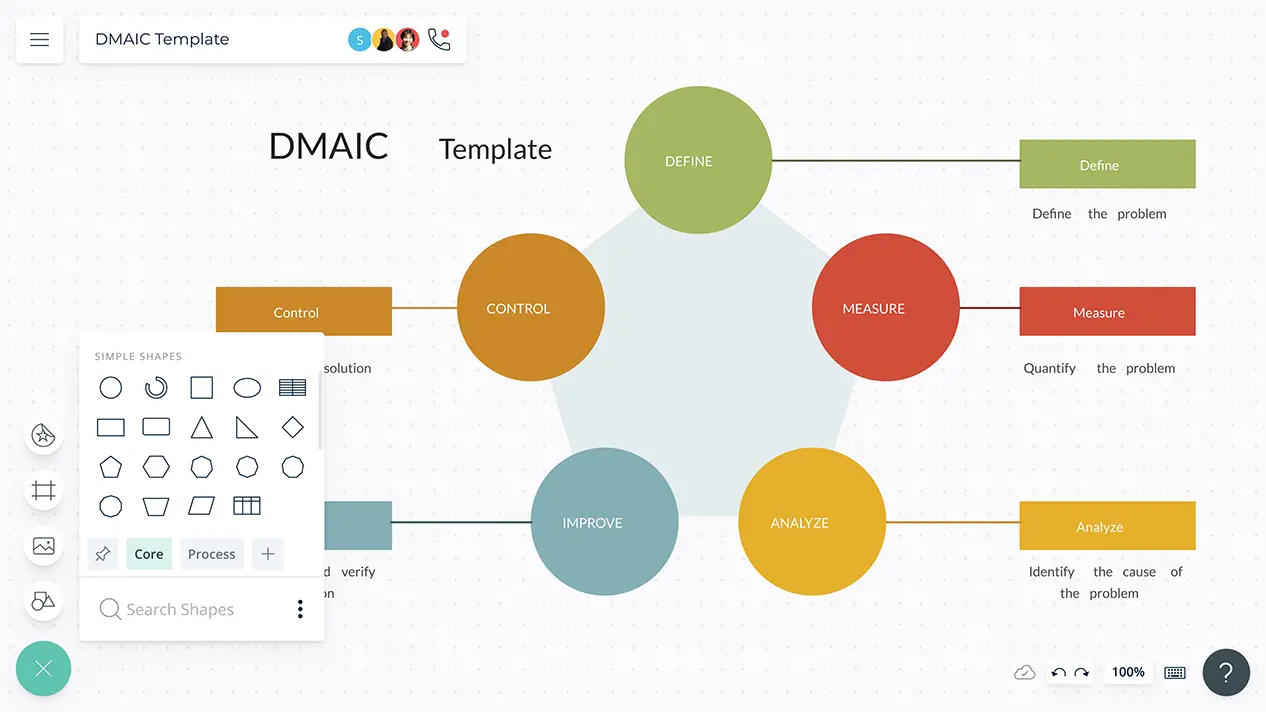
Improve inefficient processes in your organization by identifying root causes of problems and successfully mapping out corrective actions.
Understand business requirements and areas of improvement to enhance the productivity of workflows and streamline business operations.
A single connected visual workspace to get your team to synchronize, collaborate, and align on workflows, objectives, and releases.
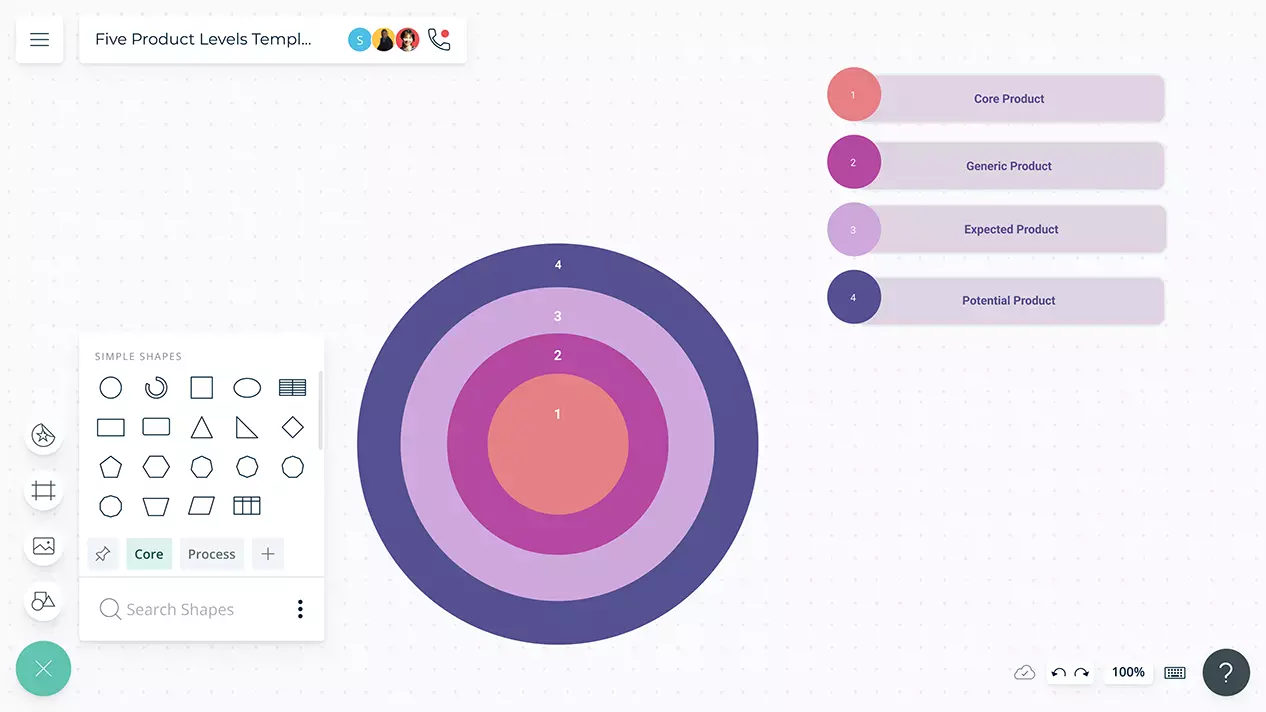
Easily identify how your products align with market needs for better design, position, and strategy.
Visually identify all activities that must be completed to achieve a specific business goal.
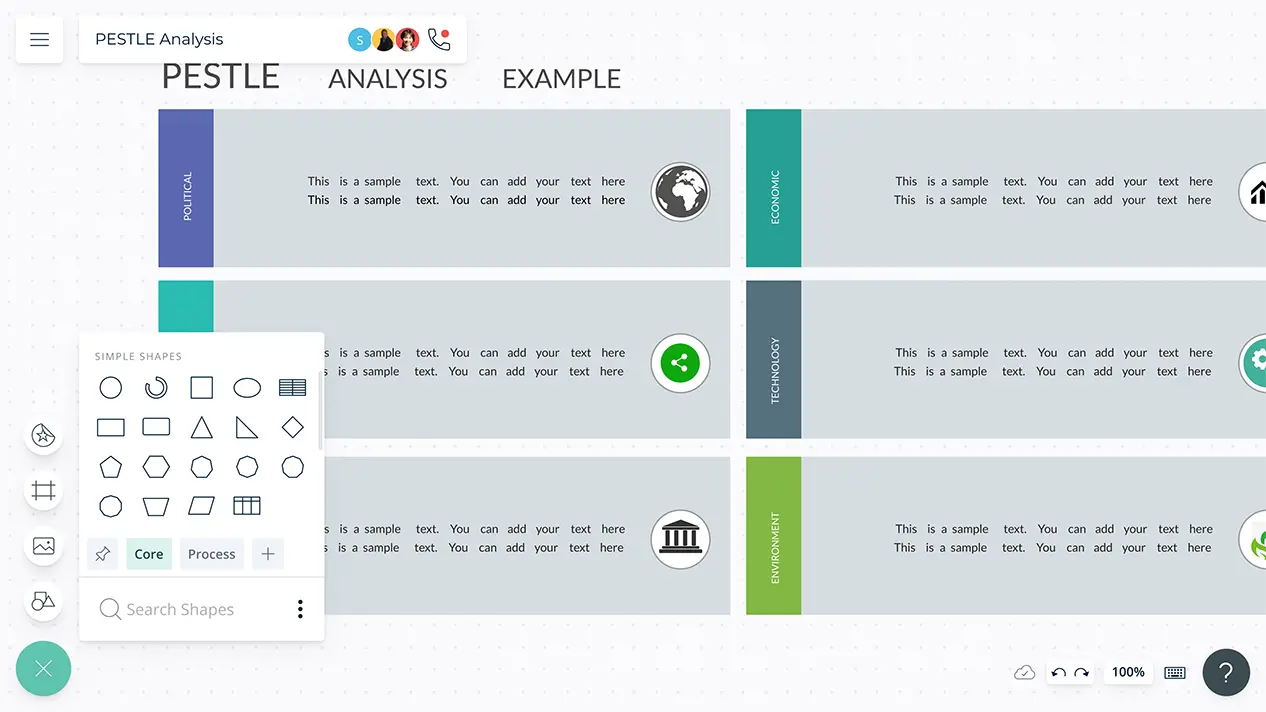
Use Creately to conduct market research on competitors, customers, and industry using customizable templates and an intuitive canvas.
Identify inefficiencies in your processes and make needed improvements to increase productivity.
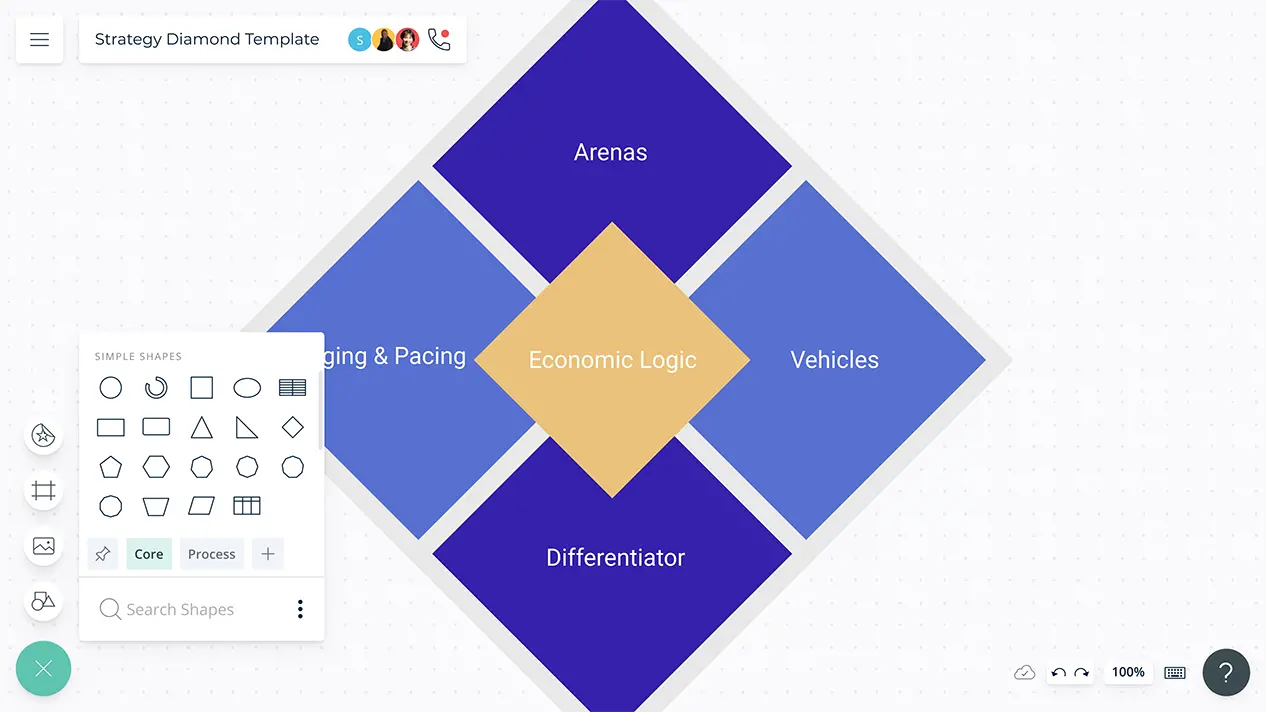
Use Creately’s professional templates for strategic analysis to develop your strategies easily. Identify and assess information relevant to your organizational strategy.
Strategize and establish your company's sales targets to align with organizational goals and achieve and increase market share.
Improve your strategic growth by understanding how key areas of your business interact.
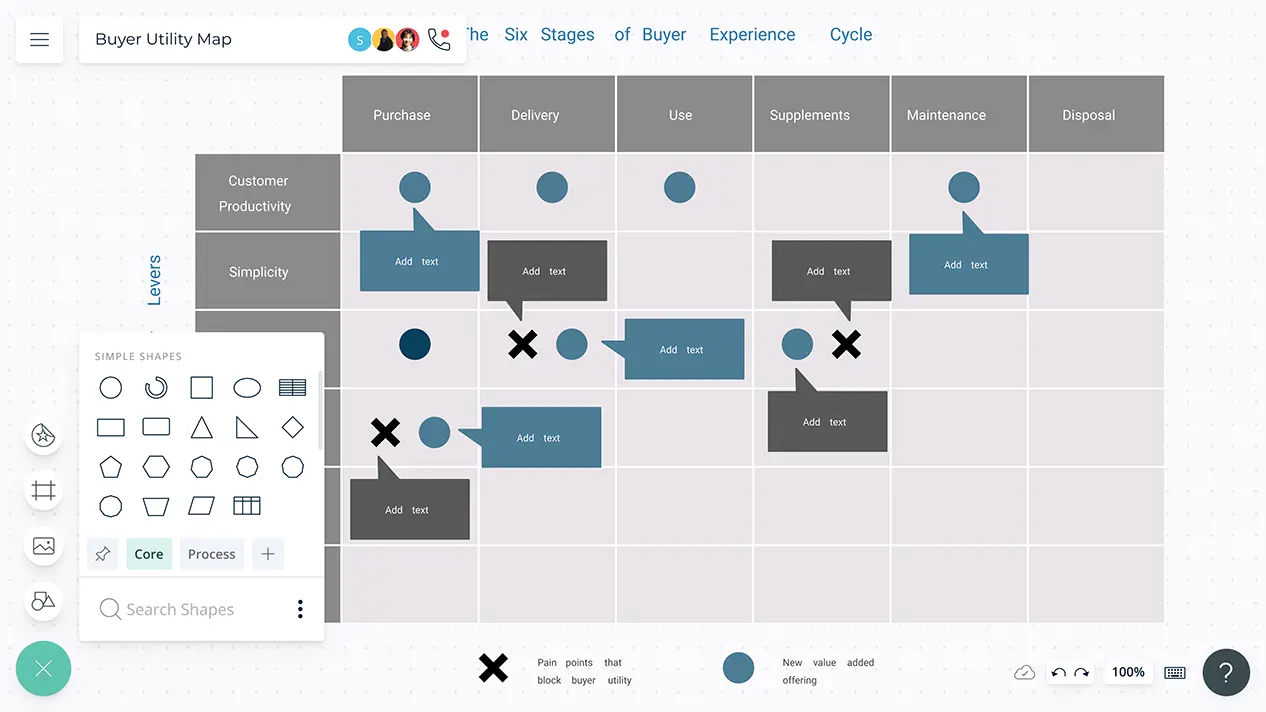
Uncover strategic opportunities to create outstanding value for your customers.
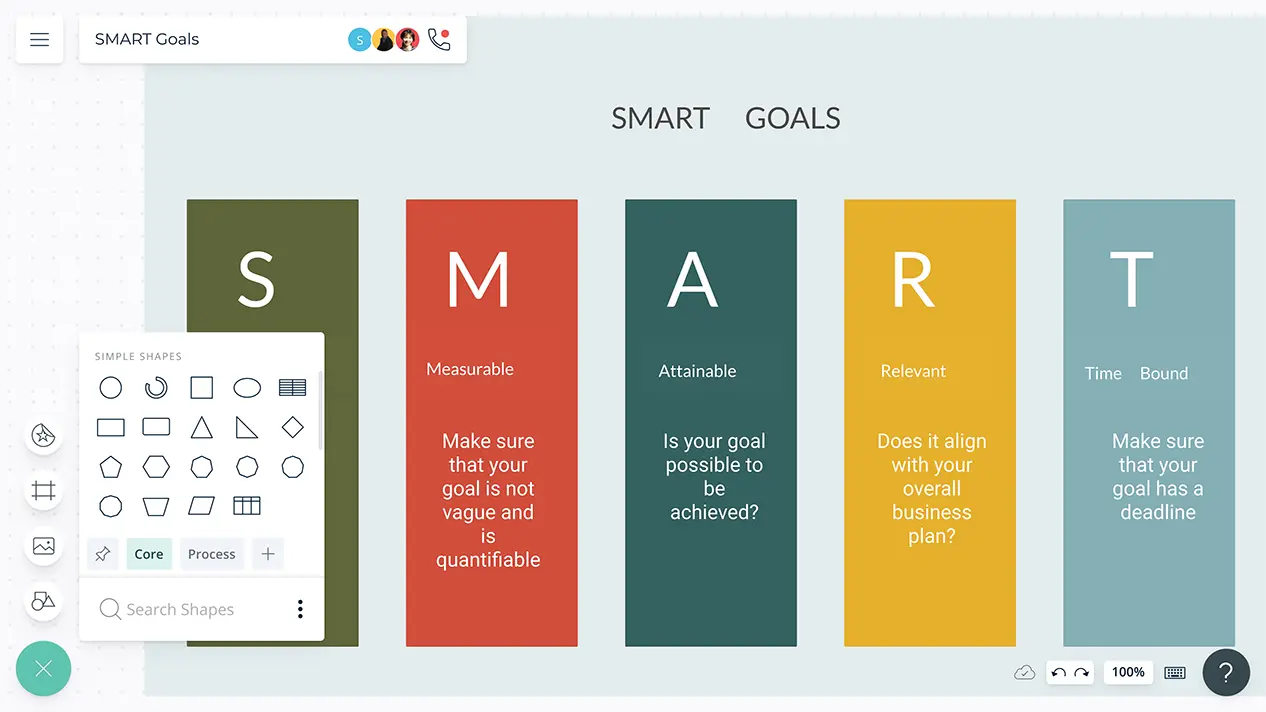
SMART goal template and worksheets to plan and improve the chances of succeeding in accomplishing organizational goals.
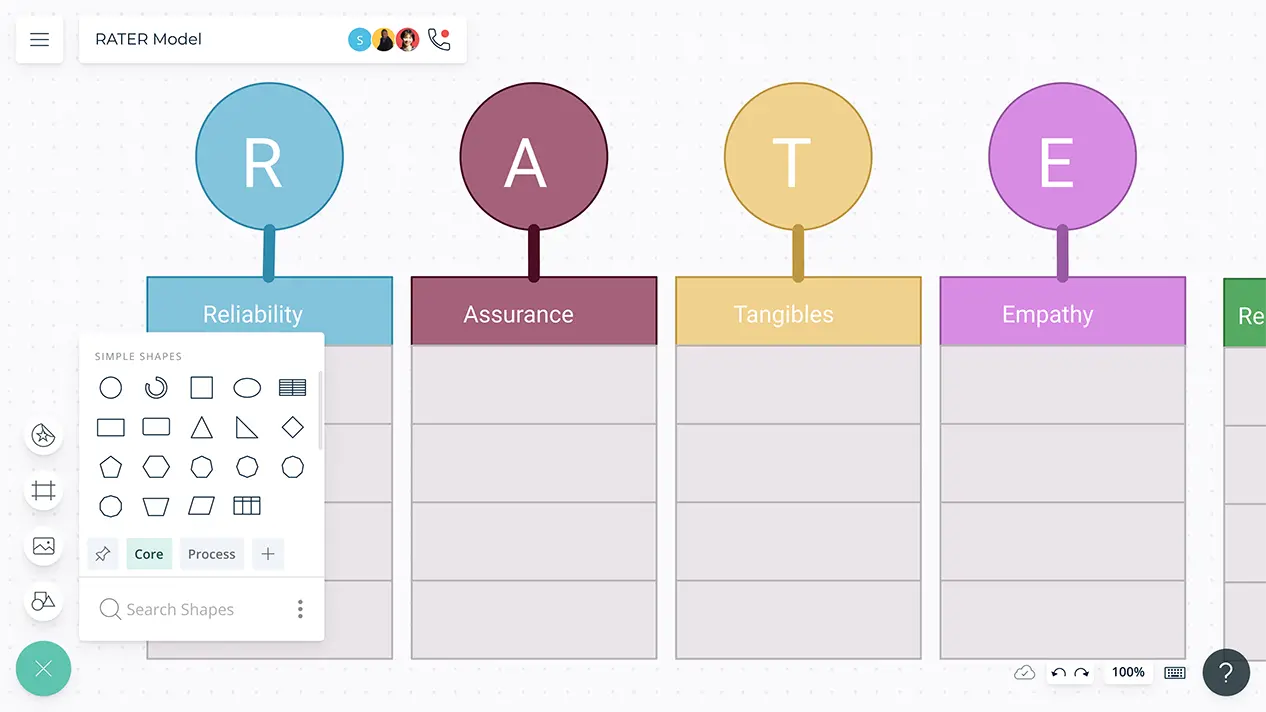
Visual tools to identify customer service quality gaps. Evaluate the status of your current customer service standards against 5 factors of customer expectations: reliability, assurance, tangibles, empathy, and responsiveness.
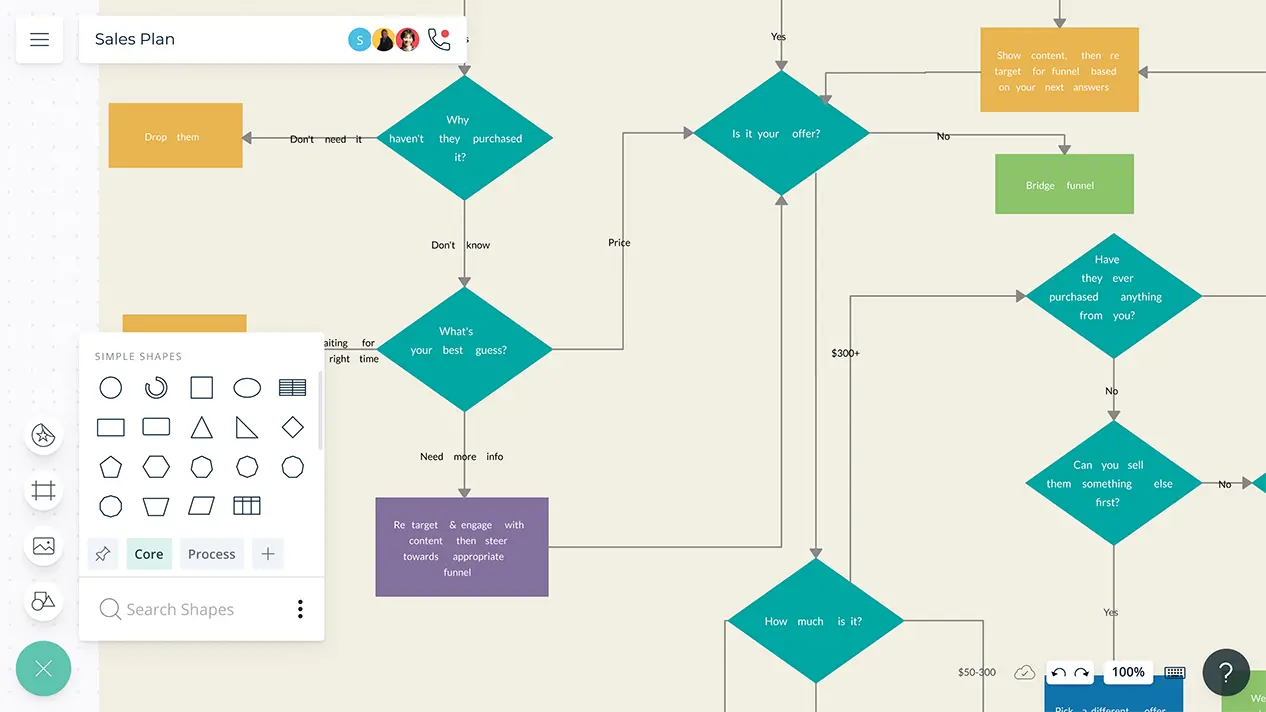
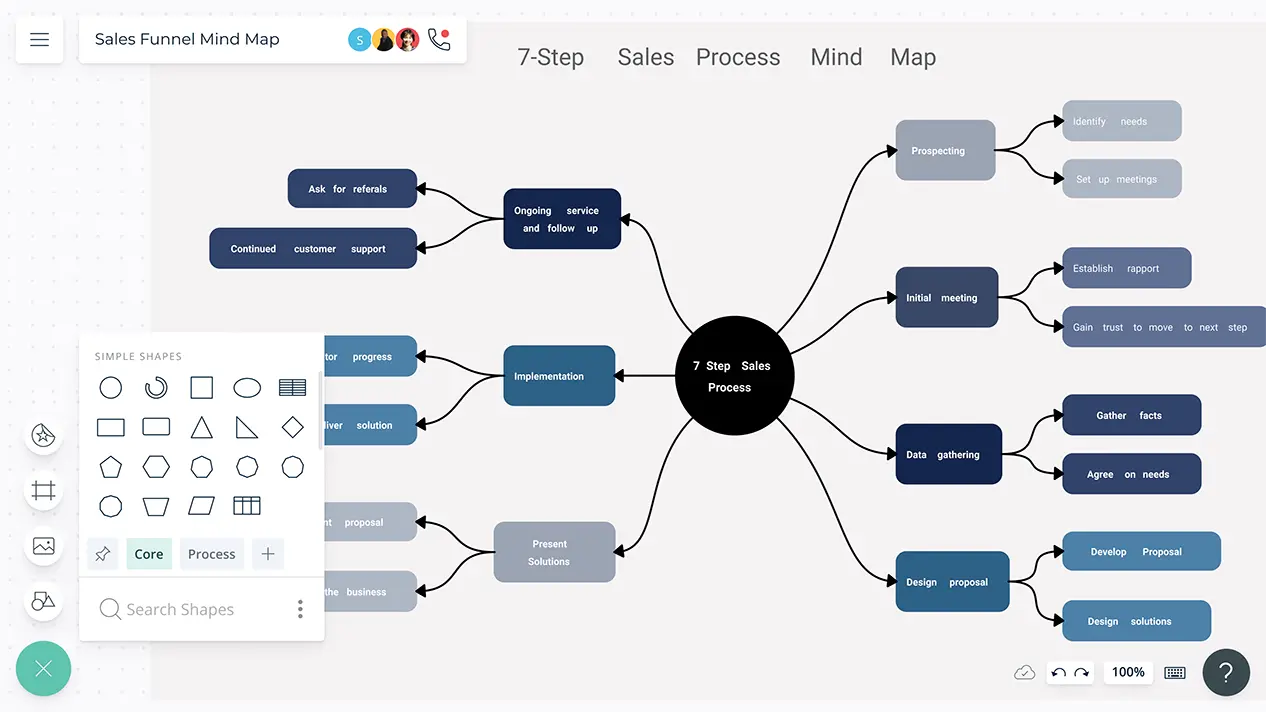
Effectively outline and visualize your product’s sales funnel to generate key insights on customer behaviour. Analyze, review and optimise the current sales funnels to increase conversion rates.
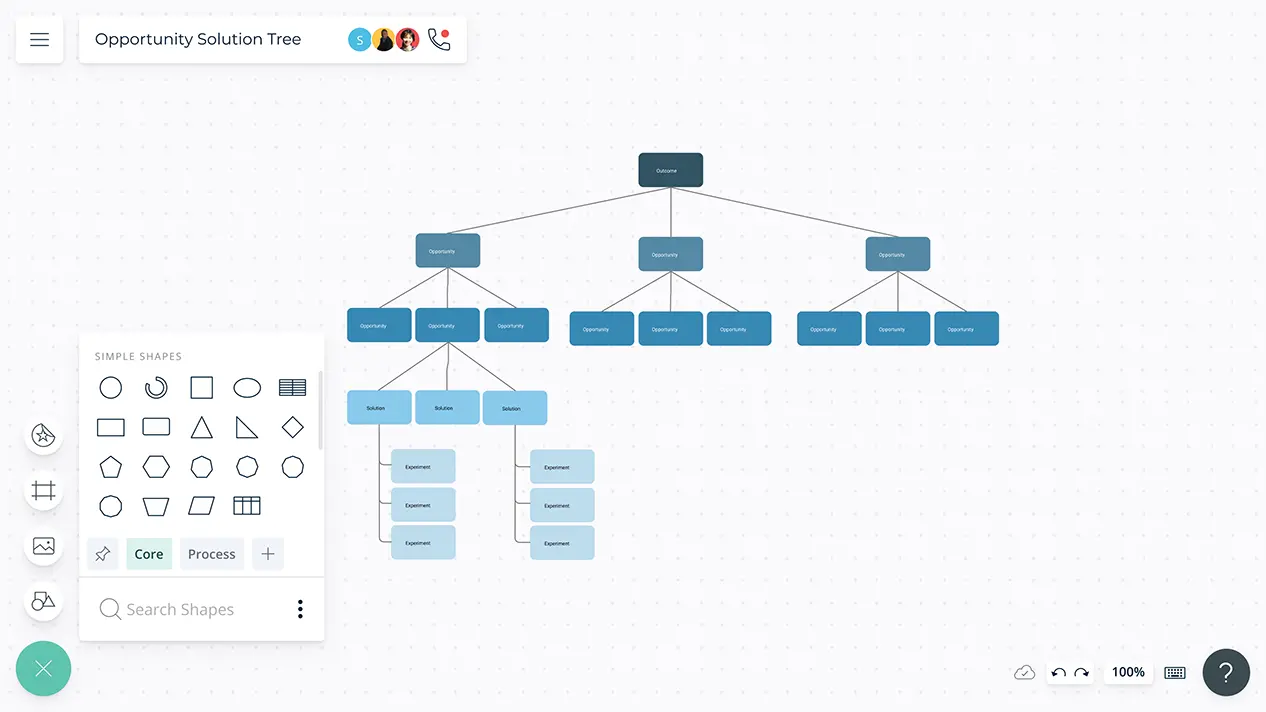
Map out opportunities to solutions effectively. The opportunity solution tree enables you to overcome issues in product discovery and match your goals to the action plan.
Represent your software development life-cycle and visually depict how testing will be implemented along each stage