Infographic Maker
Create Professional Infographics Online to Visualize Complex Data
Generate interactive infographics with Creately’s easy-to-use infographic creator. Customize templates, collaborate with your team, and illustrate complex data or information.
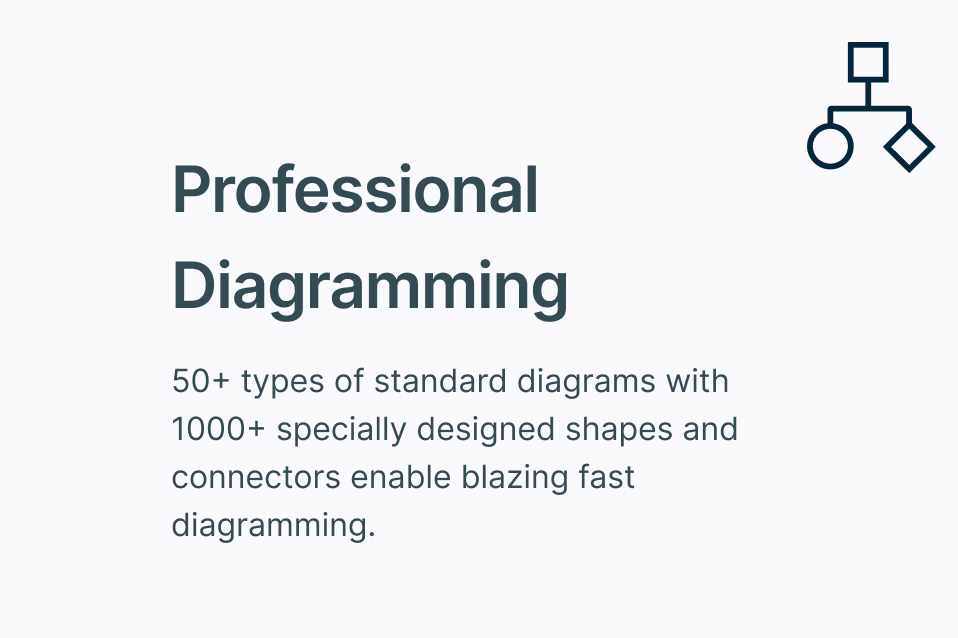
- Comprehensive shape library with drag-and-drop design elements
- Collaborate in real time on an infinite canvas with your team
- Export infographics as PDF, SVG, PNG, & JPEG, fast and easy


 Diagramming Visual Collaboration Org Chart


Transform Data into Stunning Infographics with Our Online Infographic Maker

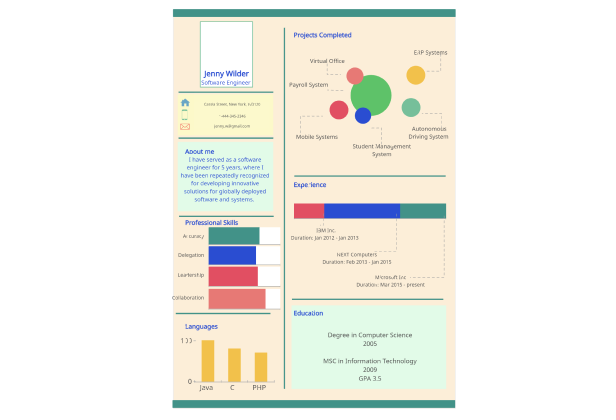
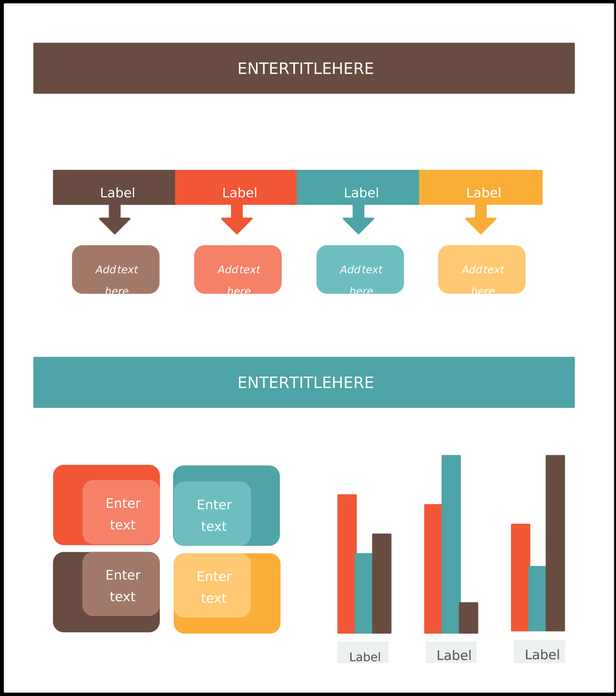
Access professionally-designed infographic templates to create visuals effortlessly.
Use diagramming shortcuts and Plus Create to design infographics fast and easily.
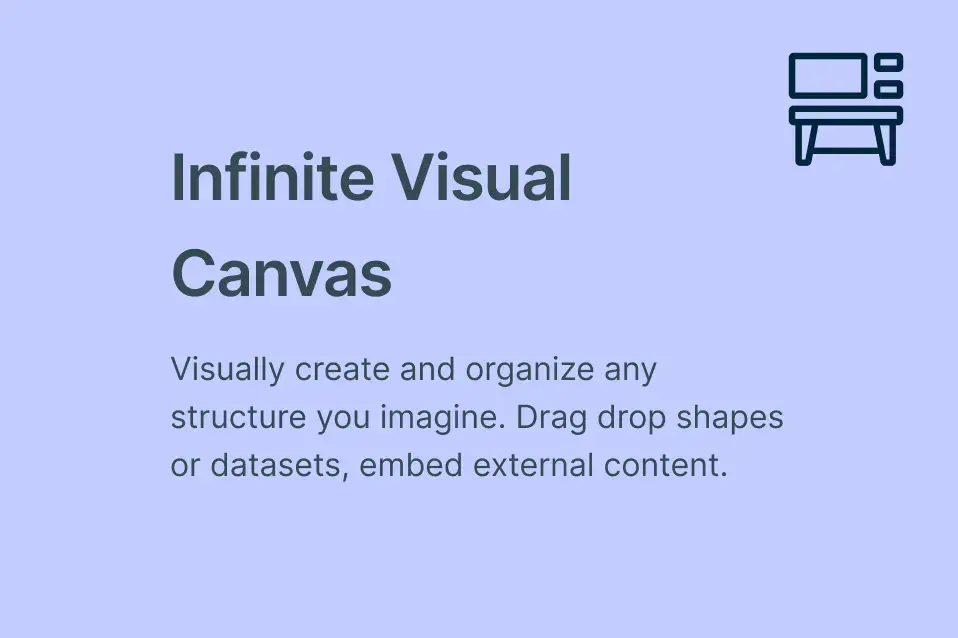
Drag-and-drop shapes, text, and images onto an infinite canvas for fully customizable layouts.
Bring your data to life with an easy-to-use infographic creator, no design skills needed.

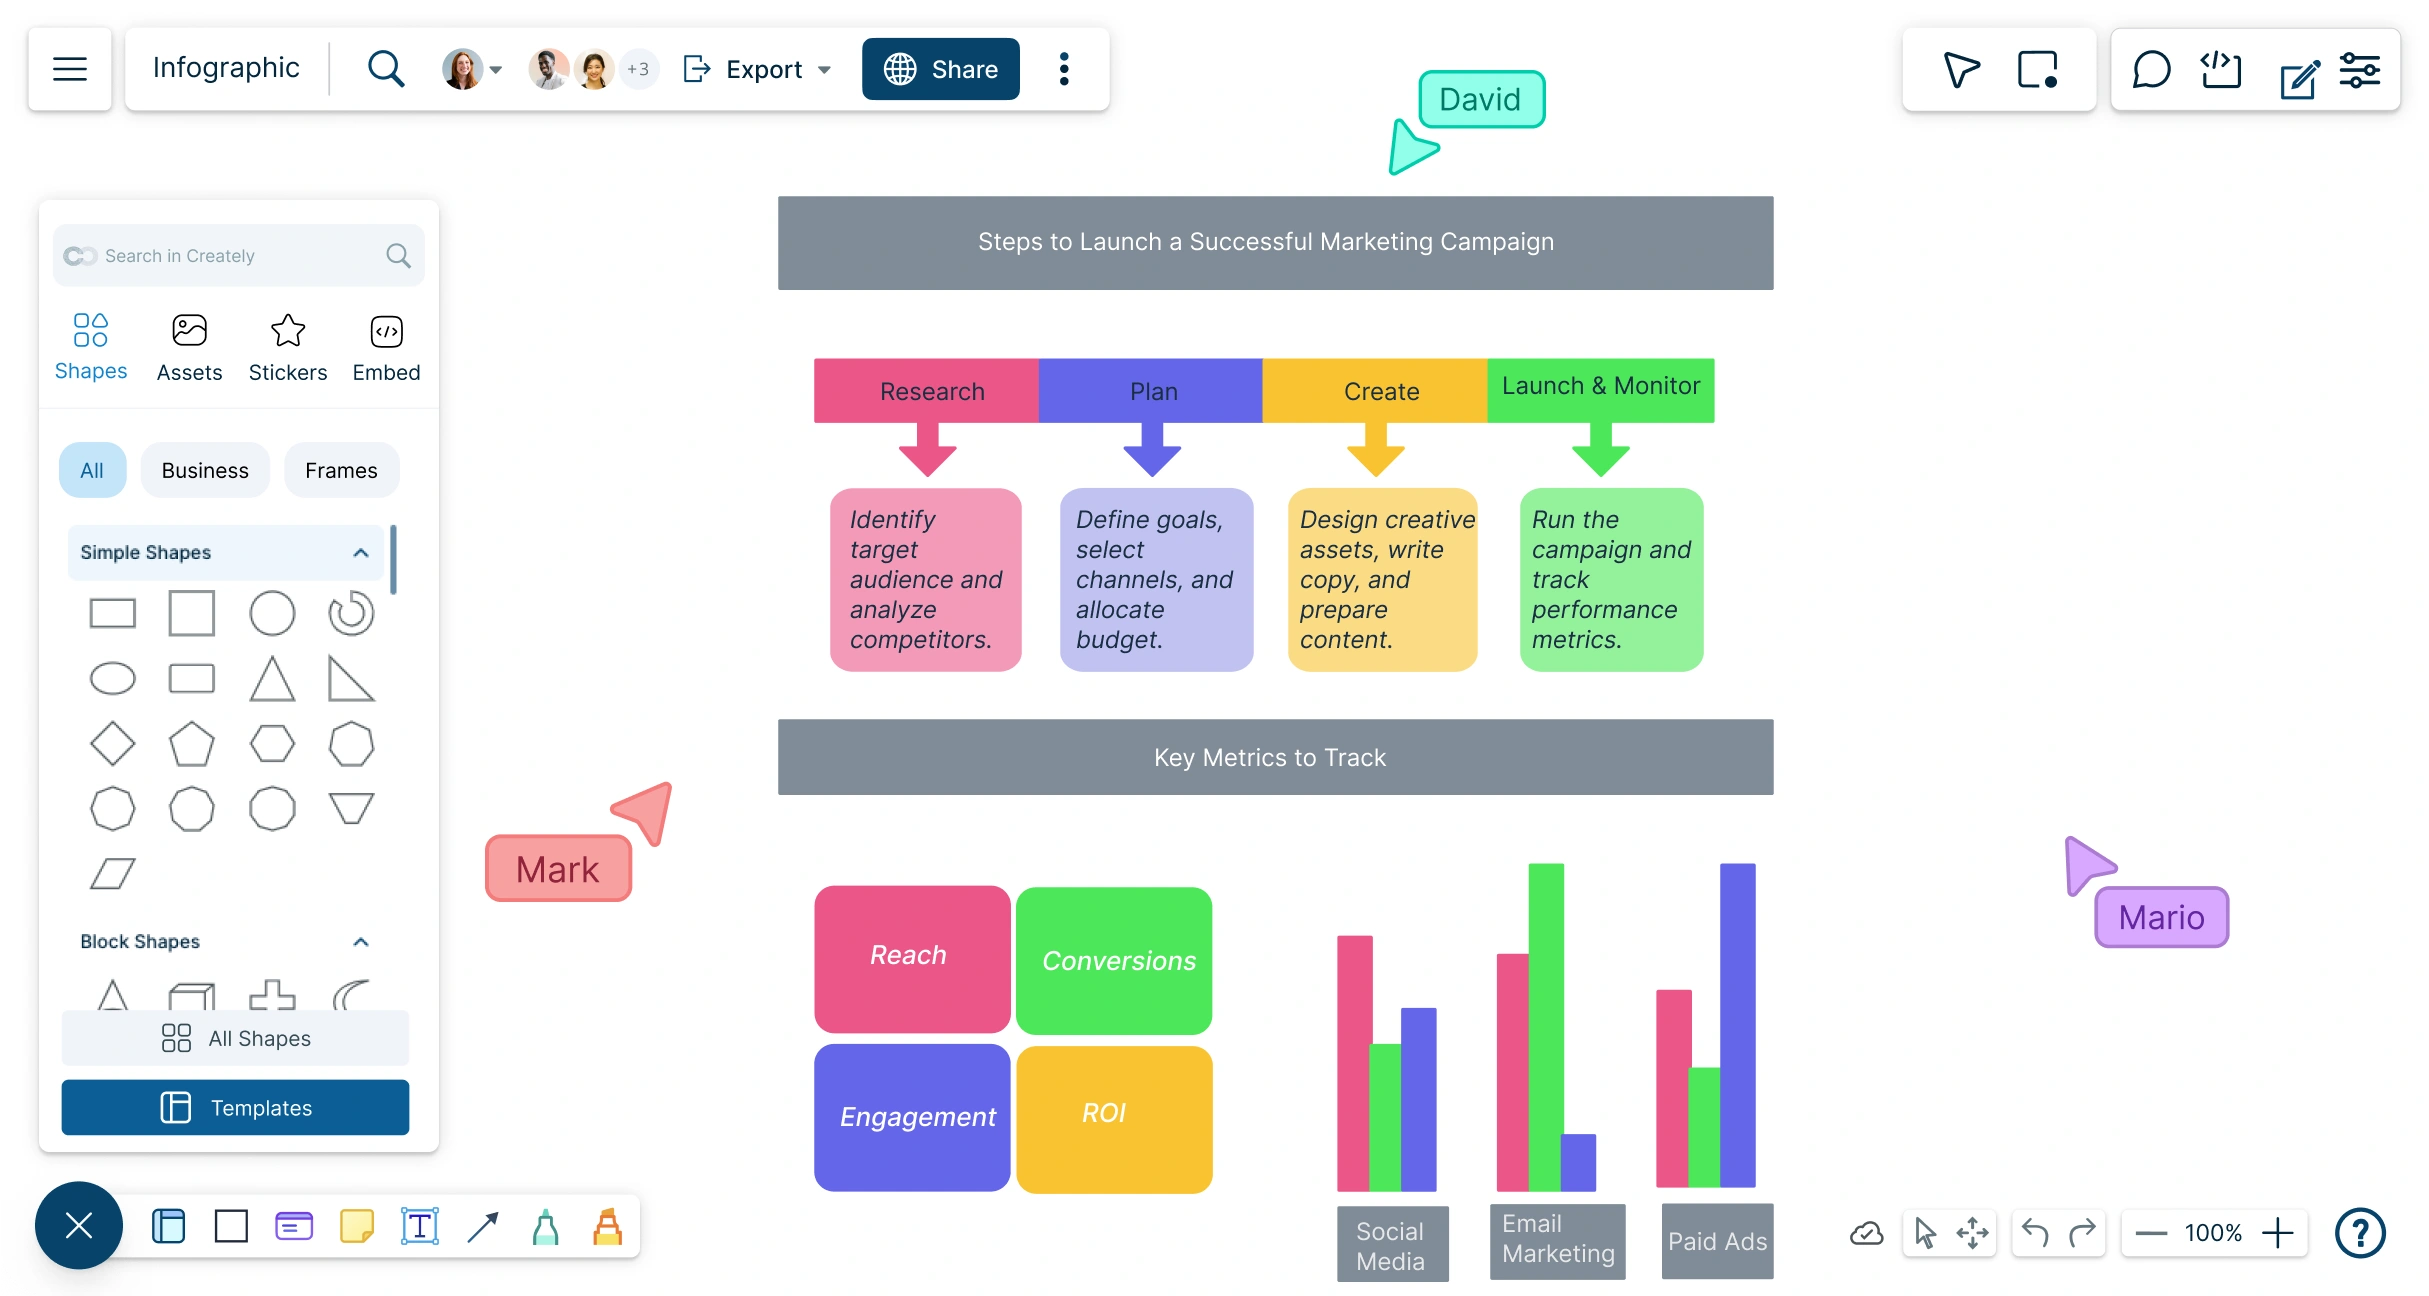
Create and Collaborate on Infographics in Real Time
Collaborate in real time using Creately’s infographic generator—brainstorm, discuss, and co-create with your team.
Get instant feedback with inline comments and @mentions to refine your infographic designs effortlessly.
Asynchronous editing made easy with color-coded cursors, contextual comments, and secure sharing with access control.
Work seamlessly online and keep your team in sync while creating professional infographics together.
Track, Analyze, and Share Infographics with Ease

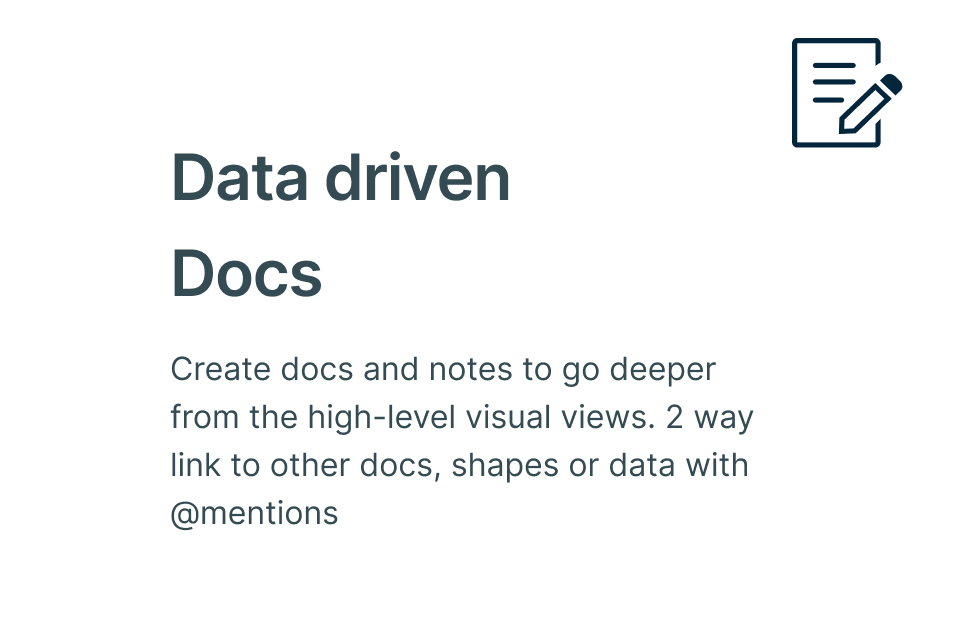
Add rich information to your infographics using the notes panel—attach images, links, and multimedia for context.
Manage teams and permissions effortlessly while working on group projects, delegating tasks, and tracking progress.
Export or embed anywhere: PNG, JPEG, SVG, PDF, or directly integrate your infographic into websites.
Turn data into actionable visuals with an easy-to-use infographic maker that simplifies sharing and analysis.
What Is an Infographic?

How to Make an Infographic with Creately
Launch Creately and Open Your Workspace
Sign in to Creately and open your workspace to start a new infographic project. Access your team’s shared workspace for real-time collaboration.
Choose a Template or Start from Scratch
Select from easy-to-customize infographic templates or create your layout with smart shapes. Use the comprehensive shape and icon library to speed up design.
Add Data and Multimedia with the Notes Panel
Attach images, links, charts, and sticky notes directly to shapes using the notes panel. Organize your information clearly for maximum impact.
Collaborate and Customize
Work with your team using real-time collaboration, @mentions, and inline comments. Customize colors, fonts, charts, and layouts to make your infographic professional and engaging.
Review, Update, and Share
Check your infographic for clarity and accuracy. Export in PNG, JPEG, SVG, or PDF, or embed it directly on websites. Share with your team or publish instantly.
Create an InfographicCreate Your Infographics Online with These Free Editable Templates
FAQs About Infographics
What are Creately’s free infographic maker pricing plans?
- Free Plan — $0/month for basic infographic creation and collaboration
- Starter & Team Plans — $8/month or $5/month billed annually
- Business Plan — $149/month or $89/month billed annually
Annual billing helps you save more while unlocking advanced collaboration, workspace management, and enhanced infographic features. You can compare all available plans and features on the Creately Pricing Page.
How can you create infographics faster?
Are there templates for different infographic use cases?
Can teams collaborate on infographics?
Can I add notes, data, and files?
Can I share, present, or export infographics?