Working with Frames
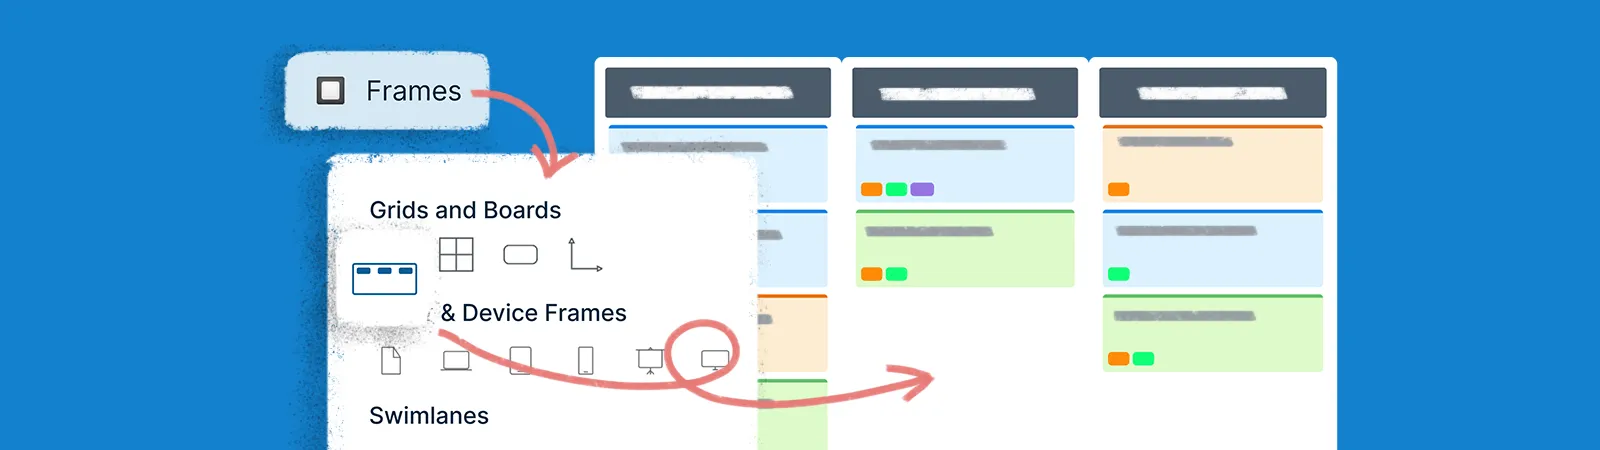
Frames help you visualize data in different perspectives without having to manually repeat the visualization process.
Creately provides an array of frames that allow you to visualize data in different perspectives and organize your content in different formats on a workspace.
Adding Frames
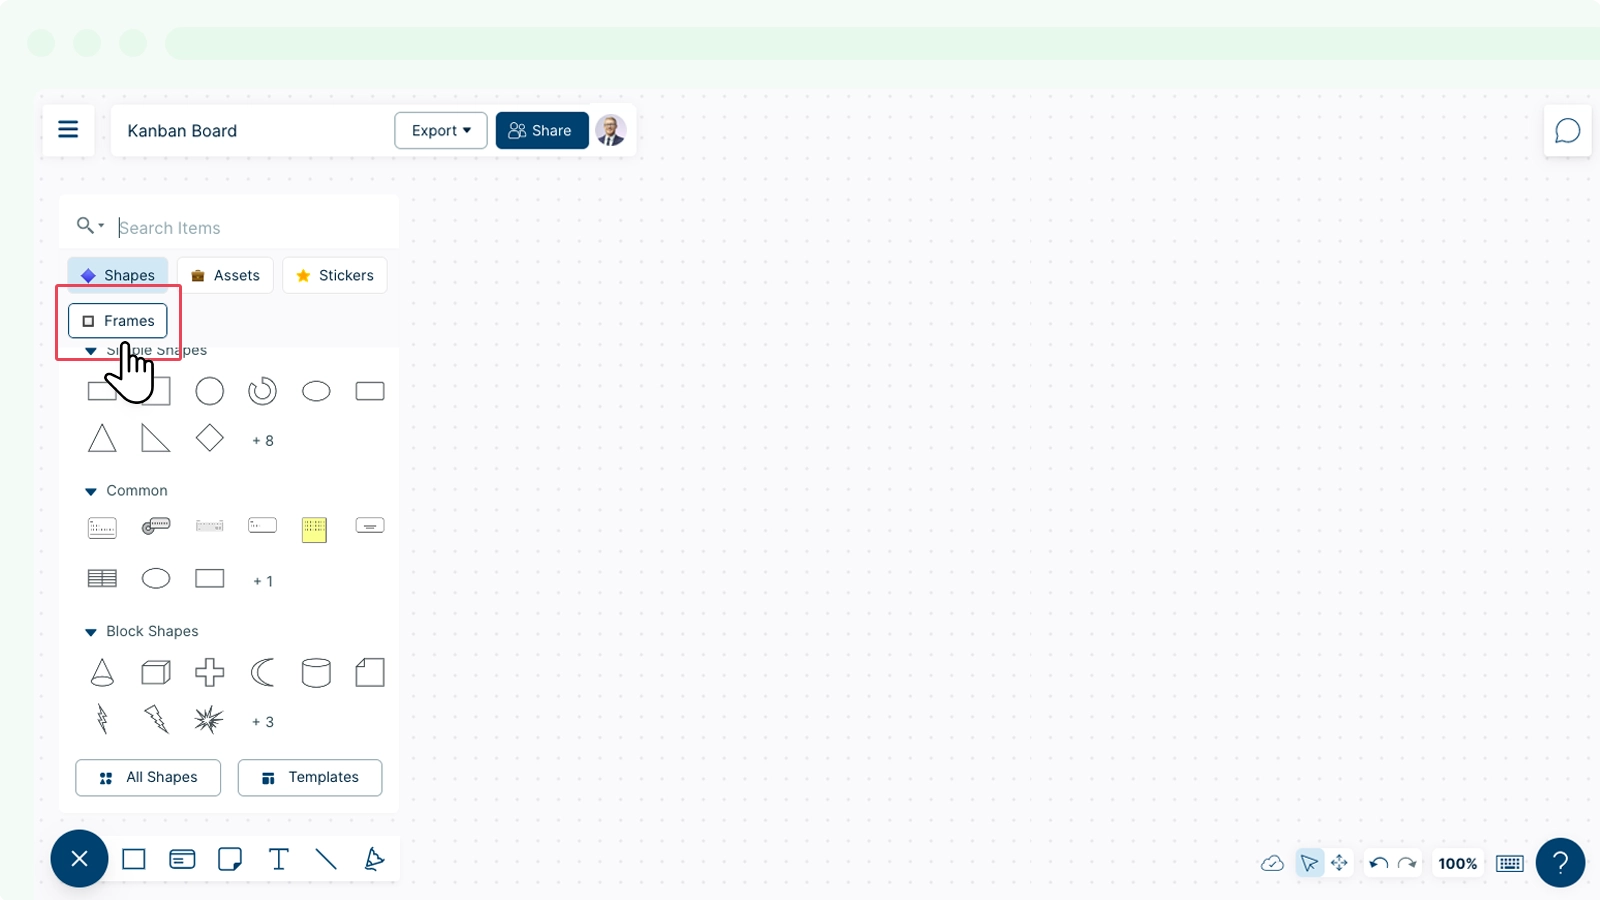
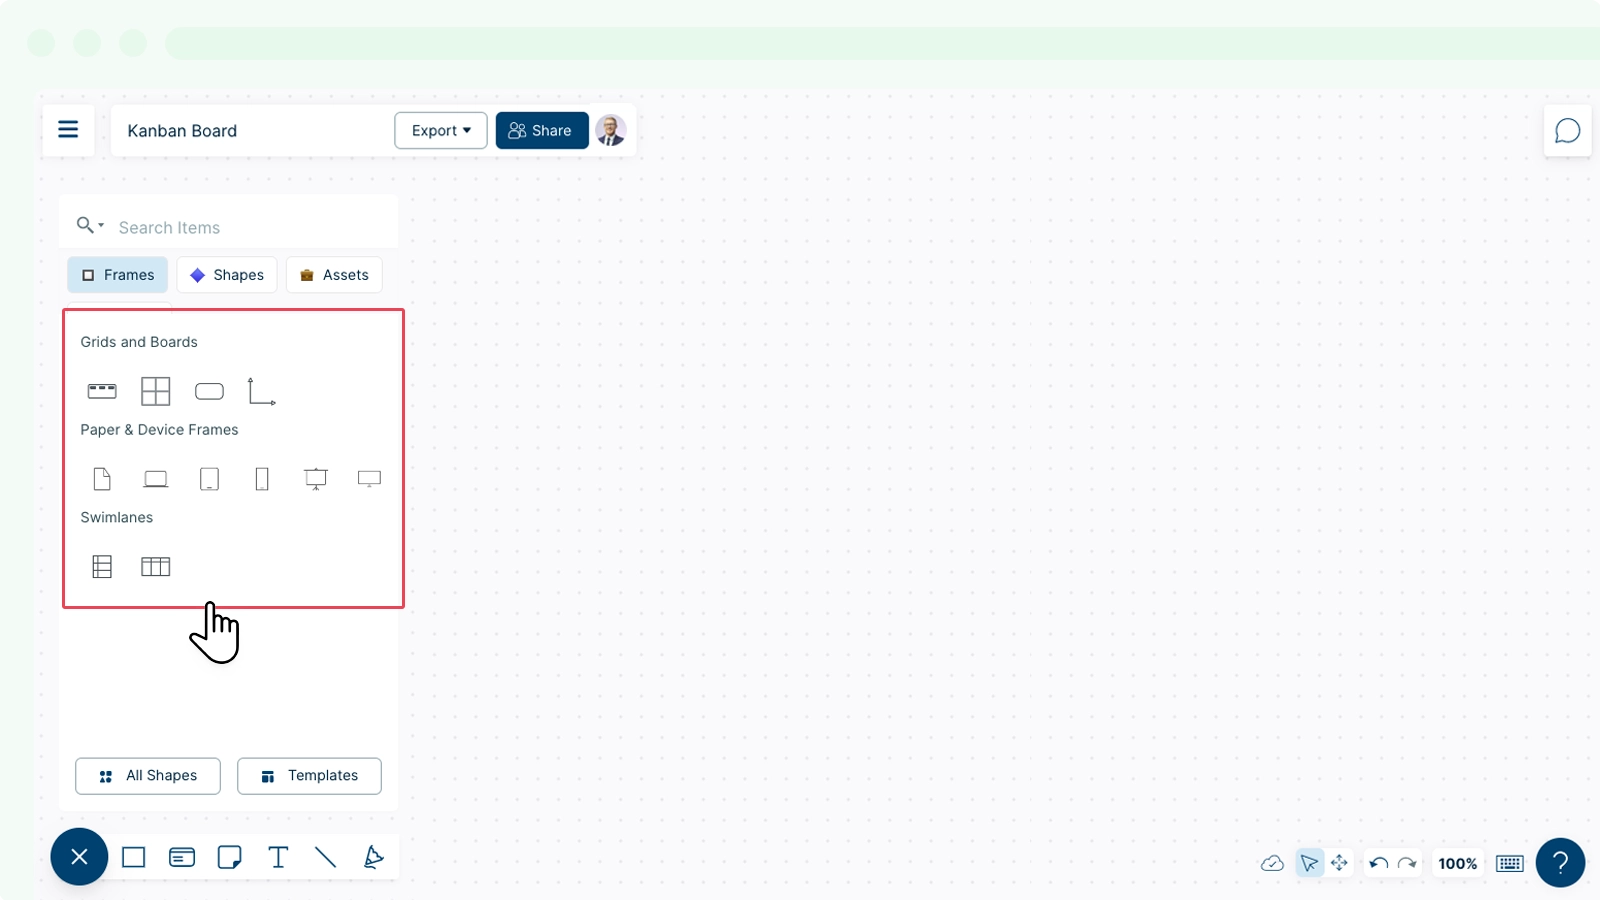
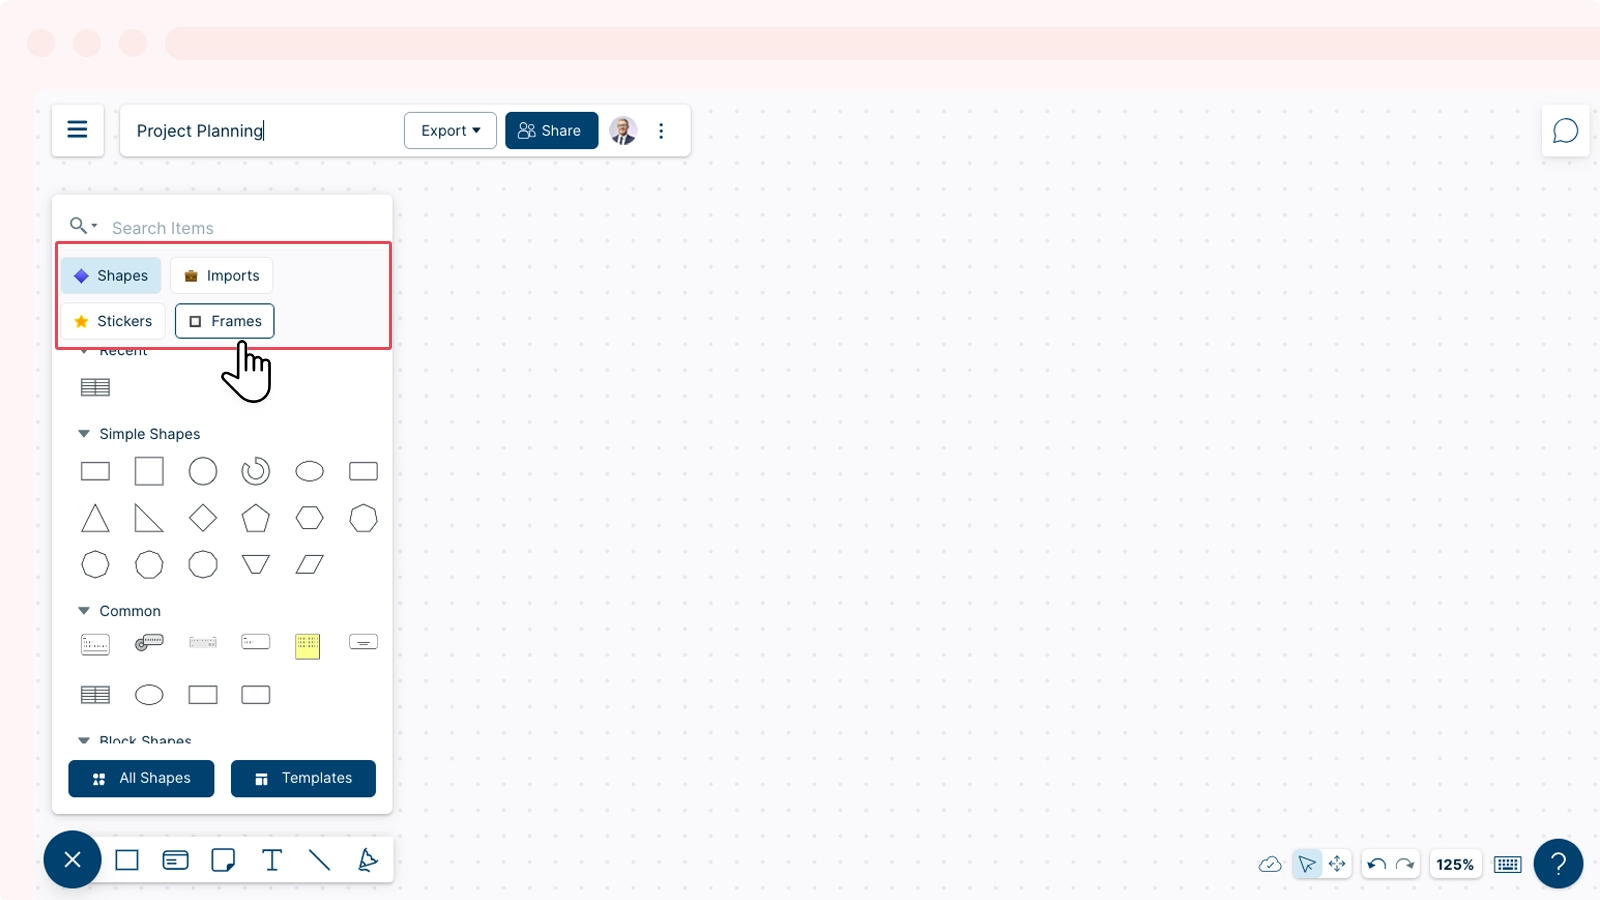
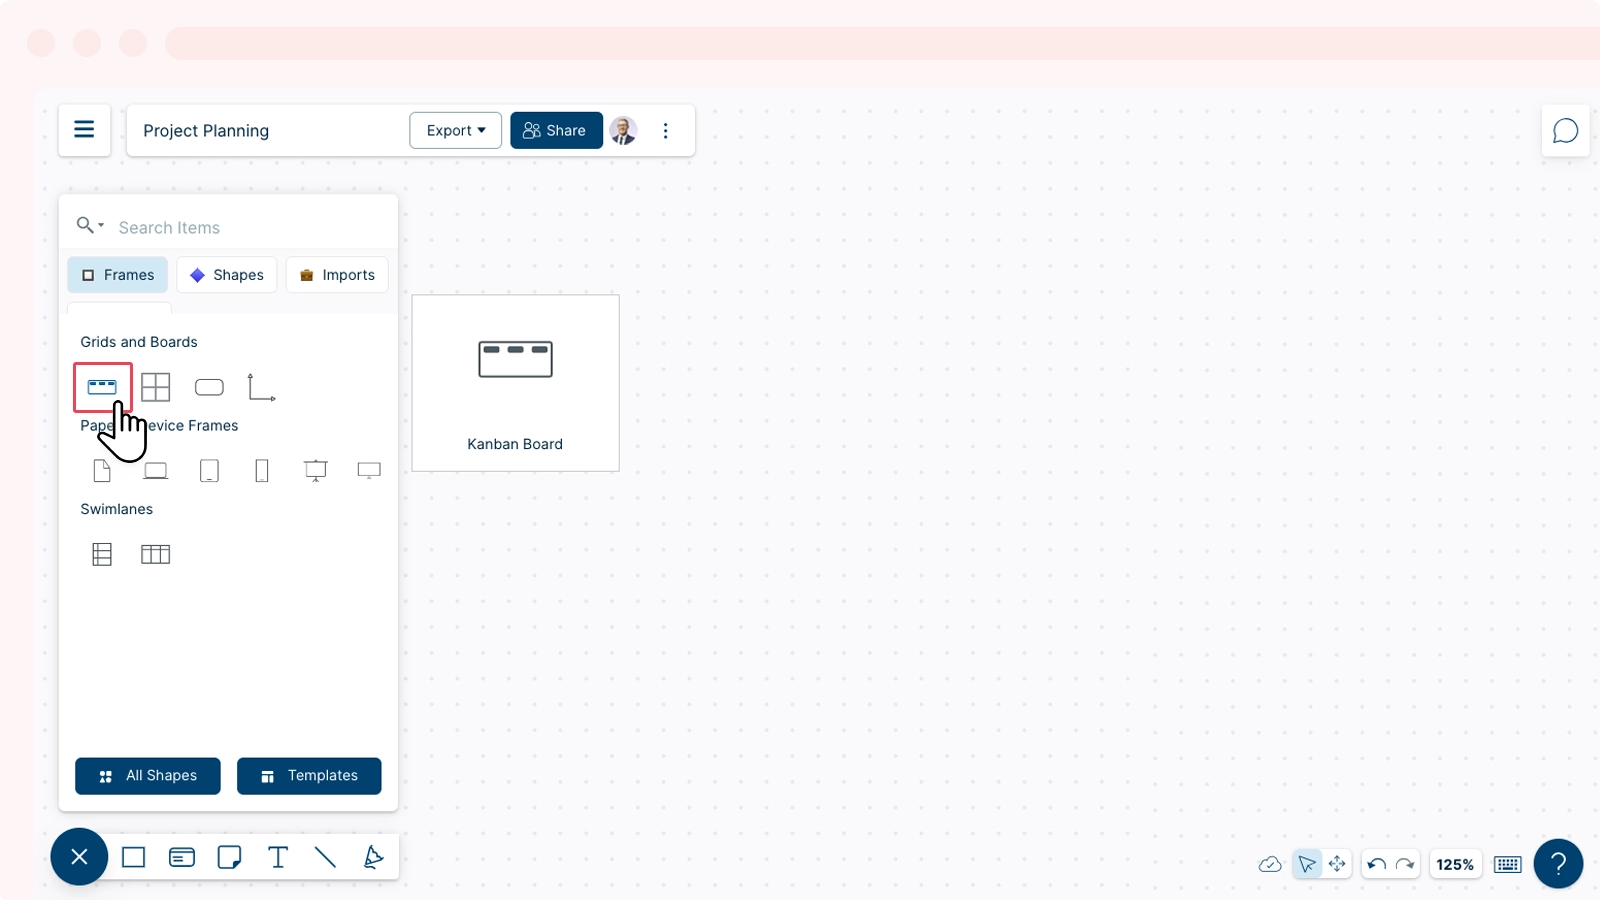
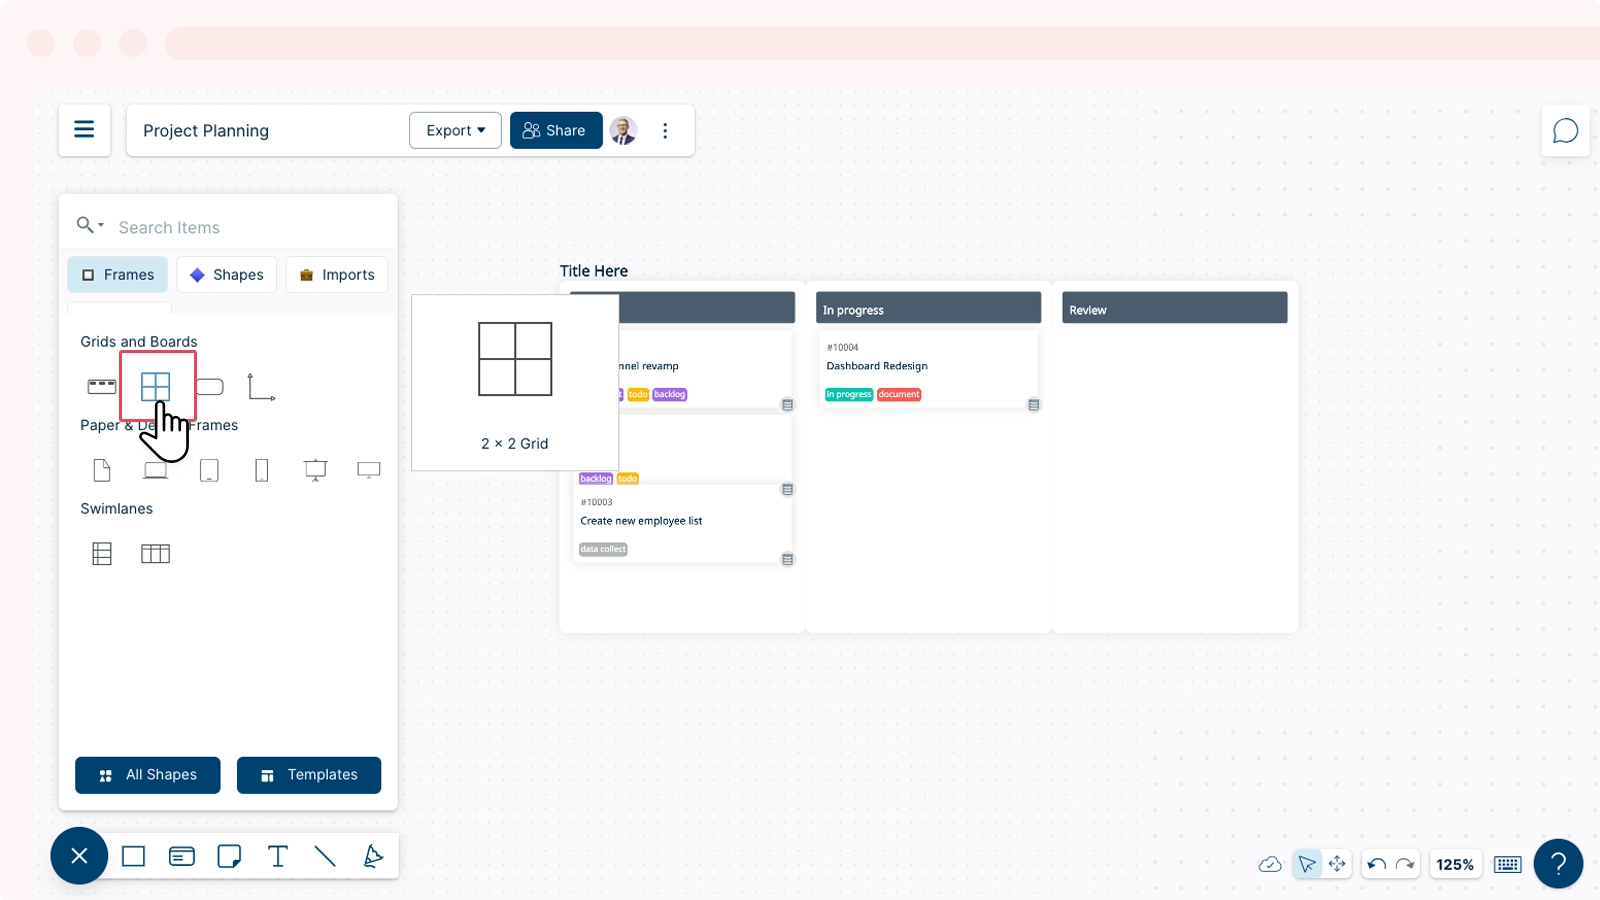
- To access Frames on Creately, go to the
 Plus button on the bottom-left corner of the canvas and select
  Frames.

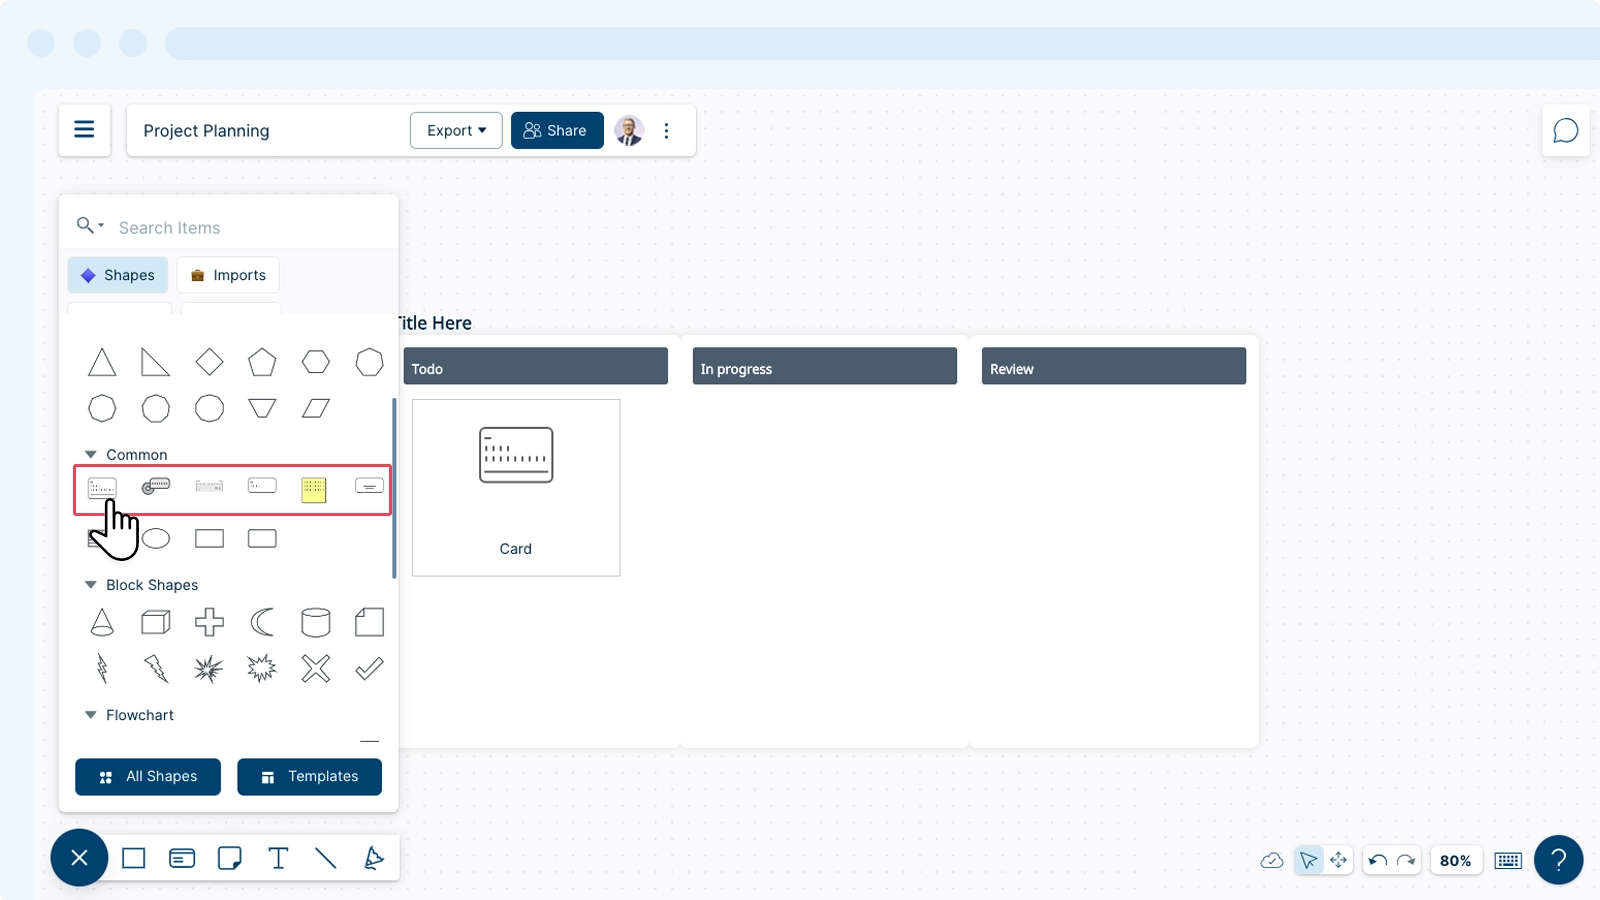
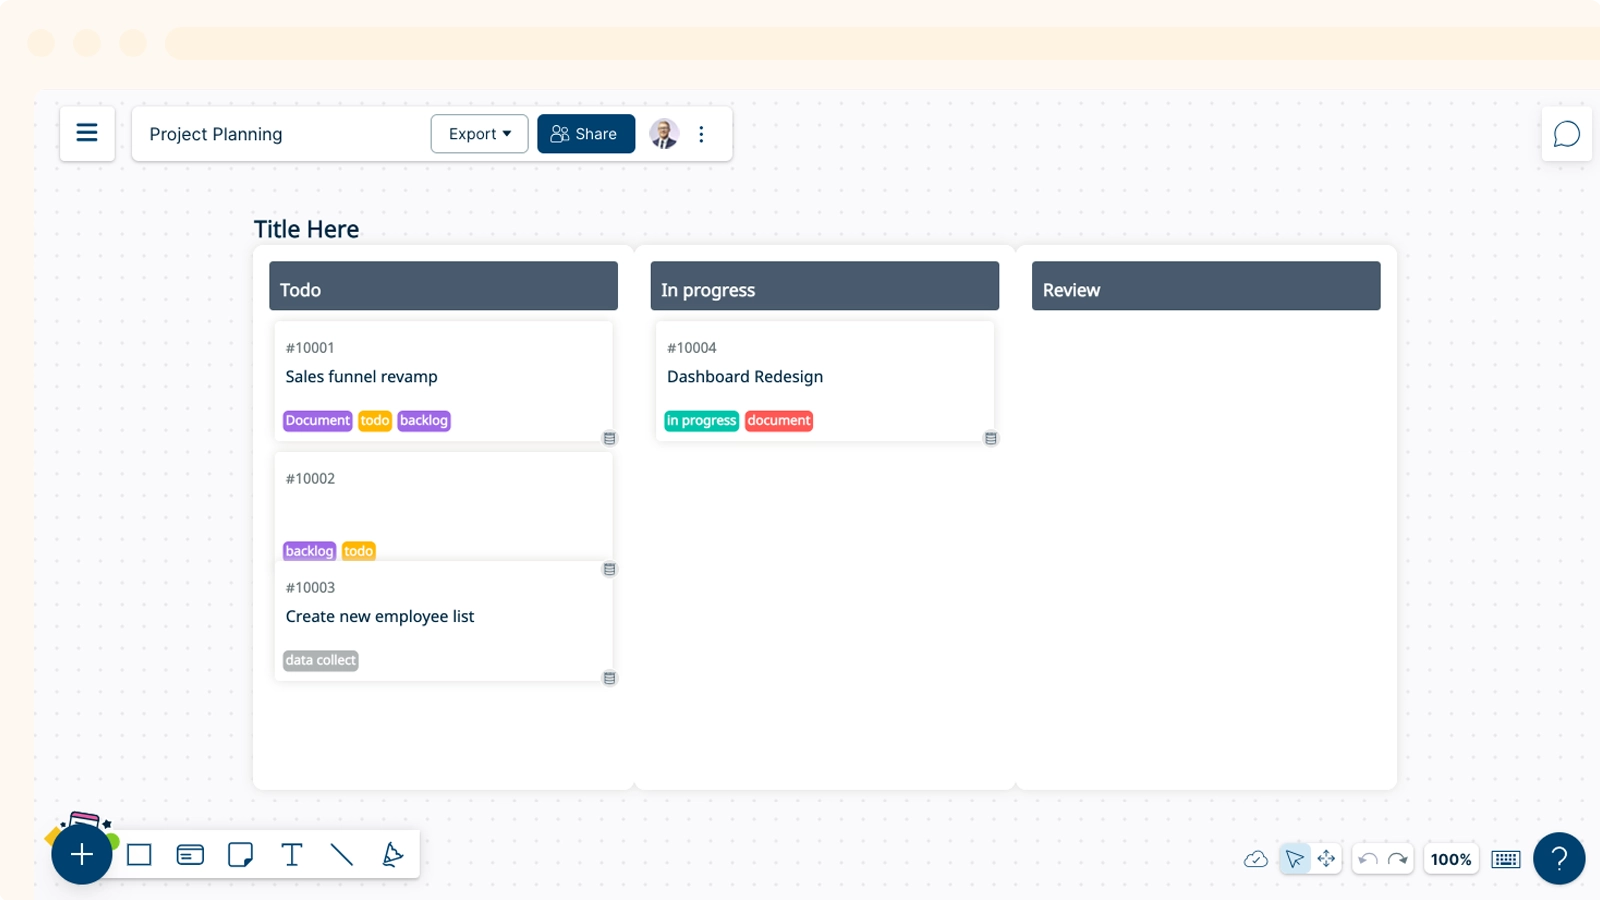
- Let’s choose a Kanban Board to initialize data to visualize on this frame.
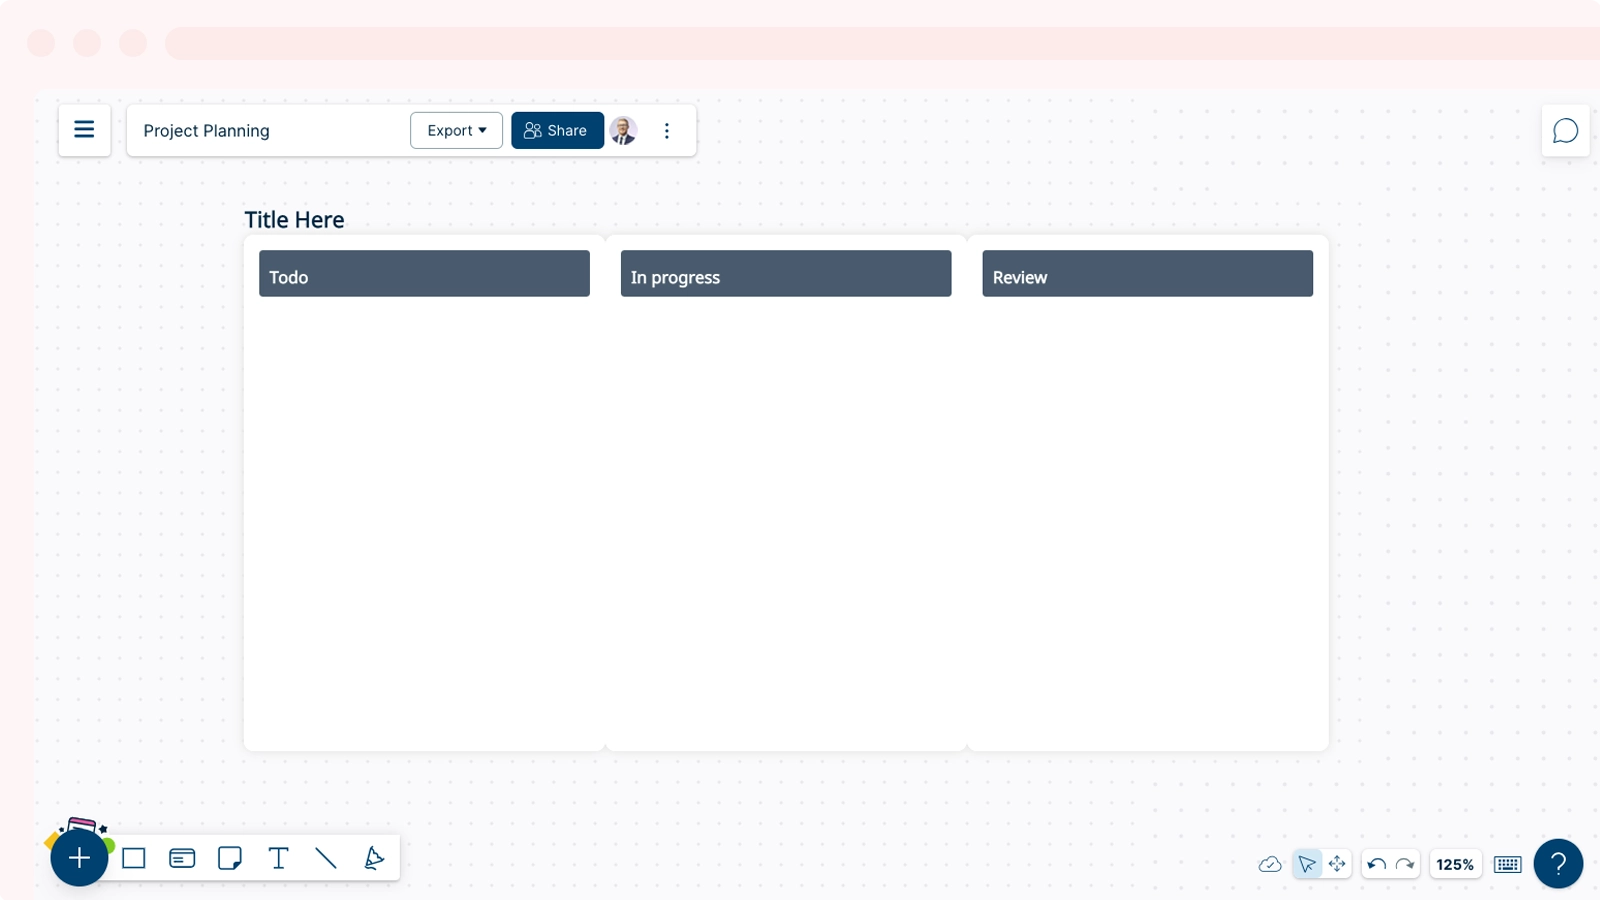
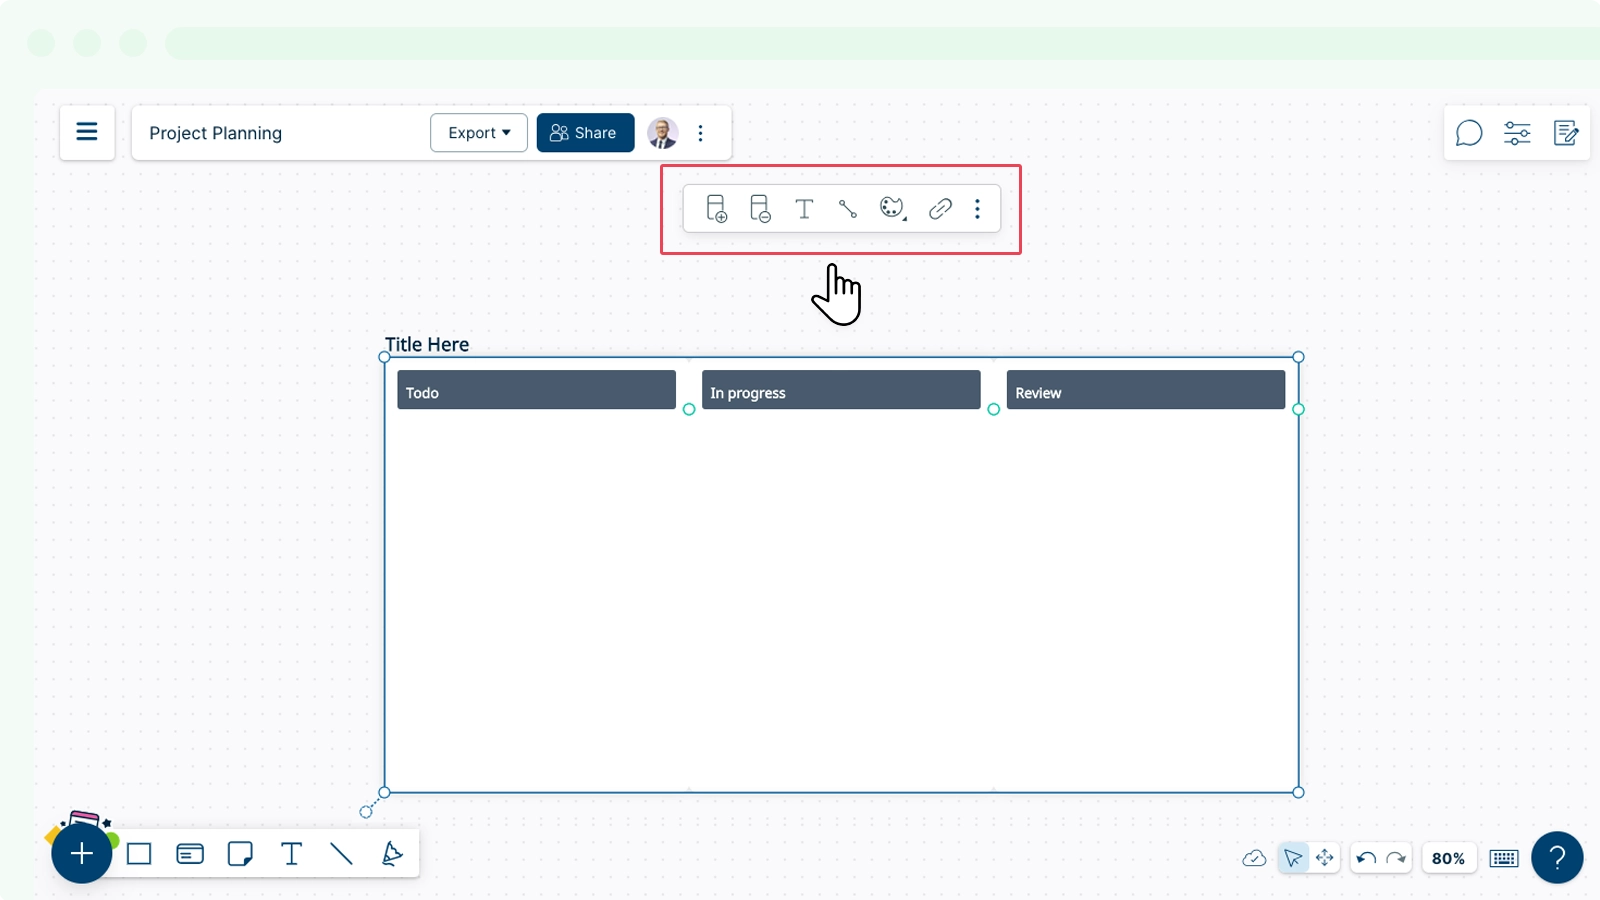
Customize your Kanban Board using the contextual toolbar.
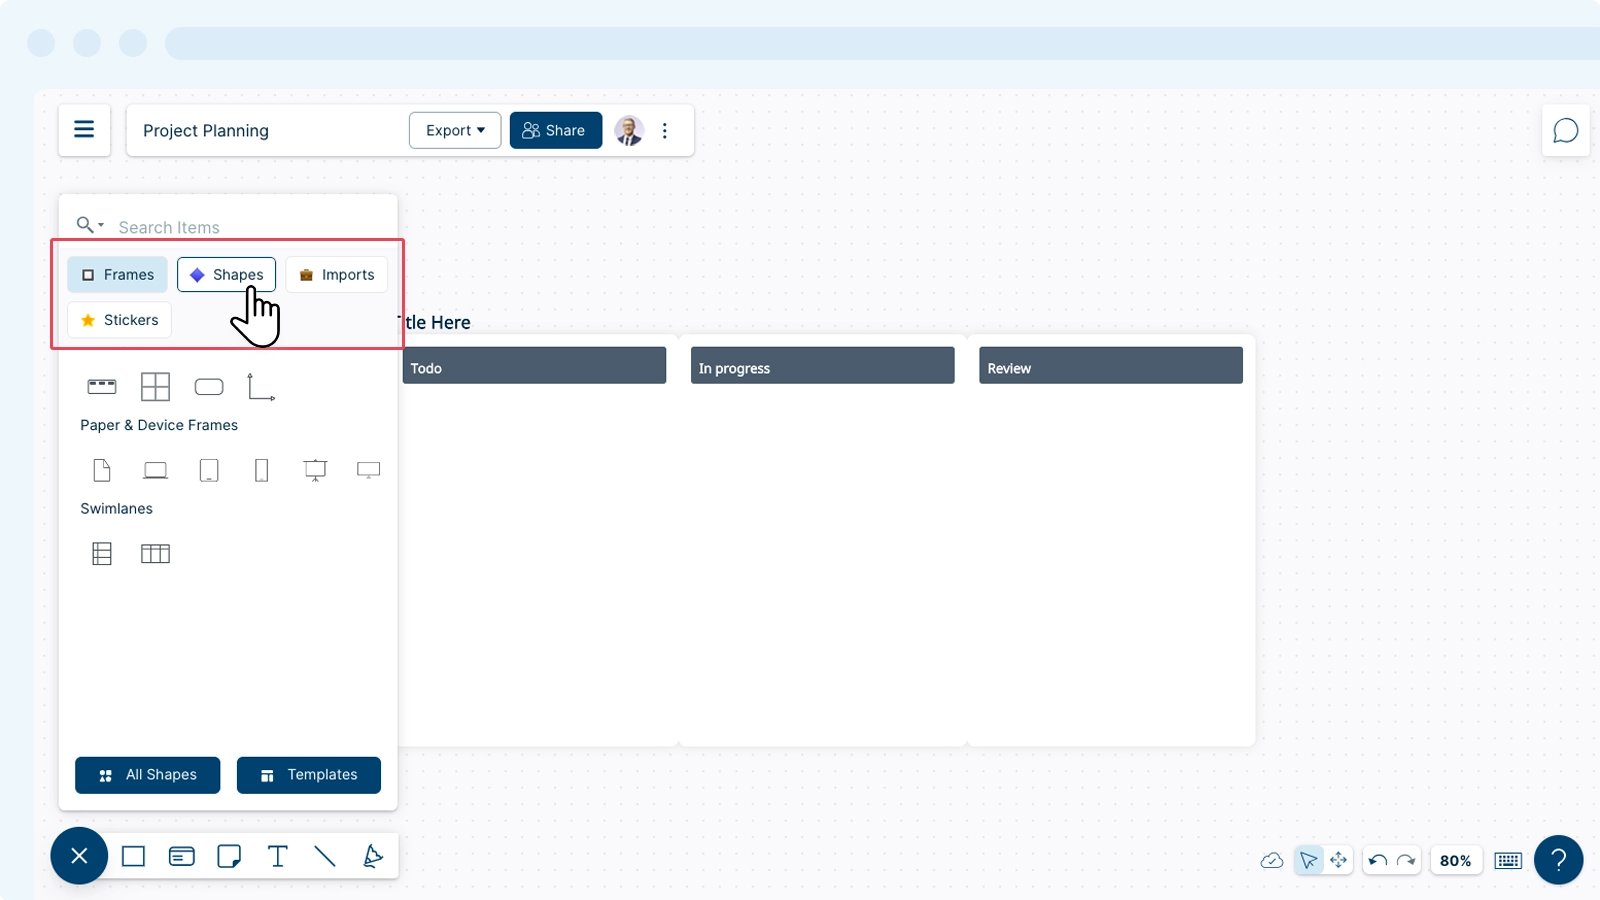
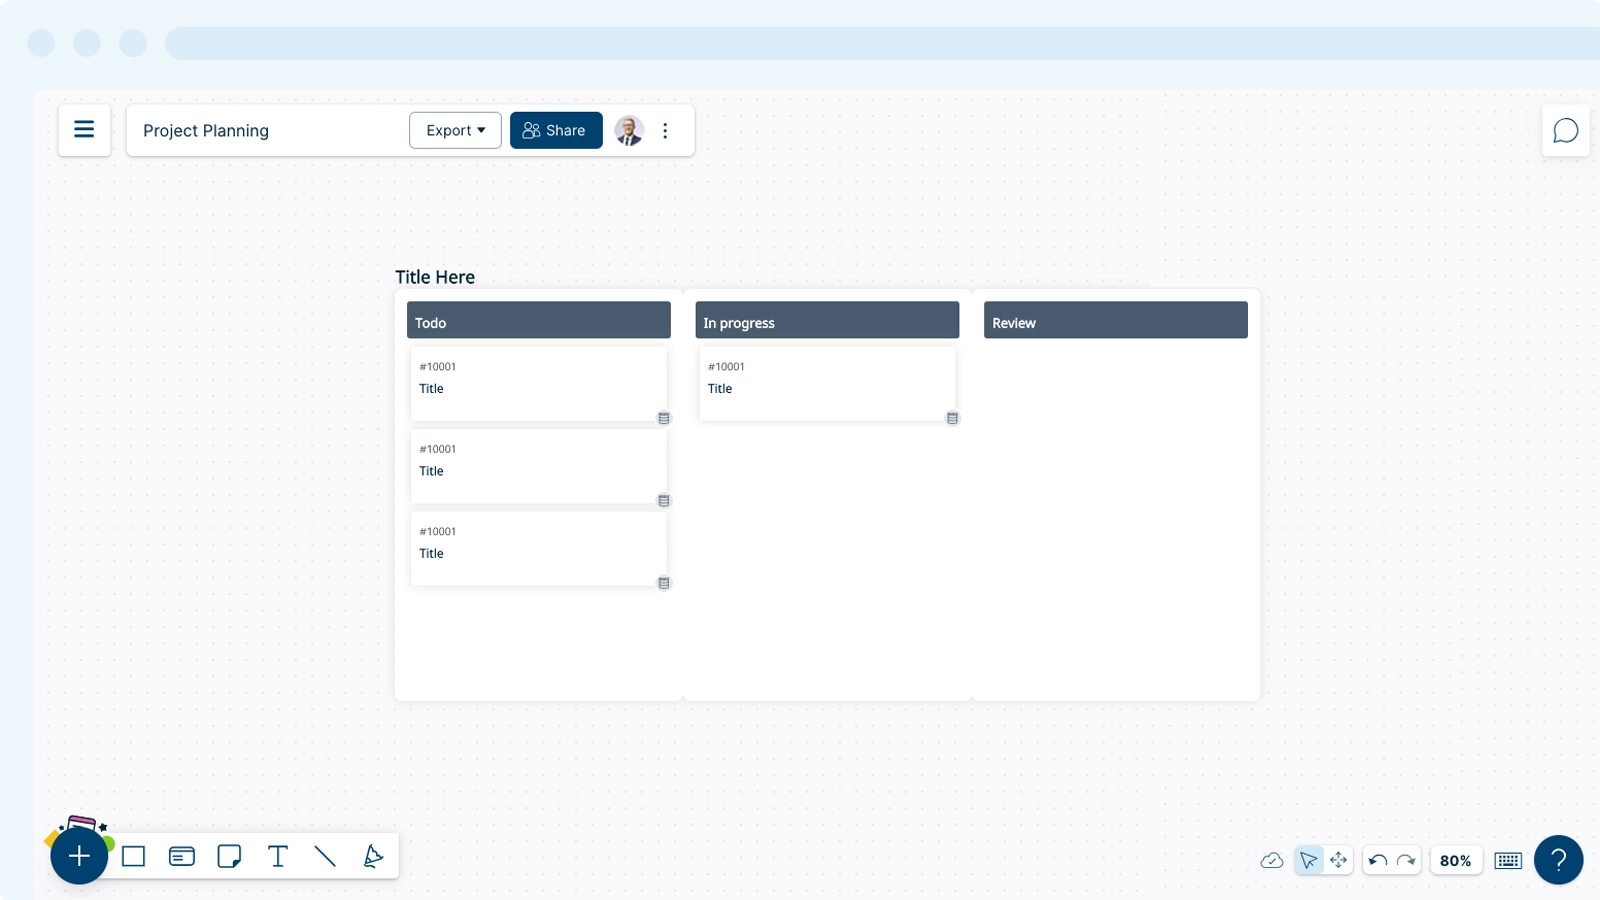
Add cards into the Kanban board to populate it with issues. Go to
Plus Button →  All Shapes → Project Management and select the card shape to add it to the Kanban board. You can populate the cards with data by selecting
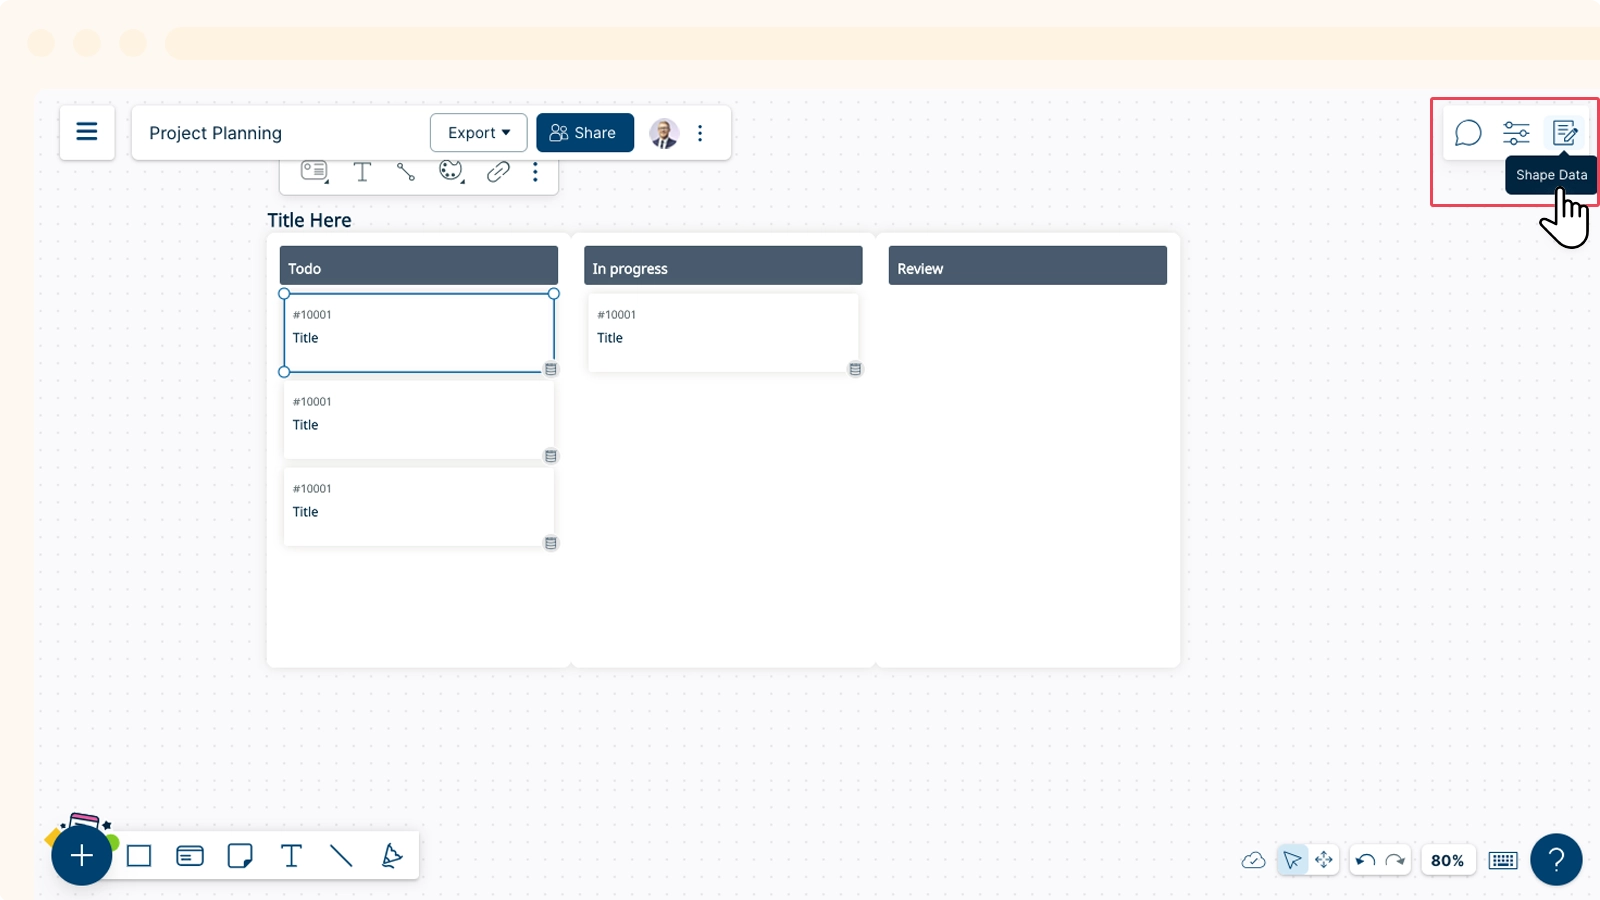
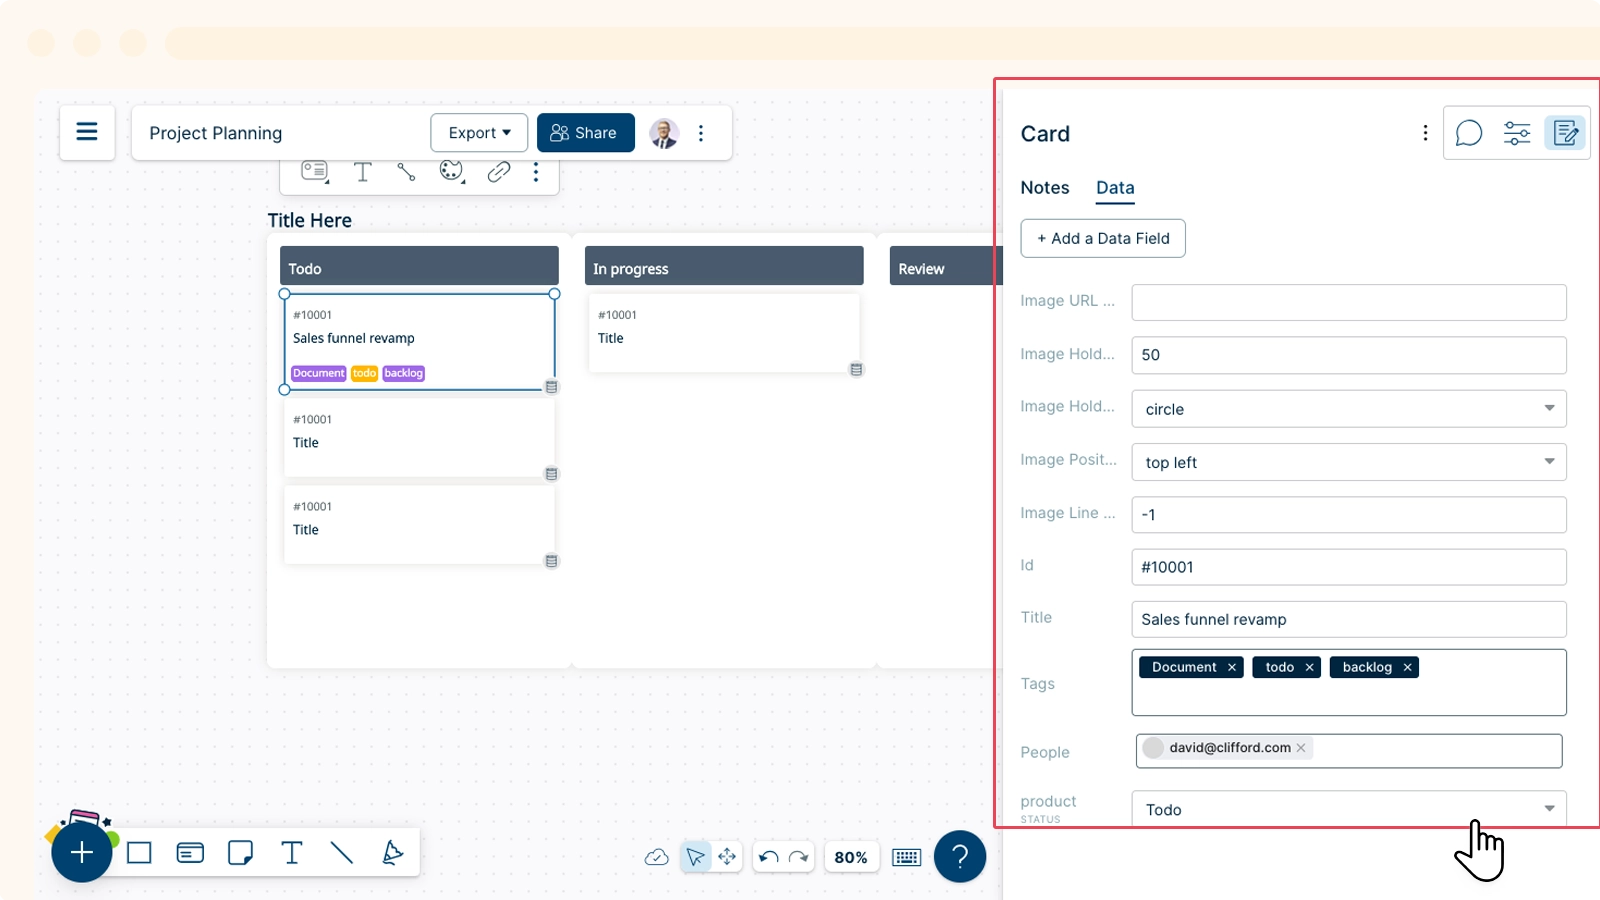
  Notes & Data from the top-right of the canvas. Based on your workflow, the application identifies the type of frame that the shape is in.
Simply drag and drop cards/issues/shapes into your Kanban board, and based on the added data, they will place themselves in the board.
- When you update the values in the Data panel inside Notes & Data, the placement of the cards in your Kanban board changes.
- Once you have visualized data on the kanban board, let’s select 2x2 grid from Frames and drag it to the canvas.
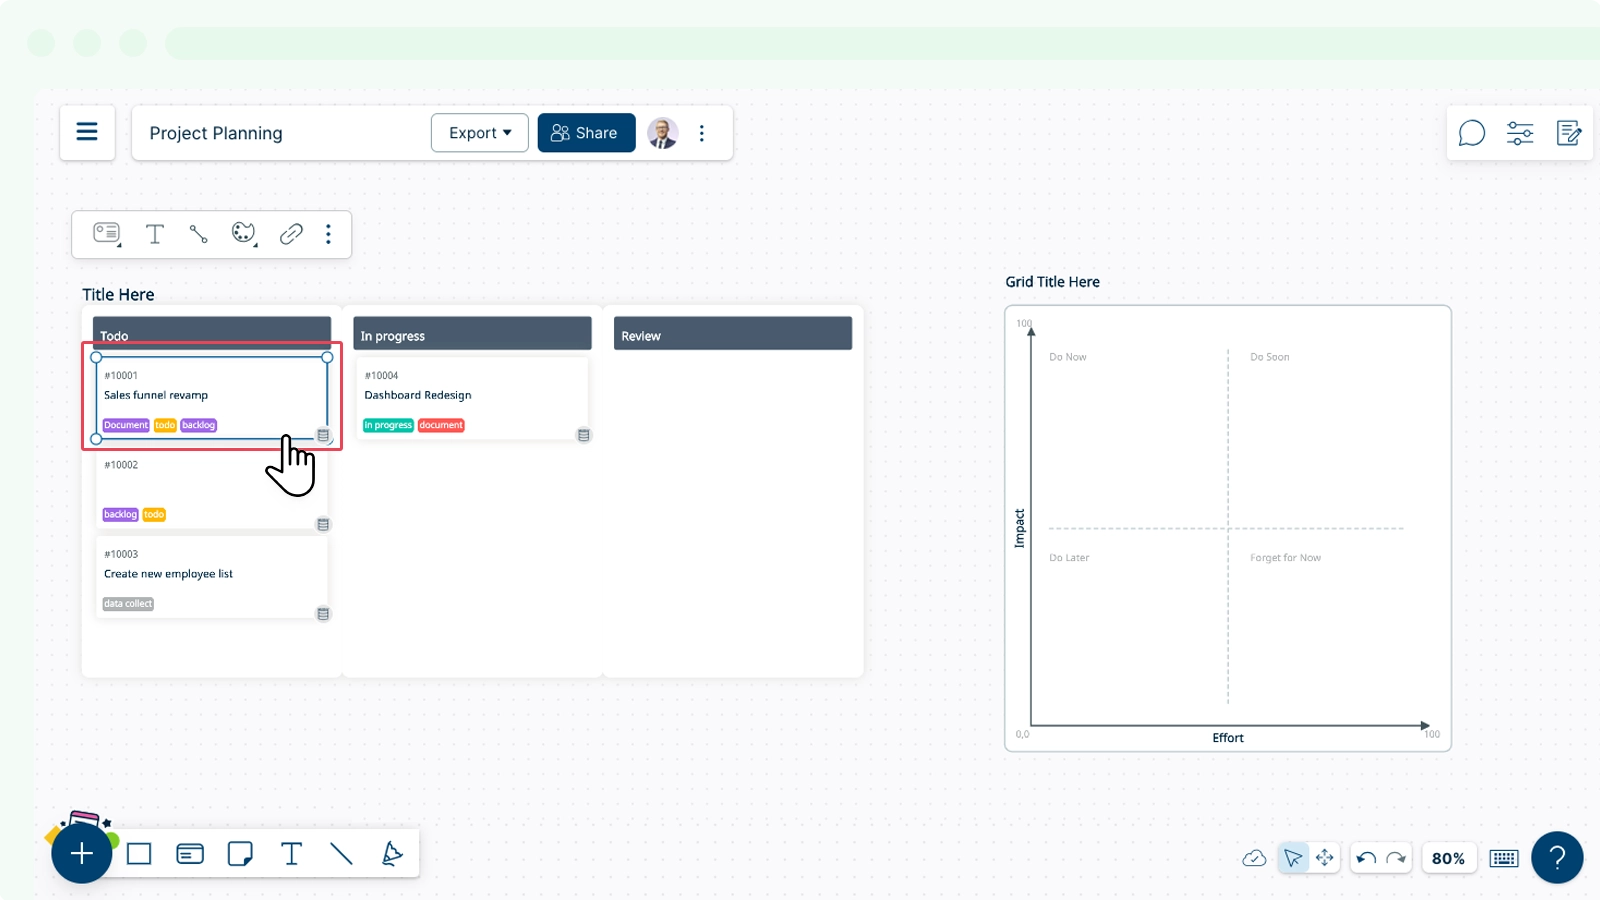
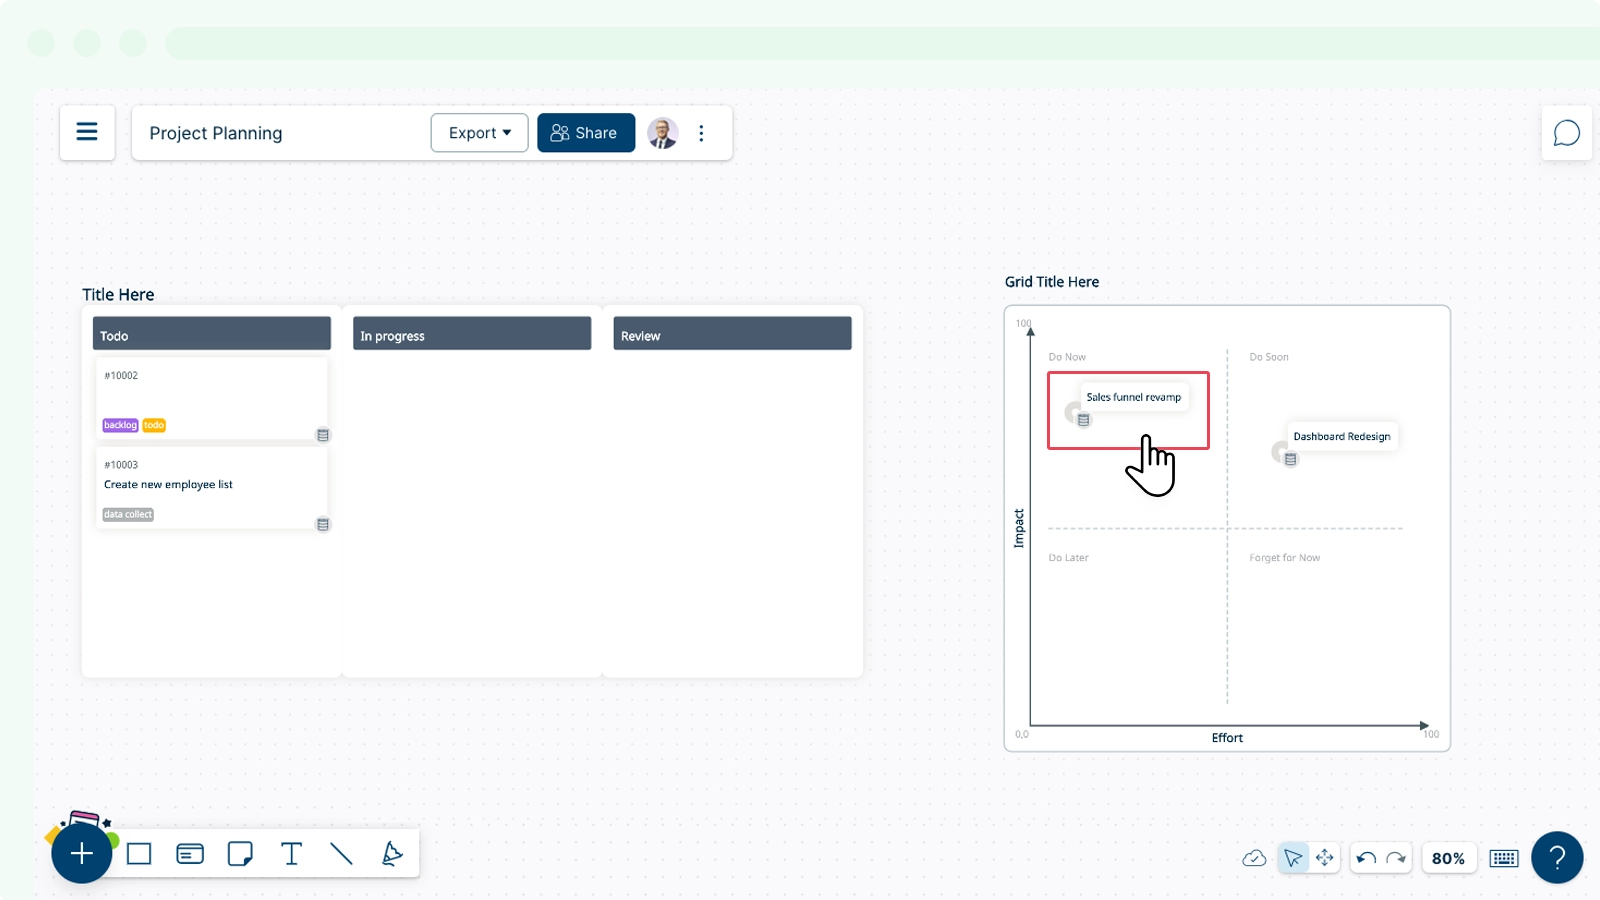
- The same cards can be added to the 2x2 grid, so that you can visualize the data based on the its context. Additional data fields will be automatically added.

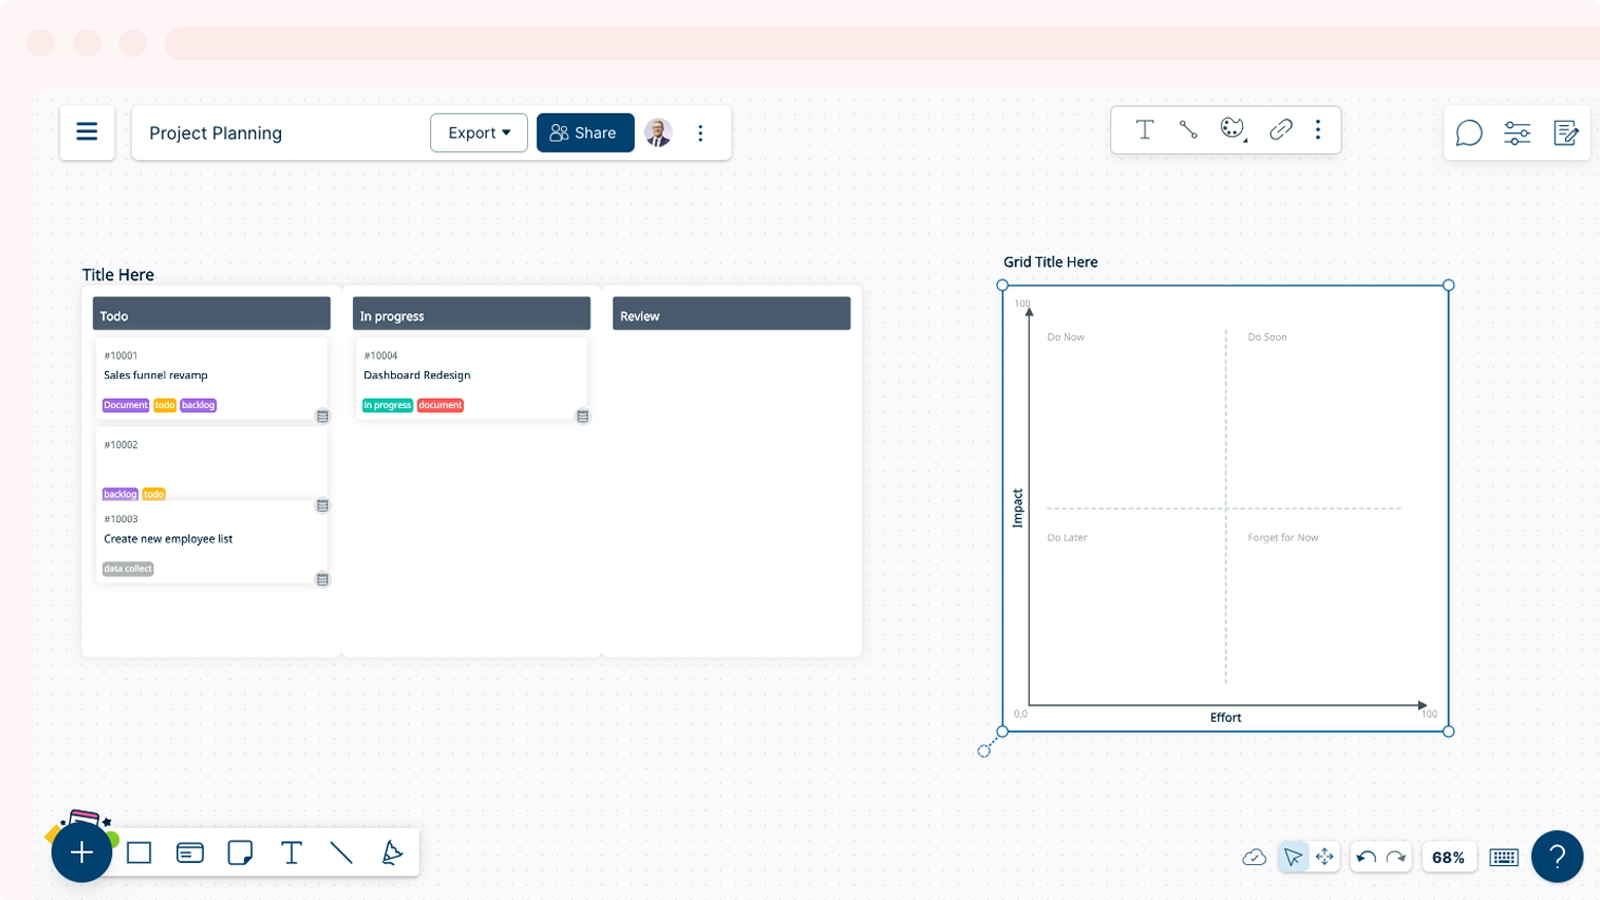
Info: The shape of the card gets updated based on the container it is added into. As you can see, by updating the values in the Data panel, the placement of the pin in your 2x2 grid changed.