Easily visualize your processes and workflows with smart automation.
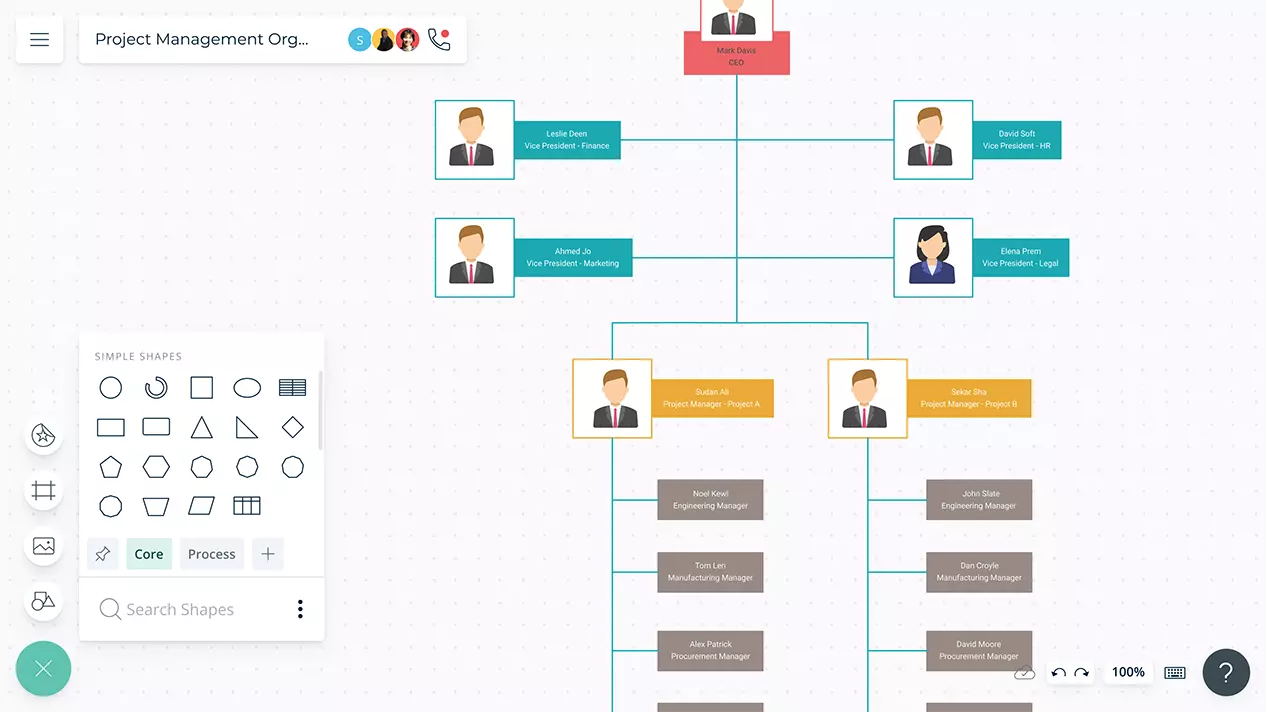
Create visual organizational structures with images and detailed profiles.
Visualize concepts and their relationships on an infinite visual canvas.
Map family history and understand the relationships with detailed genograms.
Visualize relationships between entities using Crows Foot or Chen notation.
Visualize your network infrastructure. Support AWS, CISCO, Azure and more.
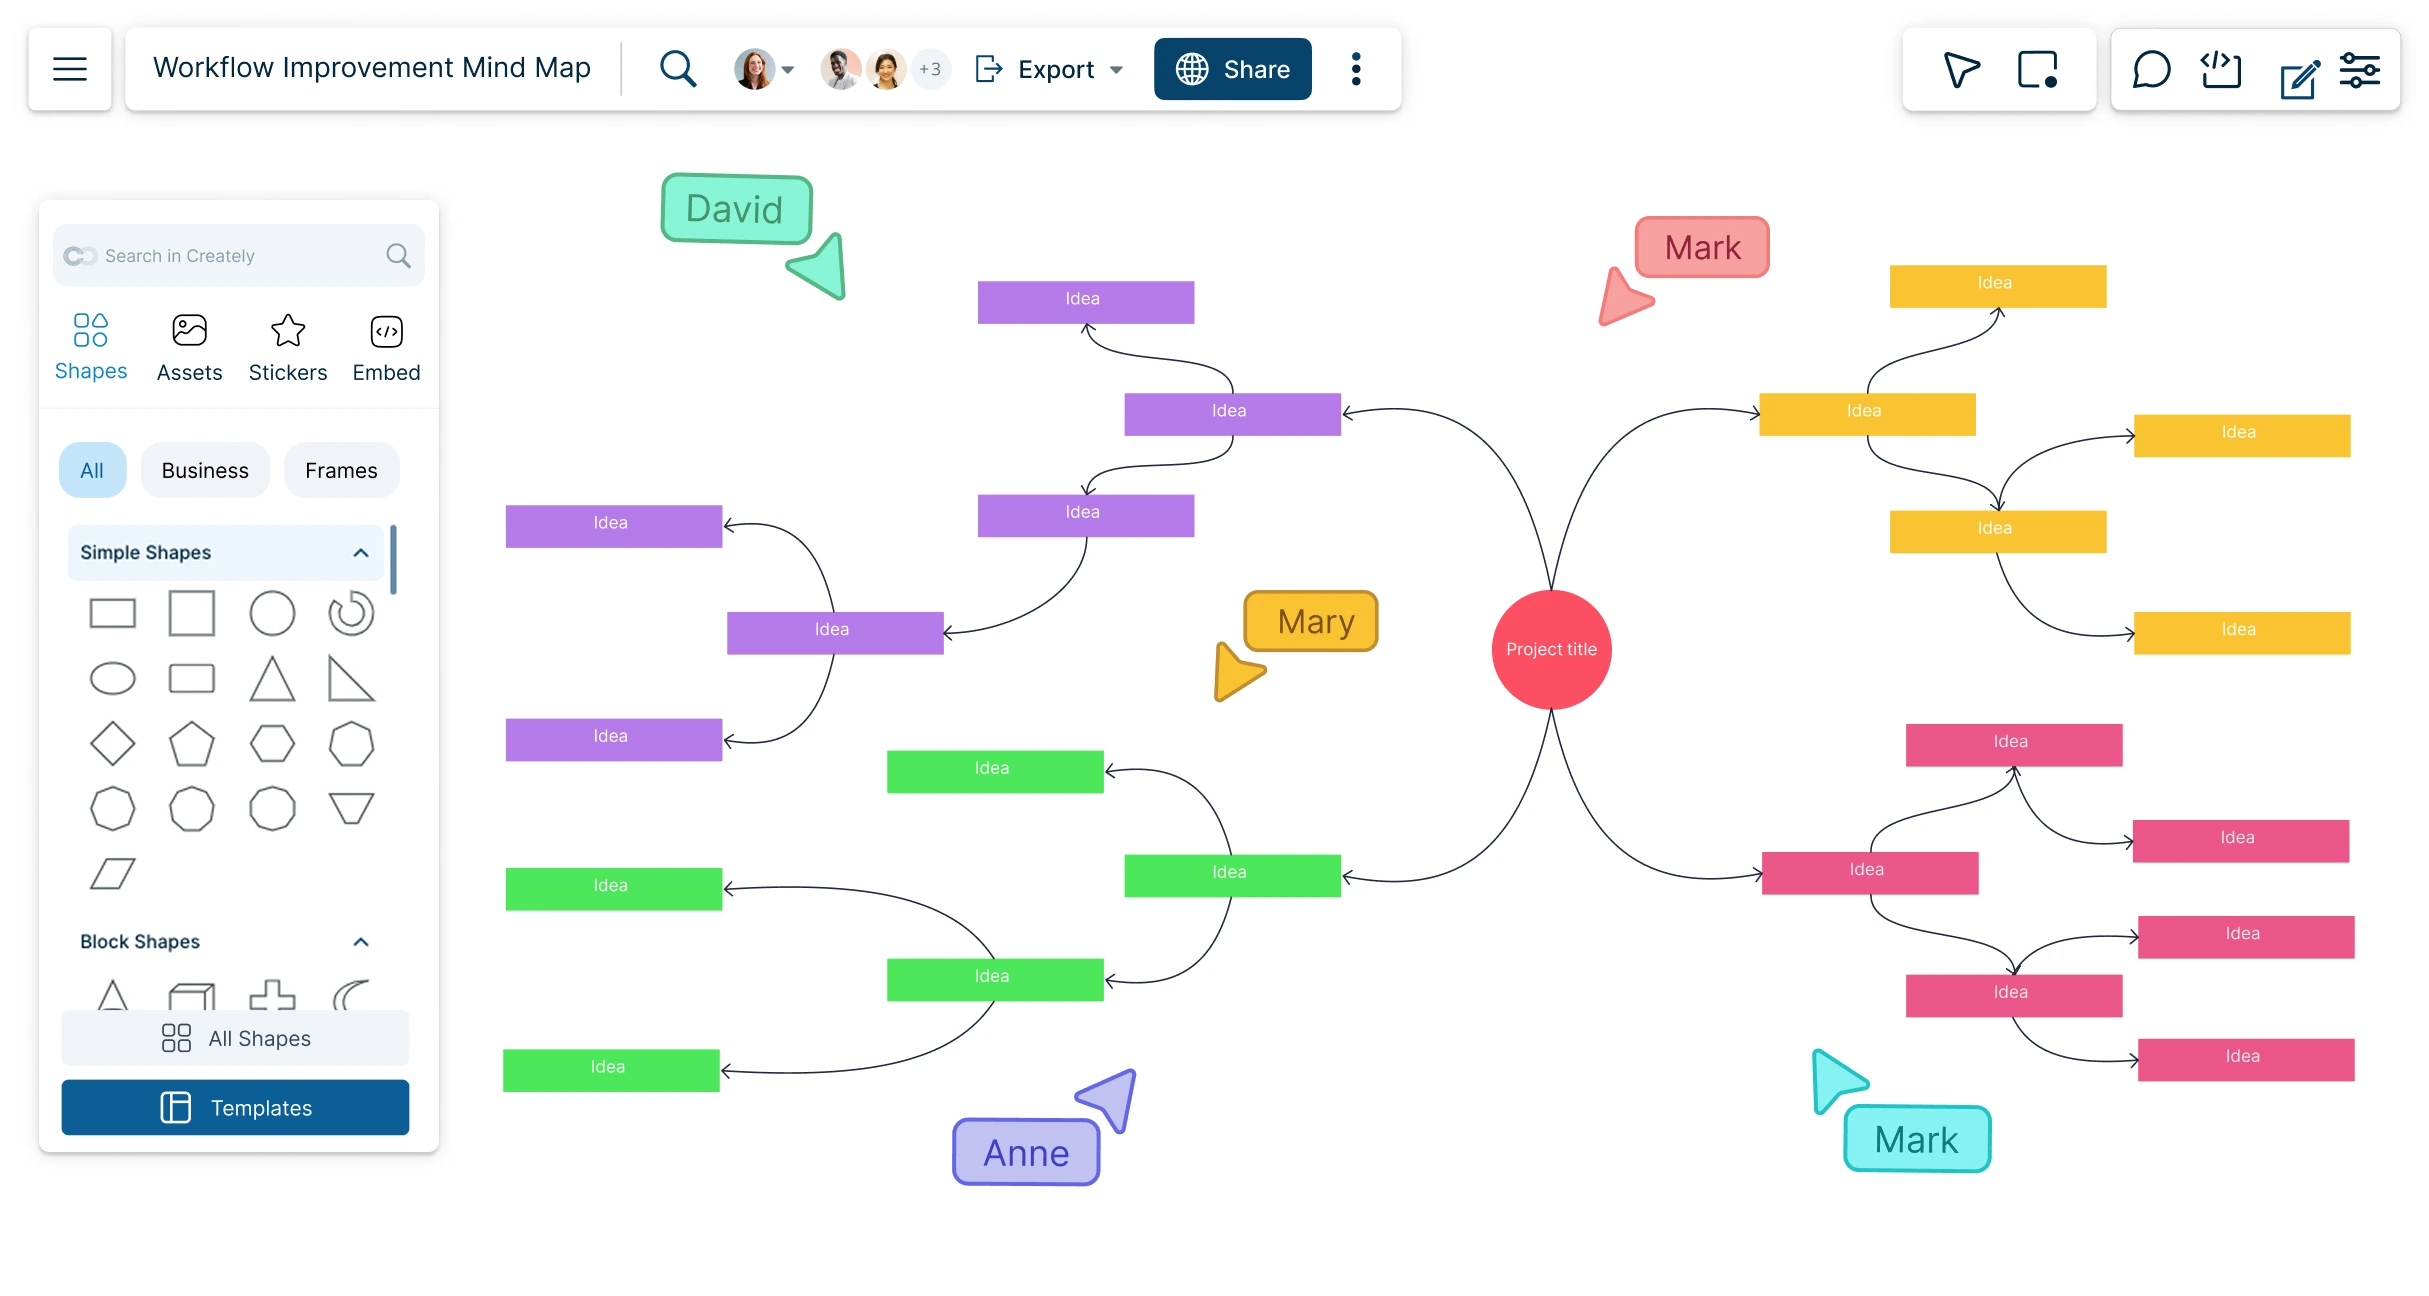
Visualize and expand your ideas using our powerful mind mapping tool.
Easily create family trees with our professionally designed templates.
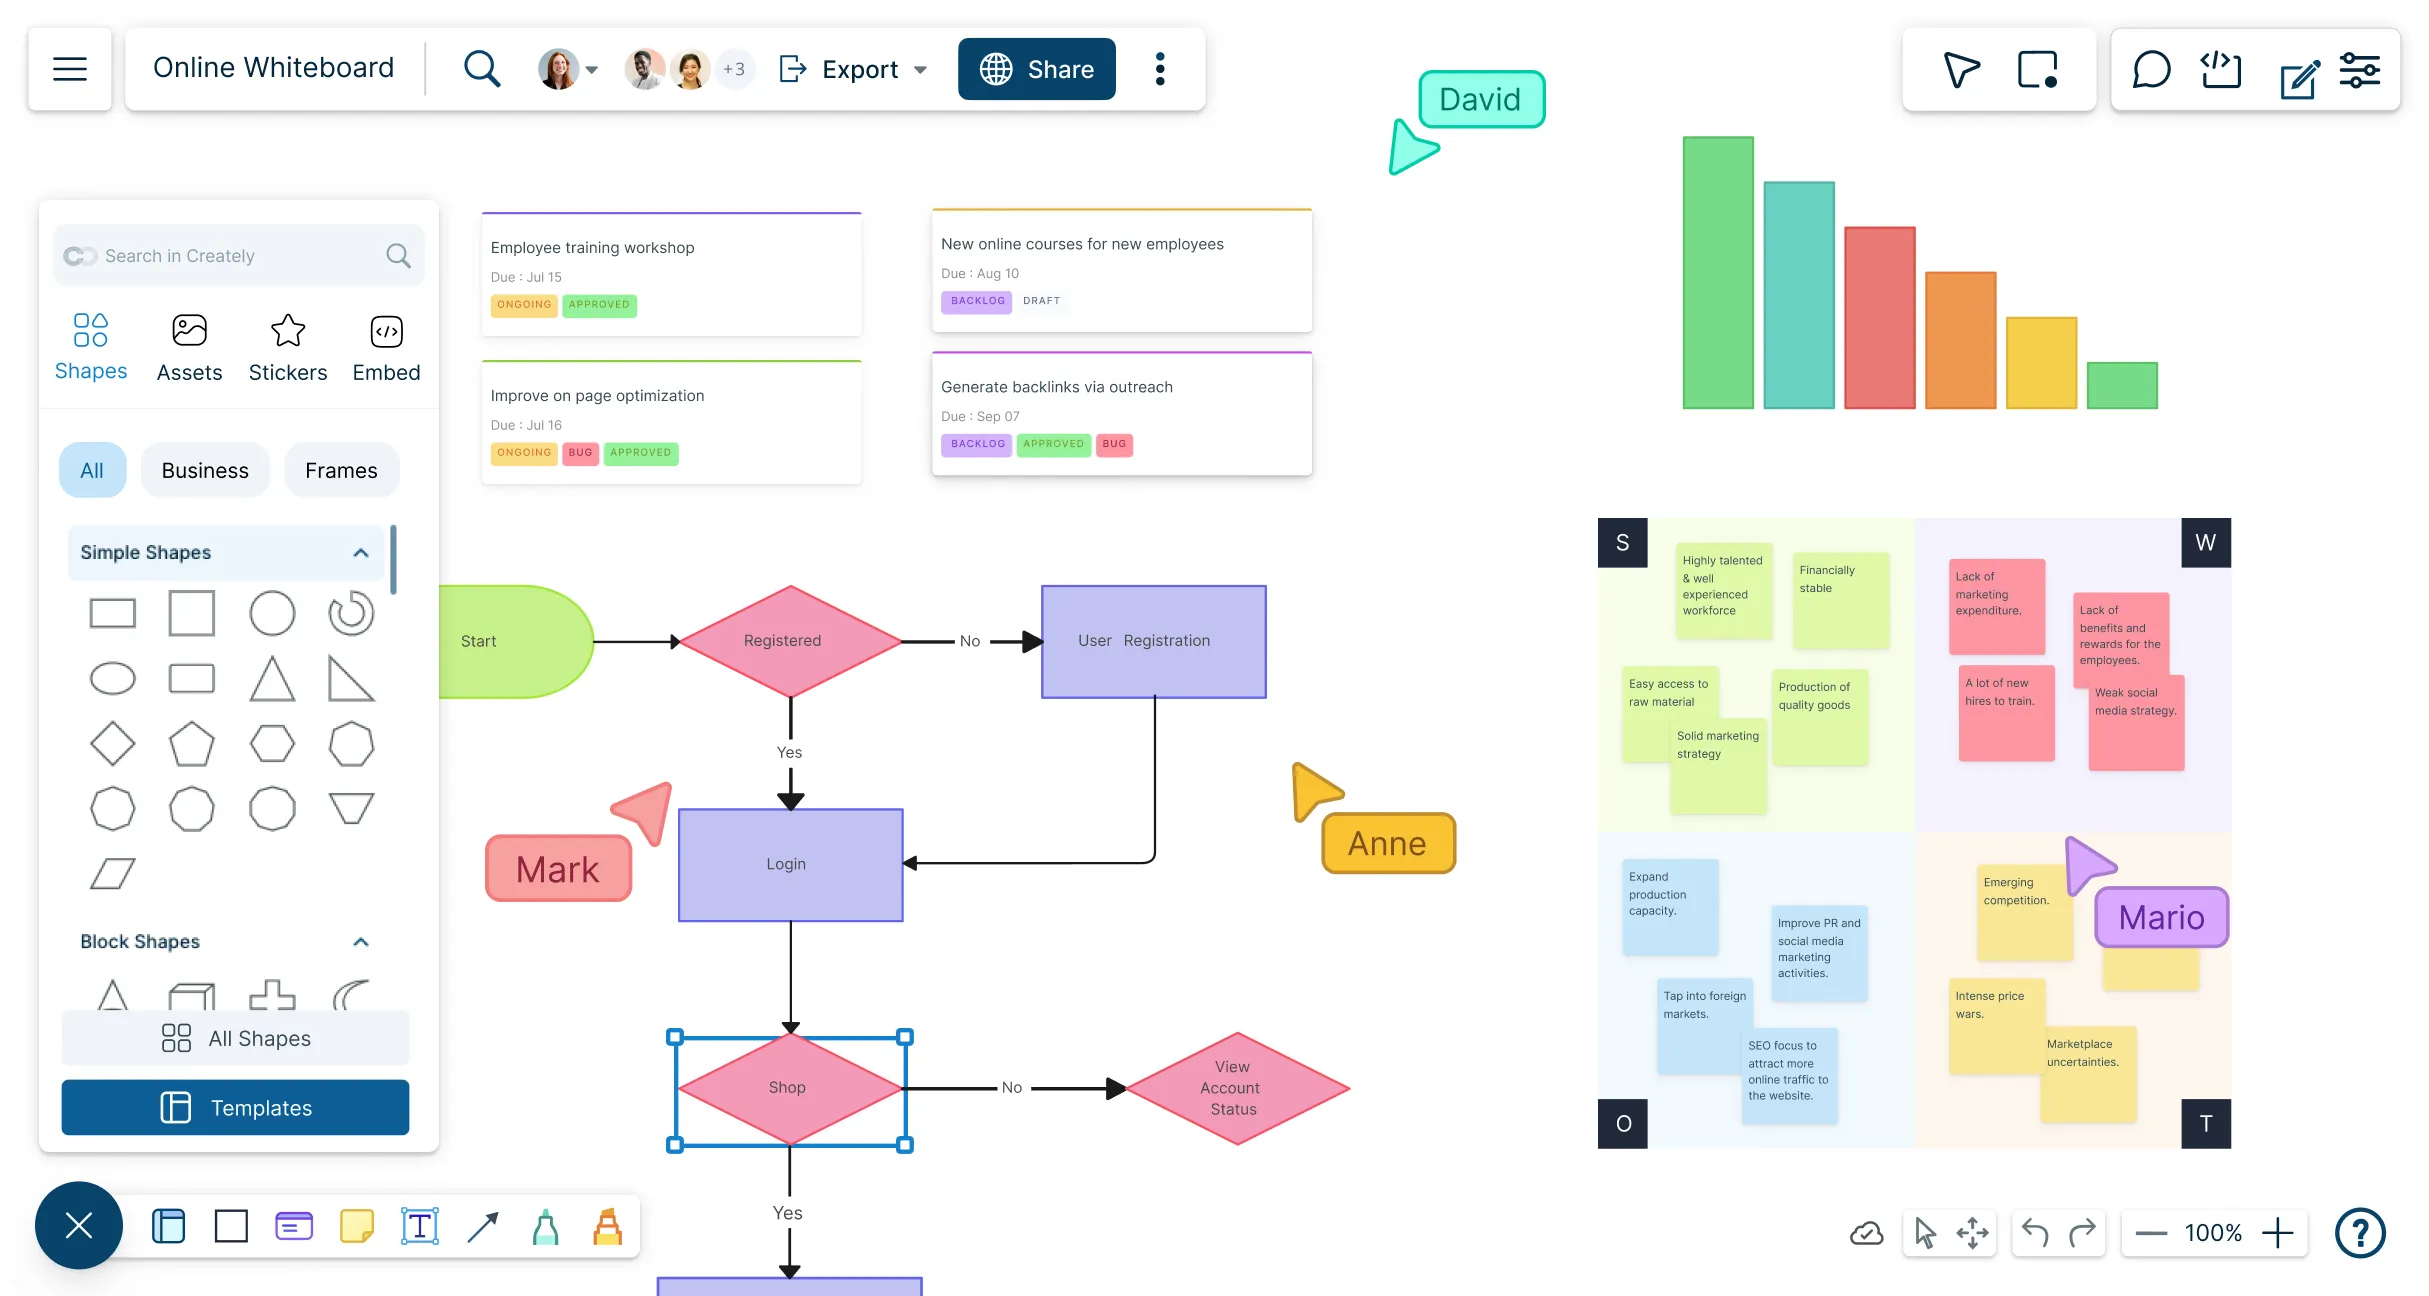
Infinite canvas to add diagrams, images, sticky notes and more.
Run collaborative meetings, workshops or brainstorming sessions.
Collaborative diagramming for educators and students at discounted rates.
Log In
Sign Up Free
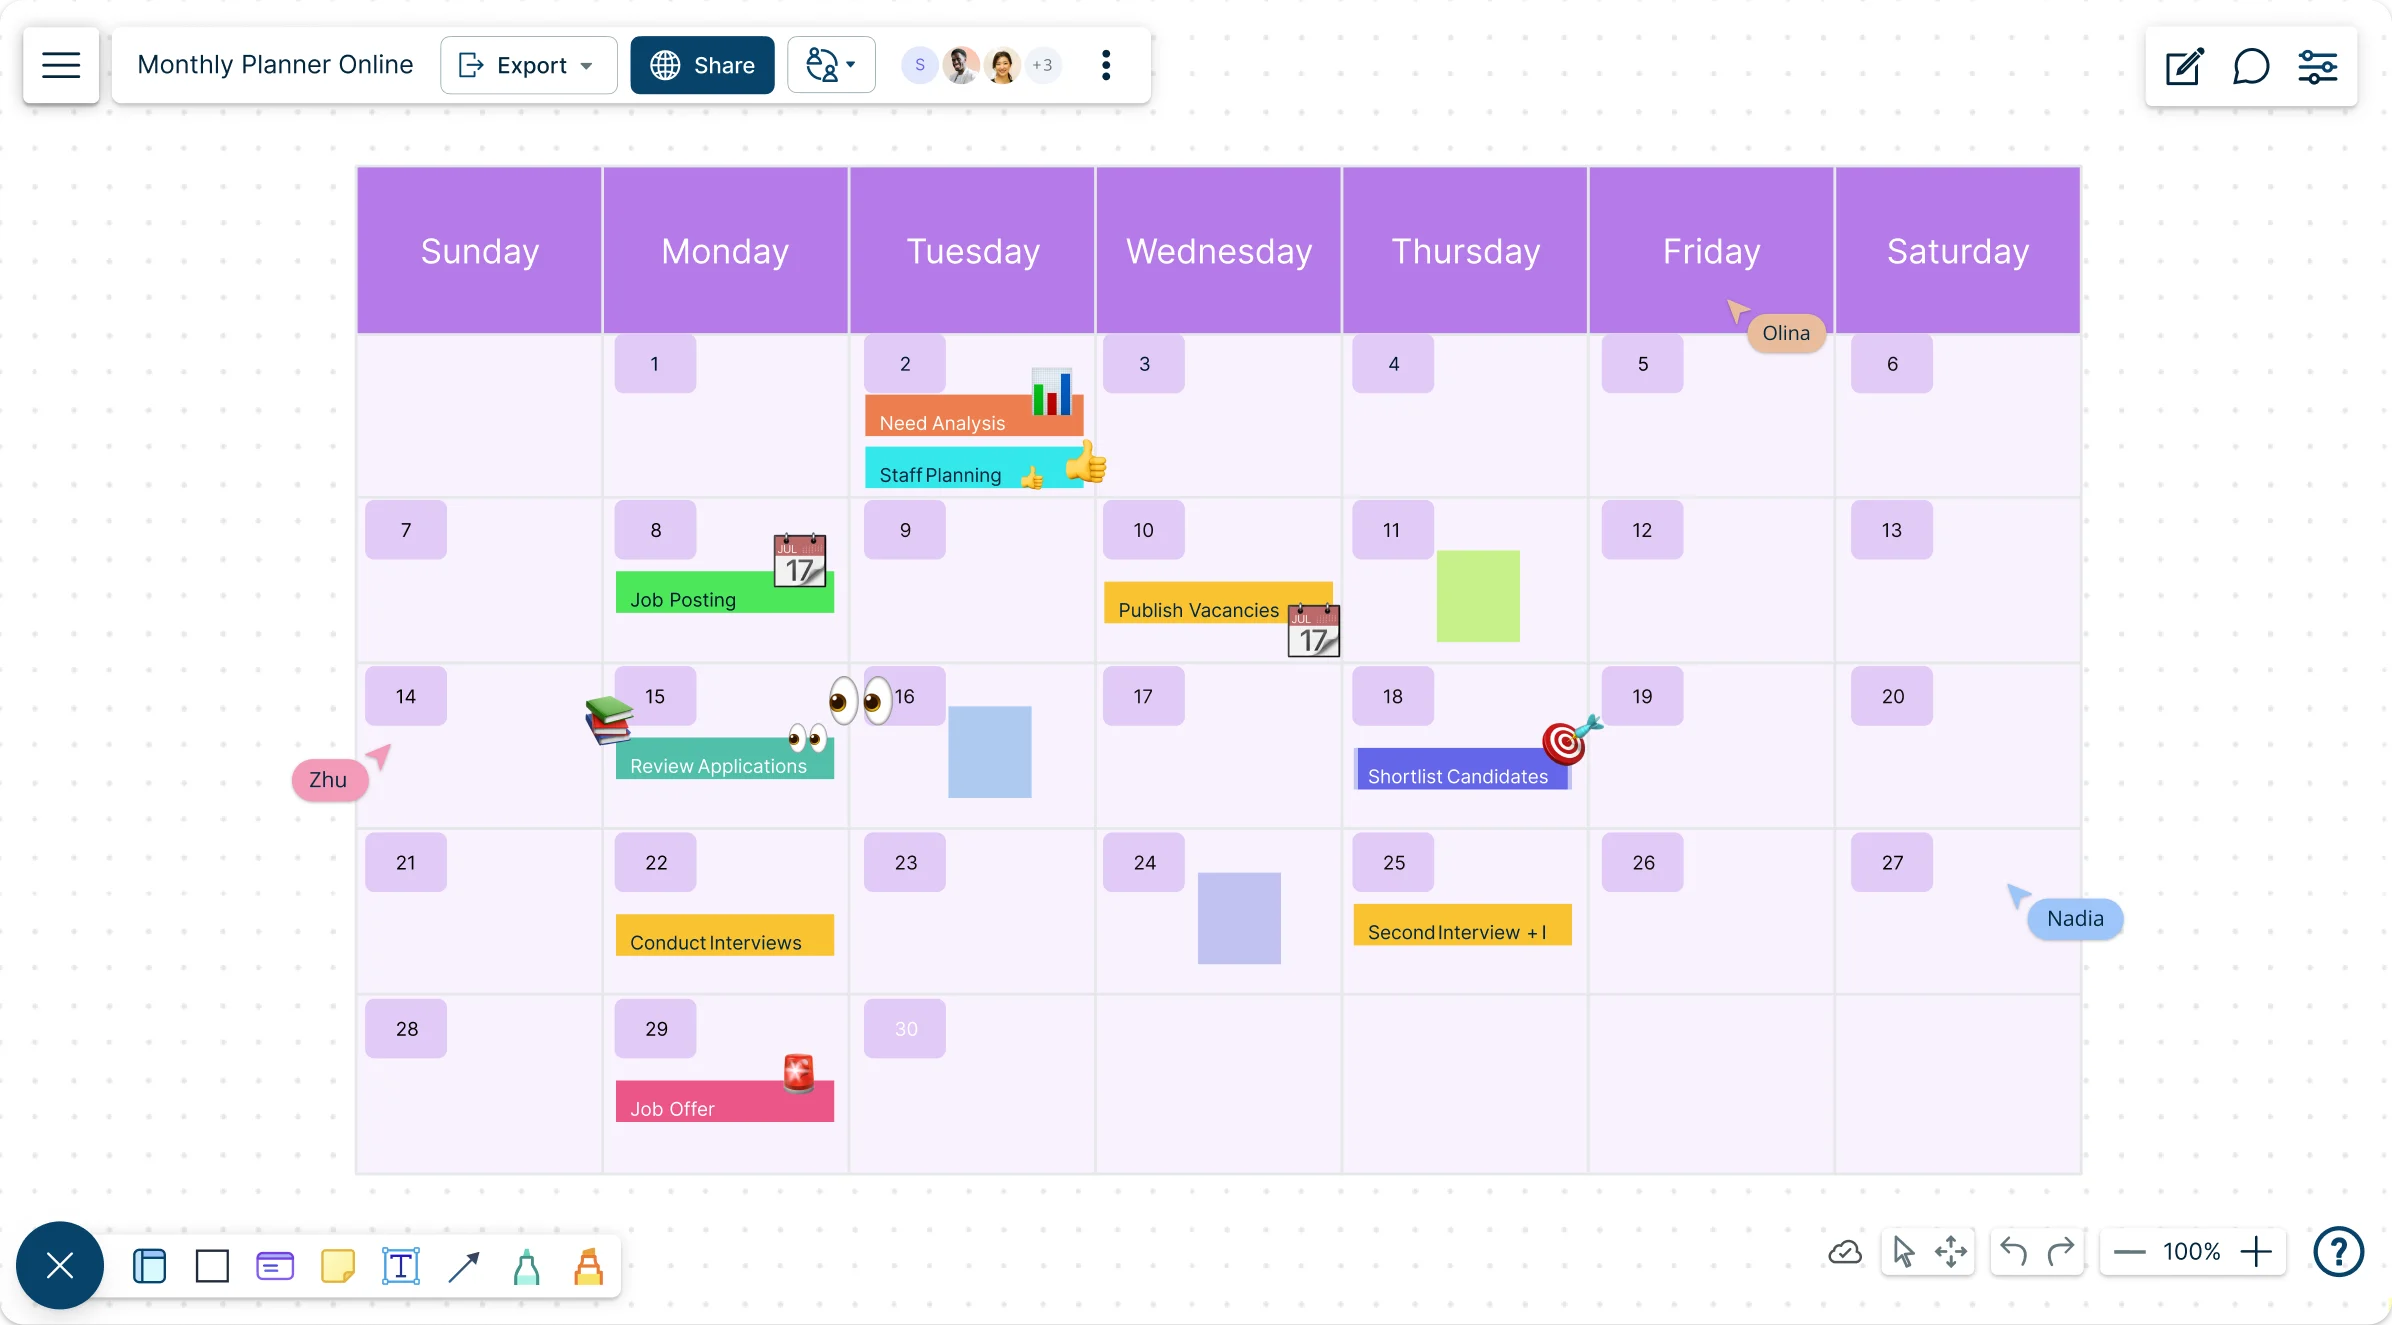
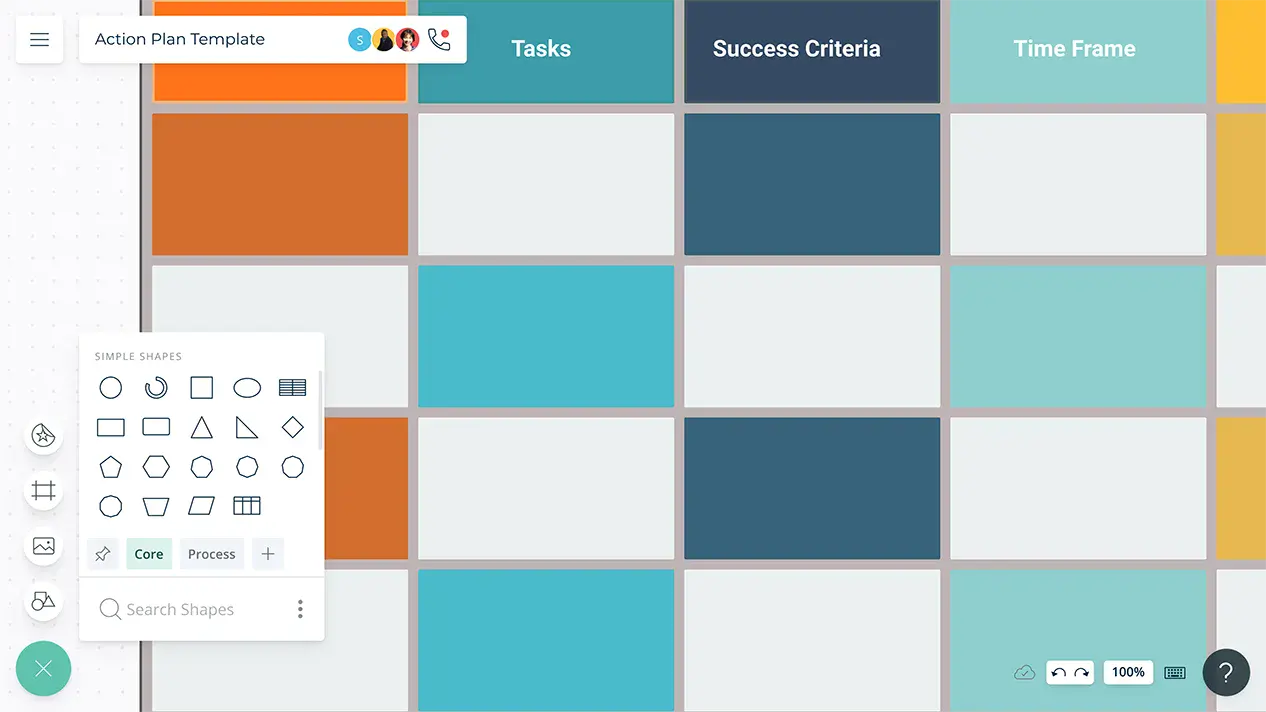
An interactive visual planner to easily organize, manage, and track your monthly tasks and project goals in a single place.
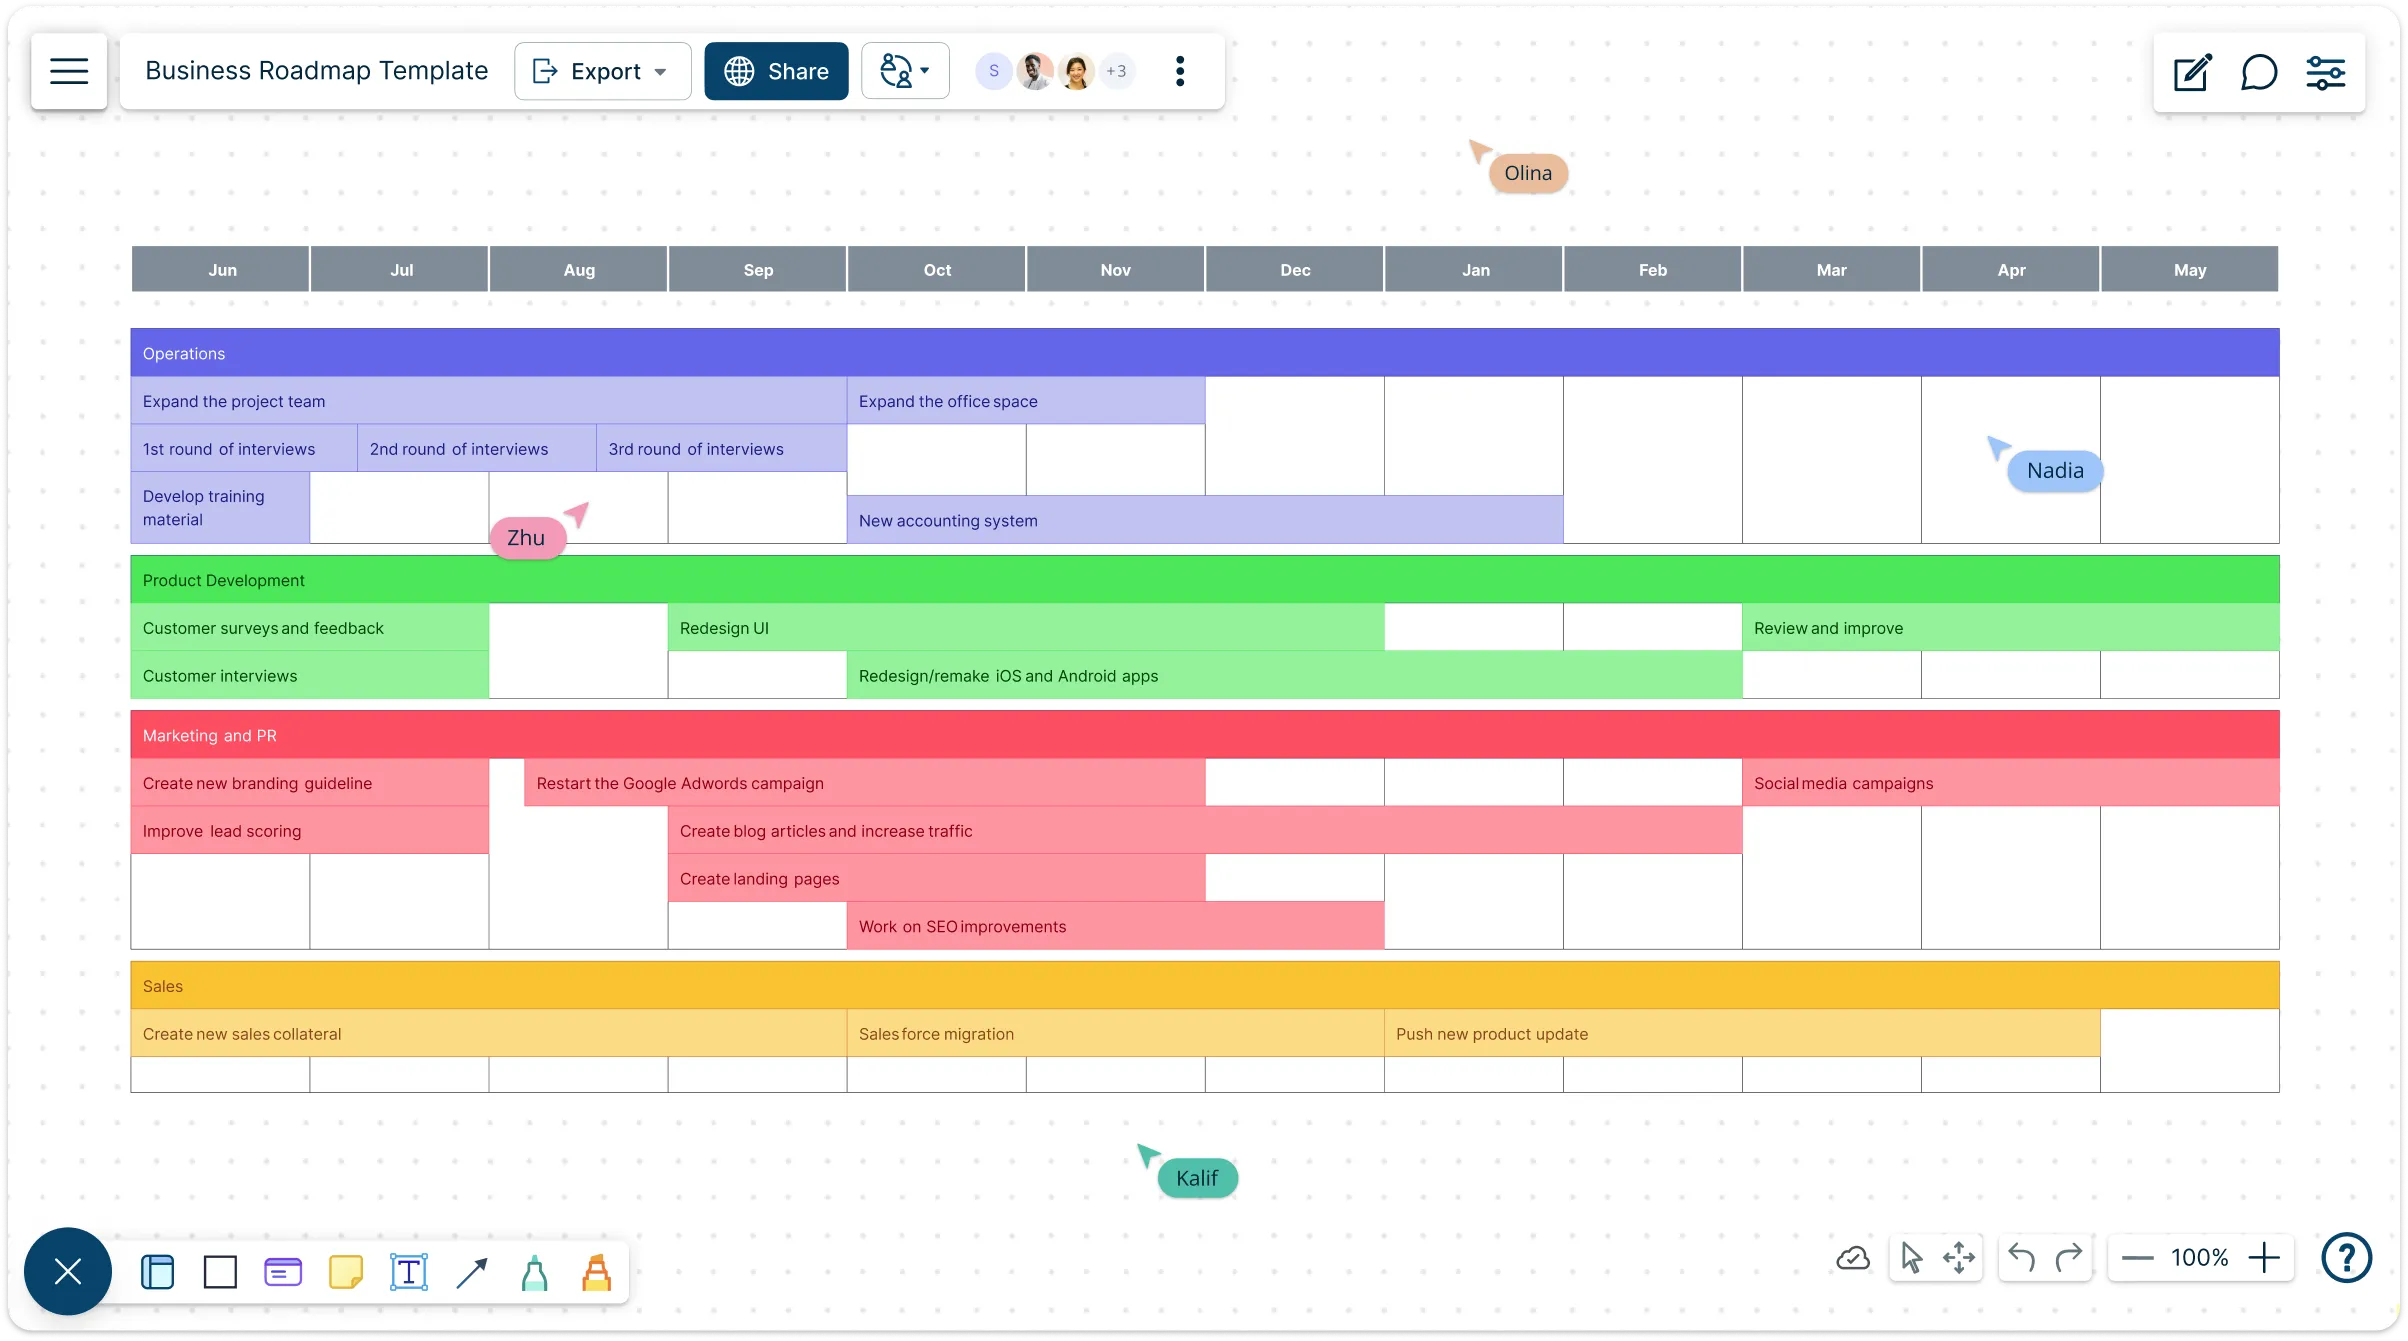
Use Creately's visual business roadmap creator to define goals, map strategic initiatives, and turn plans into clear, actionable steps teams can align on and execute together.
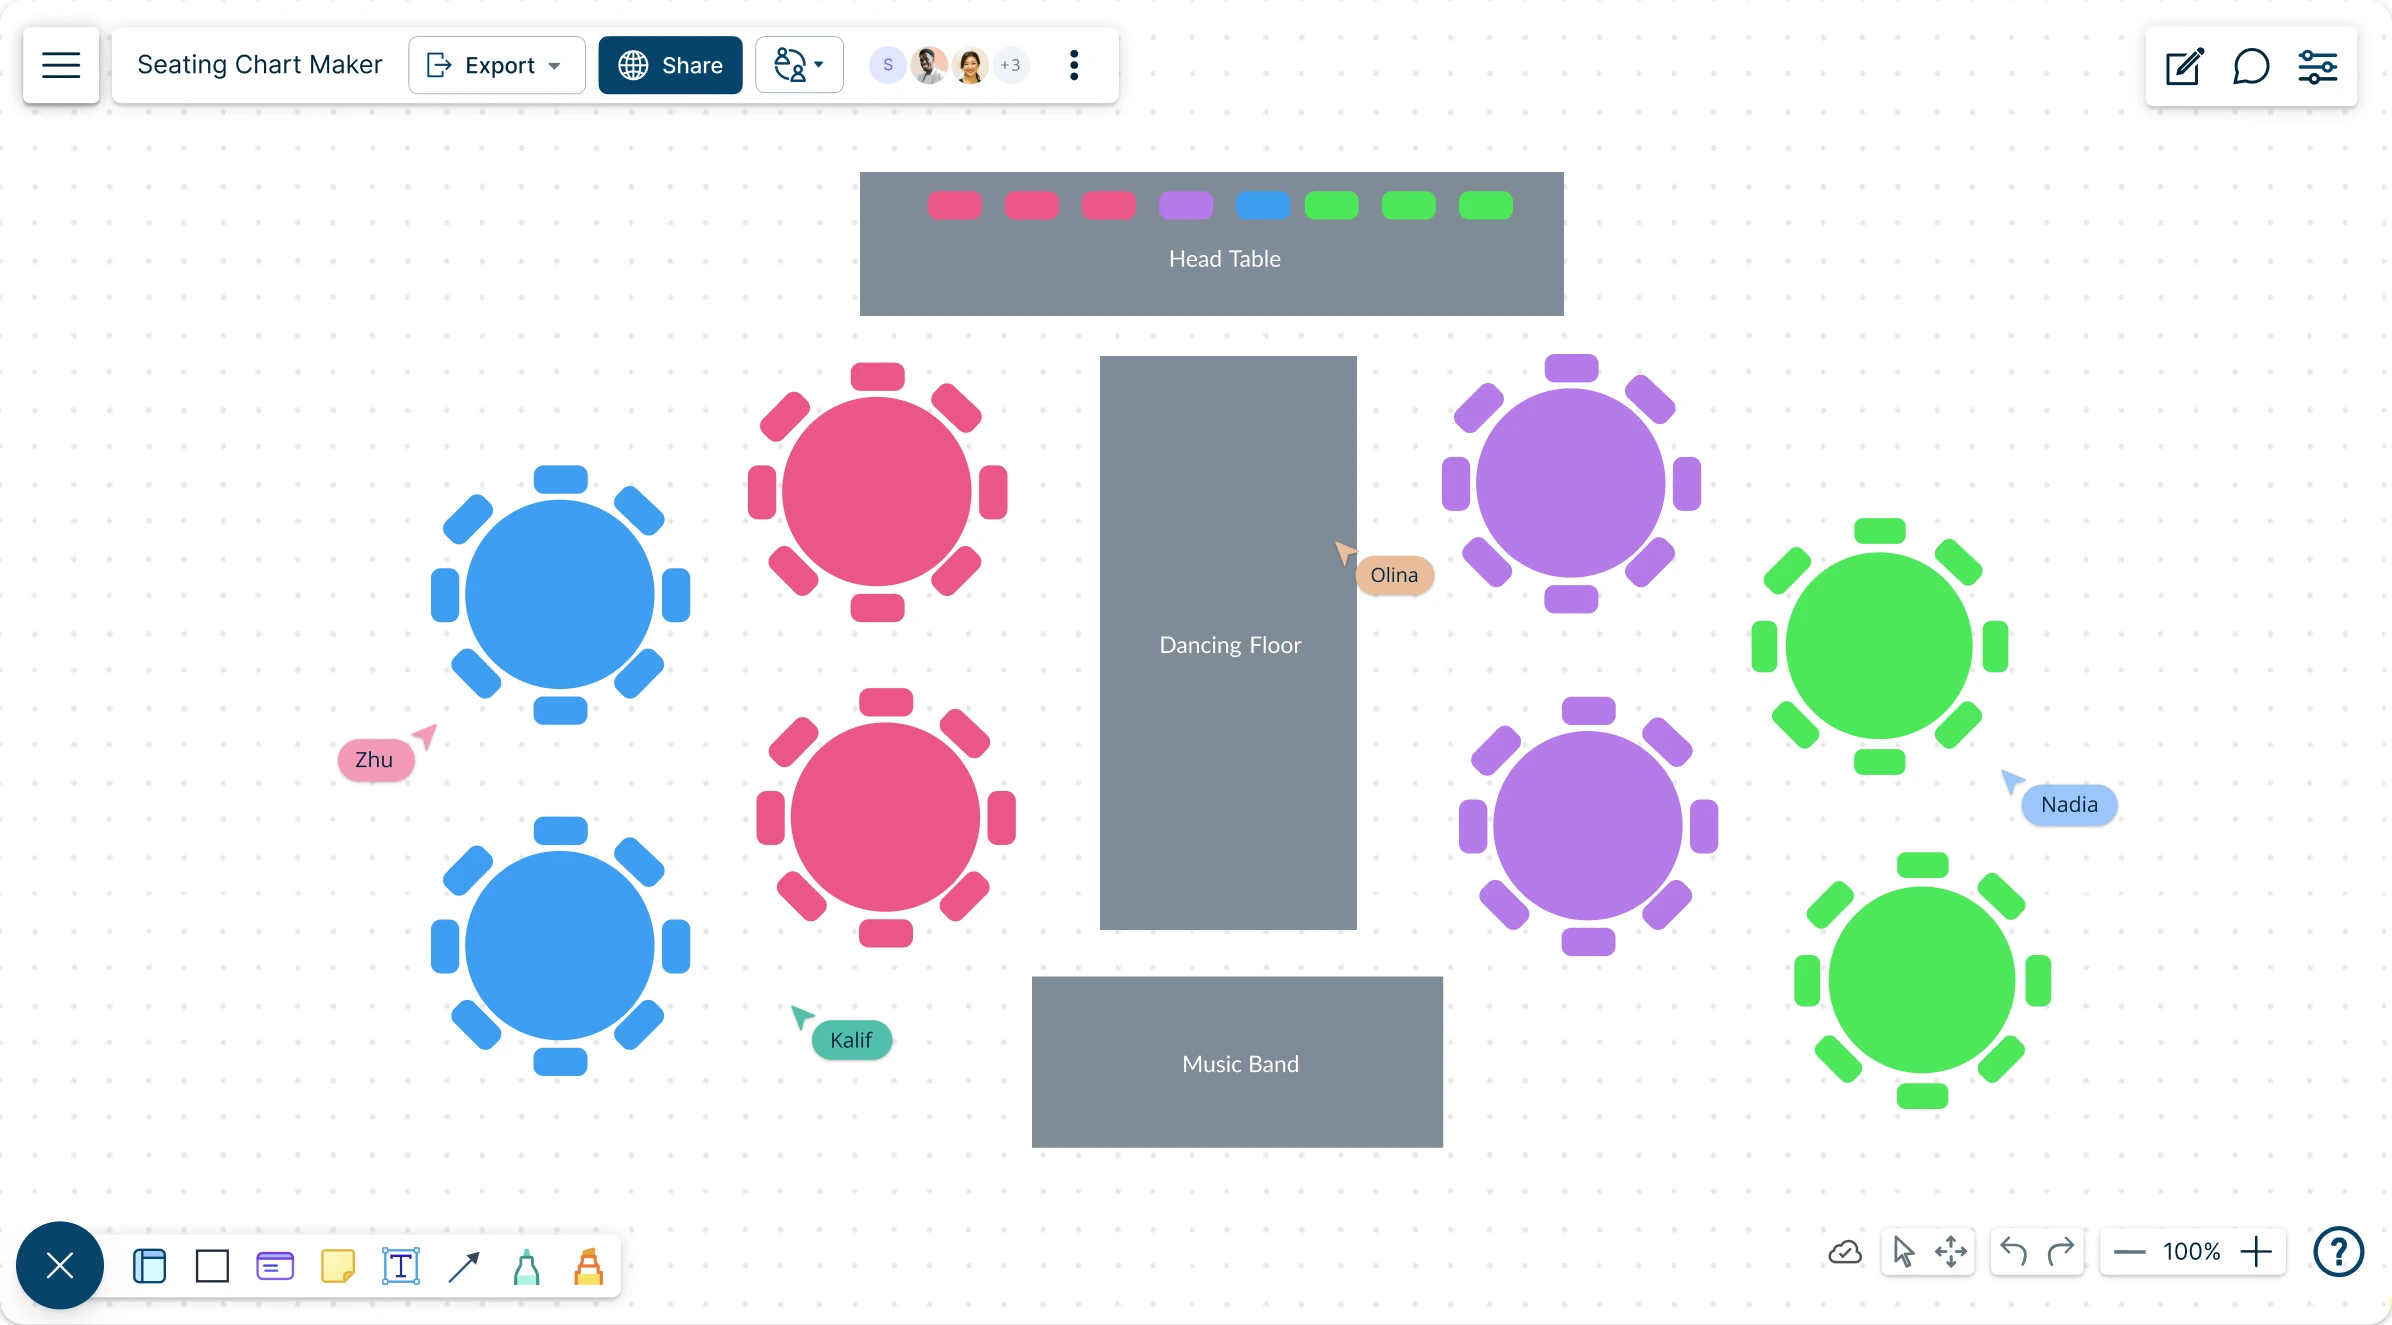
Plan smarter events with seating charts that instantly assign the right seat to every guest.
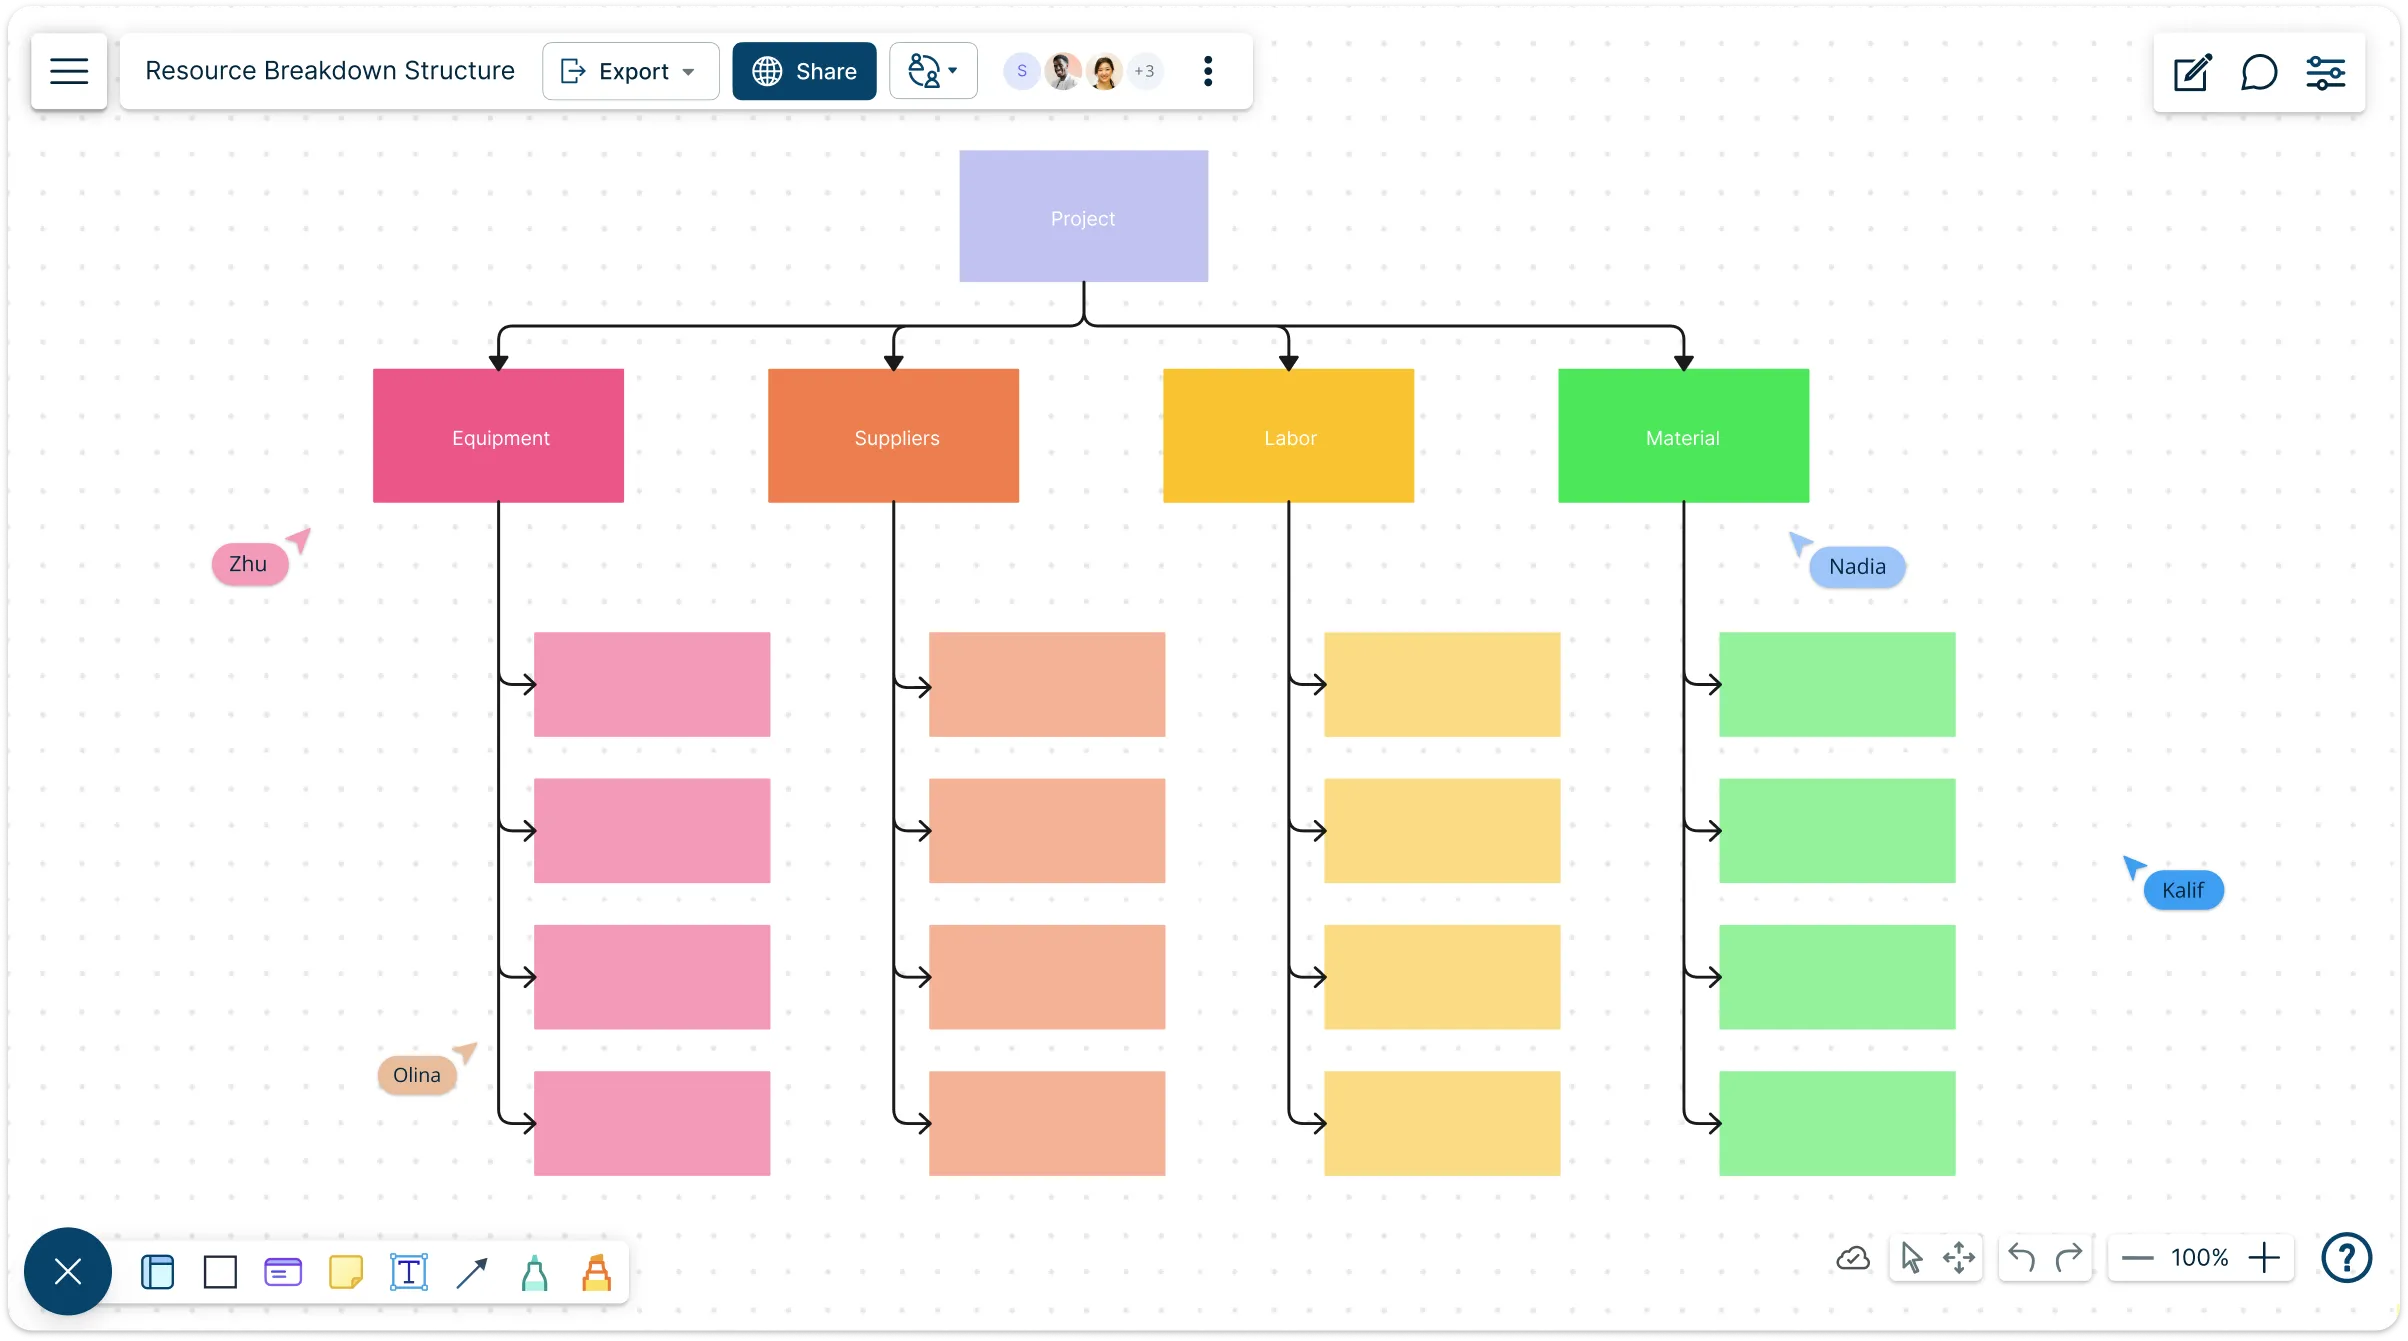
Kick off projects with clarity, not guesswork. Creately’s resource breakdown structure template lets you instantly map people, tools, time, and costs in one visual view—so you spot gaps early, estimate confidently, and keep work moving fast.
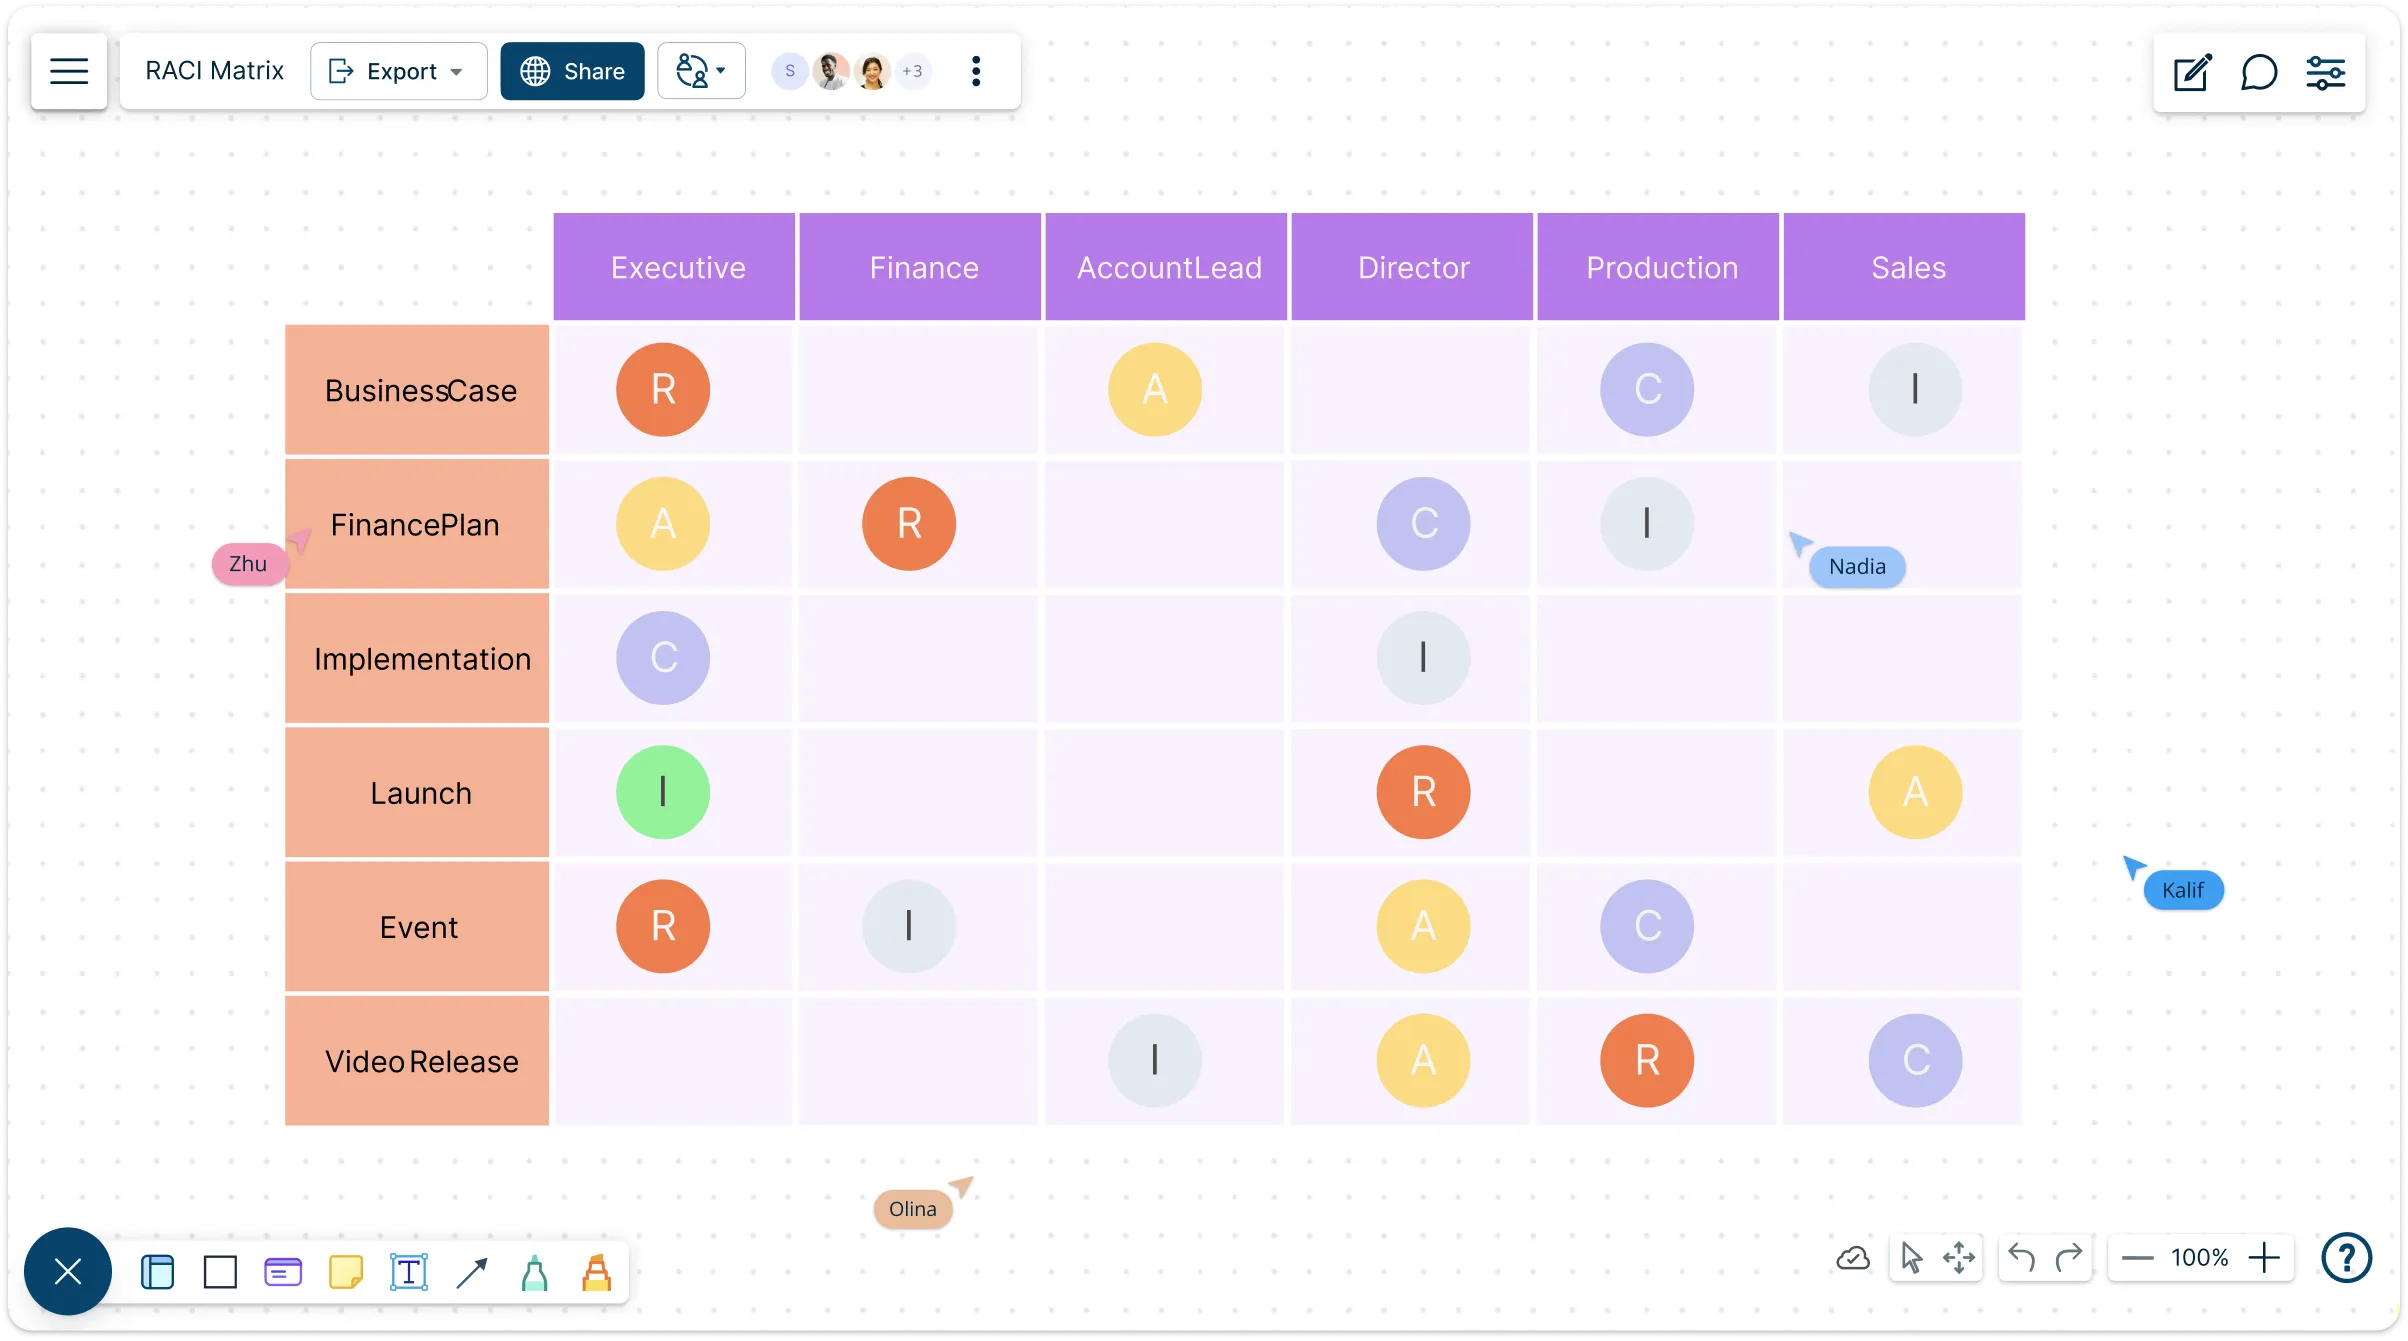
Keep your team aligned and your projects on track with Creately’s RACI chart maker. Quickly map who’s Responsible, Accountable, Consulted, and Informed for every task—without messy spreadsheets or endless email threads.
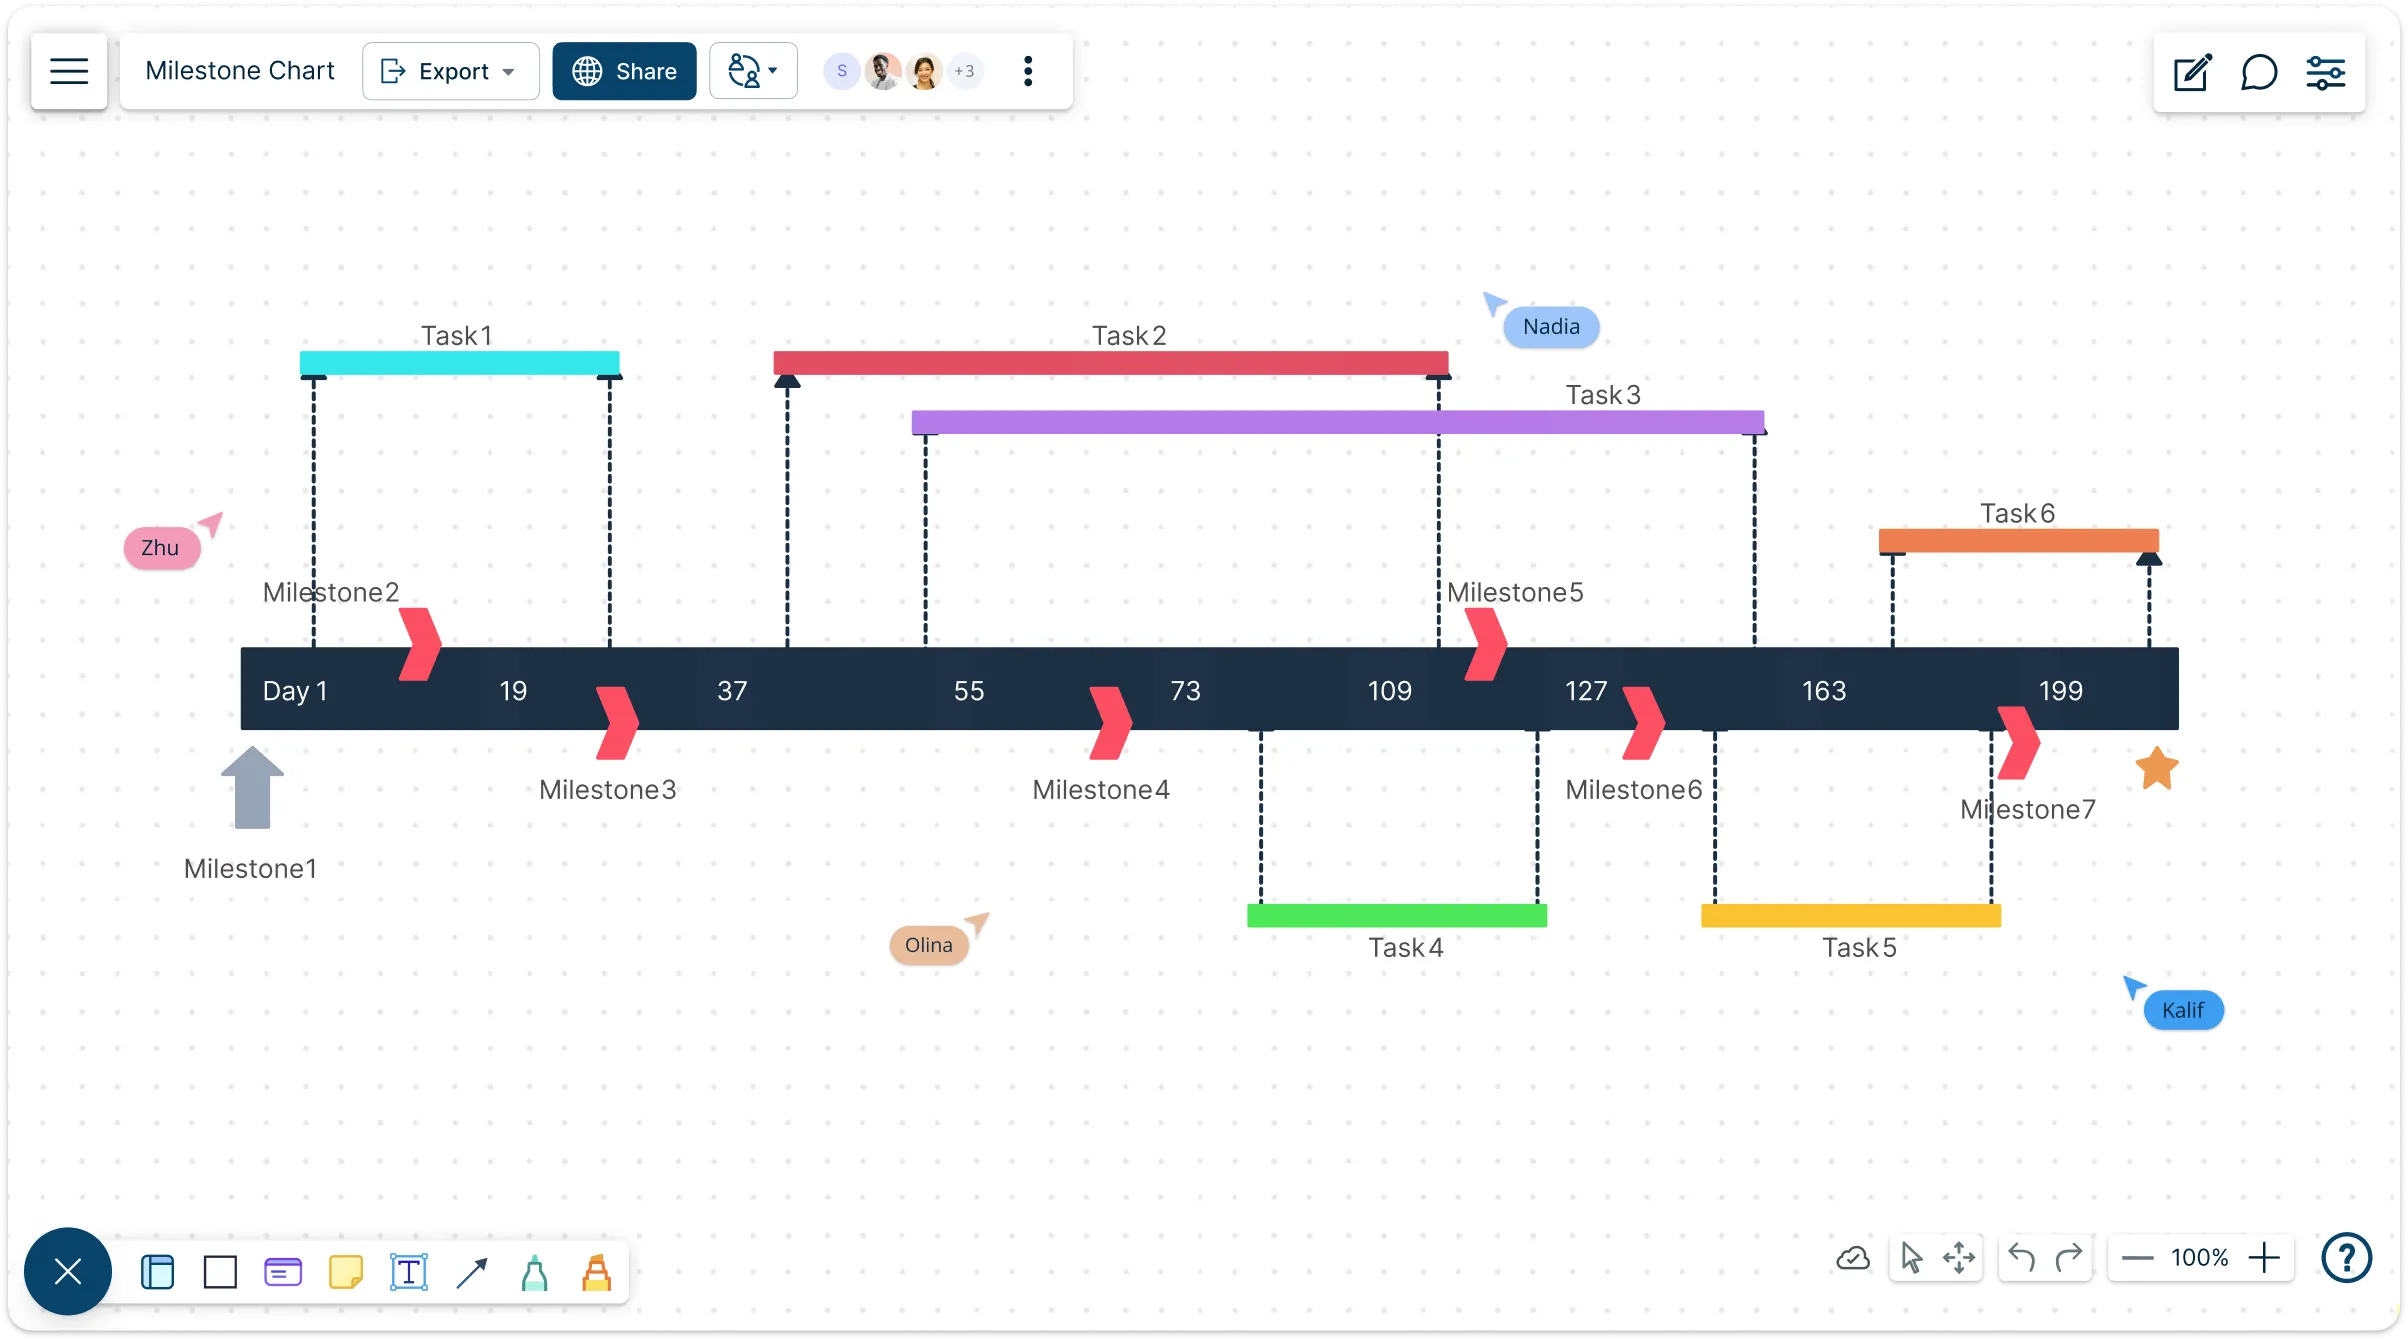
Stay on top of your projects, track progress, and hit every milestone with confidence. Creately’s milestone chart maker transforms complex timelines into visual, easy-to-follow charts that keep your team aligned and your goals in focus.
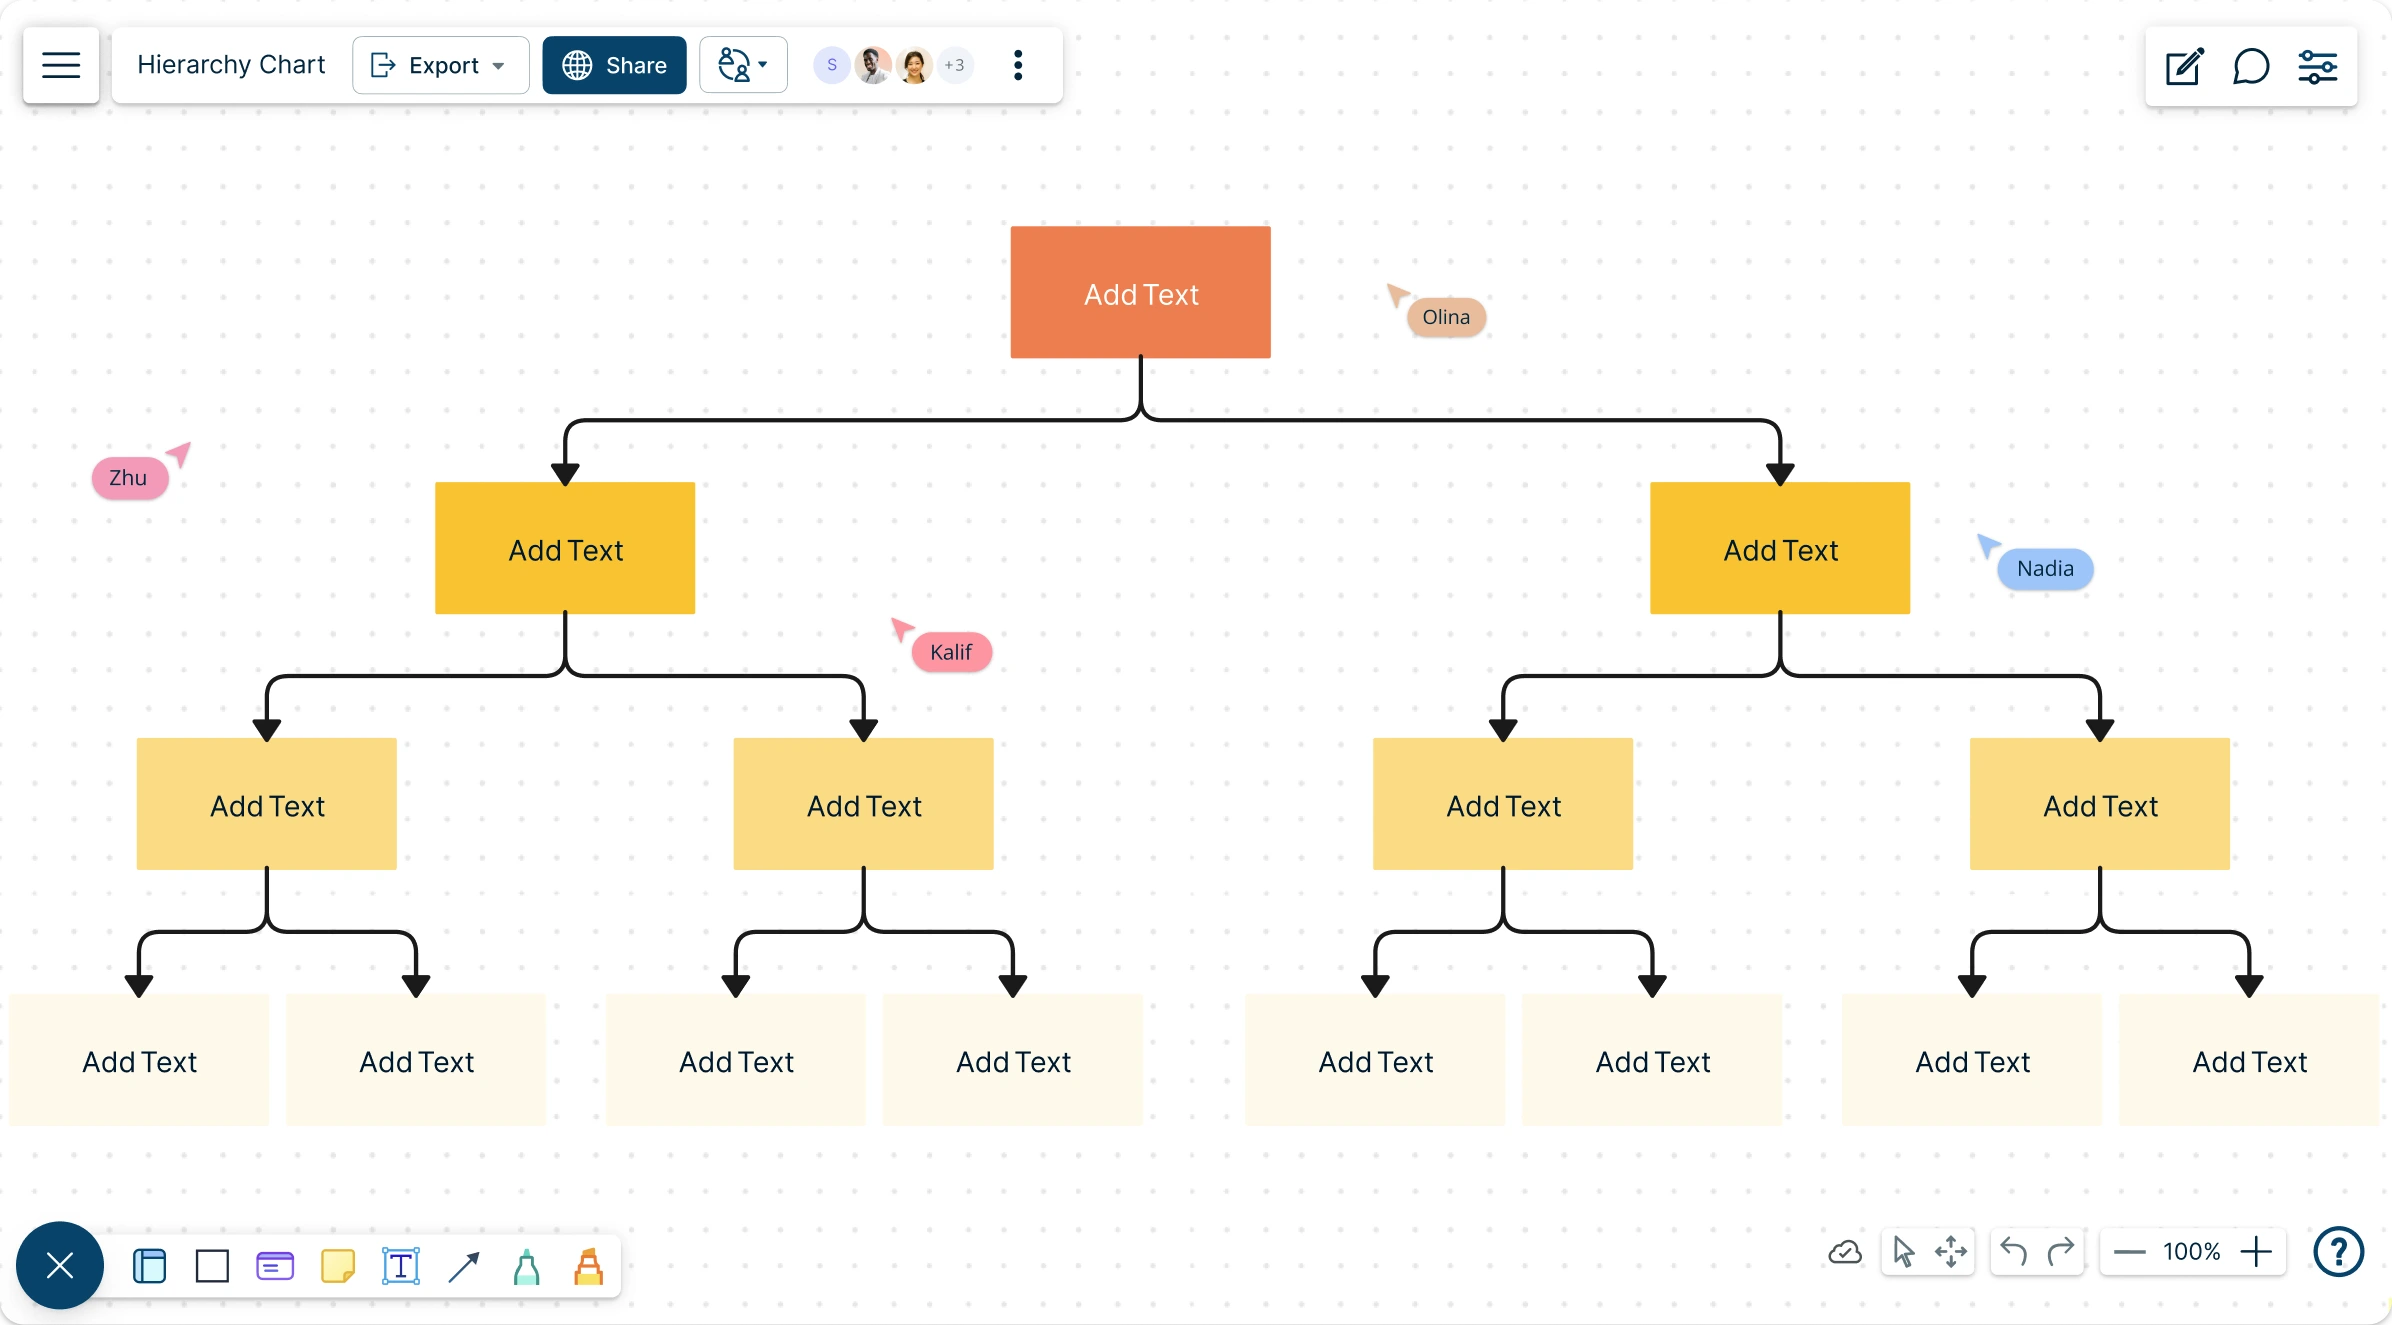
Quickly build and visualize your hierarchies with Creately hierarchy chart maker. Get clear, actionable insights into your team's structure in no time.
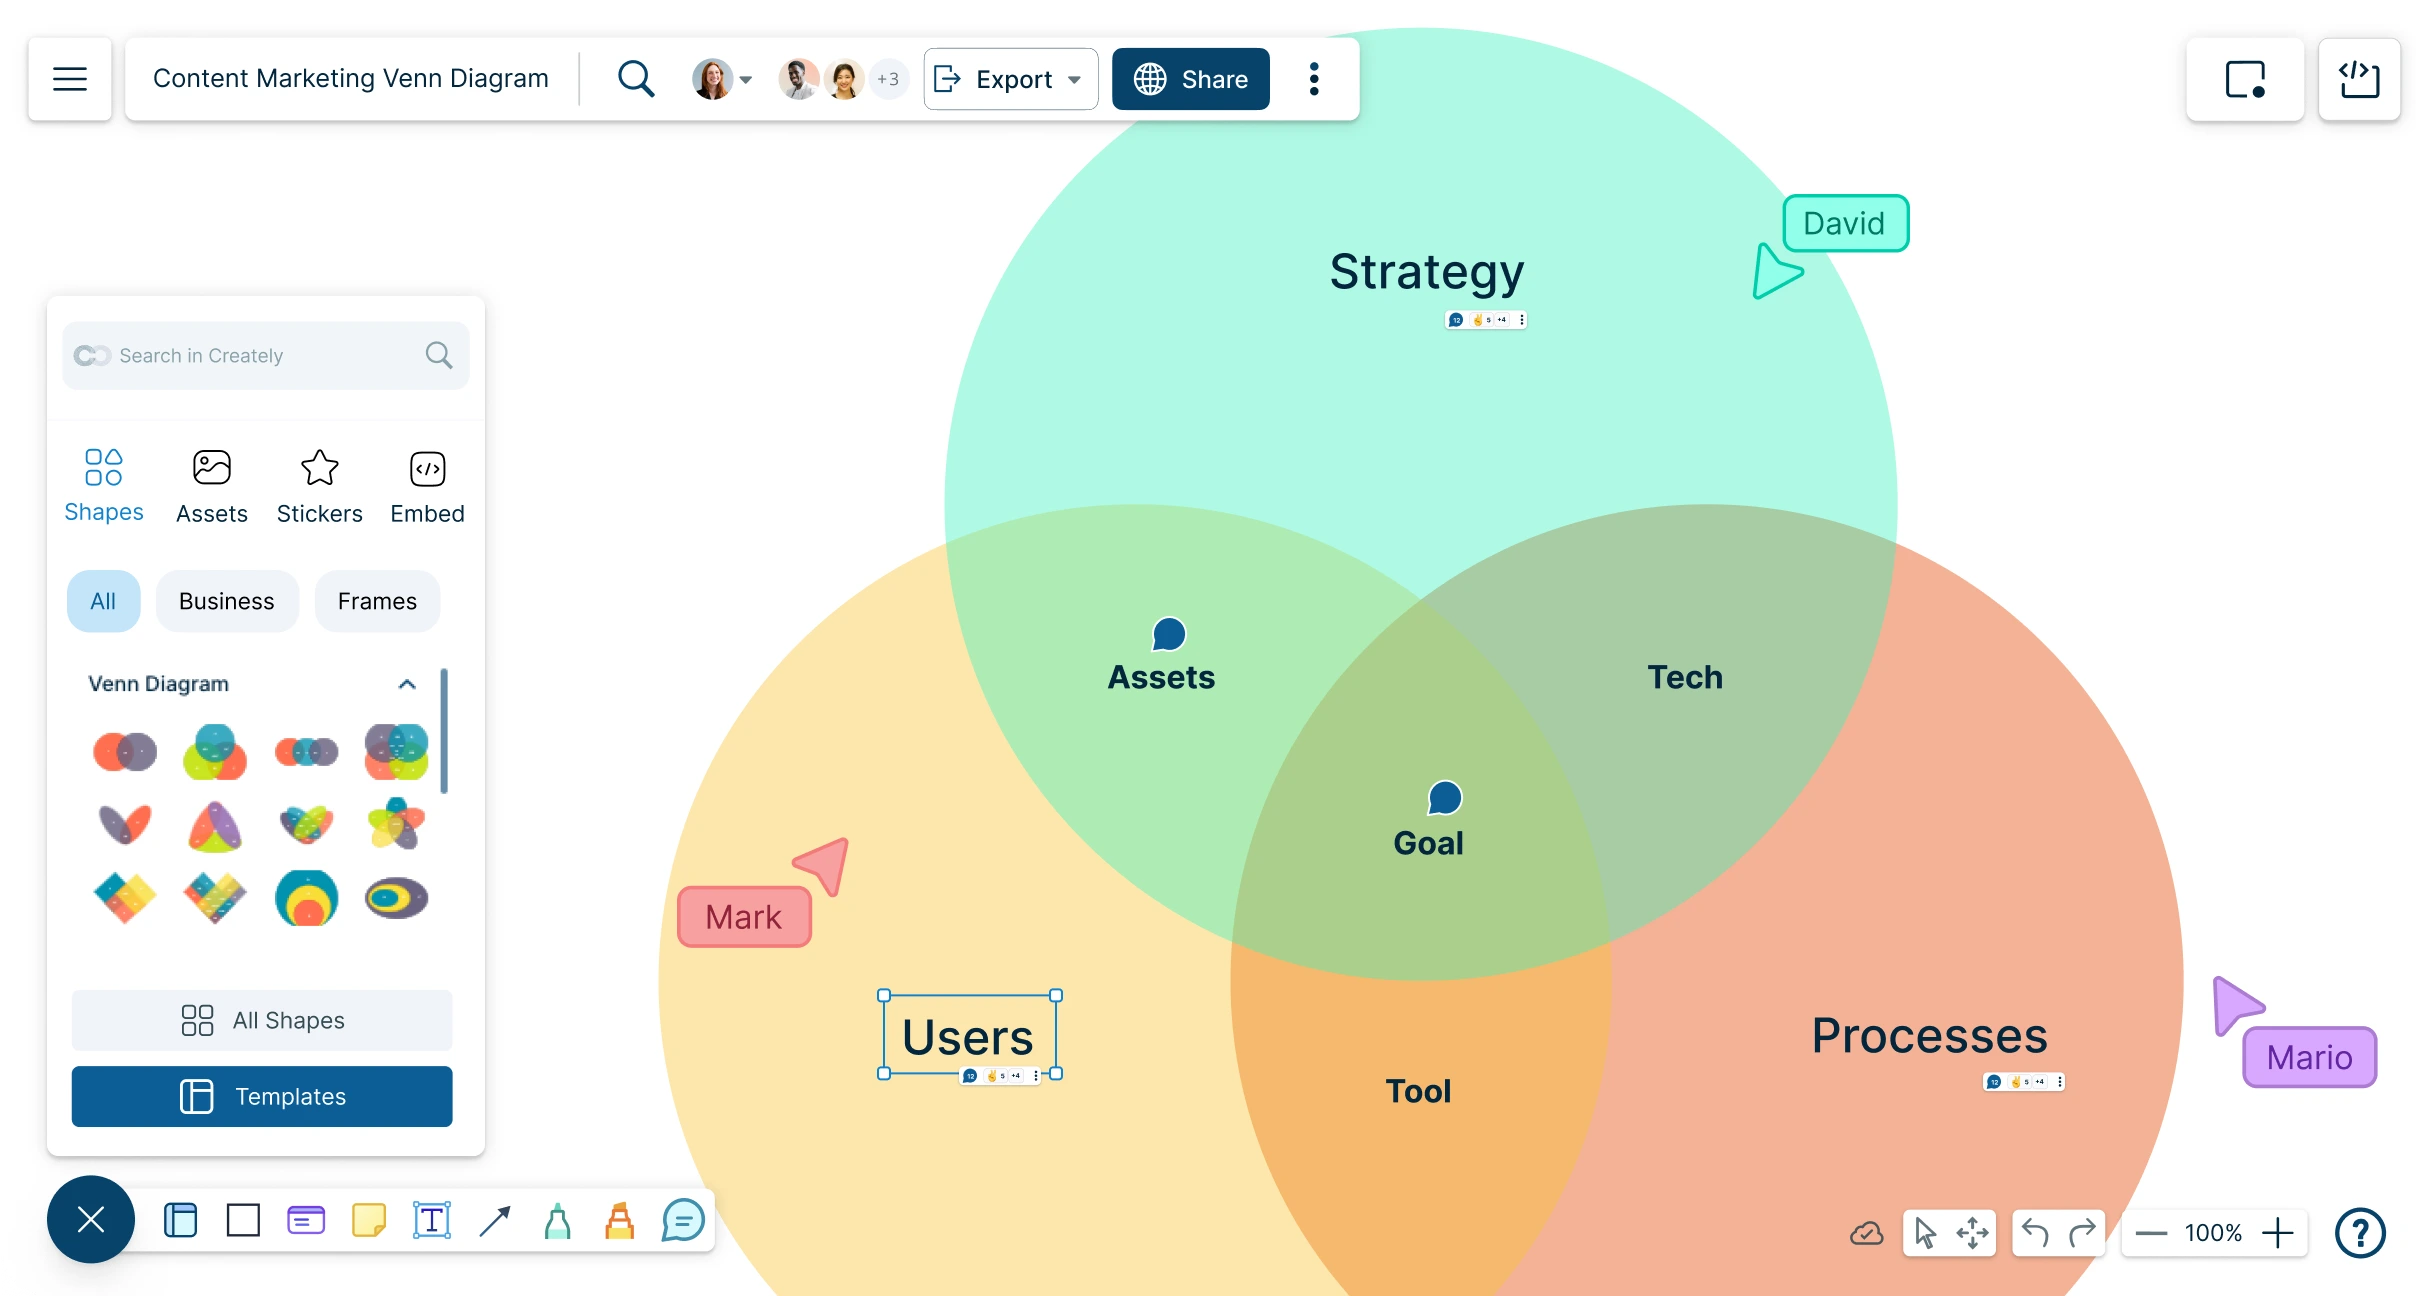
Compare ideas, options, concepts, or groups with editable Venn diagrams that help people see what is different, what overlaps, and what matters most.
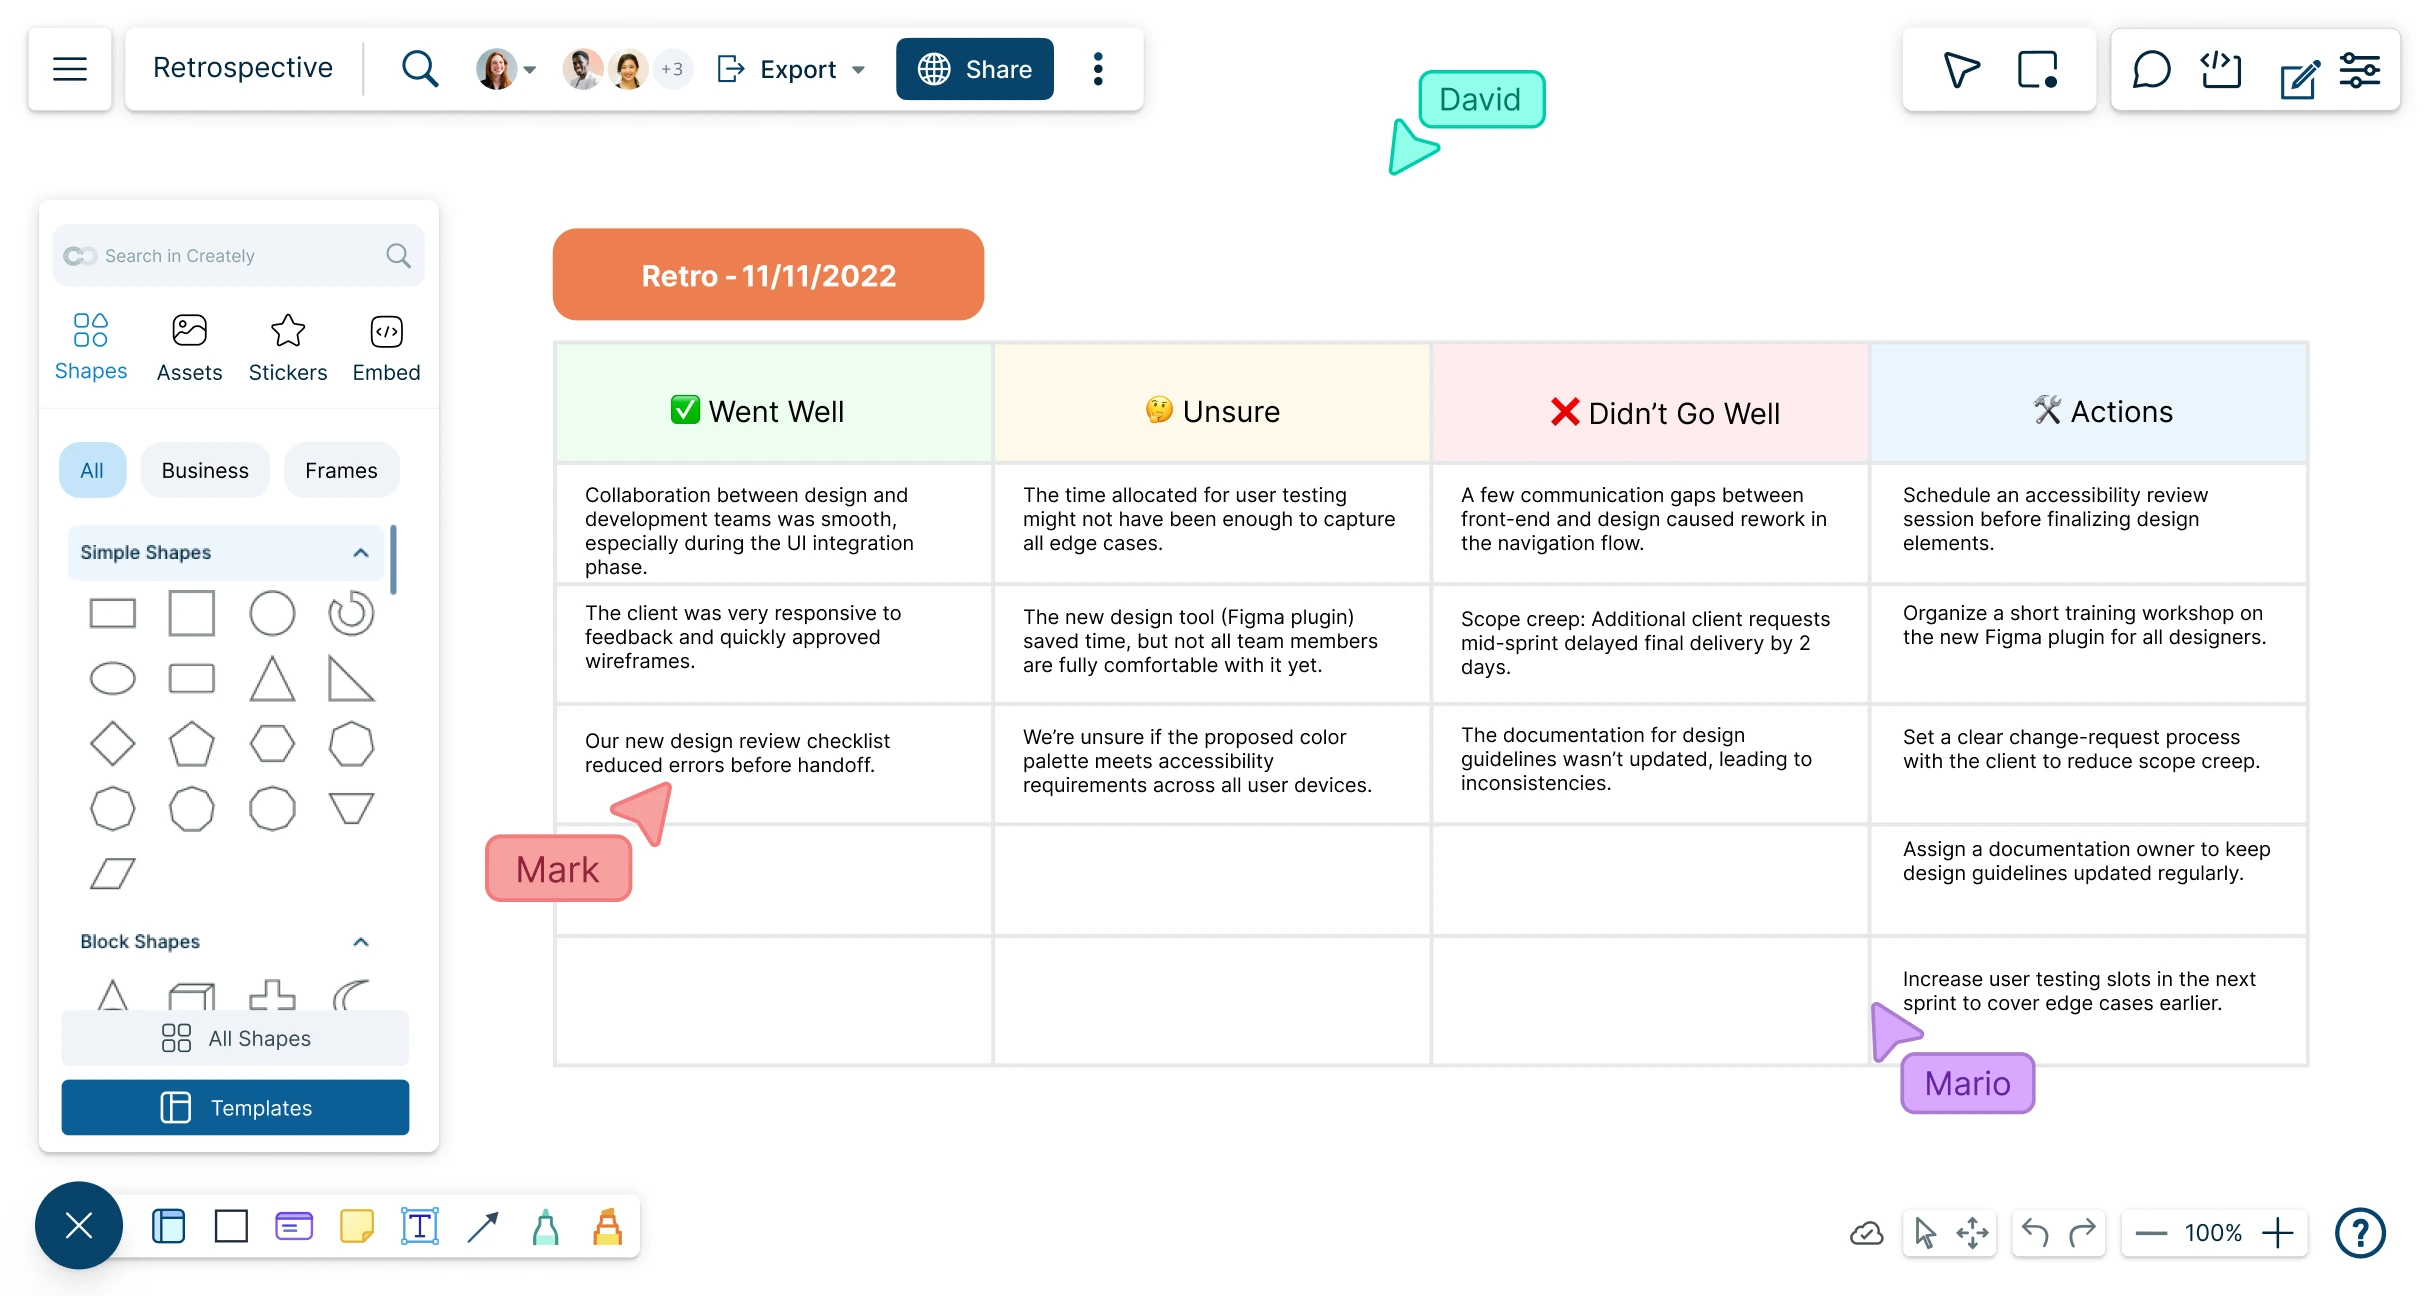
Plan, schedule, and manage collaborative retrospective meetings. Use Creately’s retro software to analyze project progress, uncover blockers, and streamline workflows with customizable retro boards.
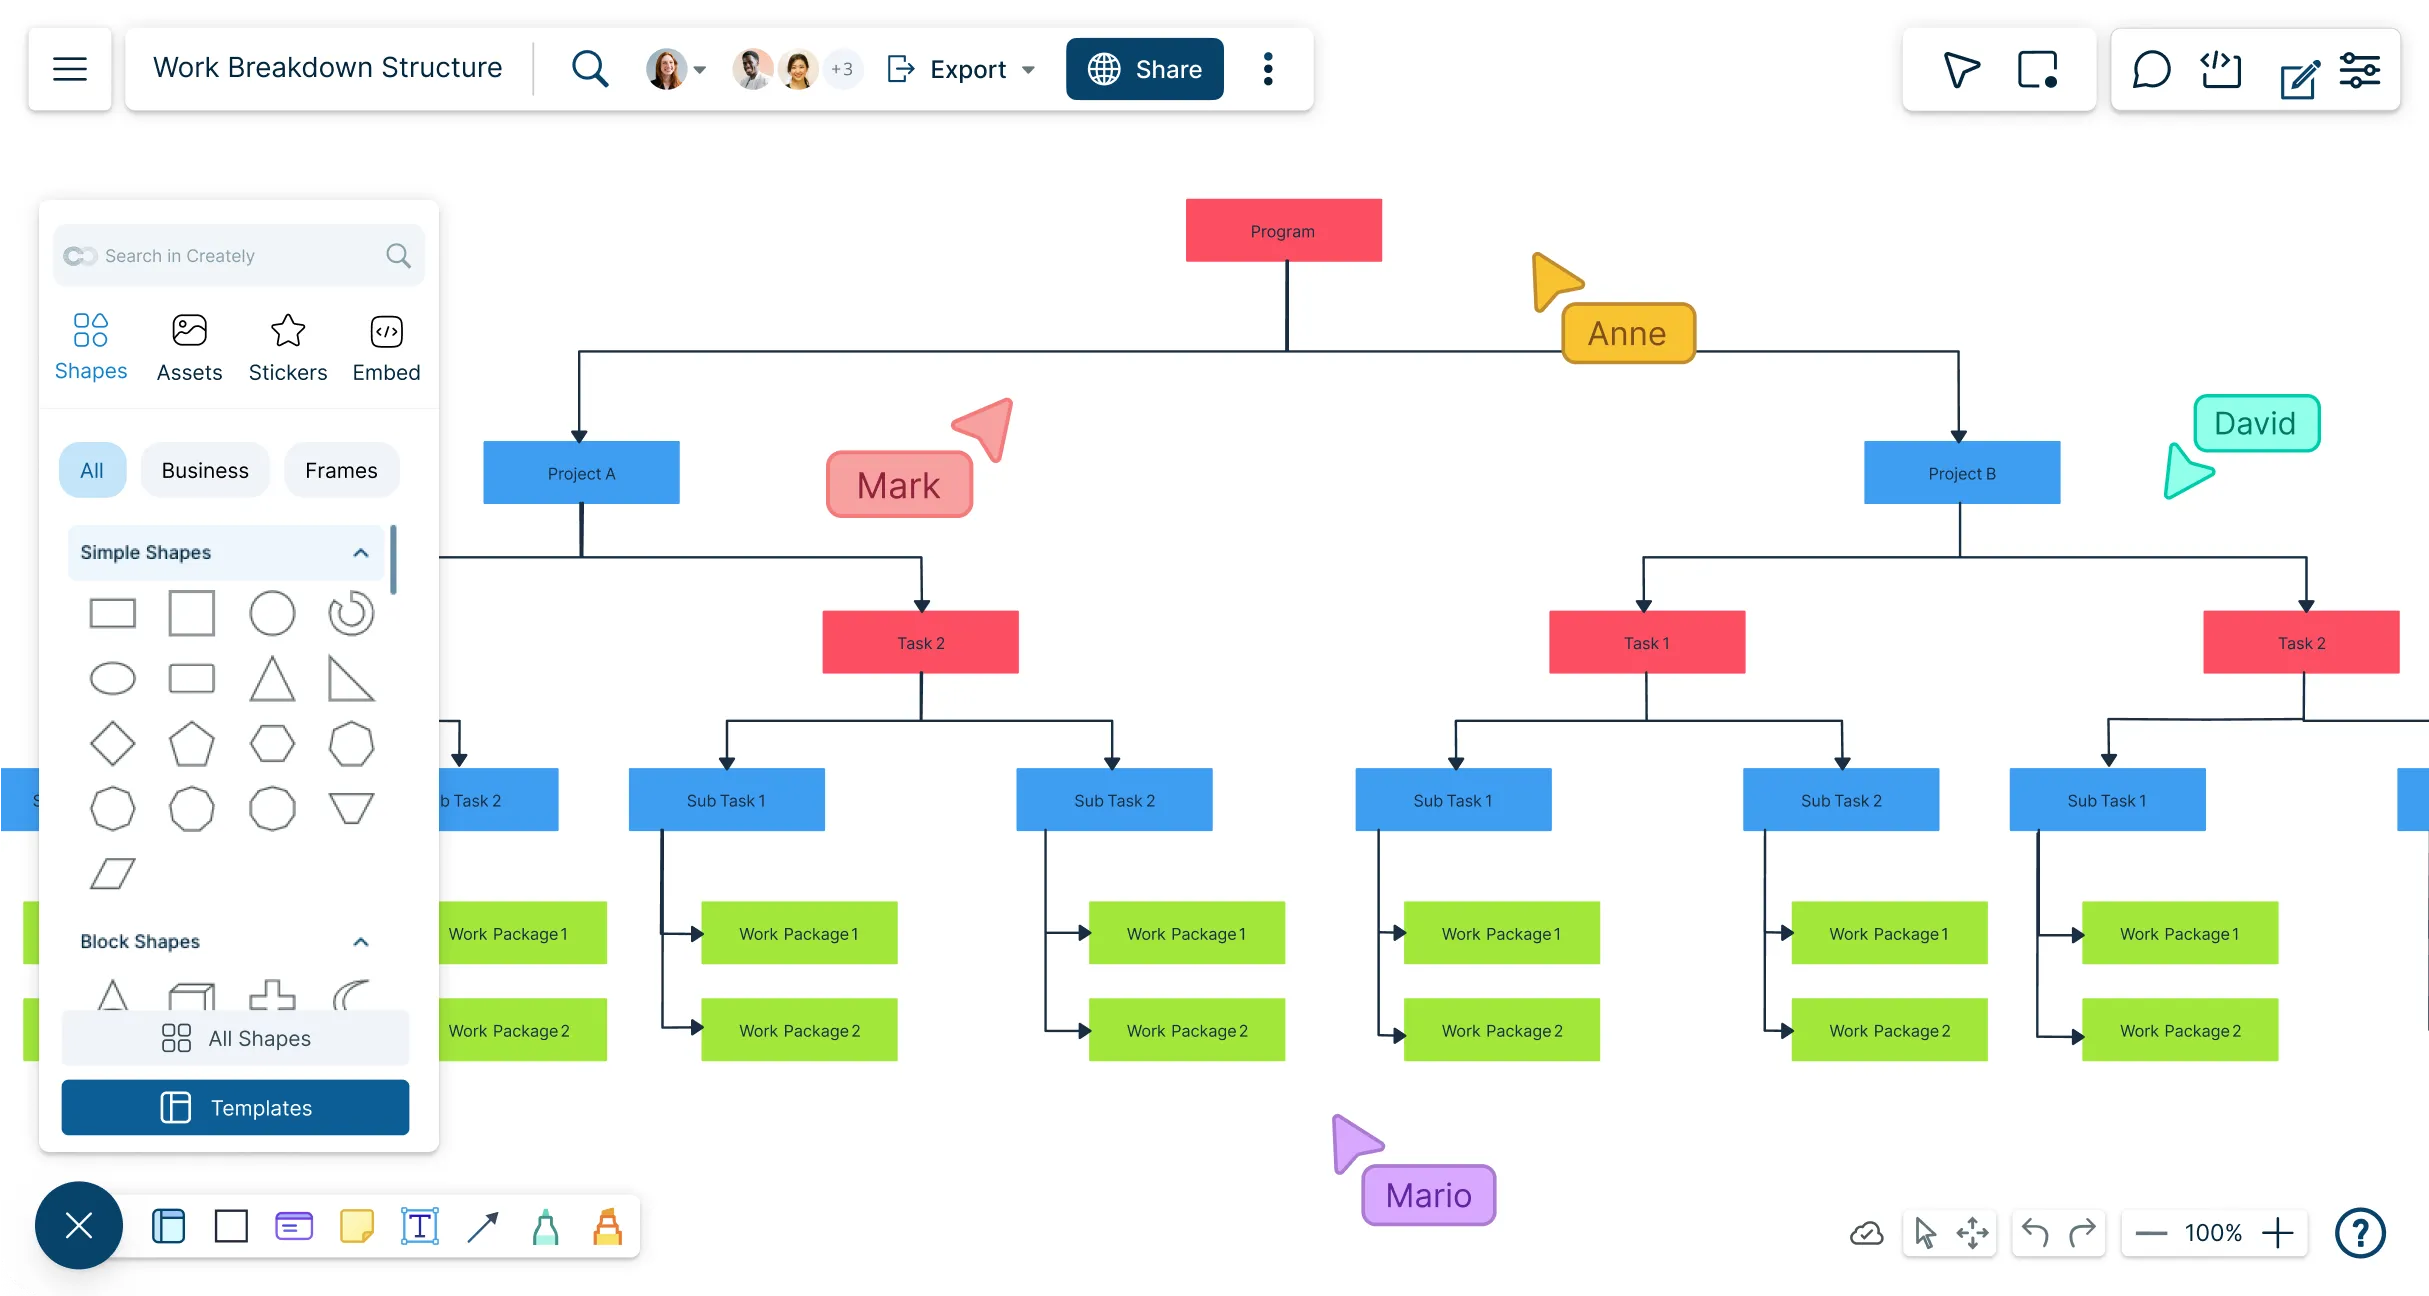
Break down large projects into tasks, visualize workflows, and keep your team aligned with our intuitive work breakdown structure software.
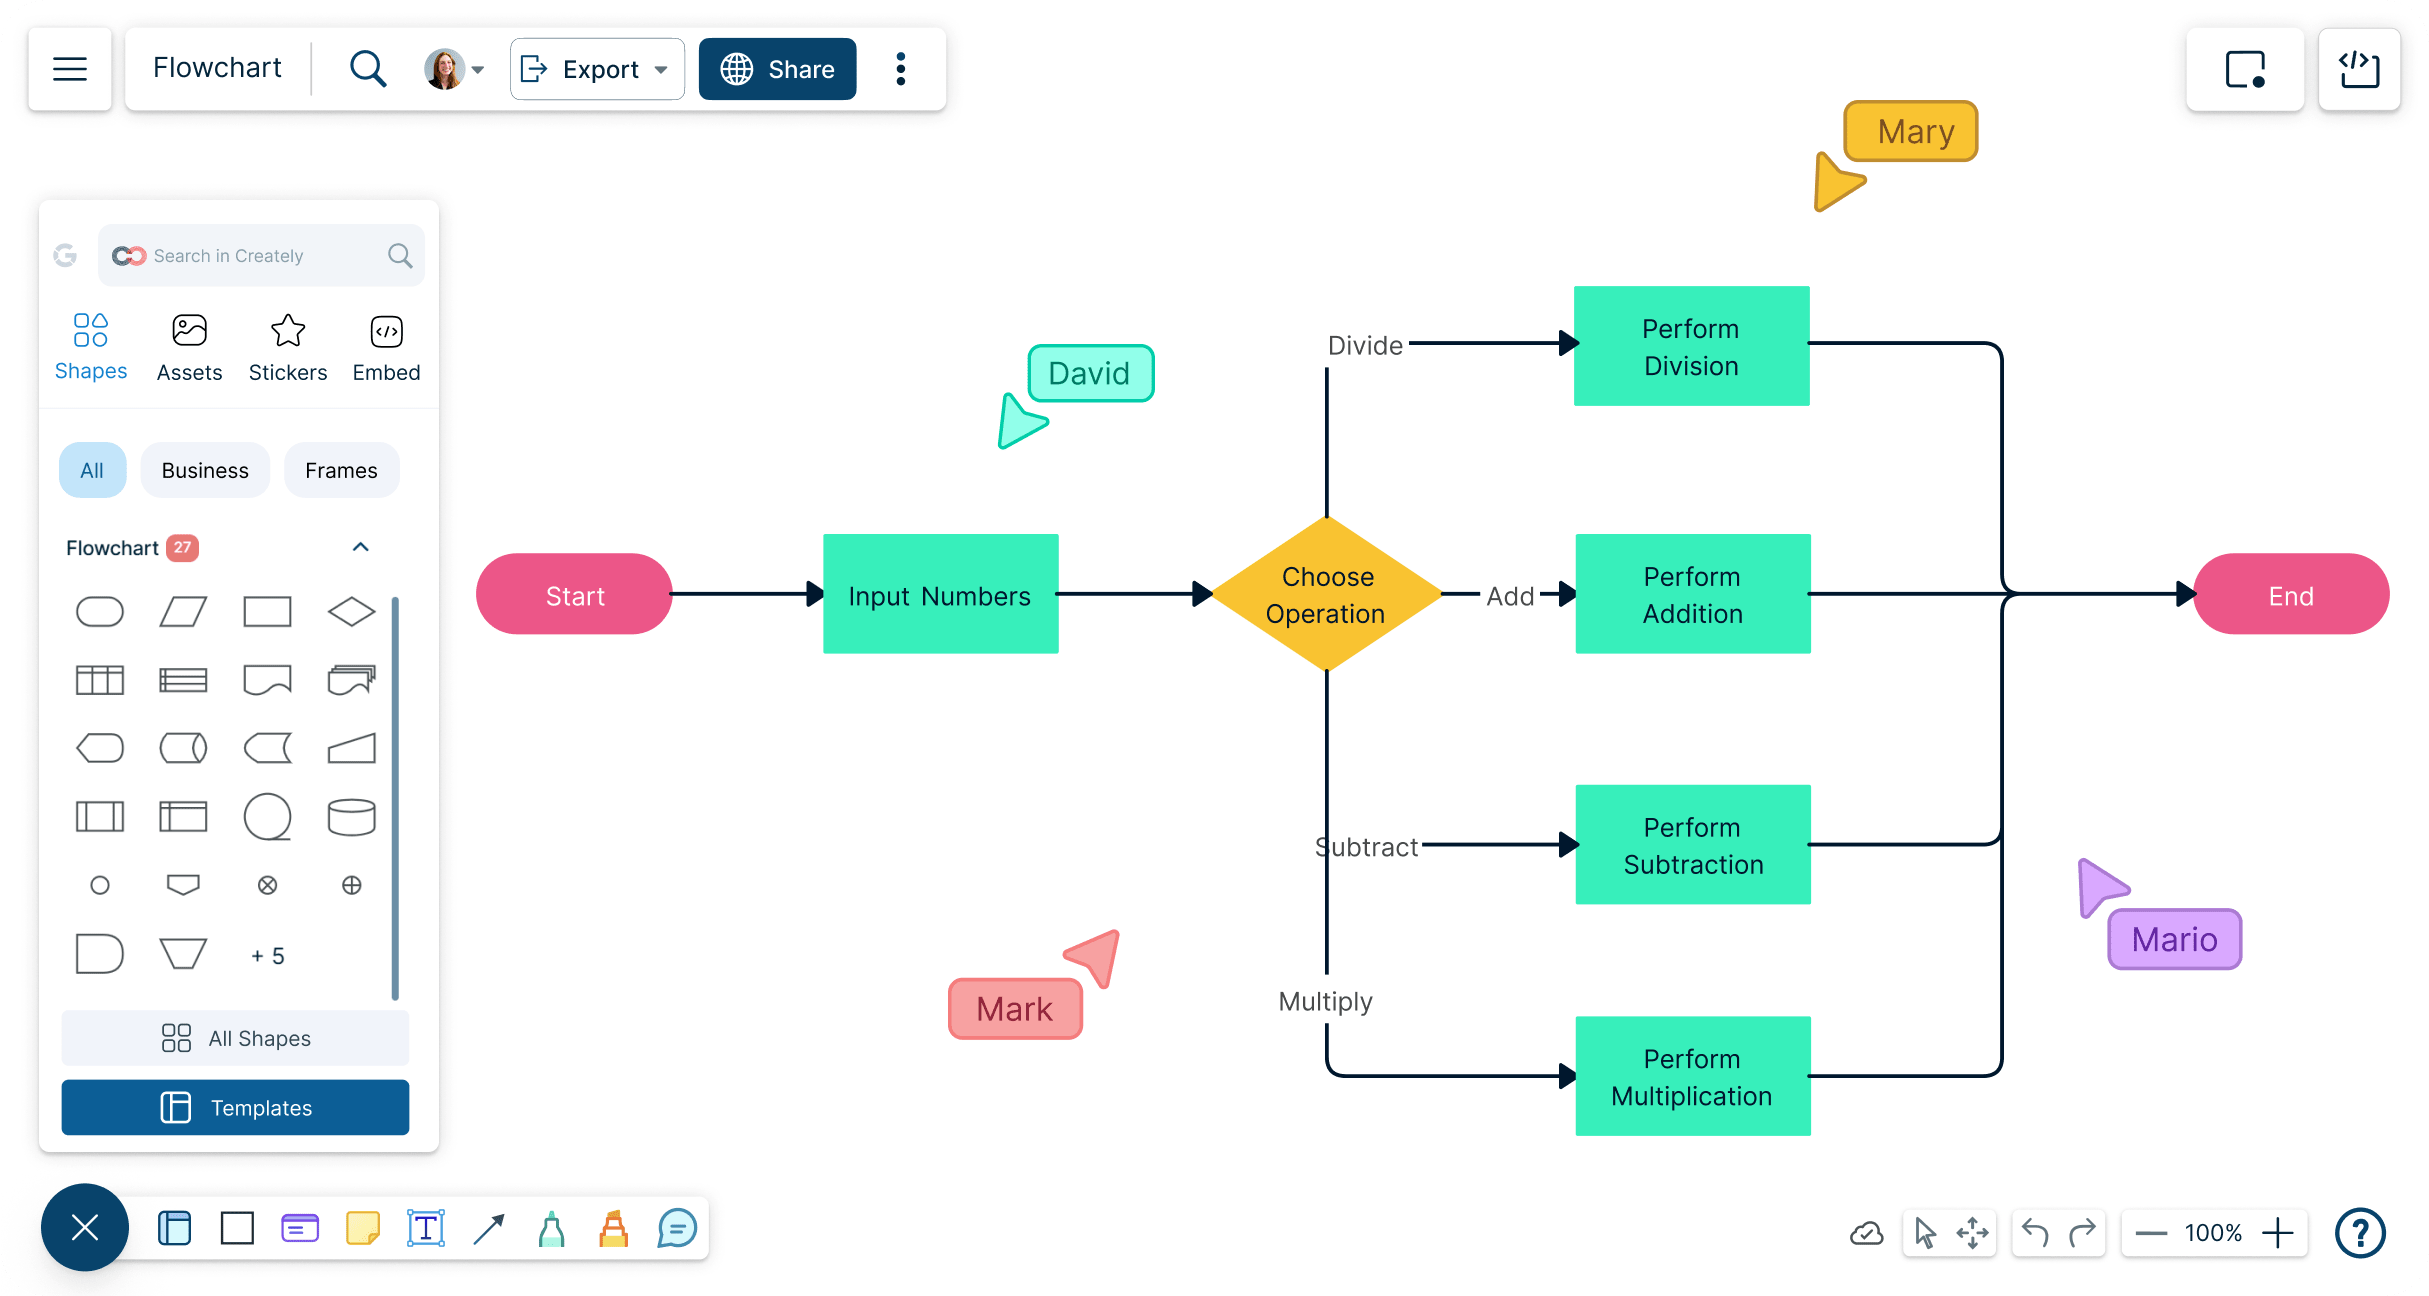
Collaboratively map processes and workflows with Creately’s flowchart software for Mac, delivering a smooth, optimized experience on Safari, Chrome, and other macOS browsers.
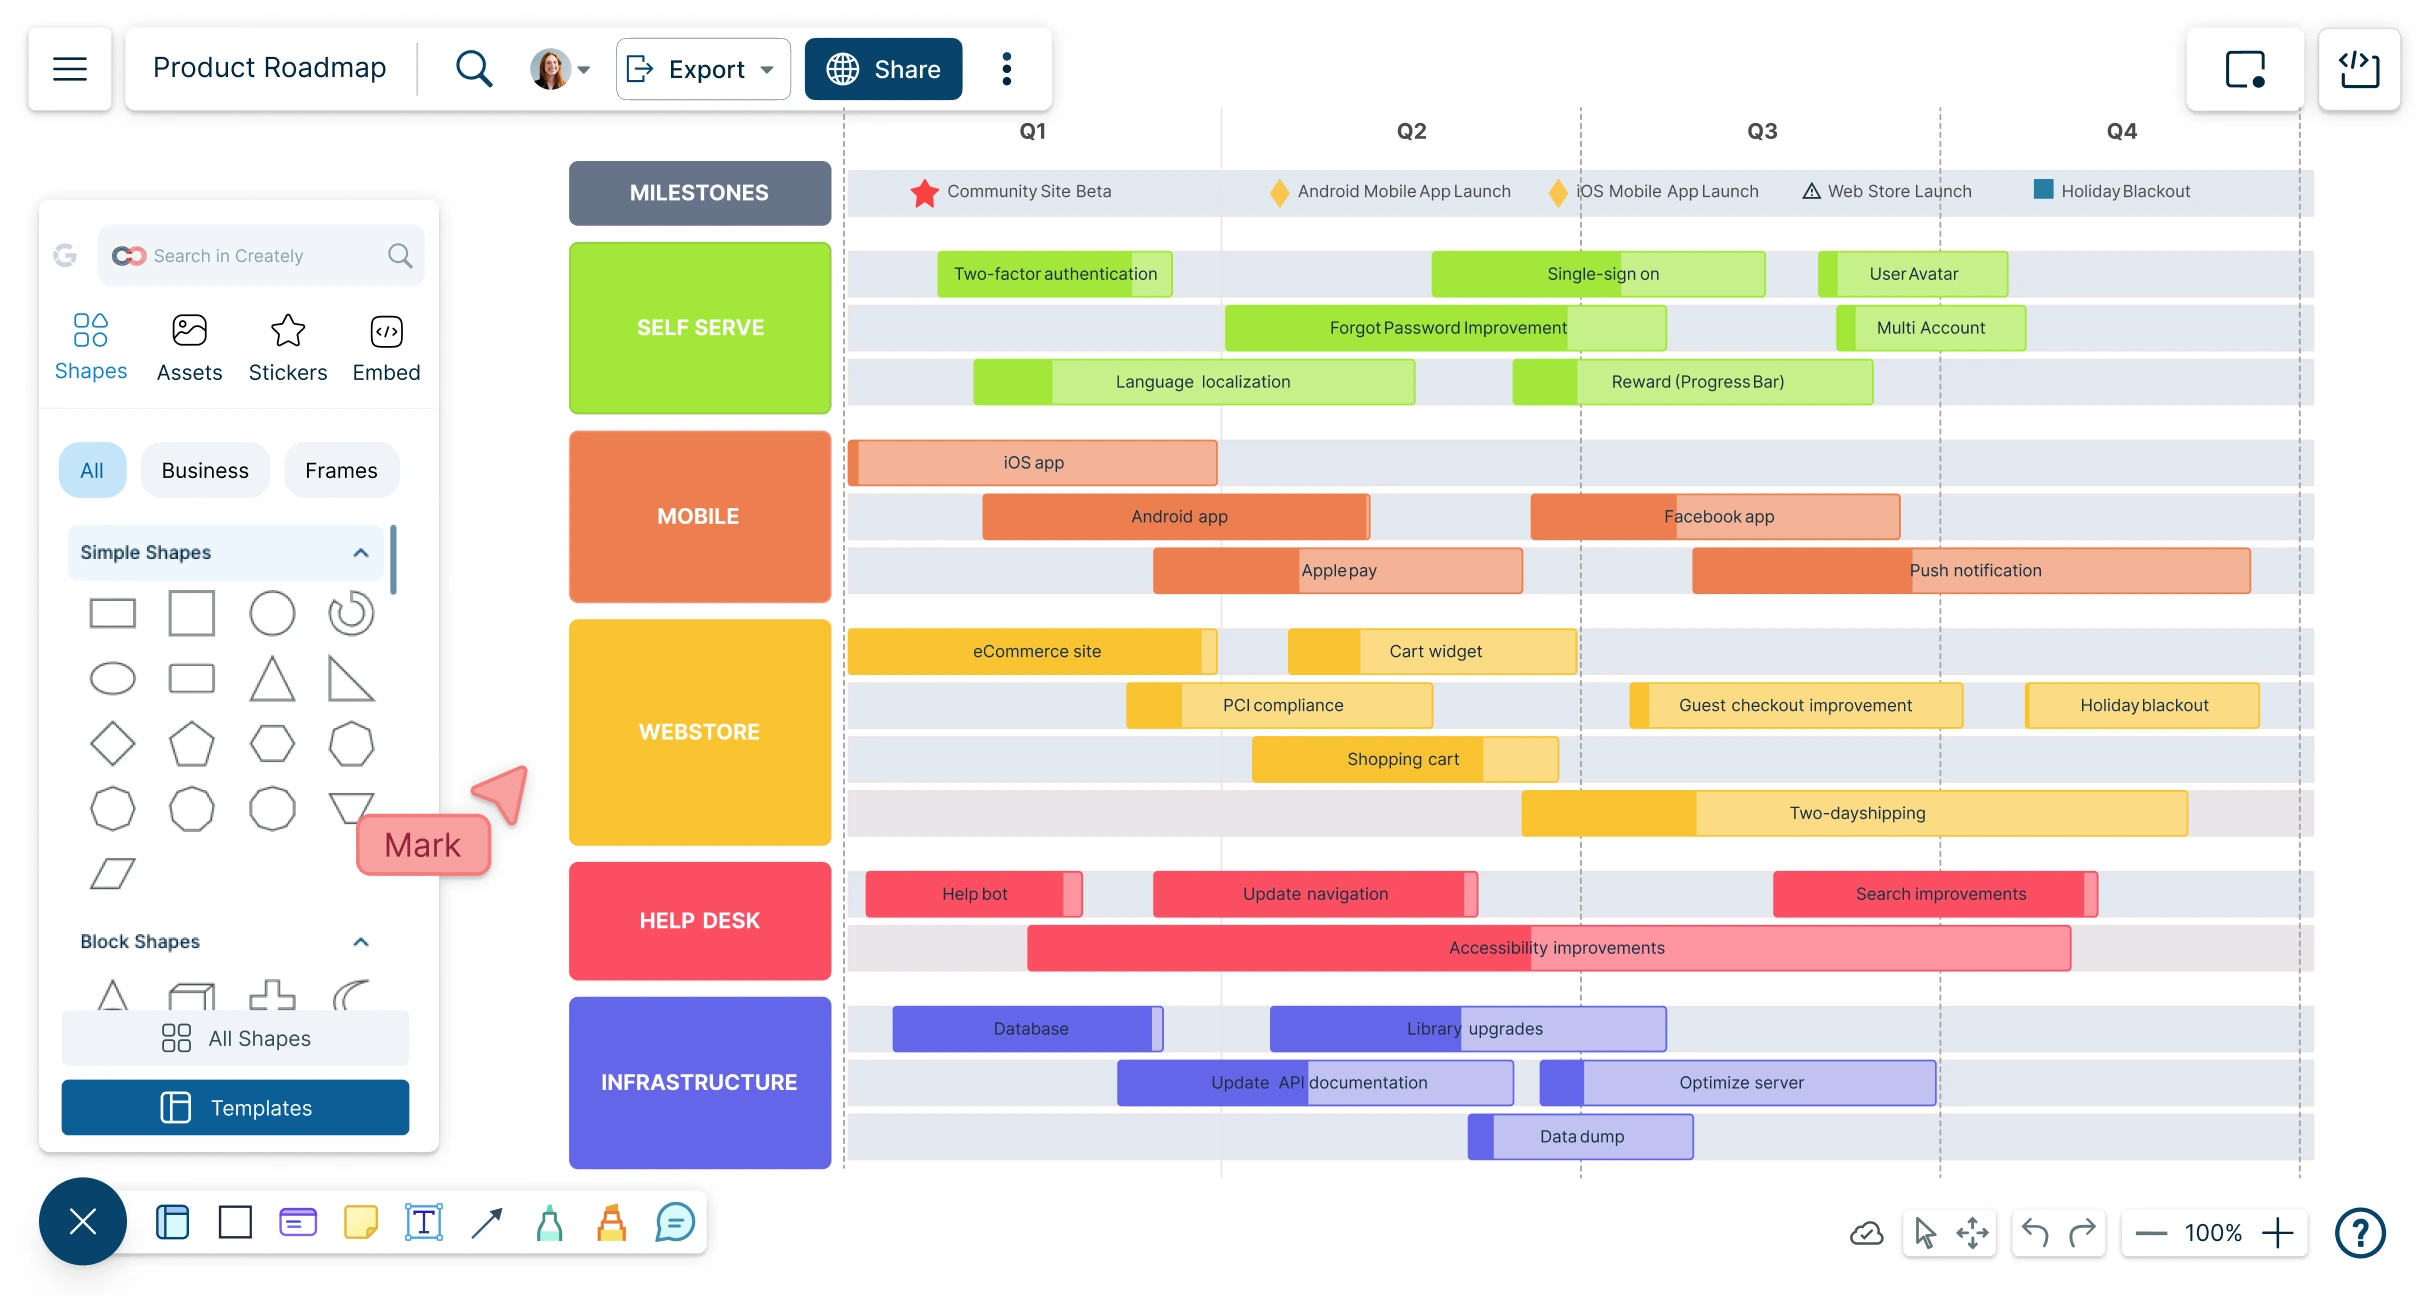
Align team efforts from product ideation to launch, synchronize efforts and communicate vision and progress with Creately’s product roadmap software.
Brainstorm, plan, and visualize ideas together—whether in class, at work, or remotely—with our intuitive, unlimited-space virtual whiteboard.
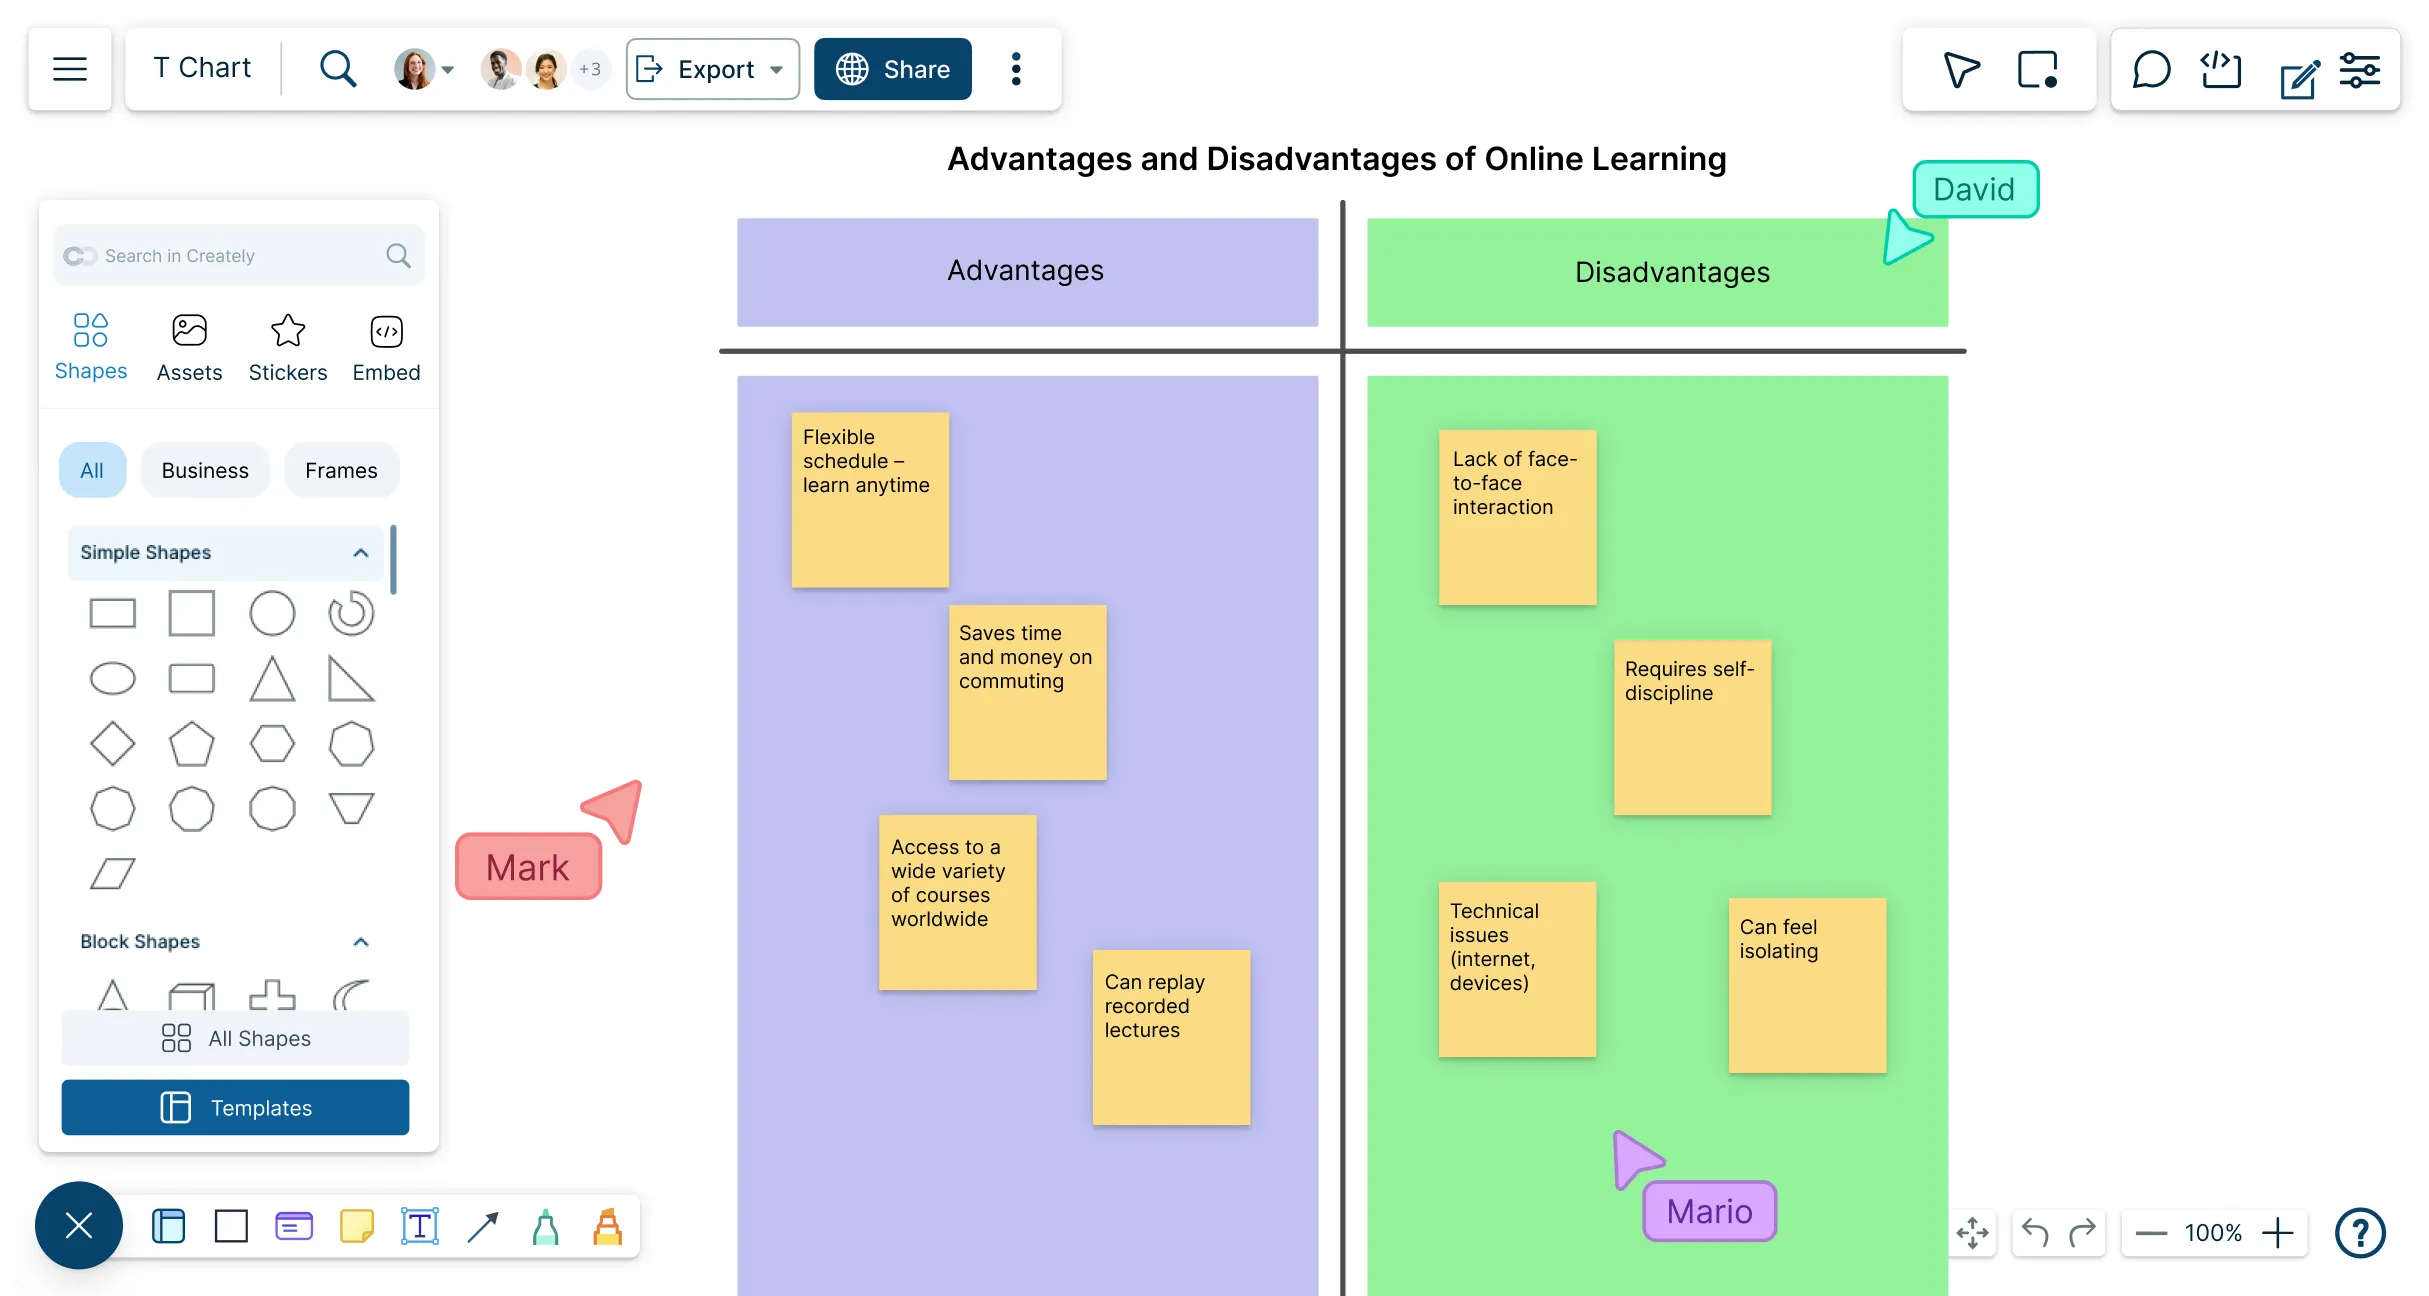
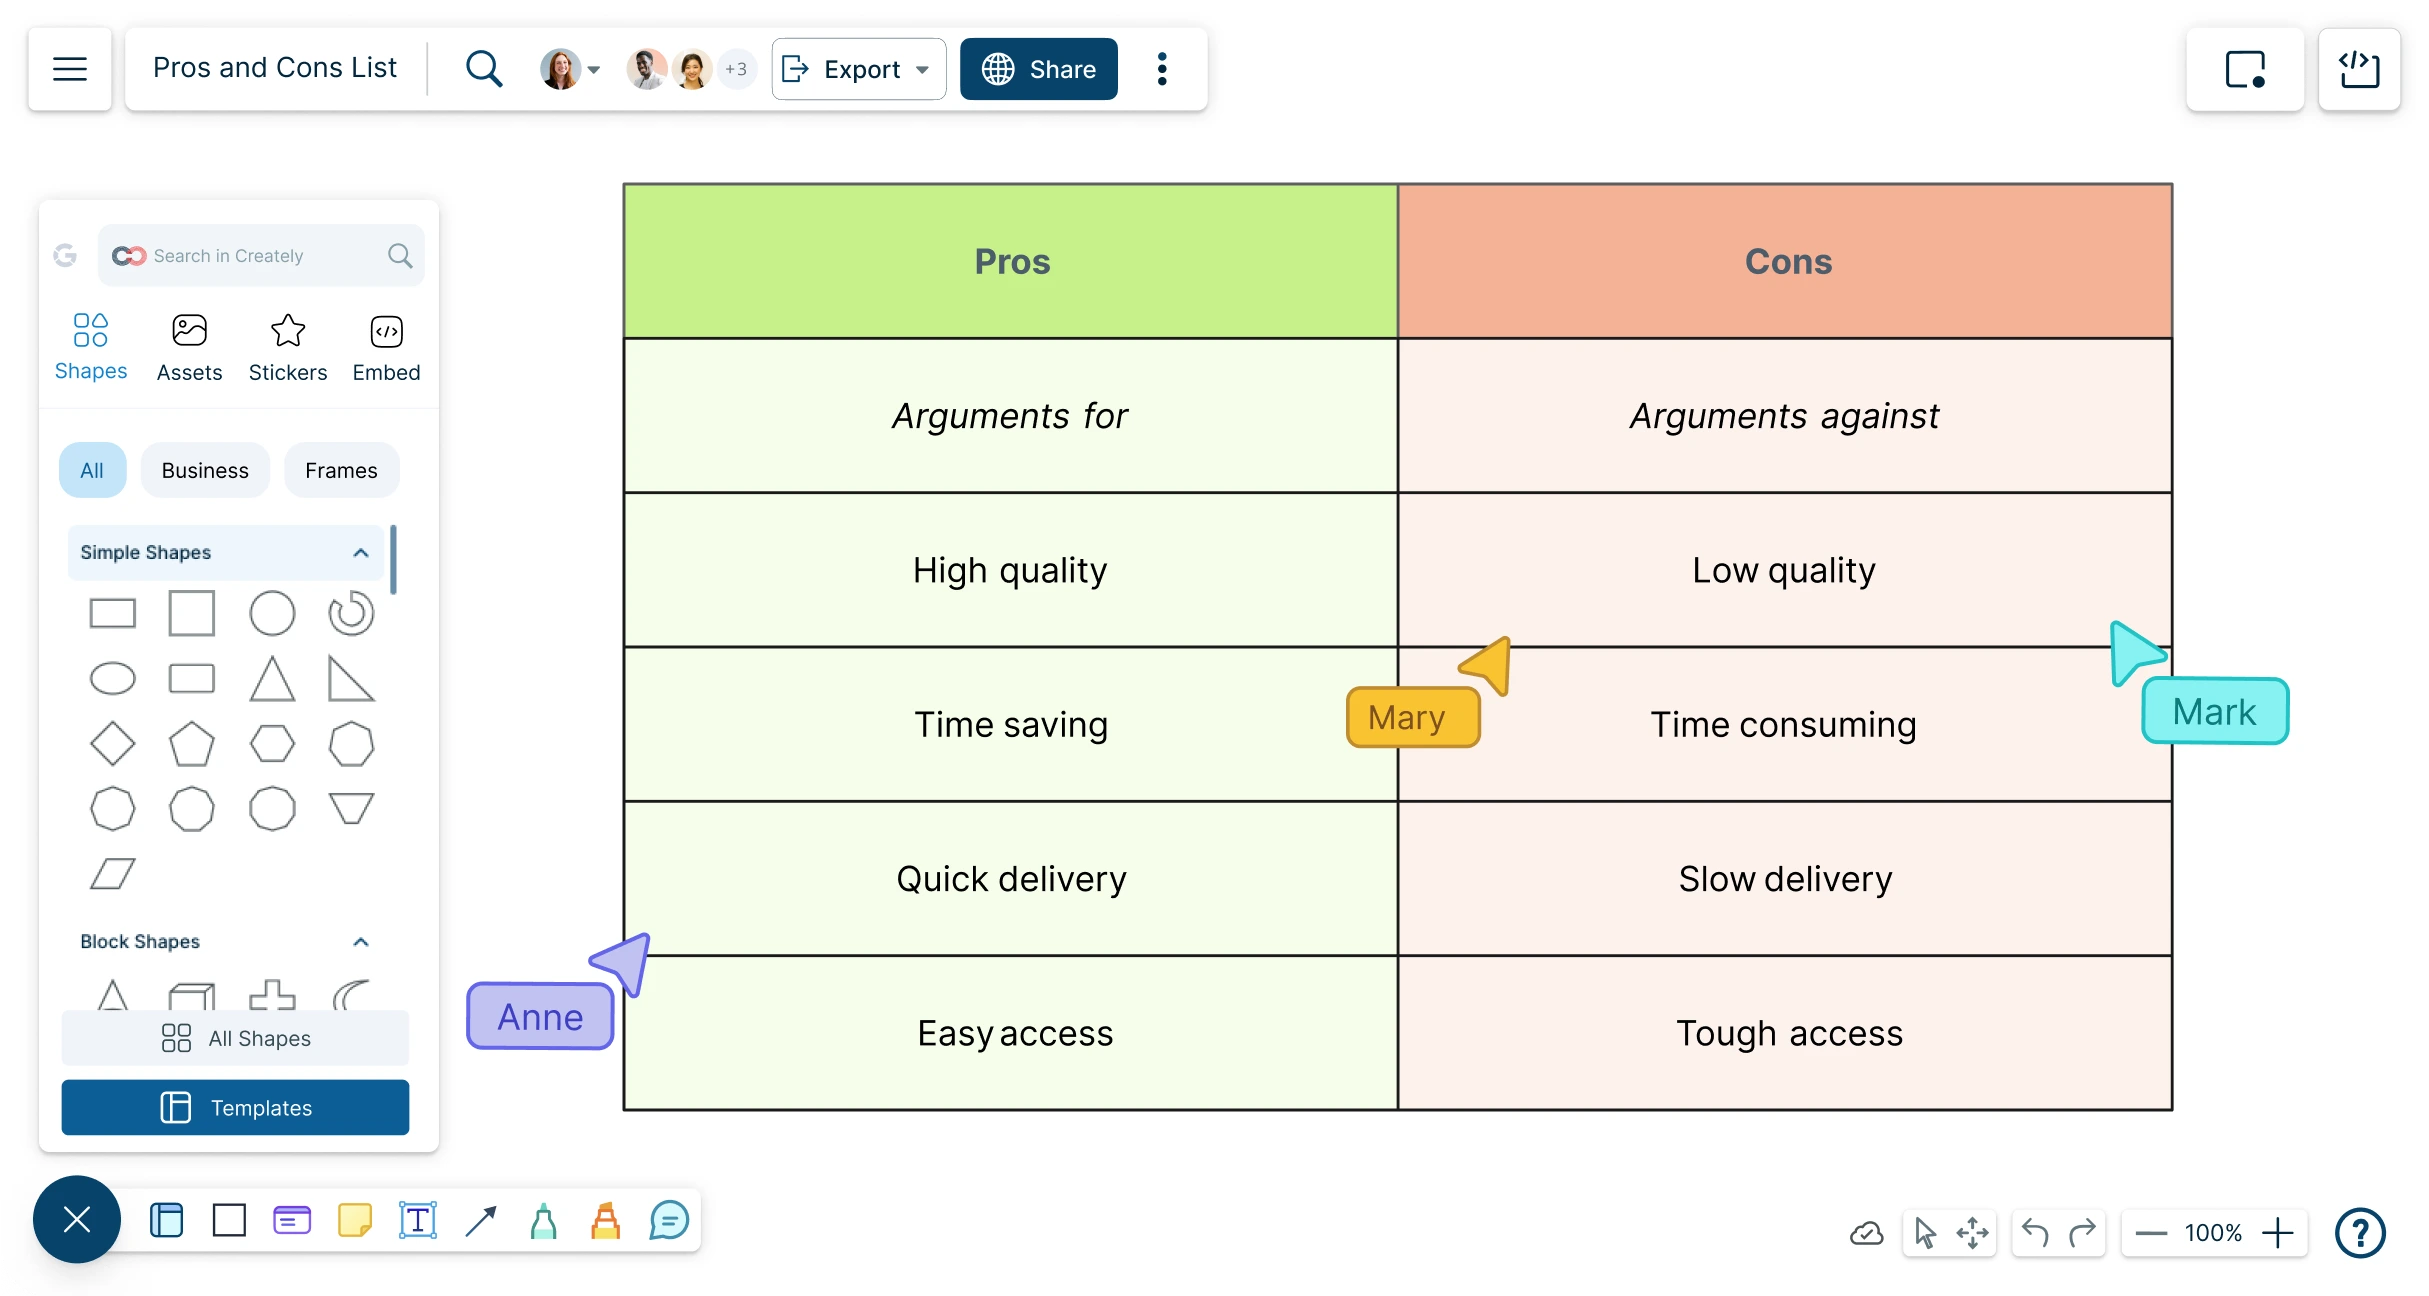
Compare and contrast opposing views, including facts vs. opinions, advantages vs. disadvantages or strengths vs. weaknesses, with our free intuitive T chart creator.
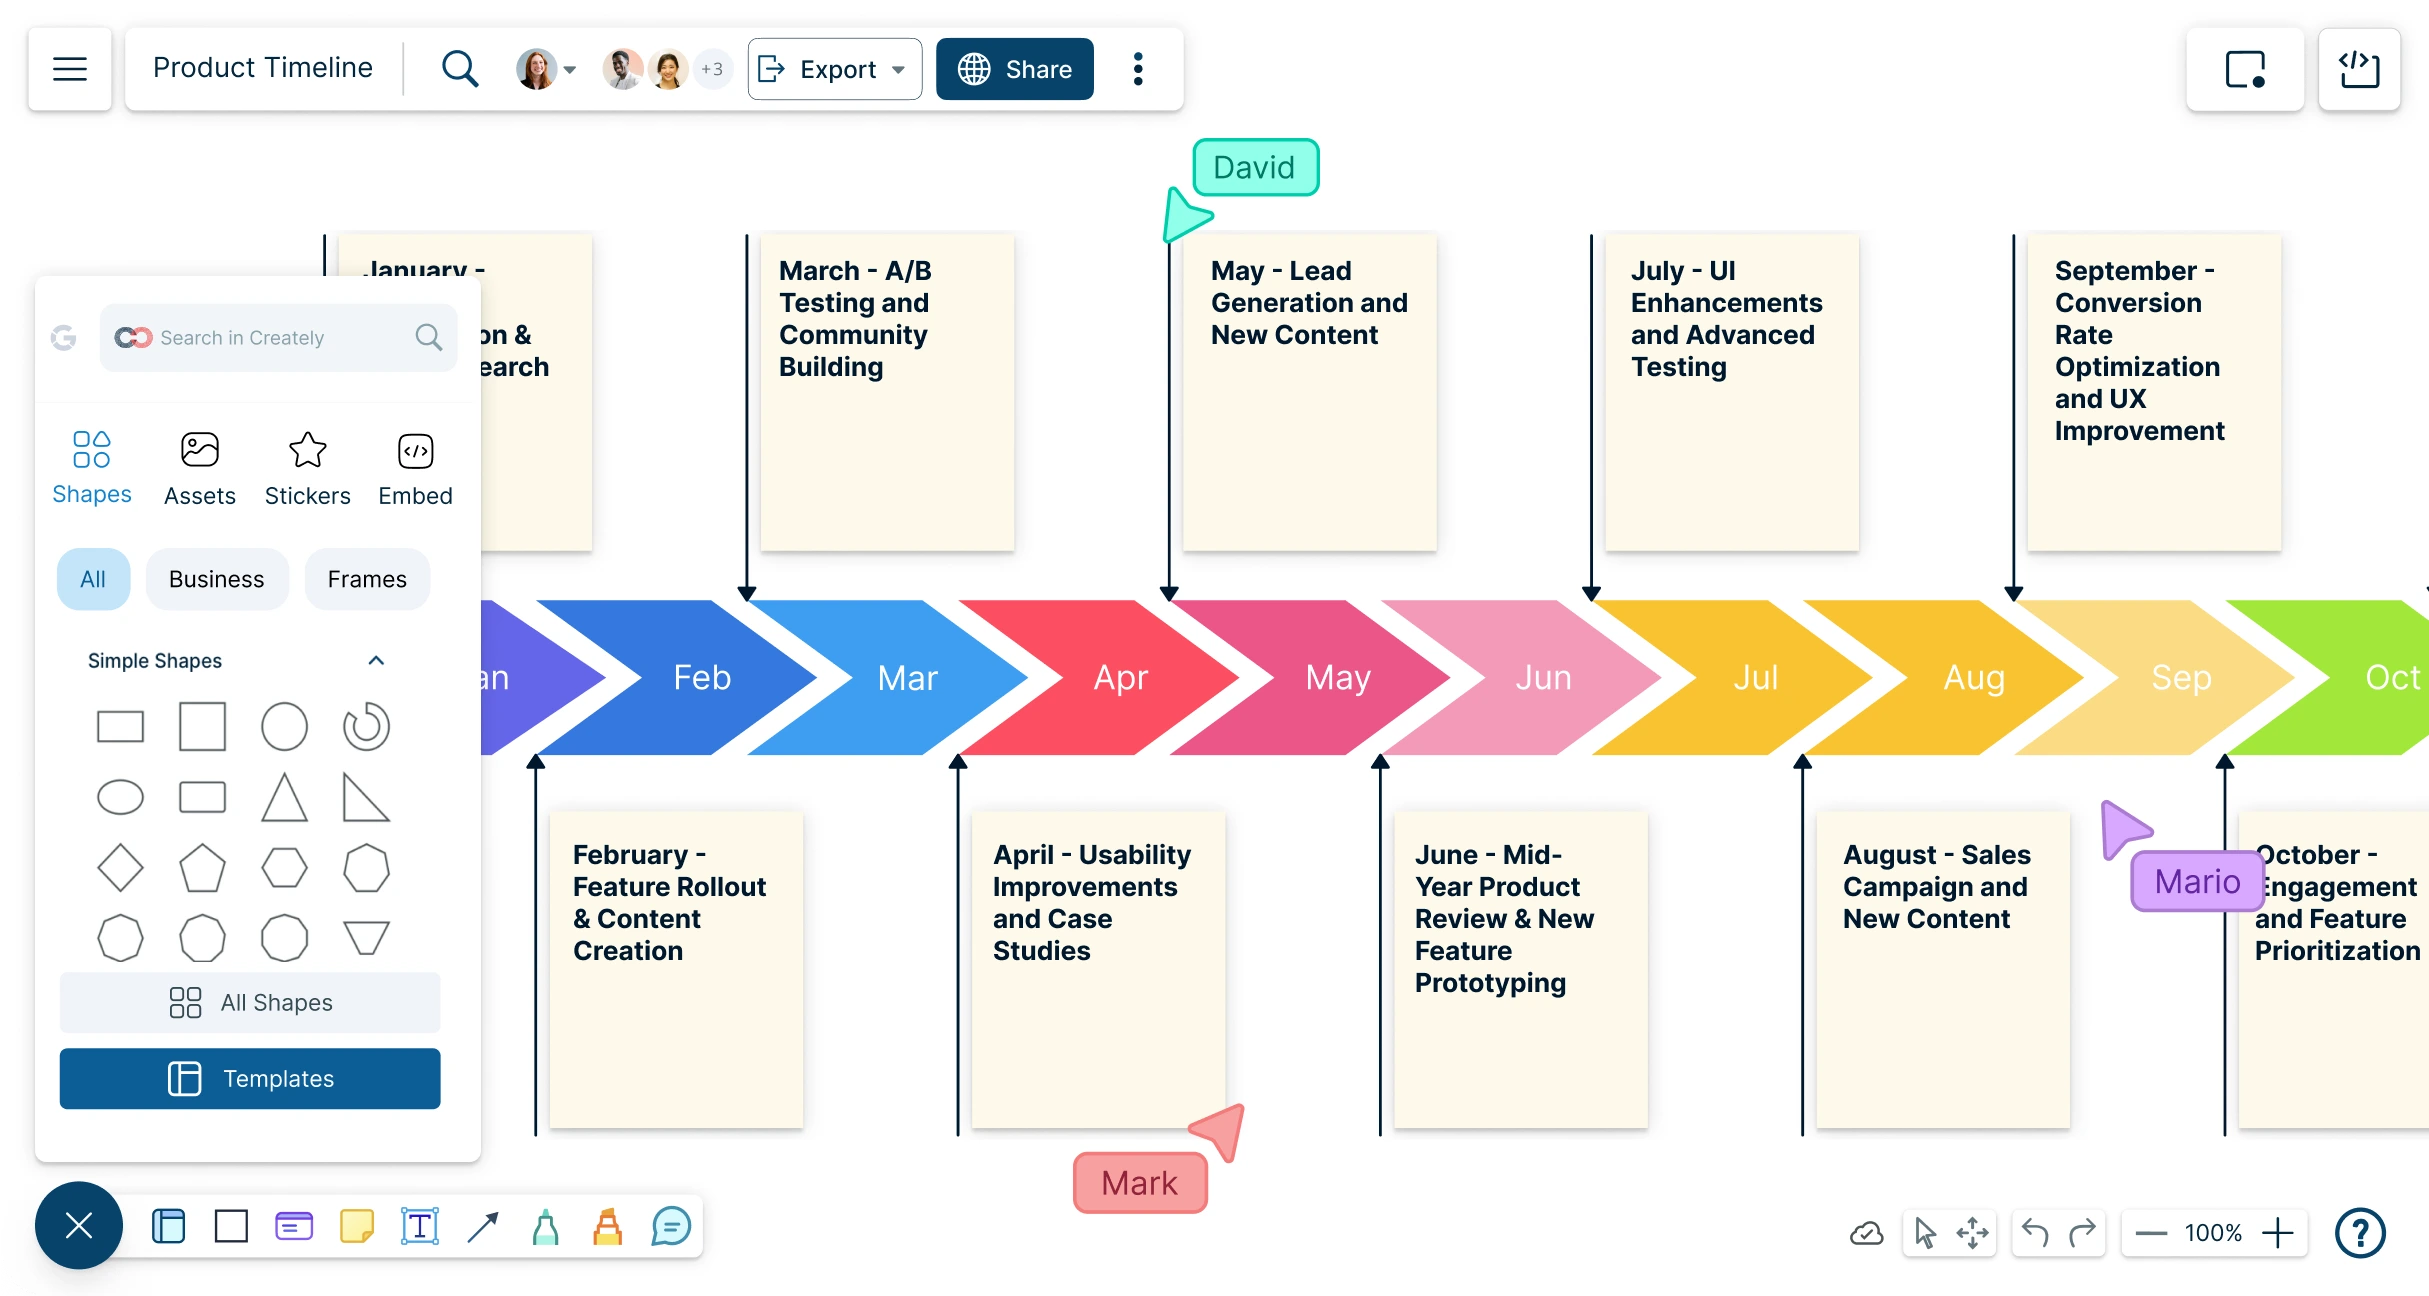
Create project, history, event, research, or campaign timelines without scattered notes or messy slides. Map dates, milestones, tasks, and context in one visual workspace you can edit, review, present, and share.
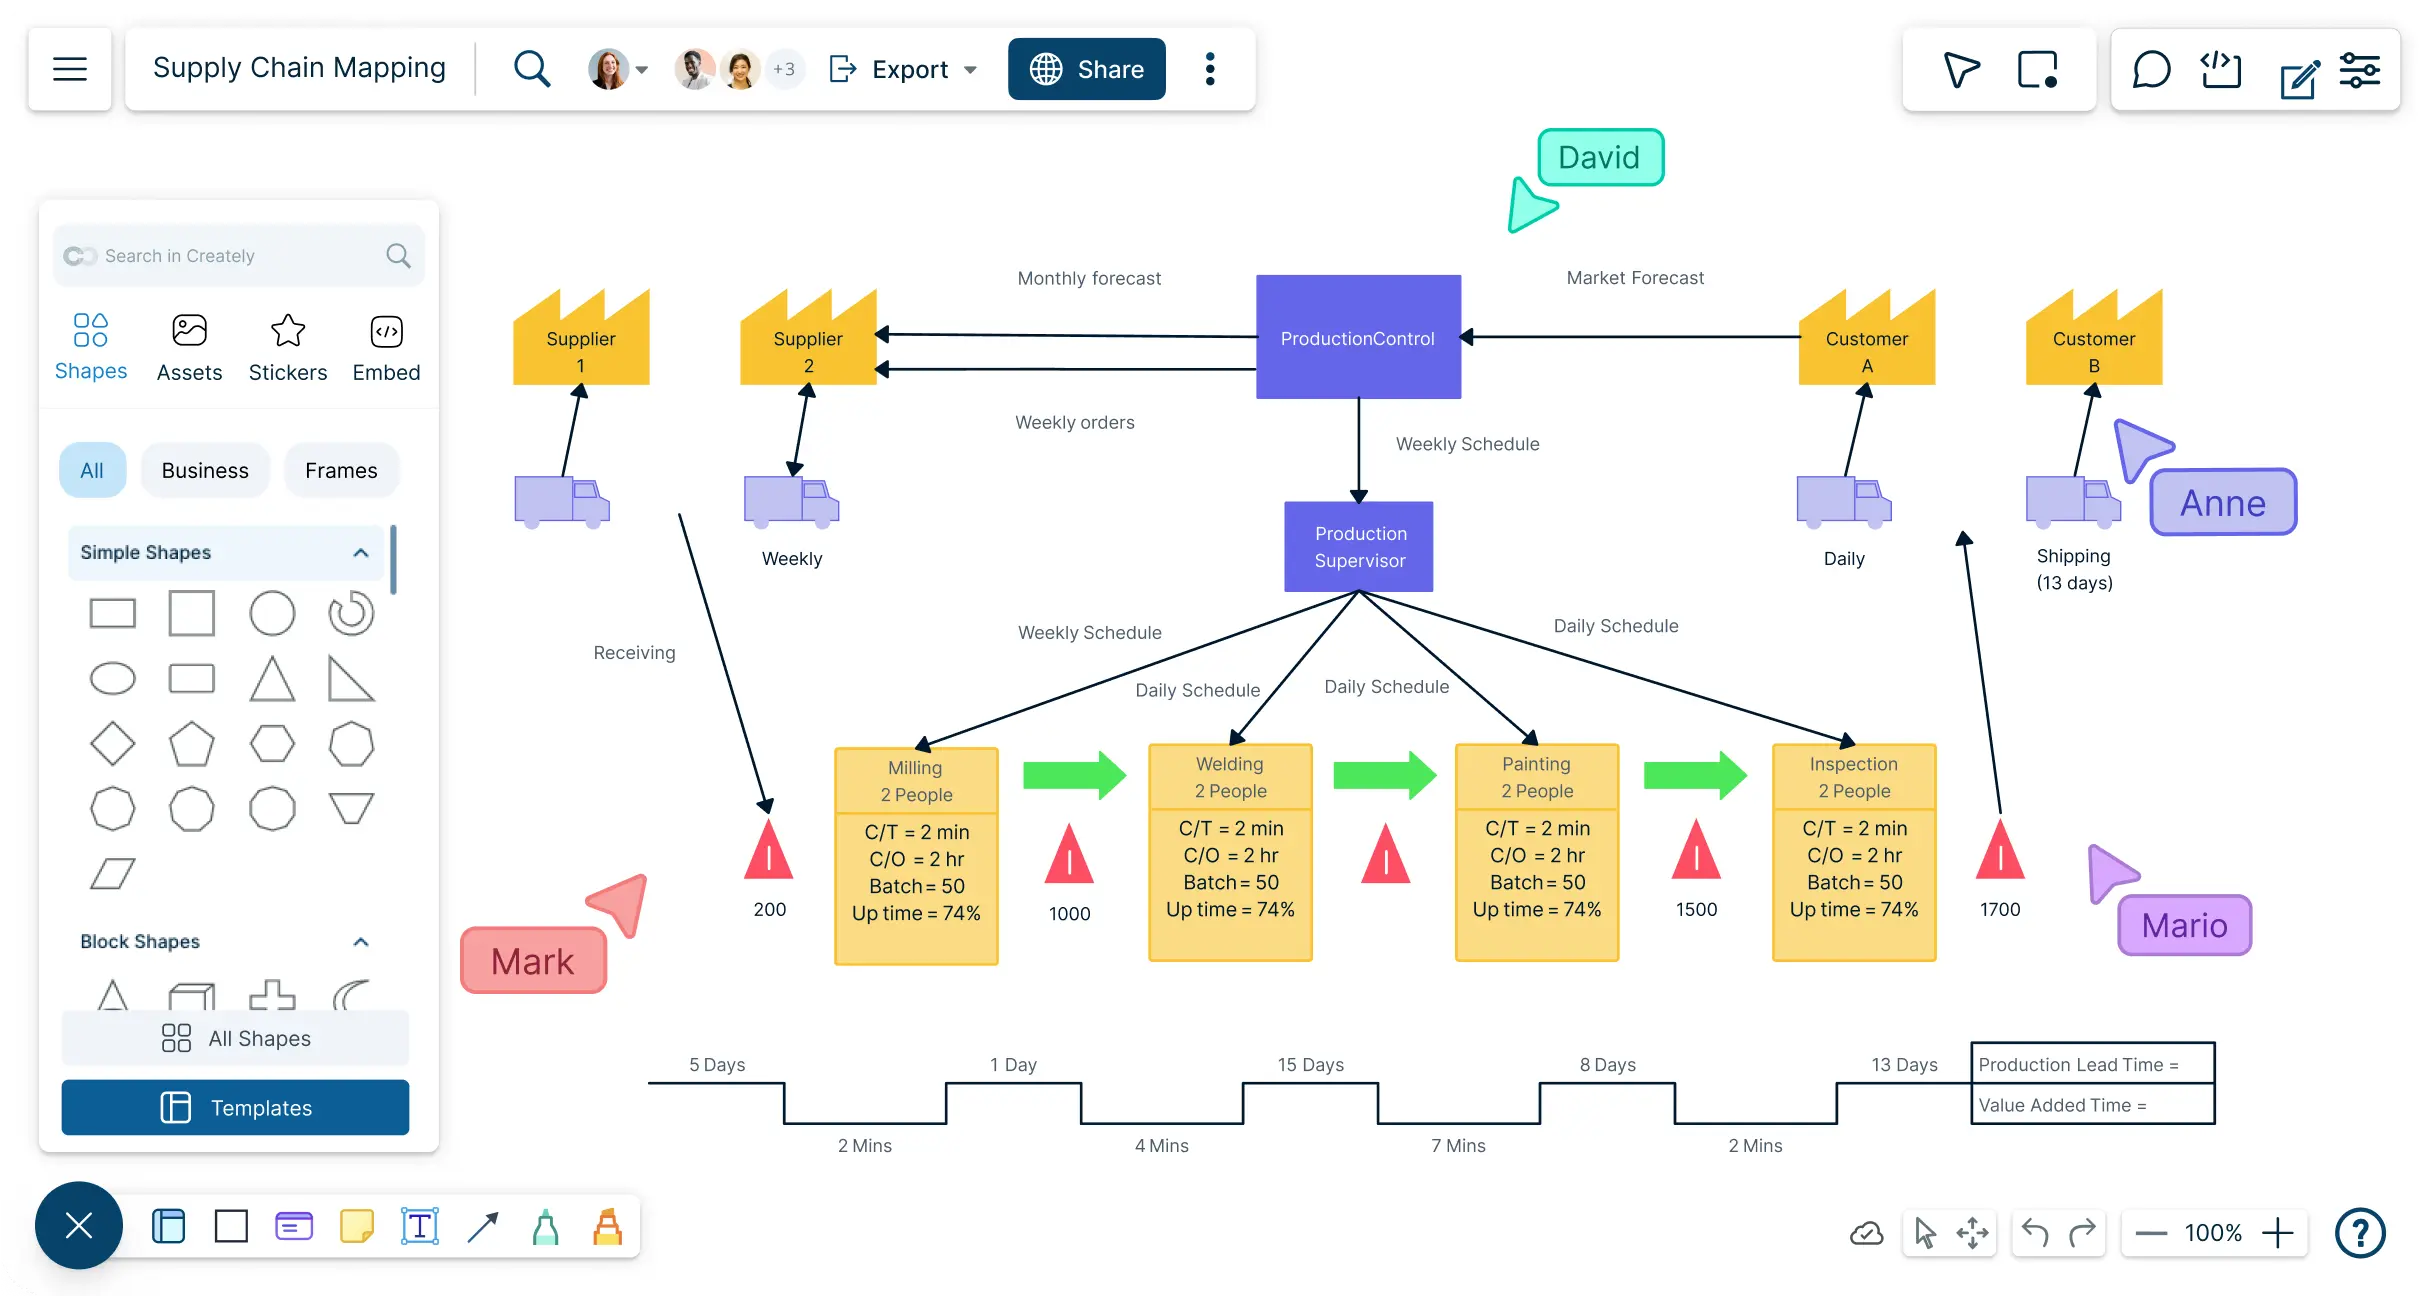
Map, analyze, and optimize your supply chain to identify inefficiencies, collaborate, and create charts that drive smarter decisions.
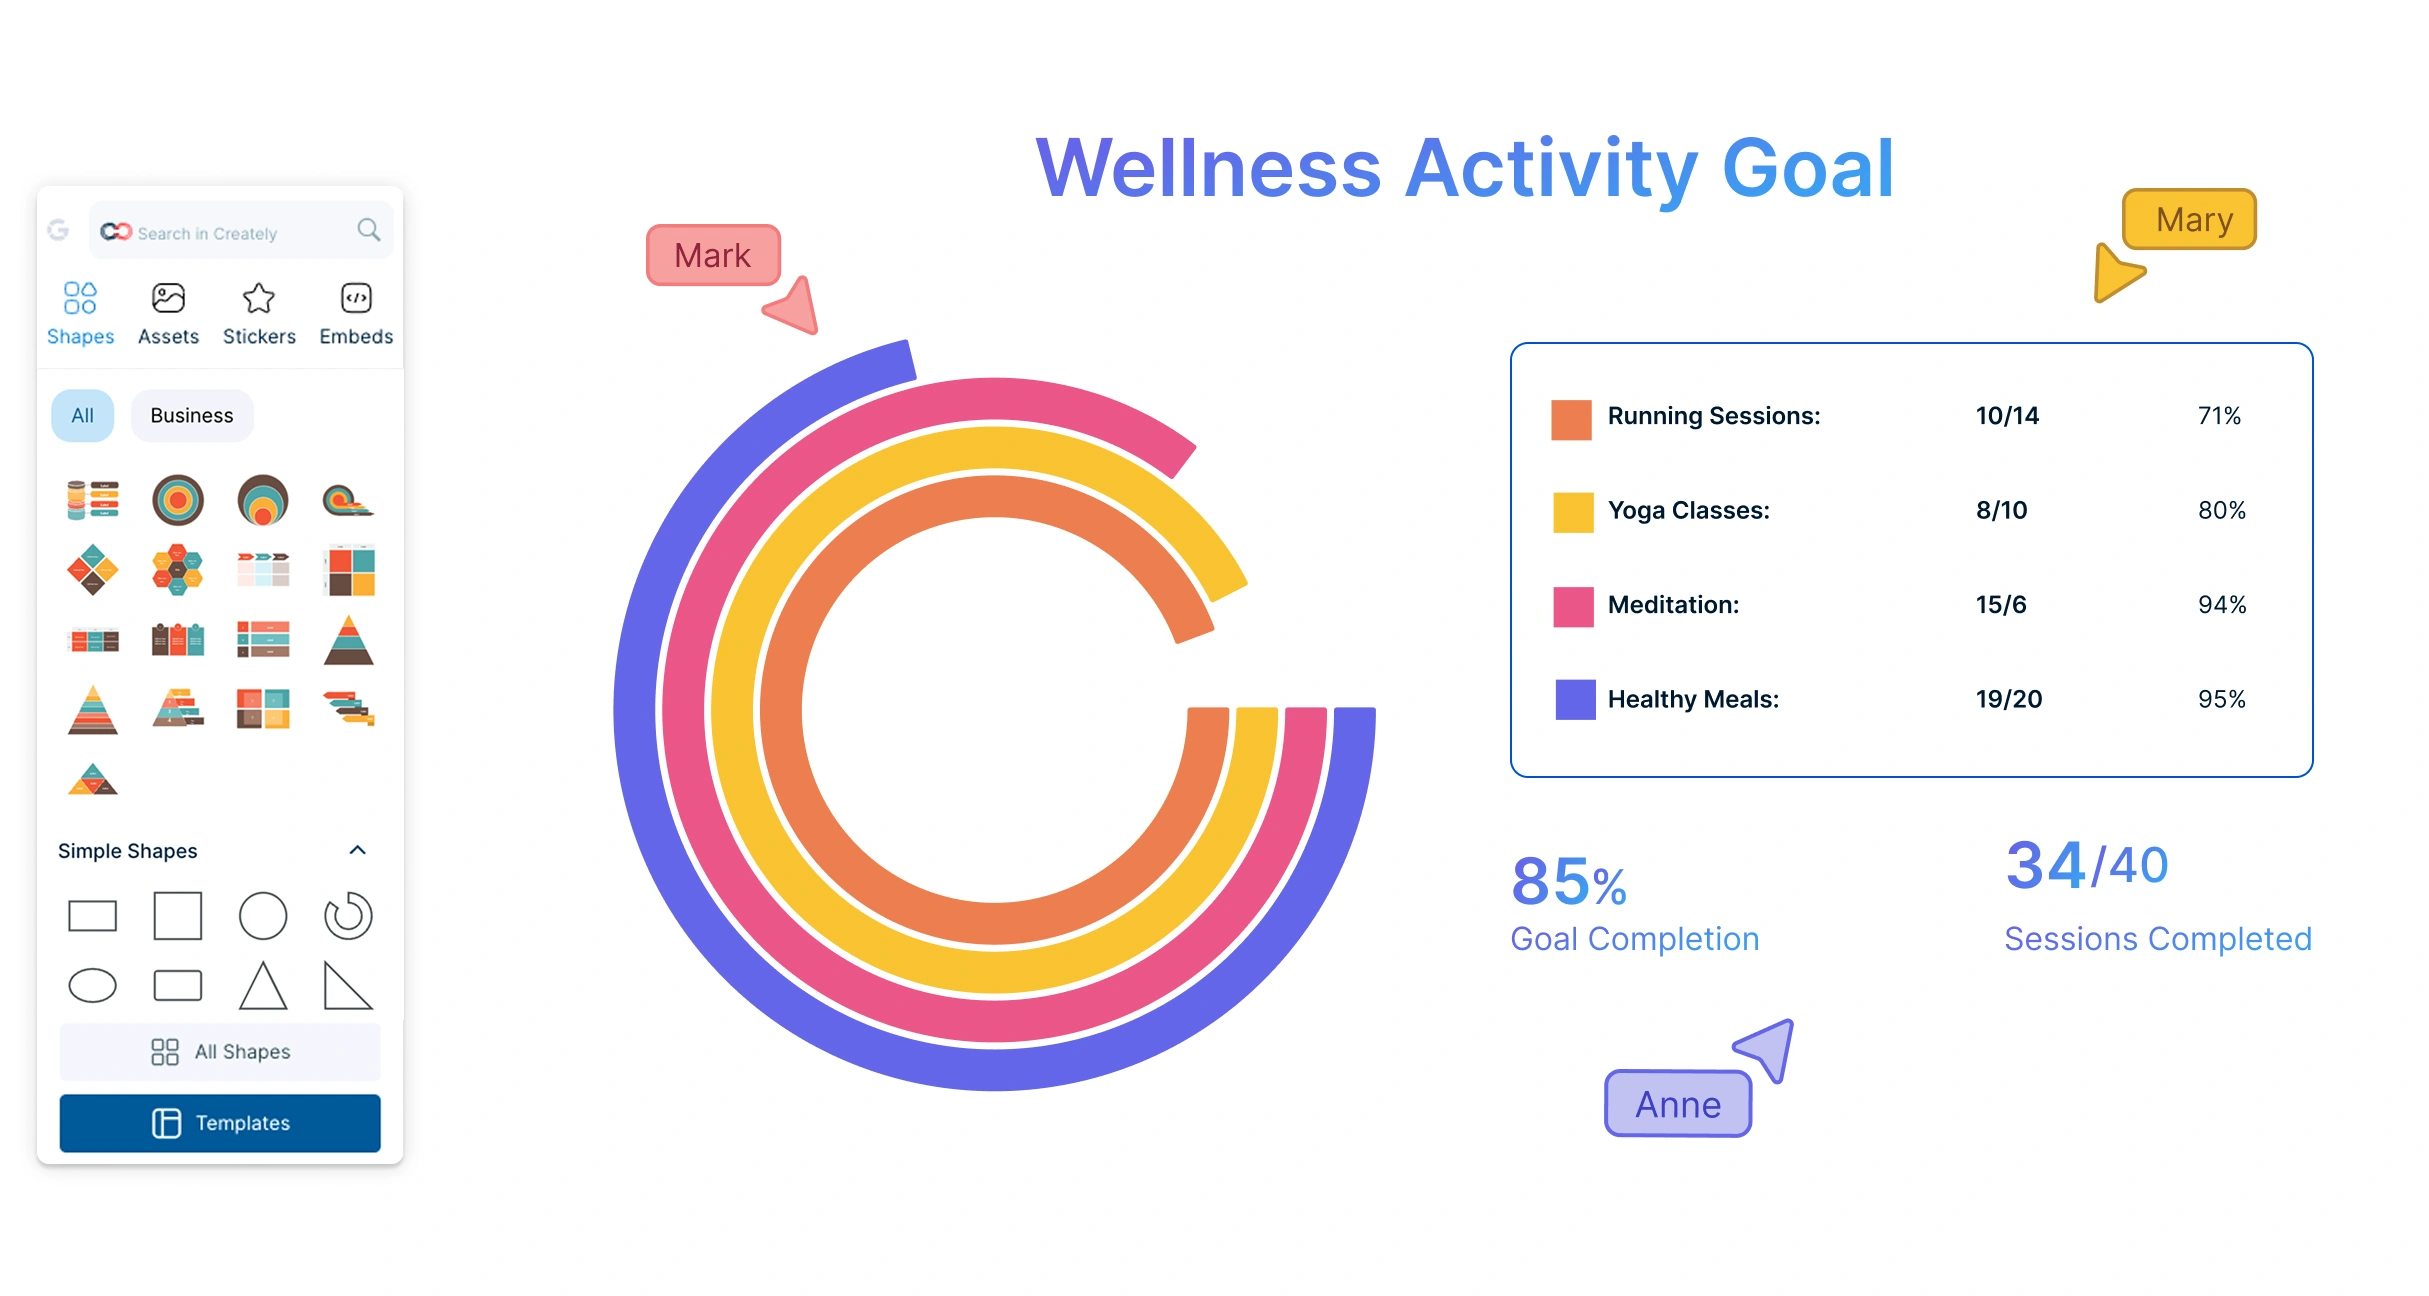
Effortlessly transform your data into visually engaging donut charts. Visualize sales data, project progress, or survey insights with clarity.
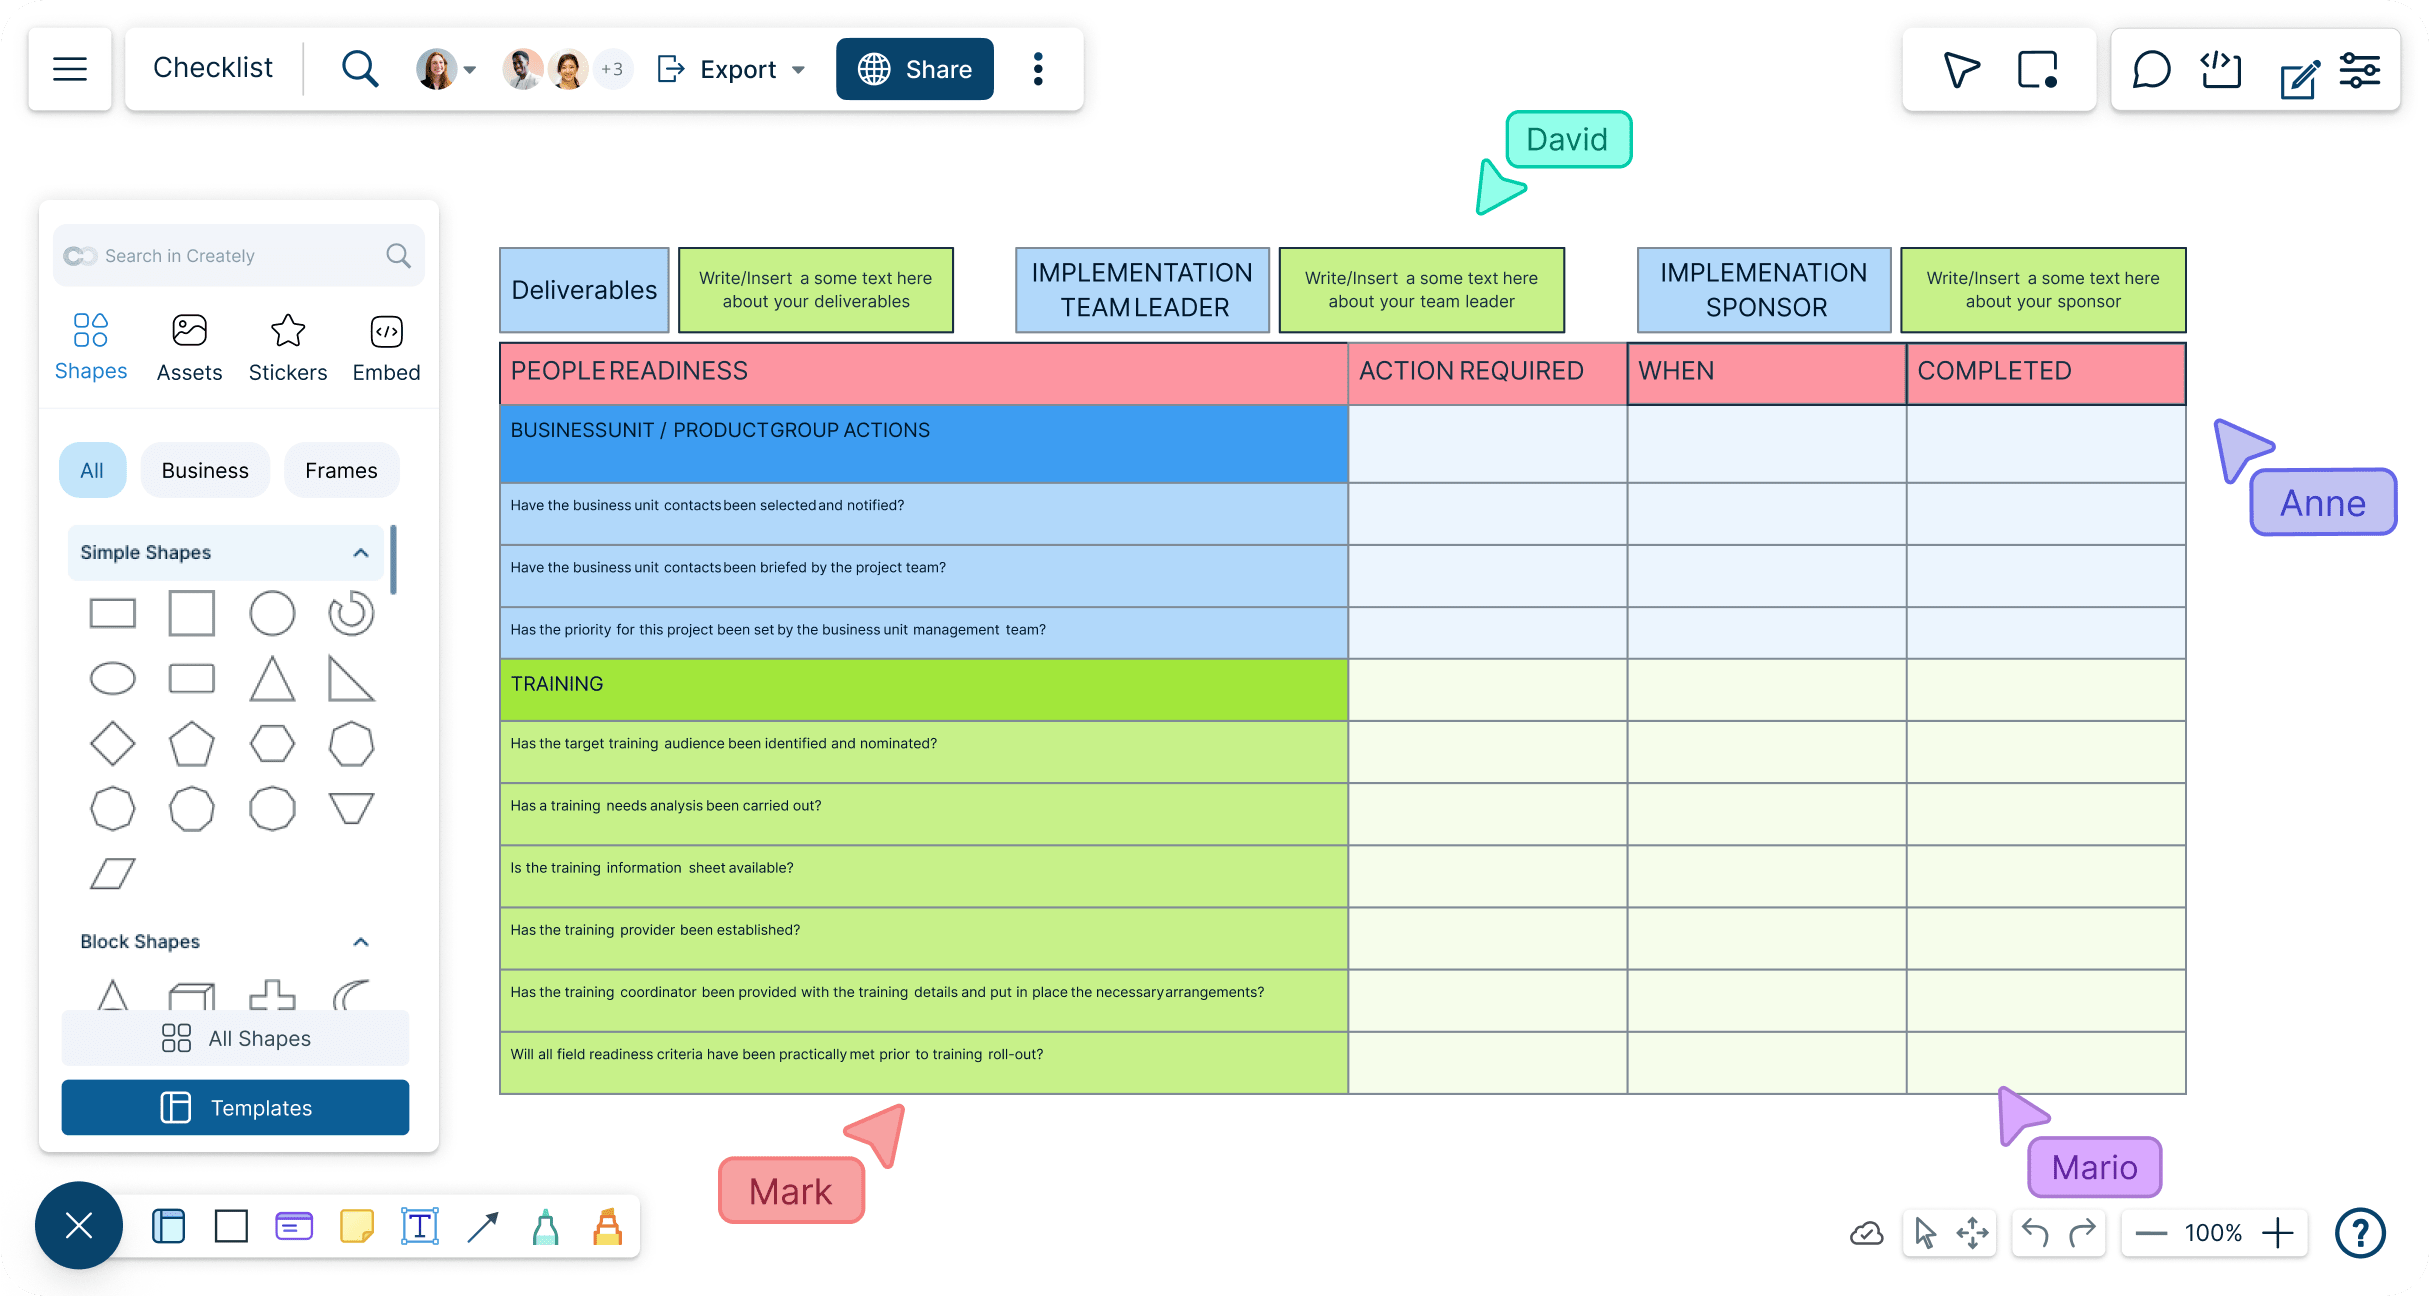
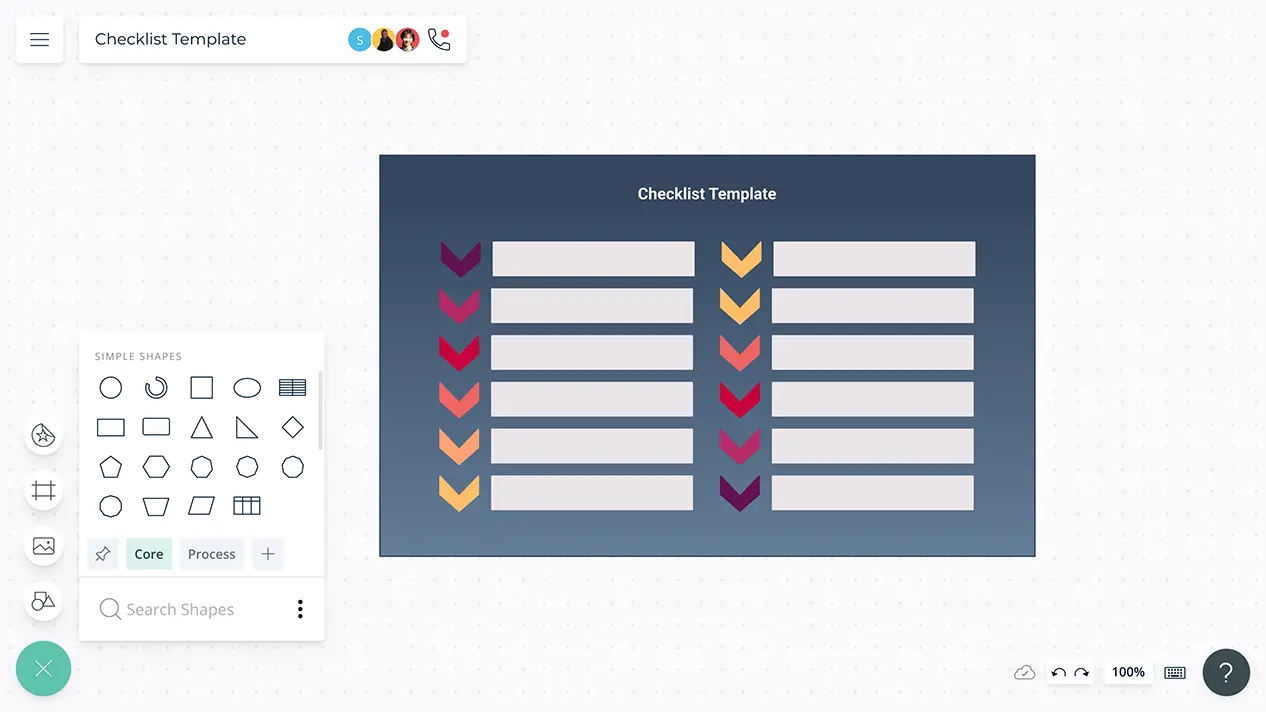
Turn scattered tasks, deadlines, owners, and updates into one organized checklist. Plan repeatable work, track progress, collaborate with others, and keep every step easy to review and complete.
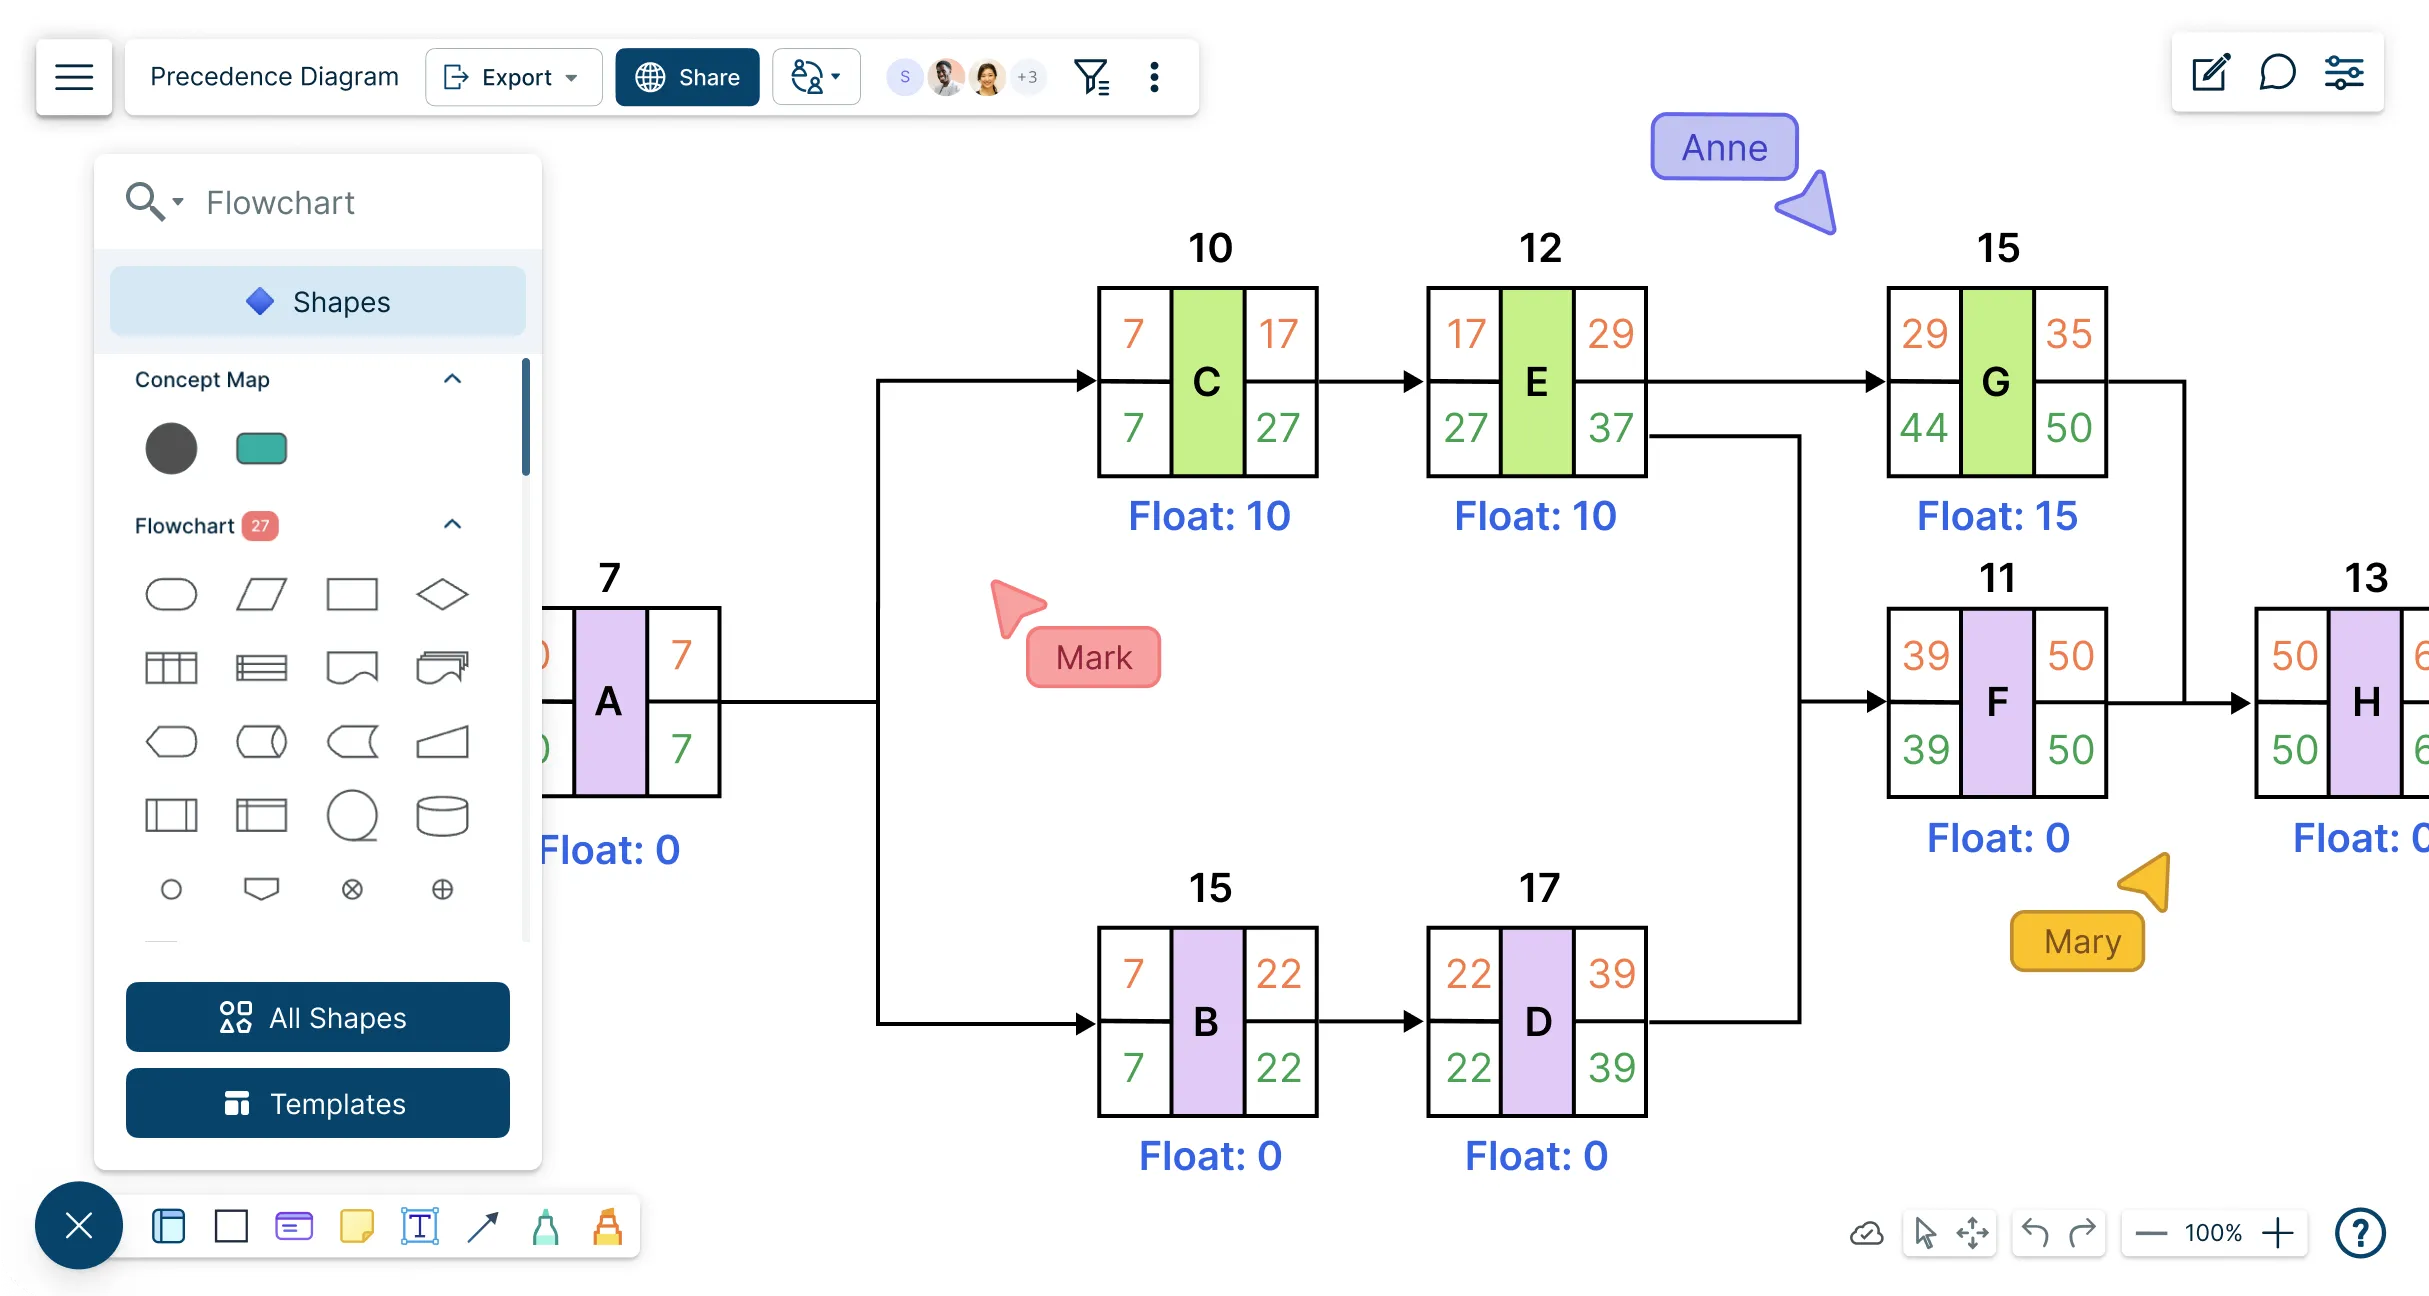
Visually represent project plans, note dependencies and better manage their execution with Creately’s precedence diagram maker.
Easily map tasks, dependencies, and timelines—create, collaborate, and share arrow diagrams in minutes.
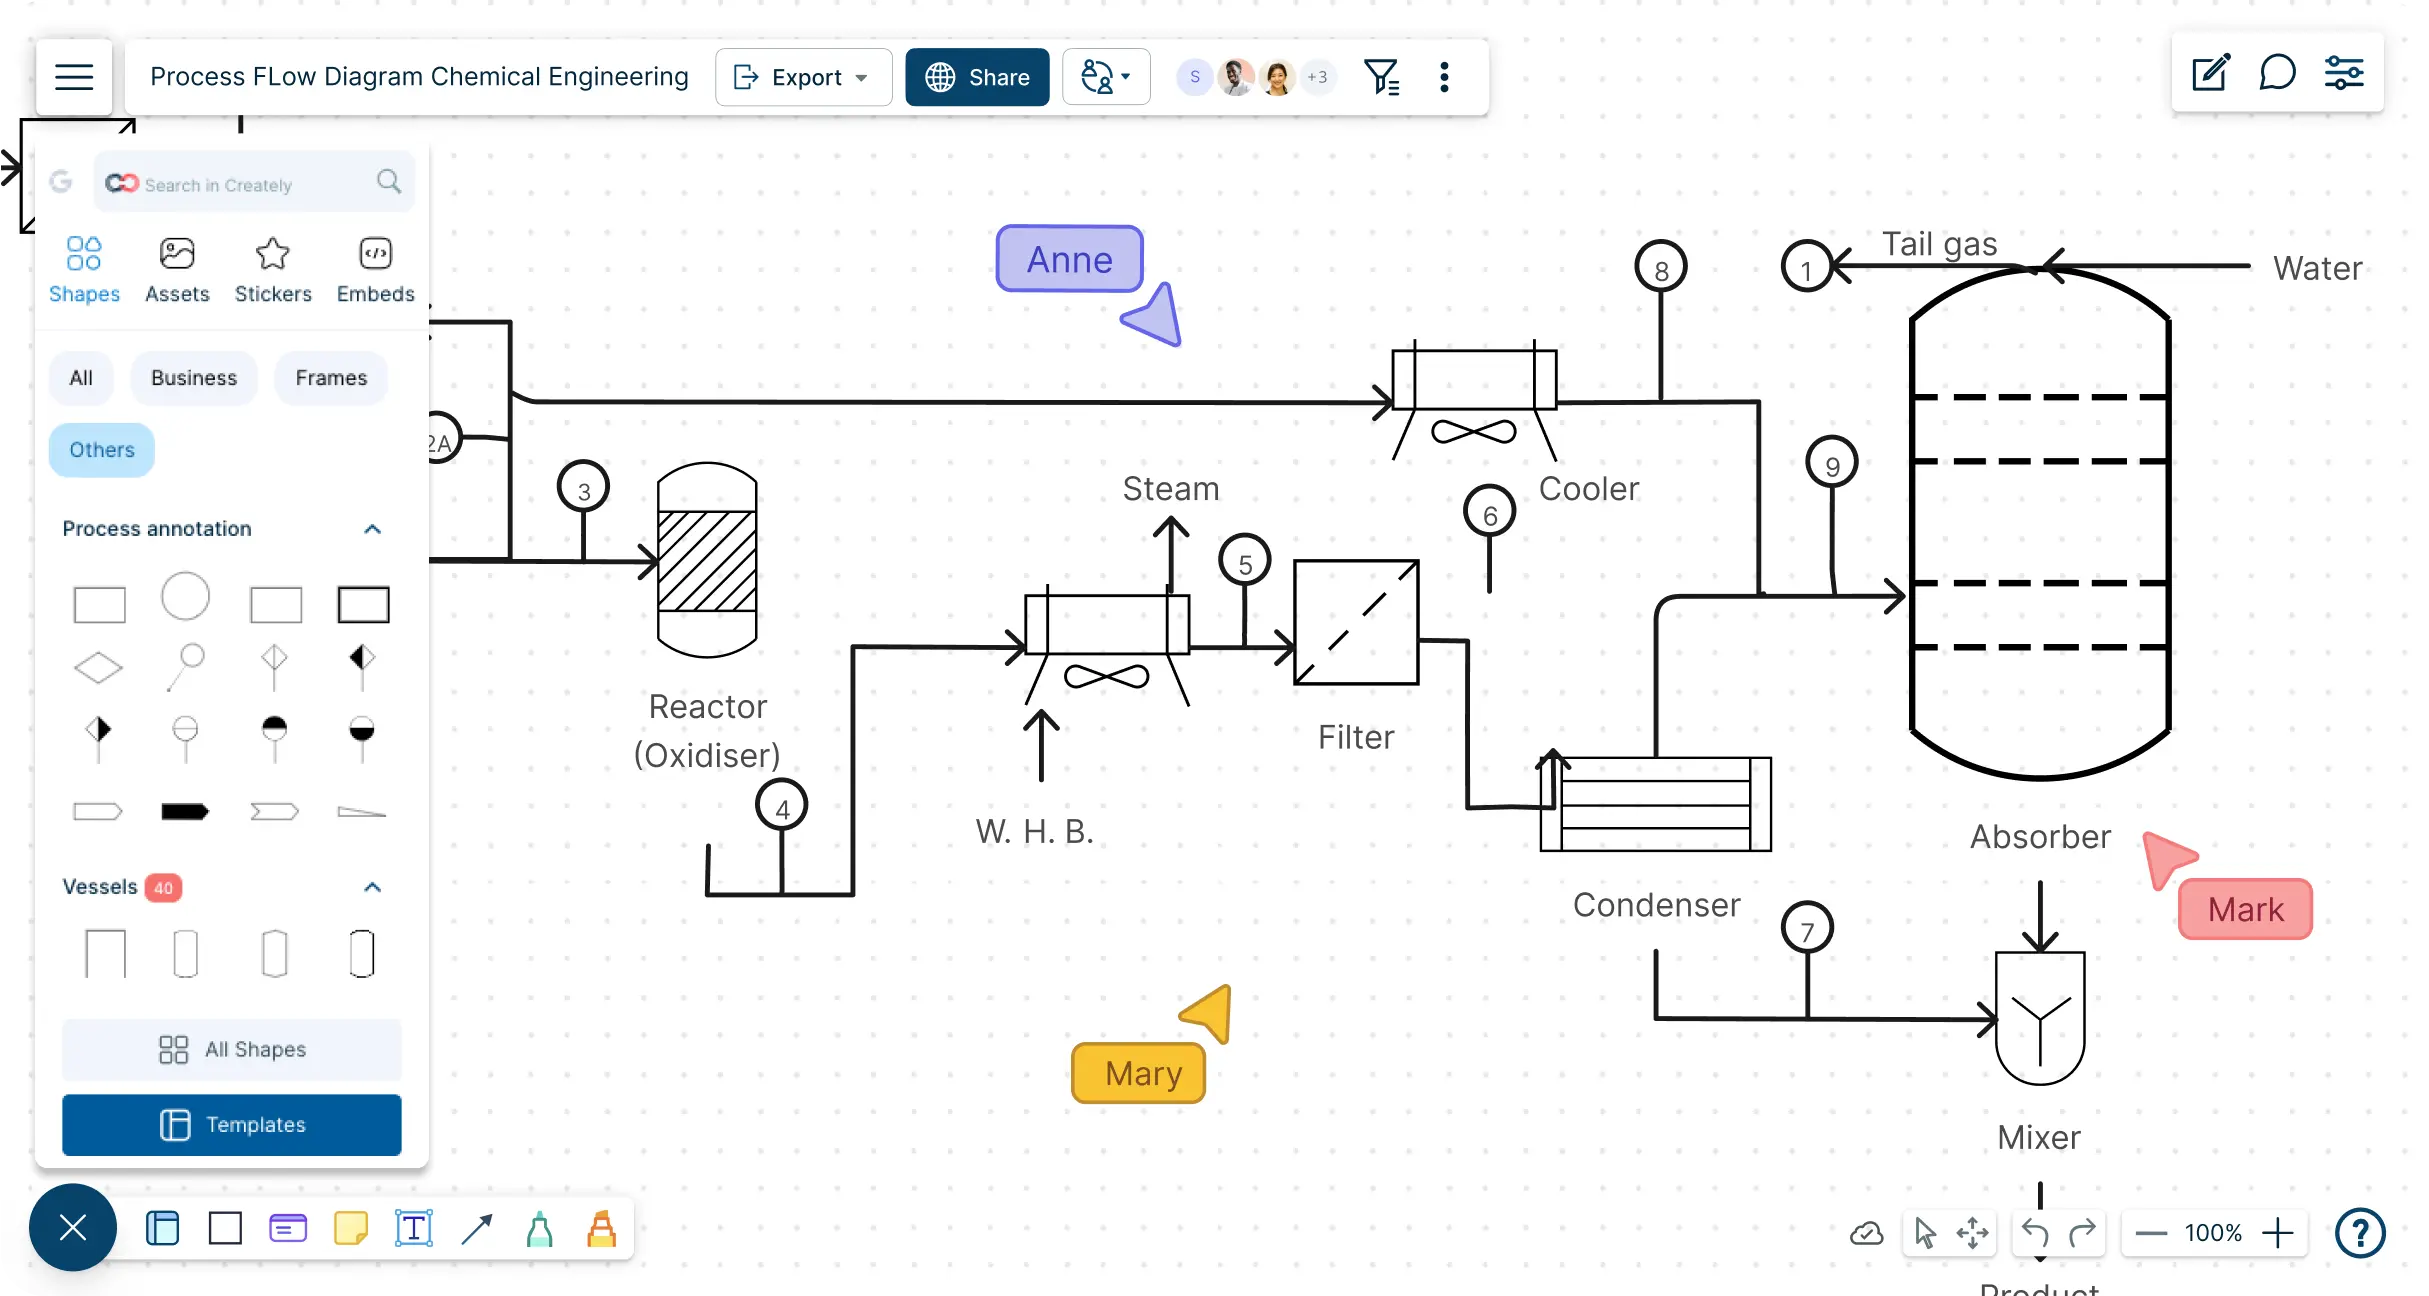
Easily visualize and streamline complex processes with Creately’s process flow diagram software. Design professional workflows, identify inefficiencies, and improve decision-making with customizable, collaborative diagrams.
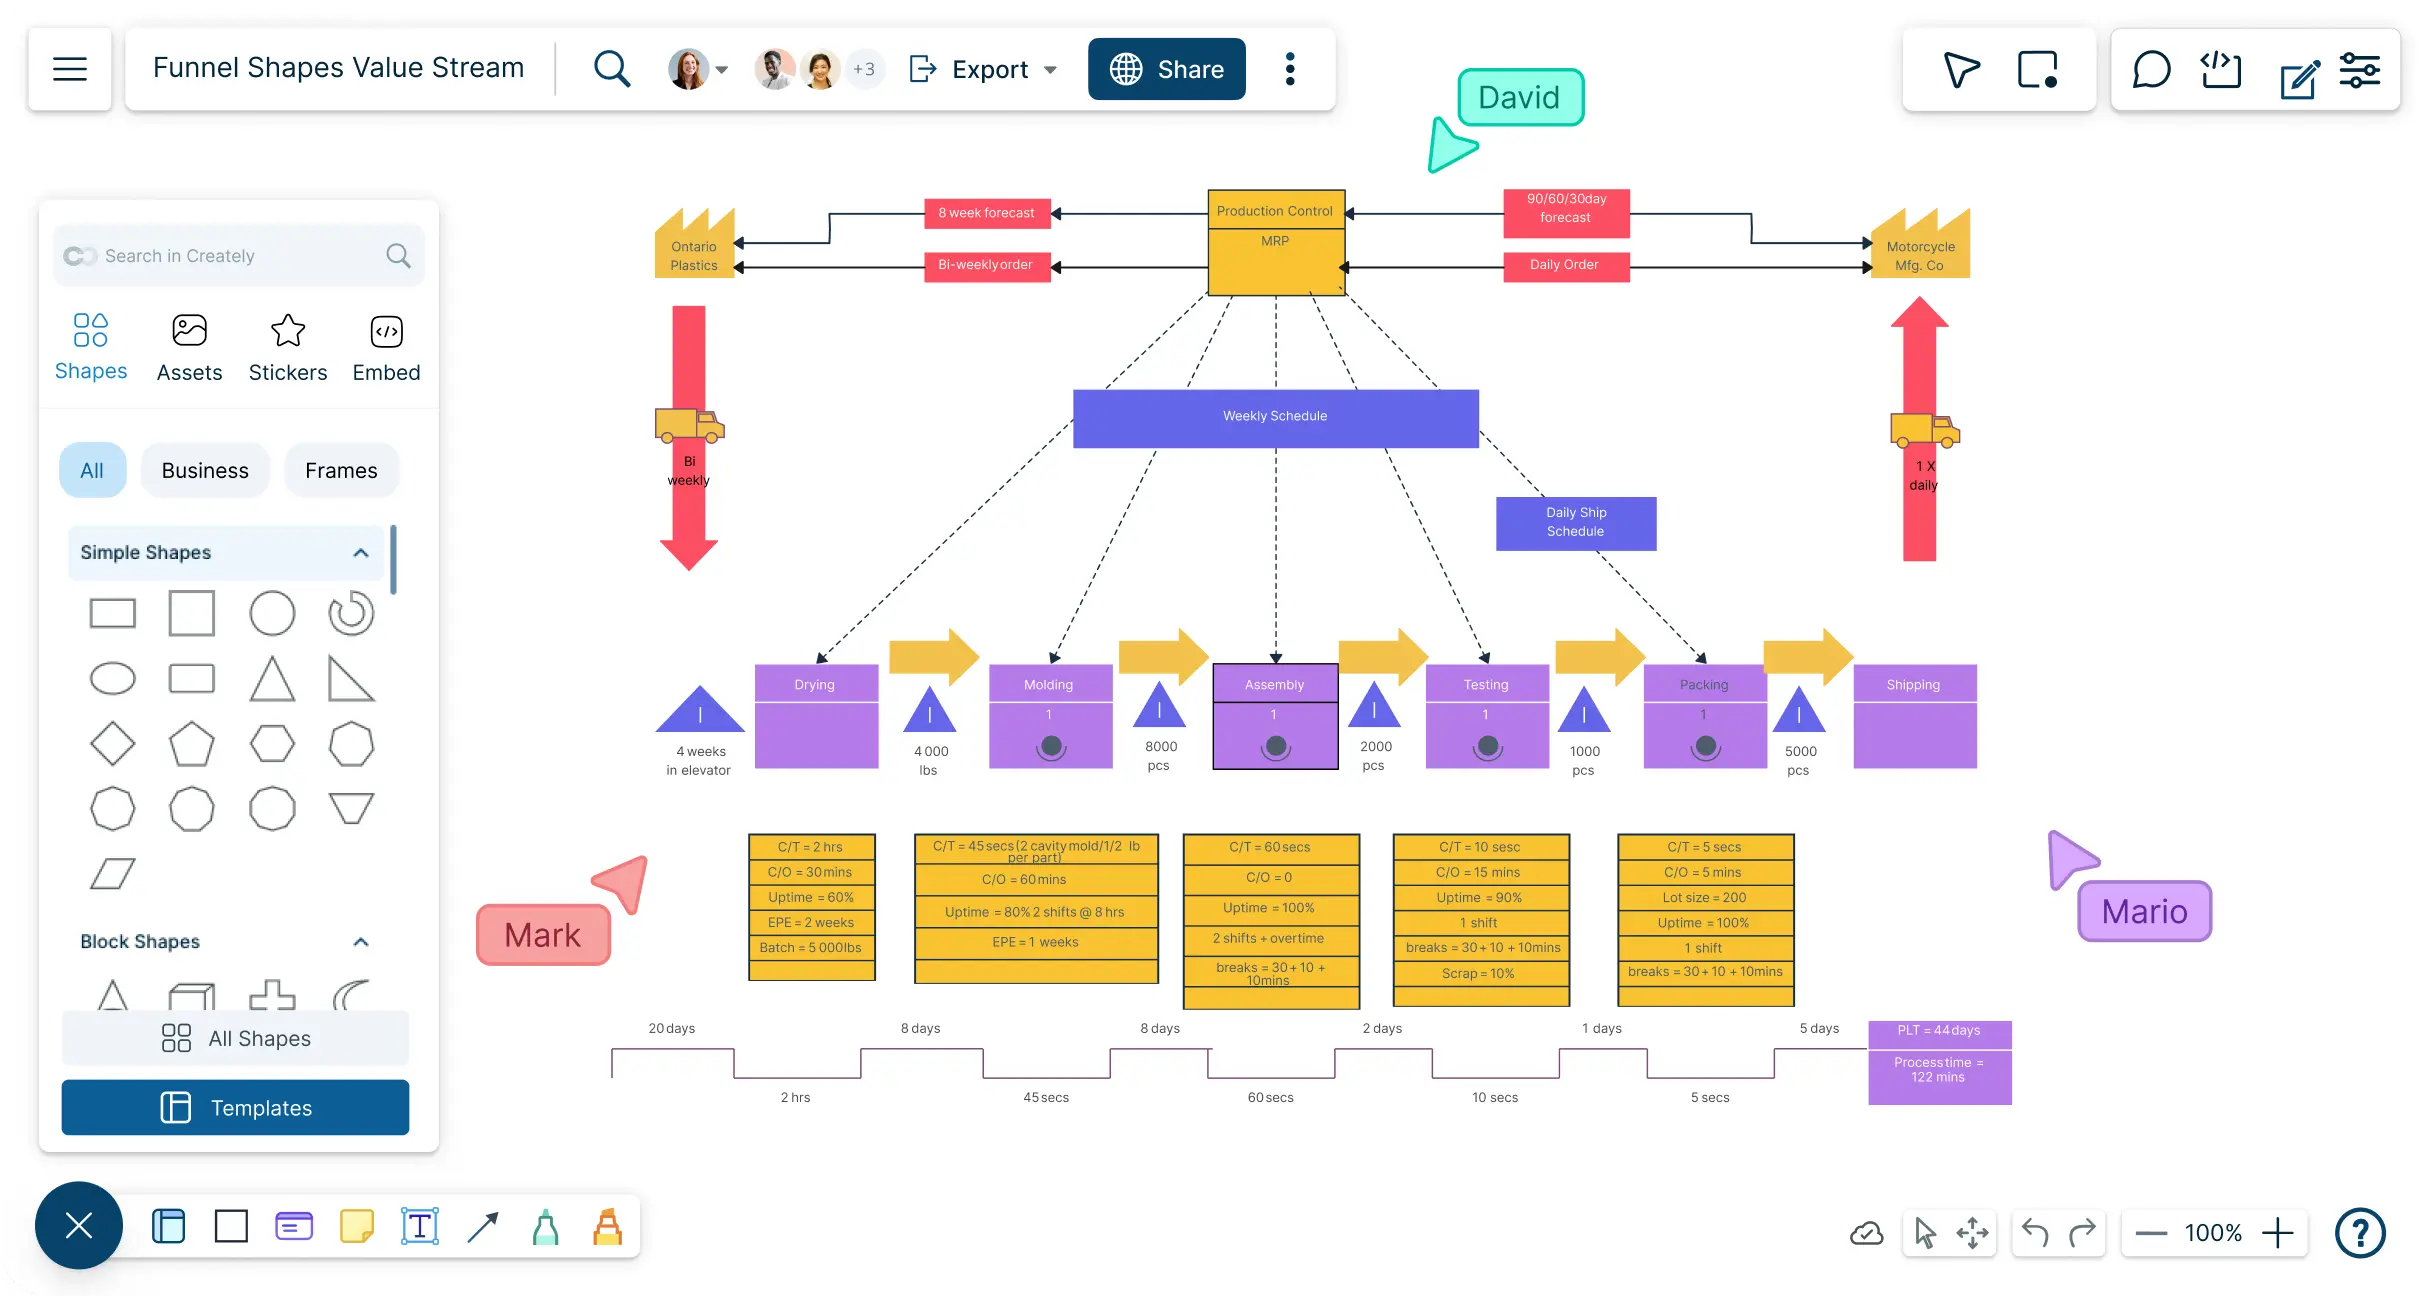
Identify waste and inefficiencies in your existing processes and collaborate to develop solutions for improvement using our advanced value stream mapping online.
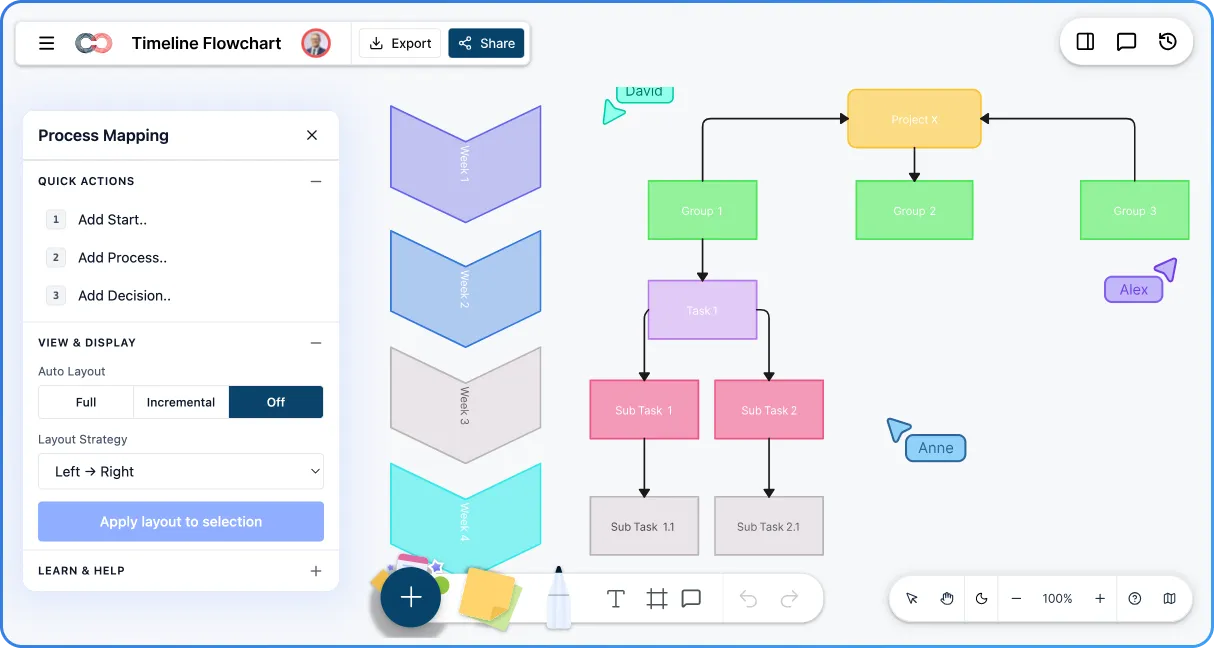
Create clear, visual timelines with Creately’s Timeline Flowchart Creator. Track milestones, stay aligned, and plan projects effortlessly with professional, easy-to-follow visuals.
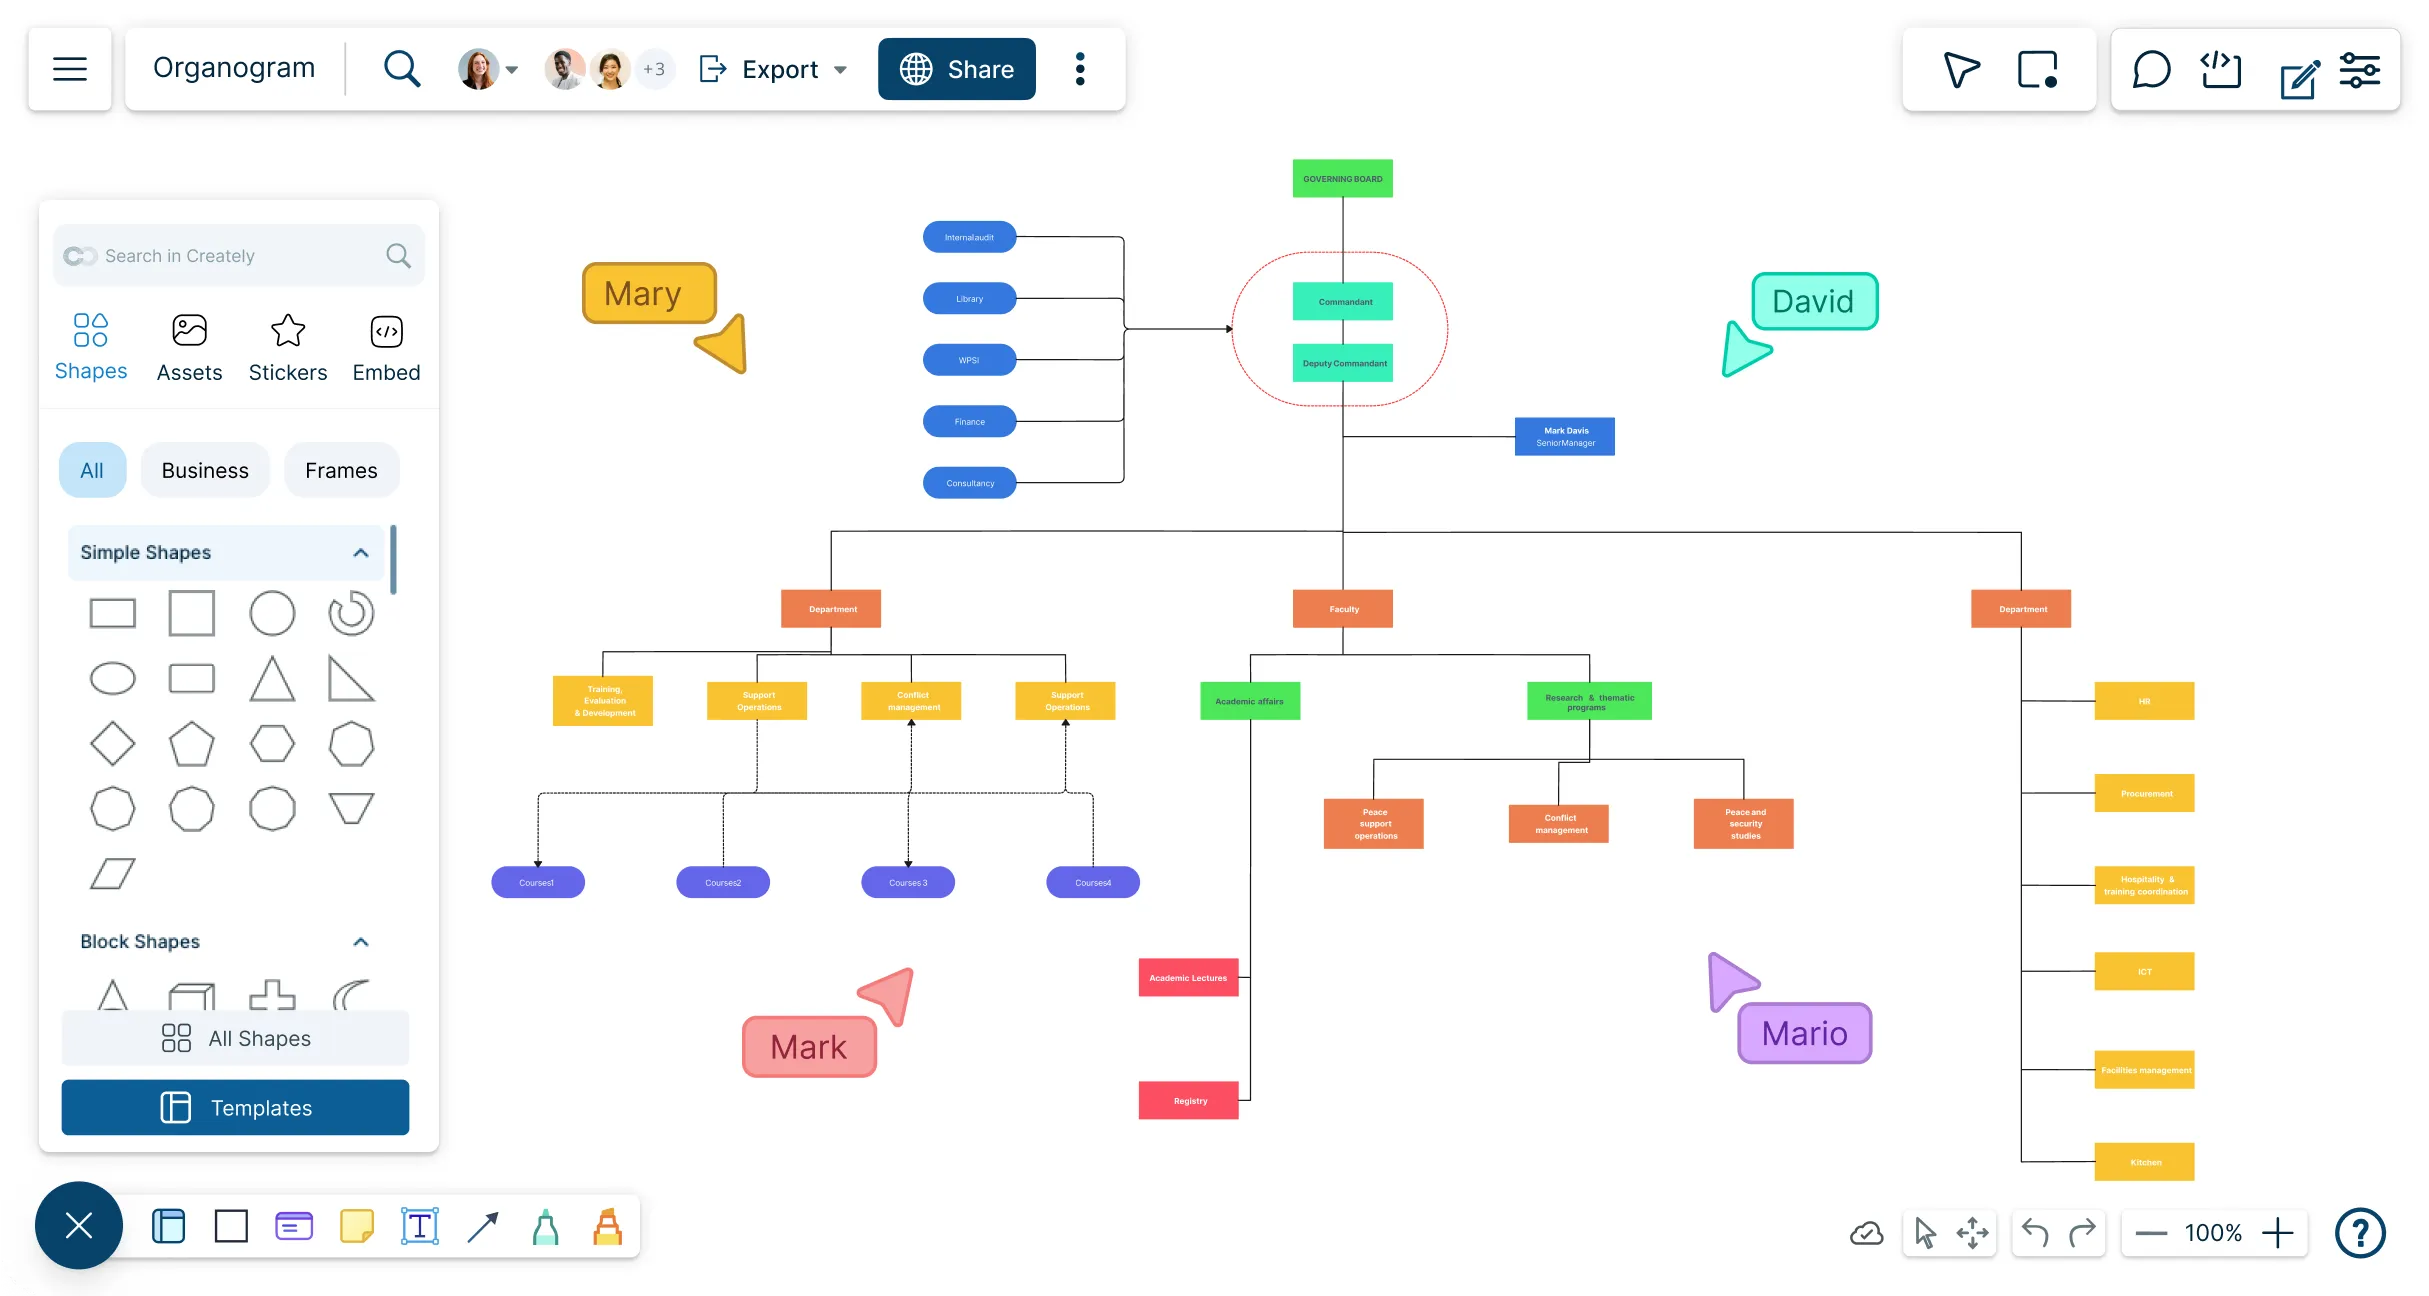
Creately's intuitive and powerful organogram maker to create organograms online. Visualize organizational hierarchies, clarify responsibilities, & manage employee information effectively.
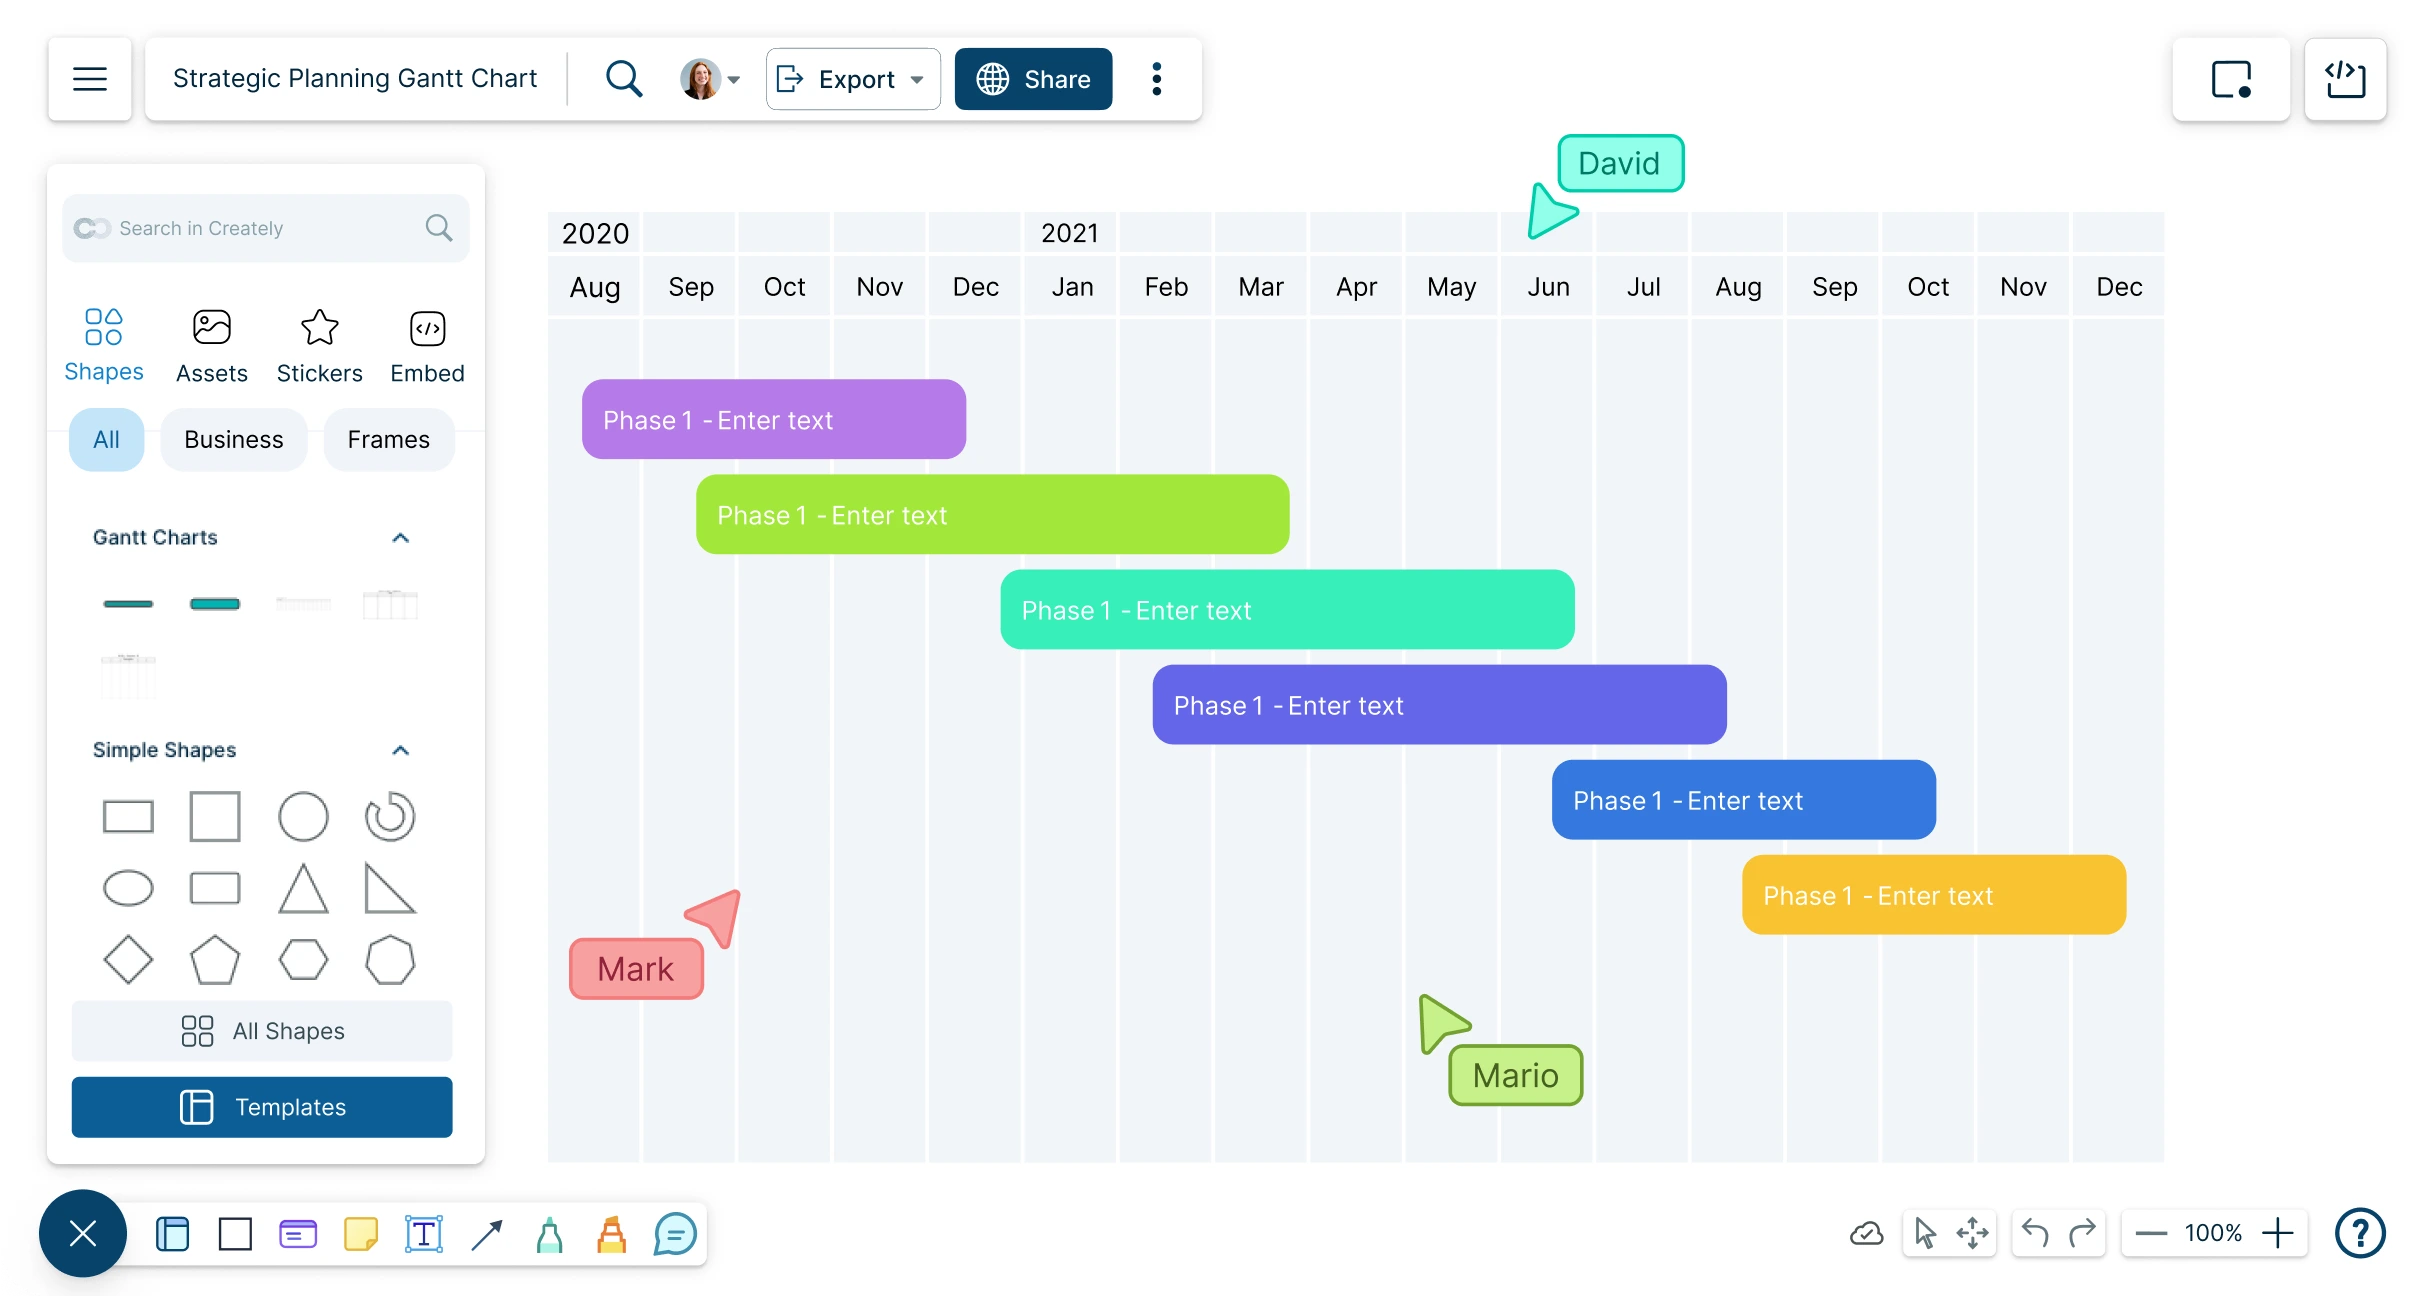
Create timelines for any event; track and analyze your team’s projects and tasks from start to finish with Creately’s Online Gantt Charts.
Use the mind map online tool to visualize ideas and concepts for collaborative brainstorming, creative thinking, problem-solving, and so much more.
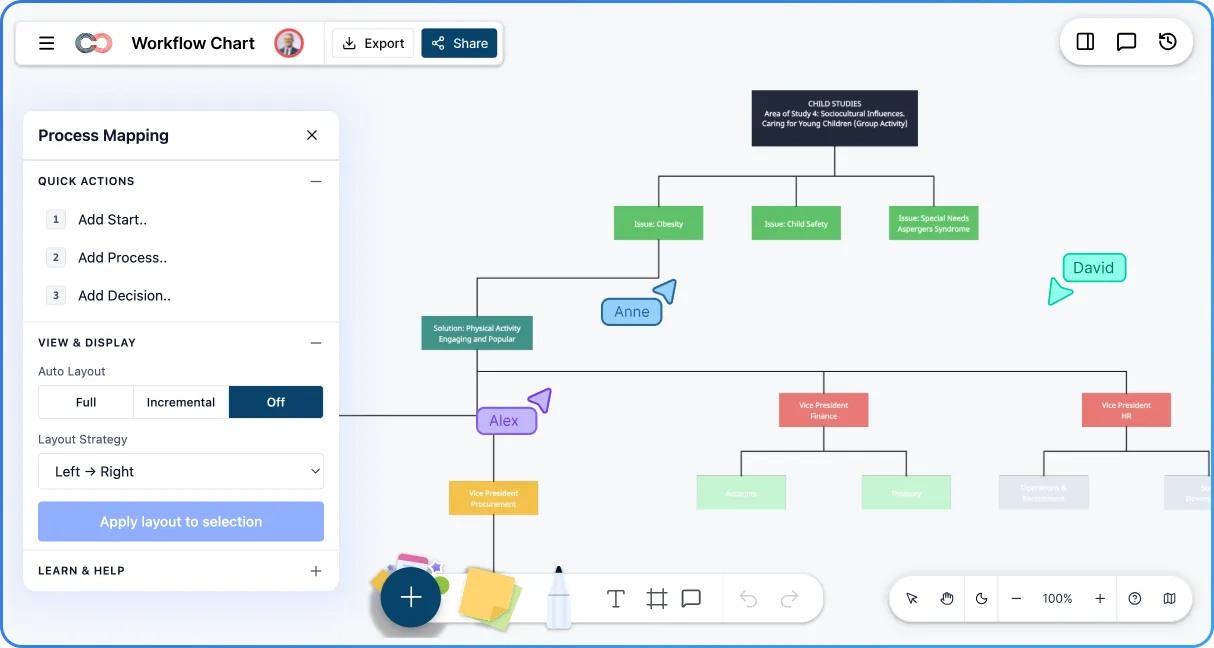
Visualize tasks, decisions, and handoffs clearly with Creately’s Workflow Chart Creator. Build professional workflow charts faster, improve team clarity, and keep every process running smoothly from start to finish.
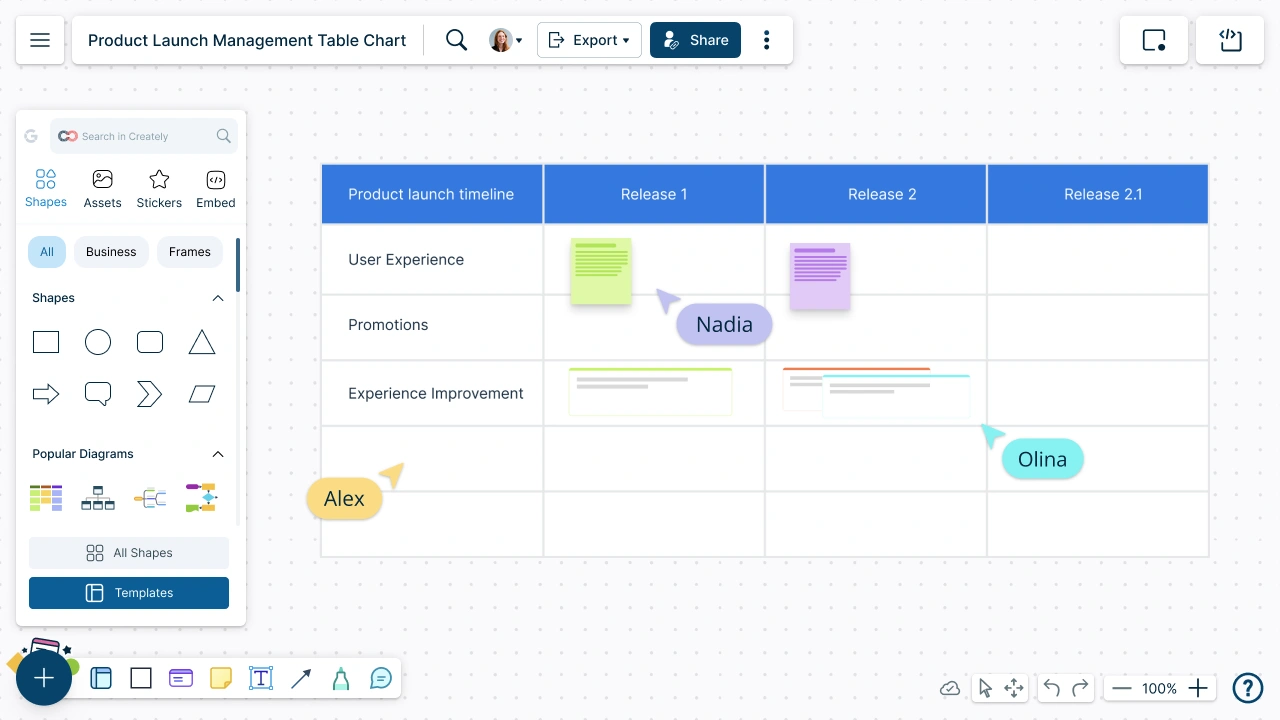
Create visually stunning table charts to organize your information and data with Creately’s table creator. Arrange your data in meaningful ways and interact with them to make effective data-driven decisions.
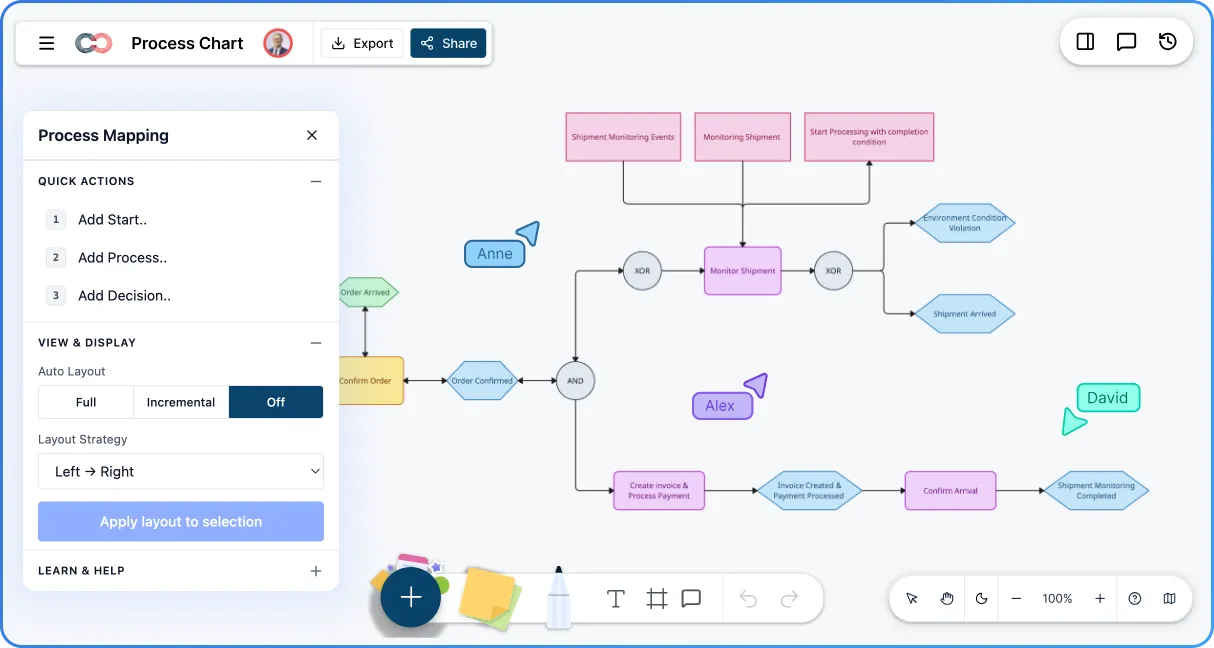
Map workflows online with clarity and precision. Creately’s process chart creator helps teams plan, refine, and execute processes efficiently—boosting collaboration and ensuring reliable results.
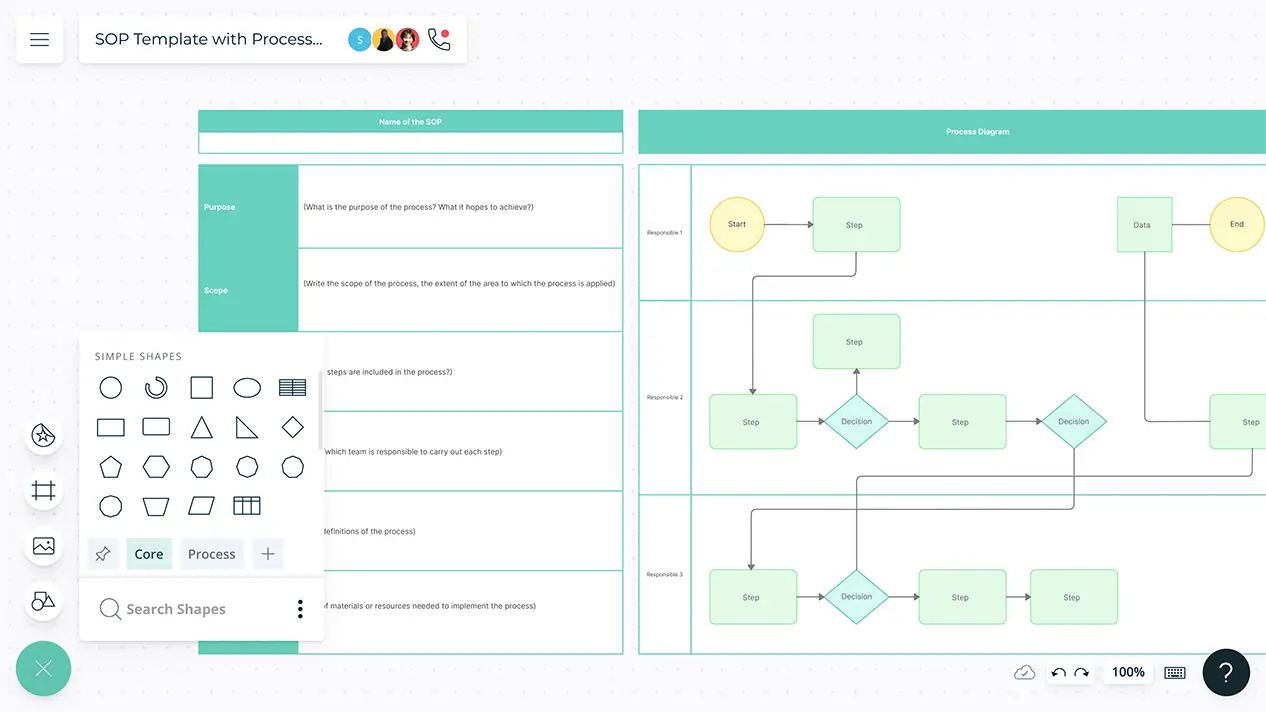
What is an SOP An SOP (Standard Operating Procedure) is a set of step-by-step instructions that outline how to perform a specific task or process in a consistent and efficient manner. It serves as a guide for employees, ensuring that operations are carried out correctly, safely, and in compliance with industry standards or regulations. SOPs are essential for businesses and organizations because they:
Turn scattered opinions, trade-offs, and decision factors into a clear visual pros and cons list your team can review, discuss, and act on together.
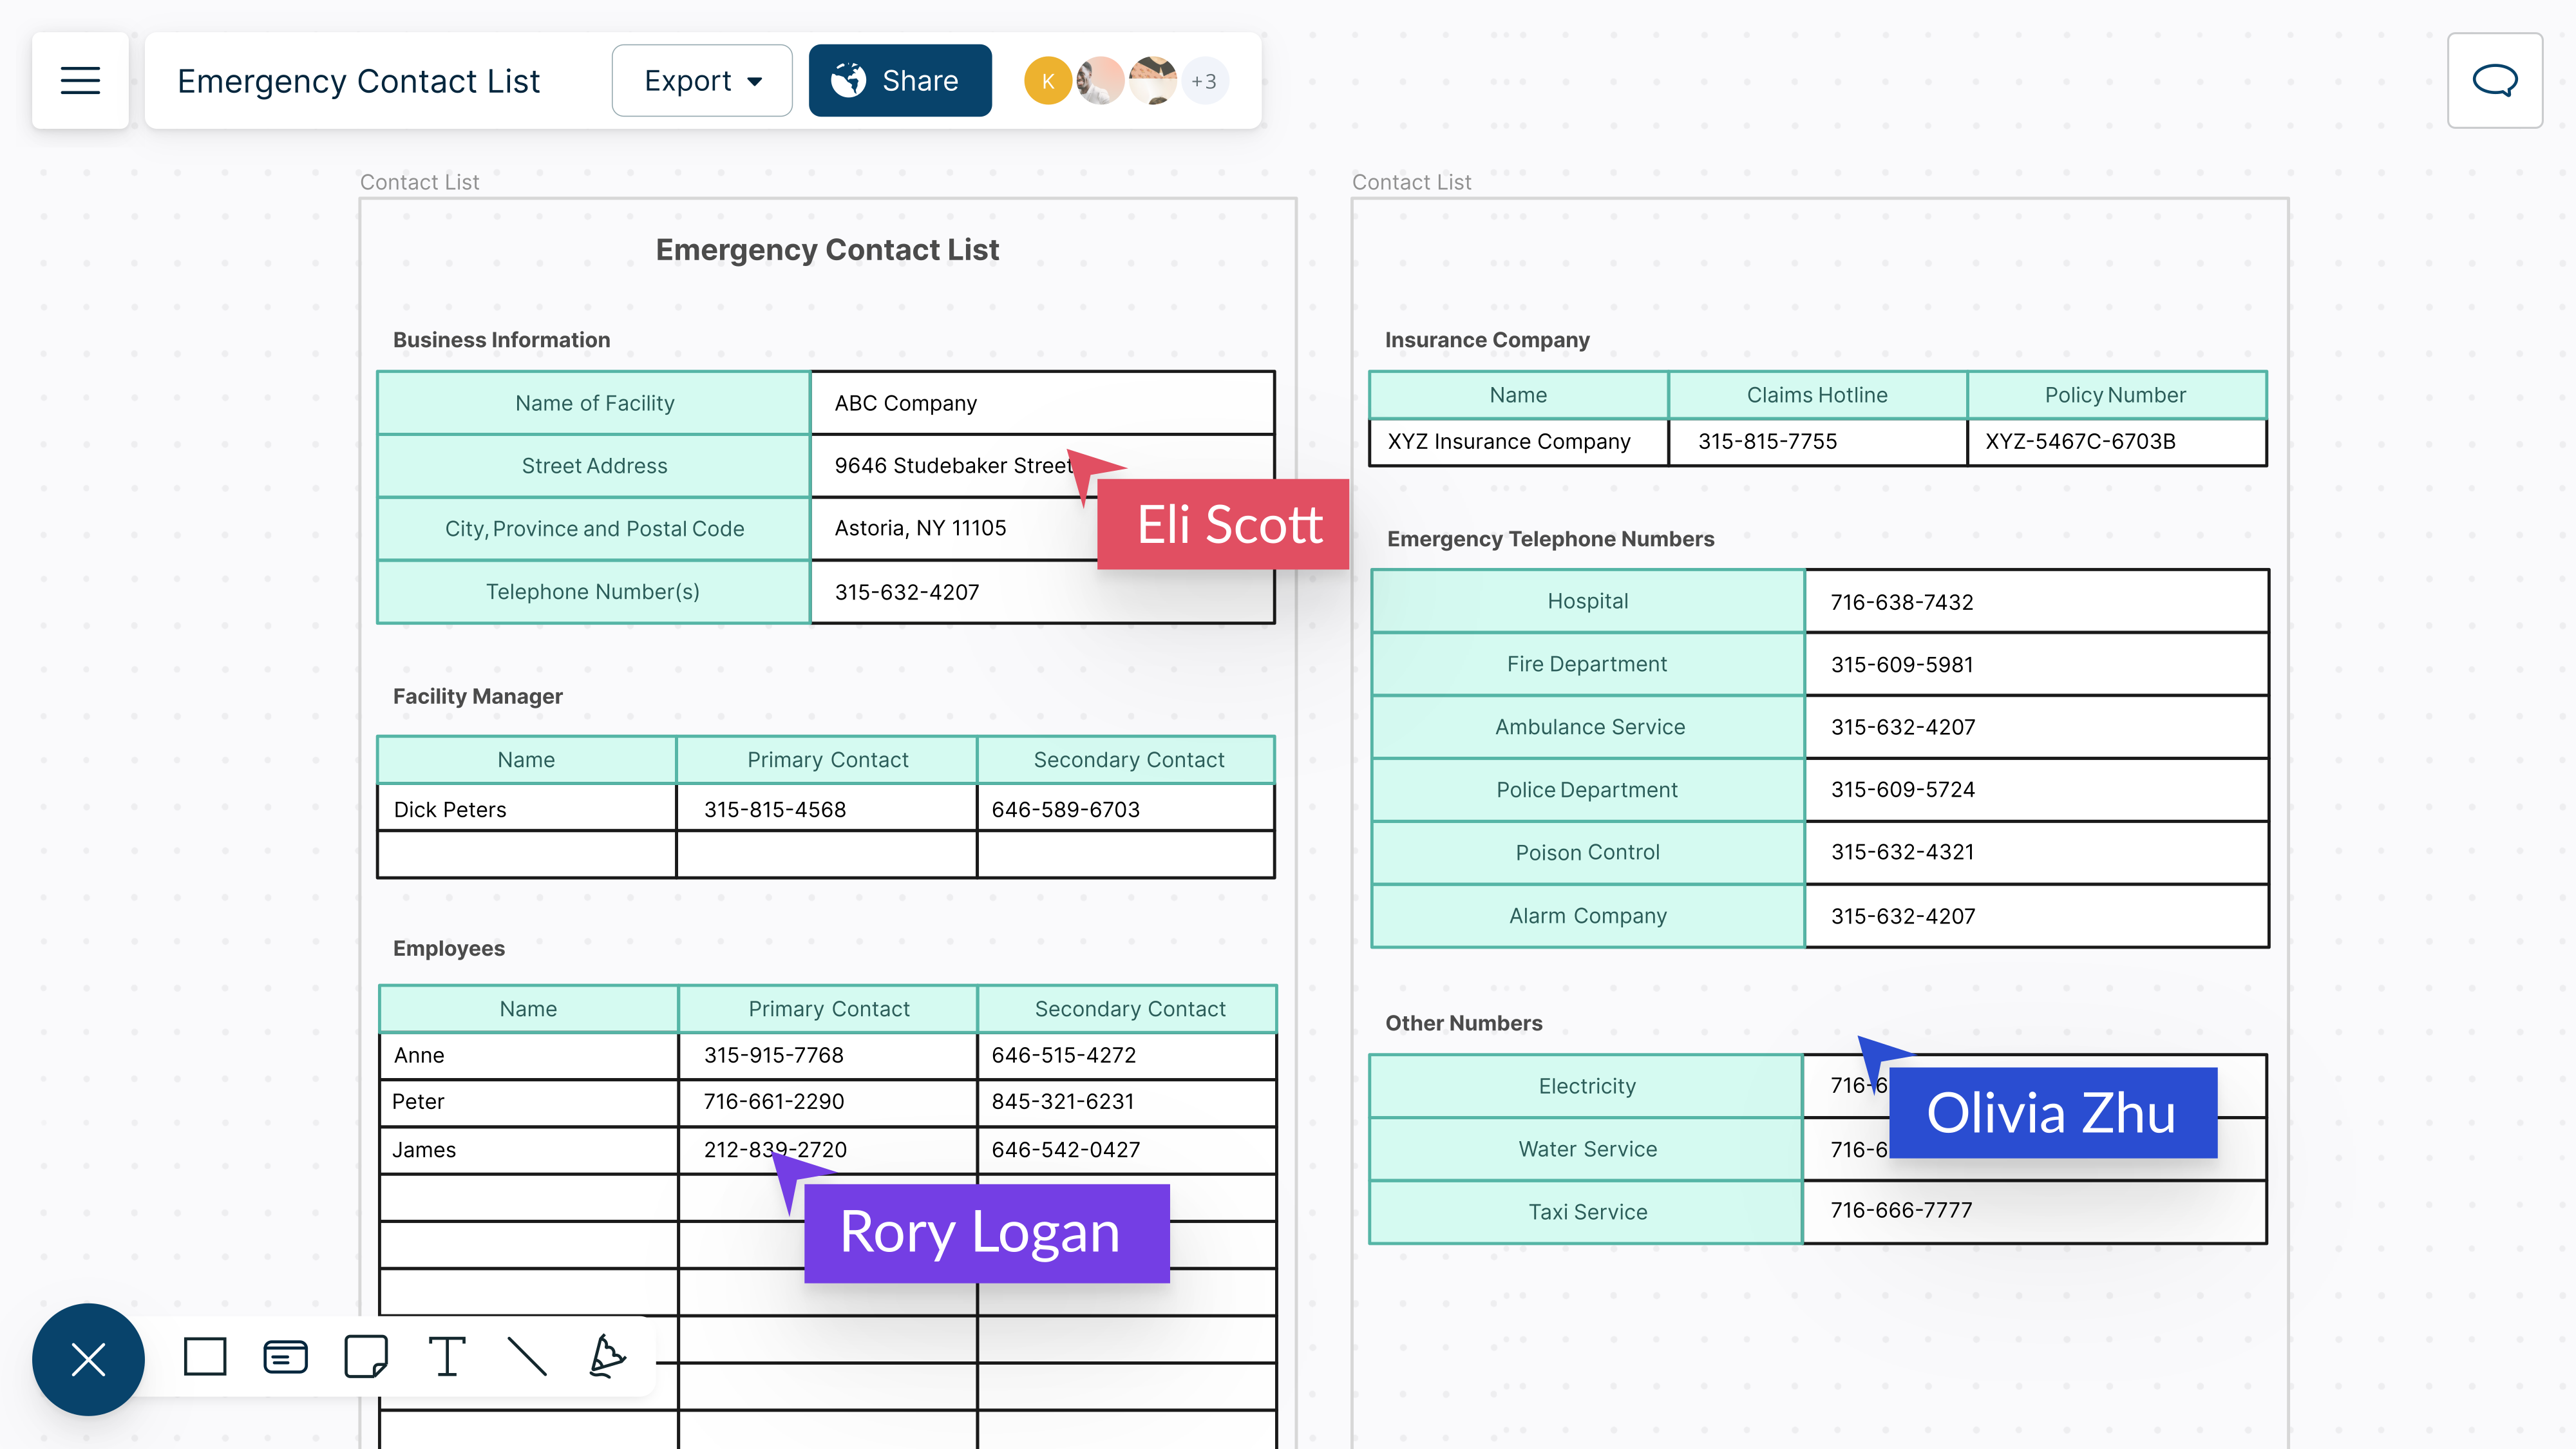
A visual address book that helps you keep track of contact details and helps you stay organized.
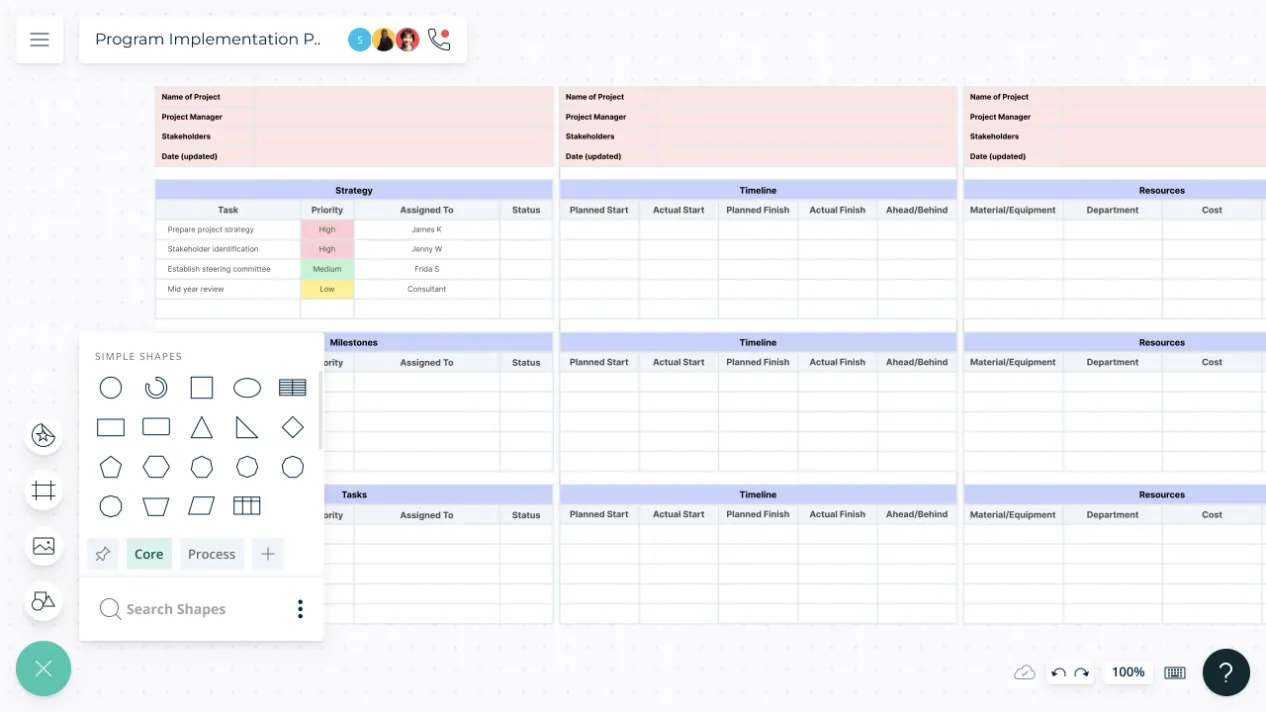
Outline each step of your implementation plan to achieve your program goals and objectives for comprehensive planning outcomes.
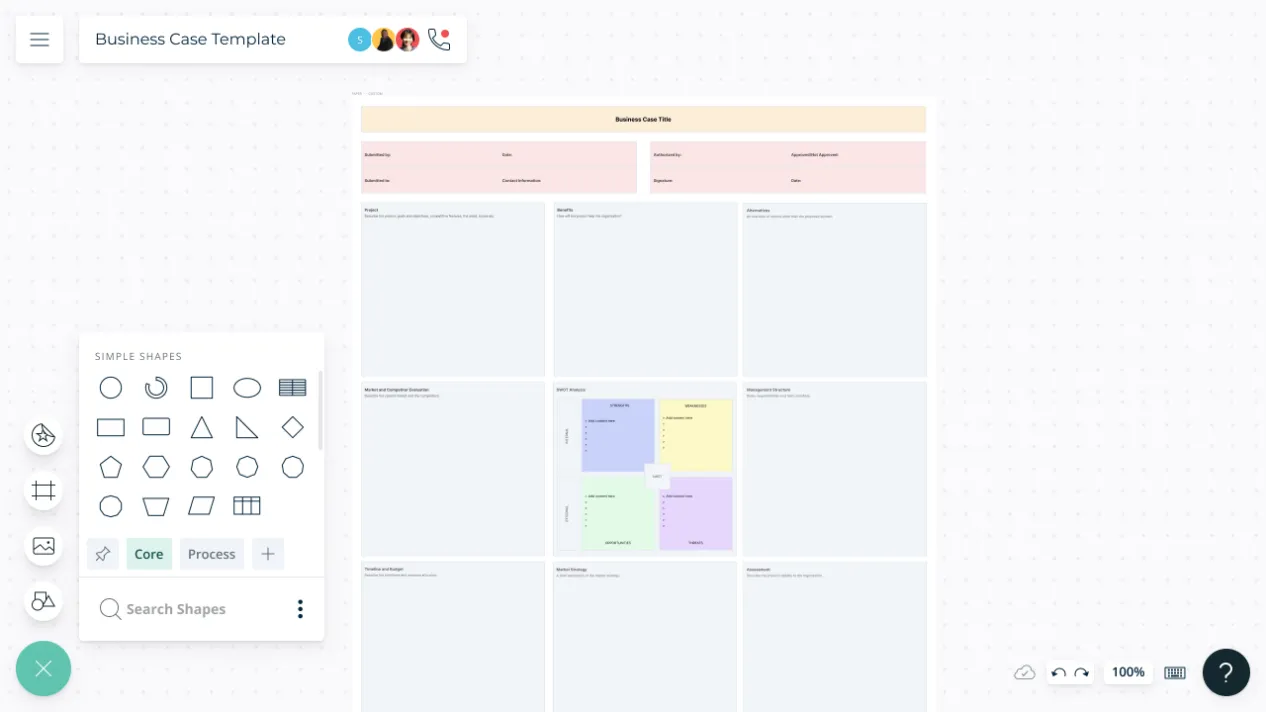
Put together practical and winning business cases and plans to take your business to the next level.
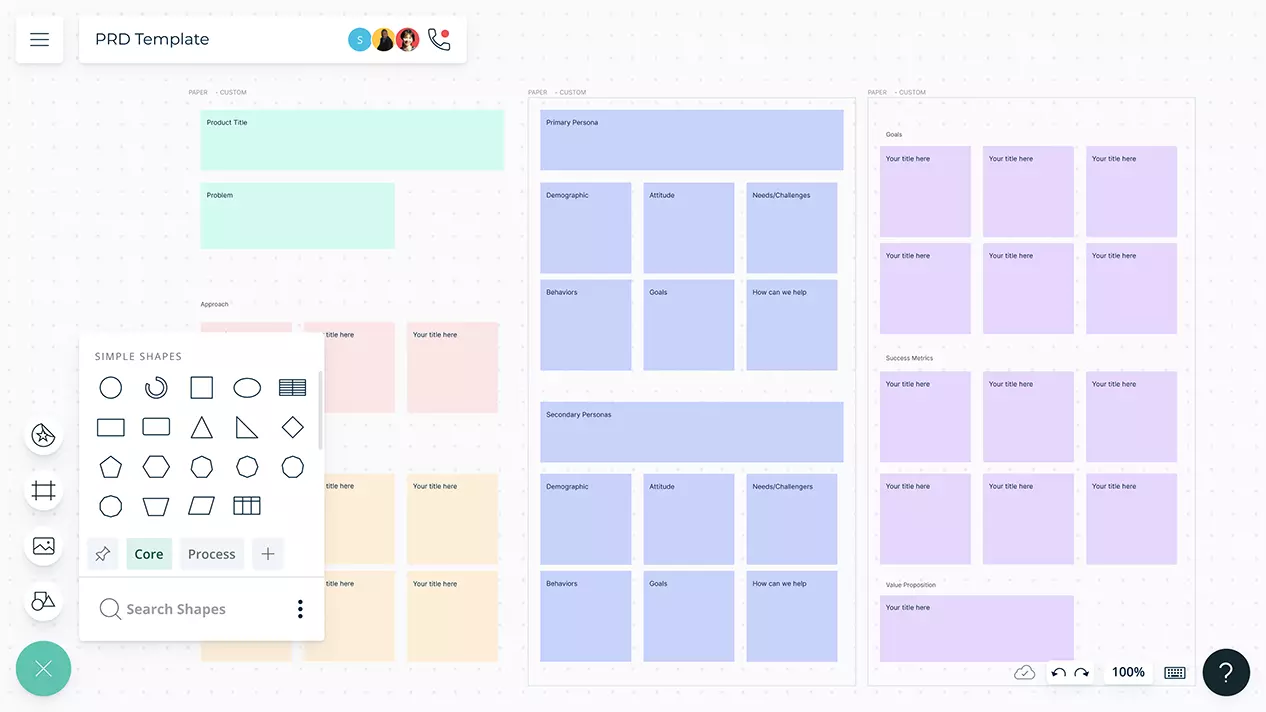
Describes the purpose, features, functionality, and behavior of the product you’re about to build.
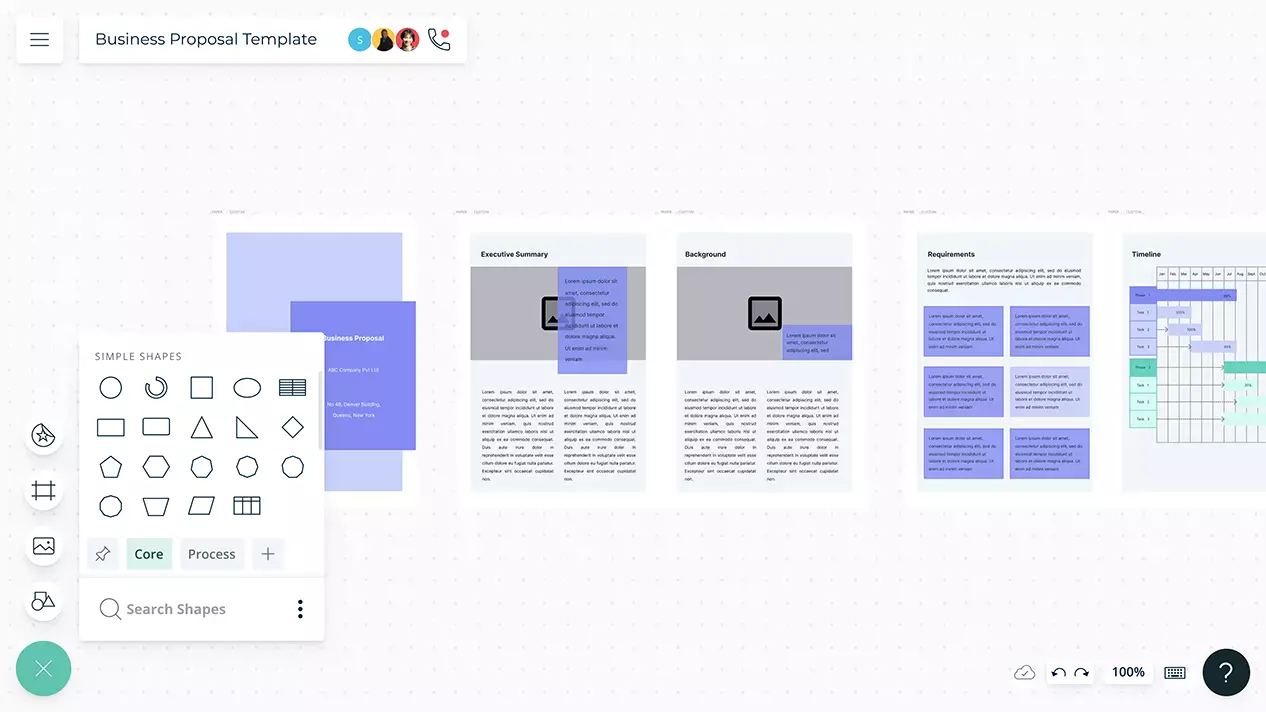
Use Creately to design winning proposals, boost your chances at client acquisition. A wide range of customizable templates and graphic assets to help you get started.
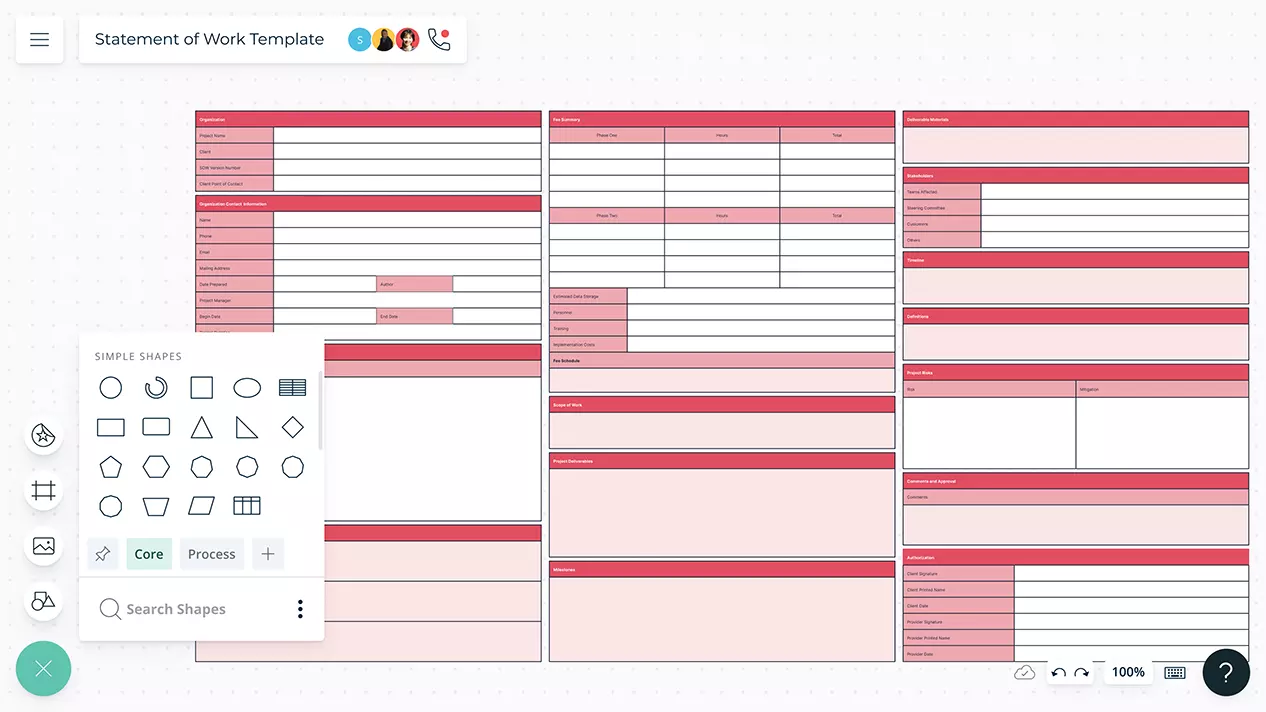
Intuitive visual tools and collaboration capabilities to create a Statement of Work document to clarify and communicate project requirements.
Map out an effective plan at various stages of an employee’s onboarding journey.
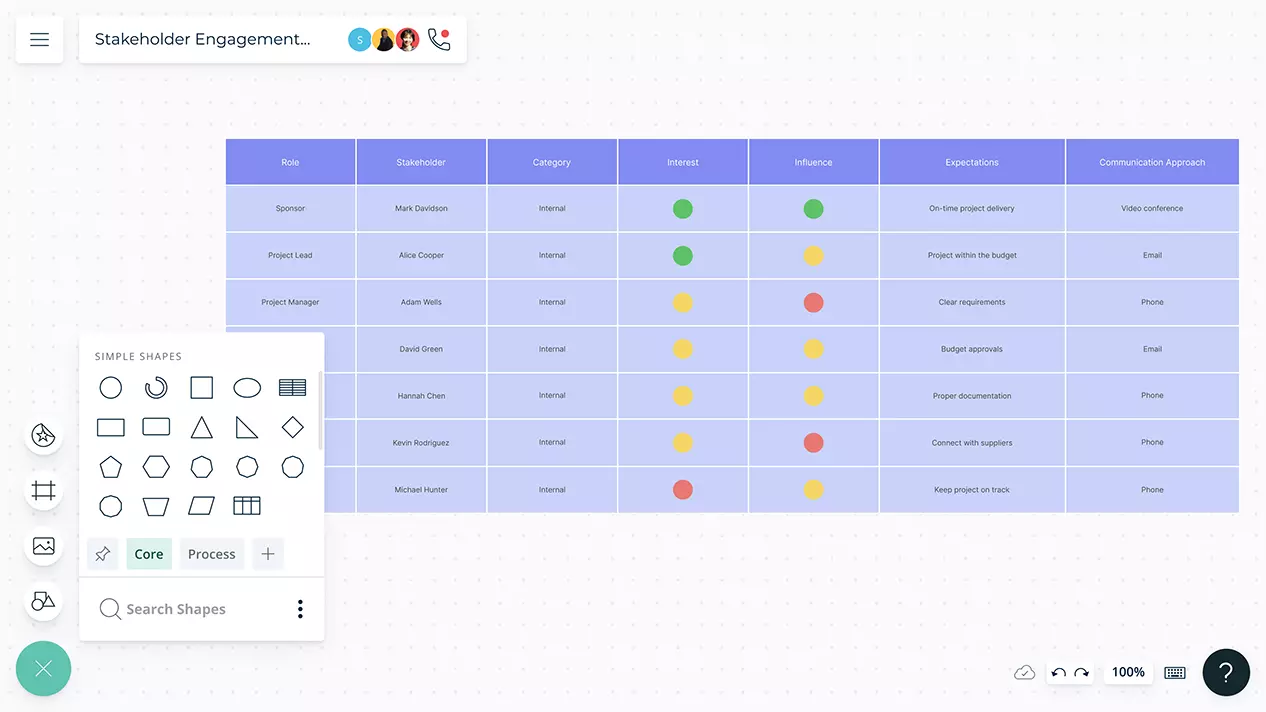
Easily develop a systematic approach to effectively communicate, collaborate, and interact with key stakeholders.
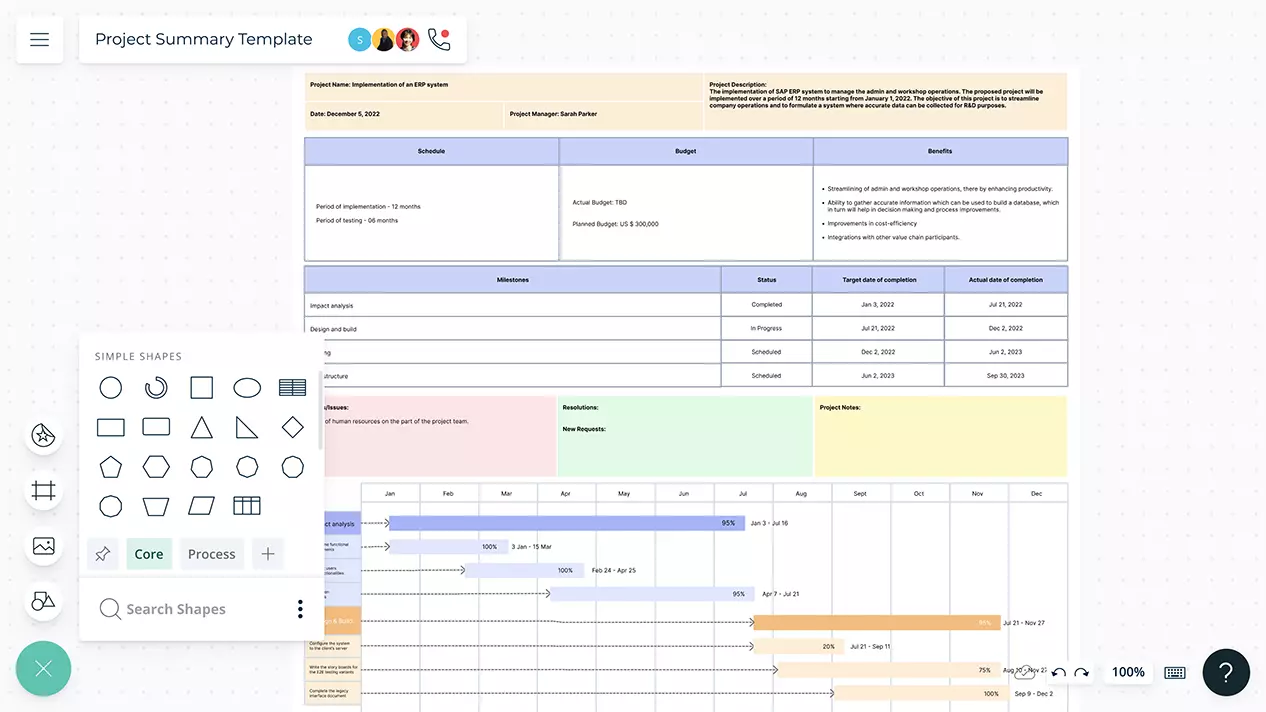
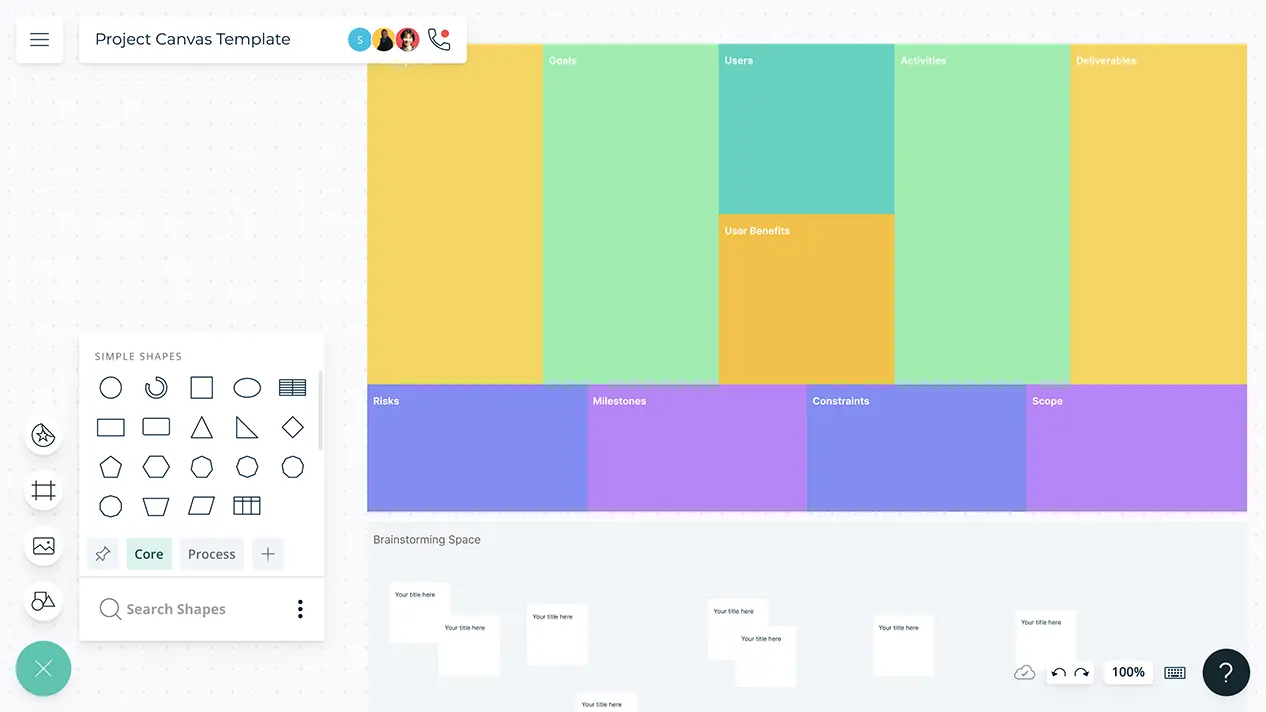
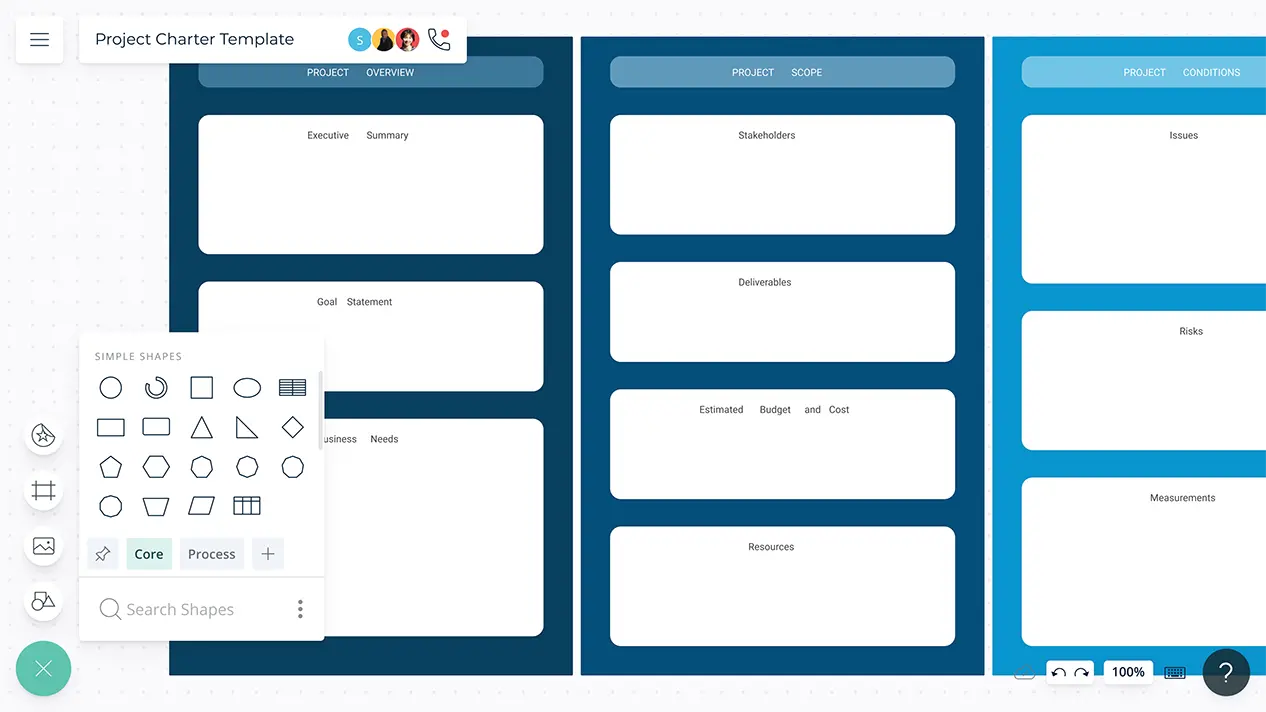
Create a concise, comprehensive overview of all the key details of your project.
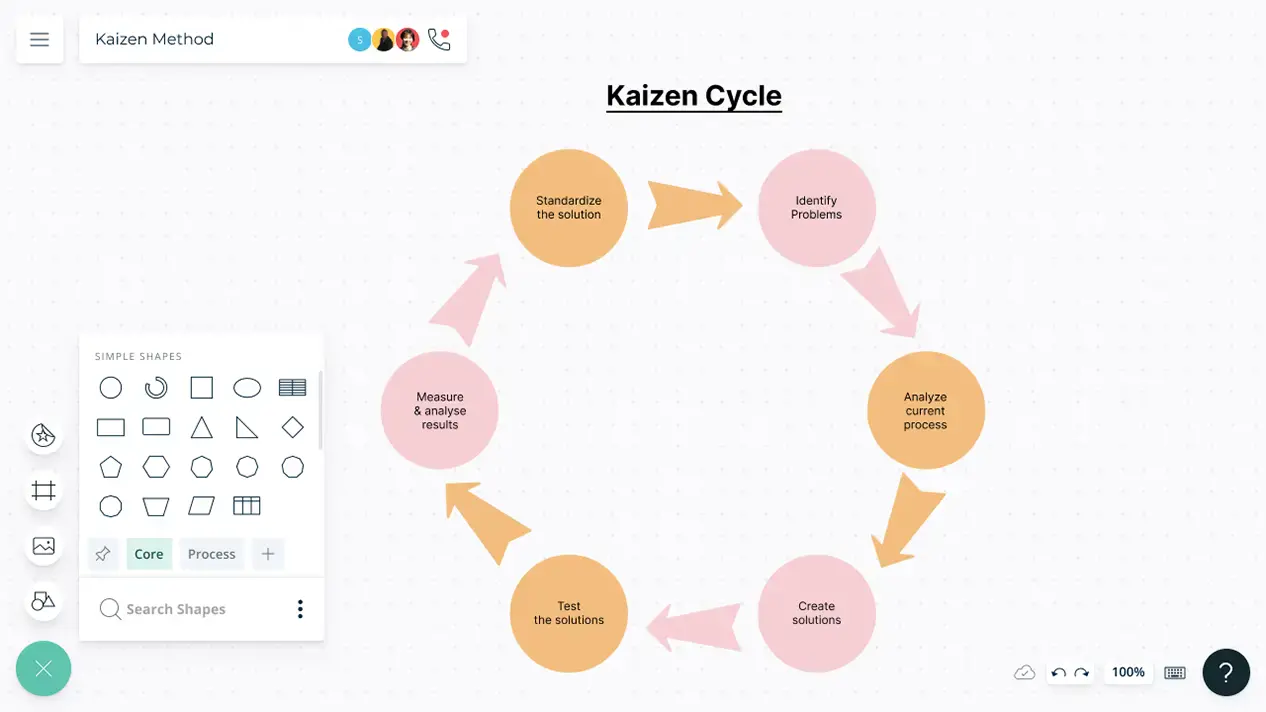
Learn how you can use the Kaizen method in Creately for strategic resource planning and process optimization and waste reduction to maximize productivity.
Map out effective processes for various aspects of your business and establish formalized procedures across your organization.
Build a comprehensive visual representation of all your project activities.
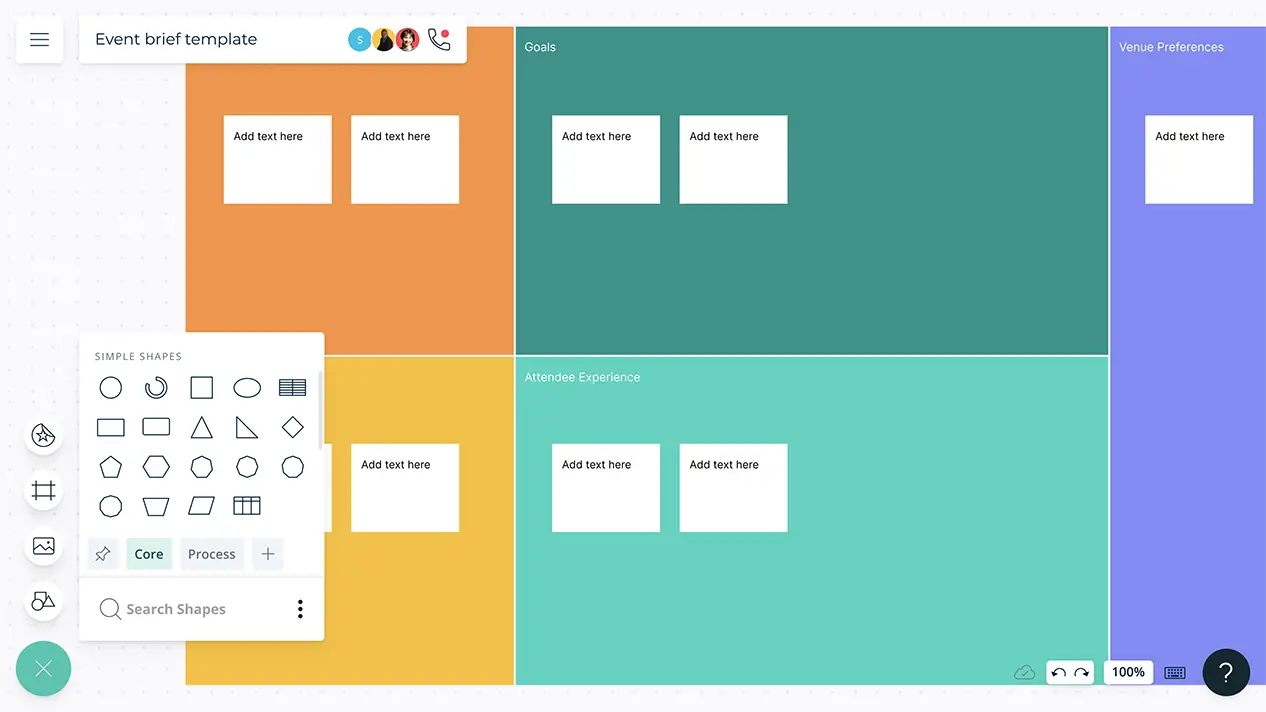
Organize and document critical information you need to plan, coordinate, and execute successful events.
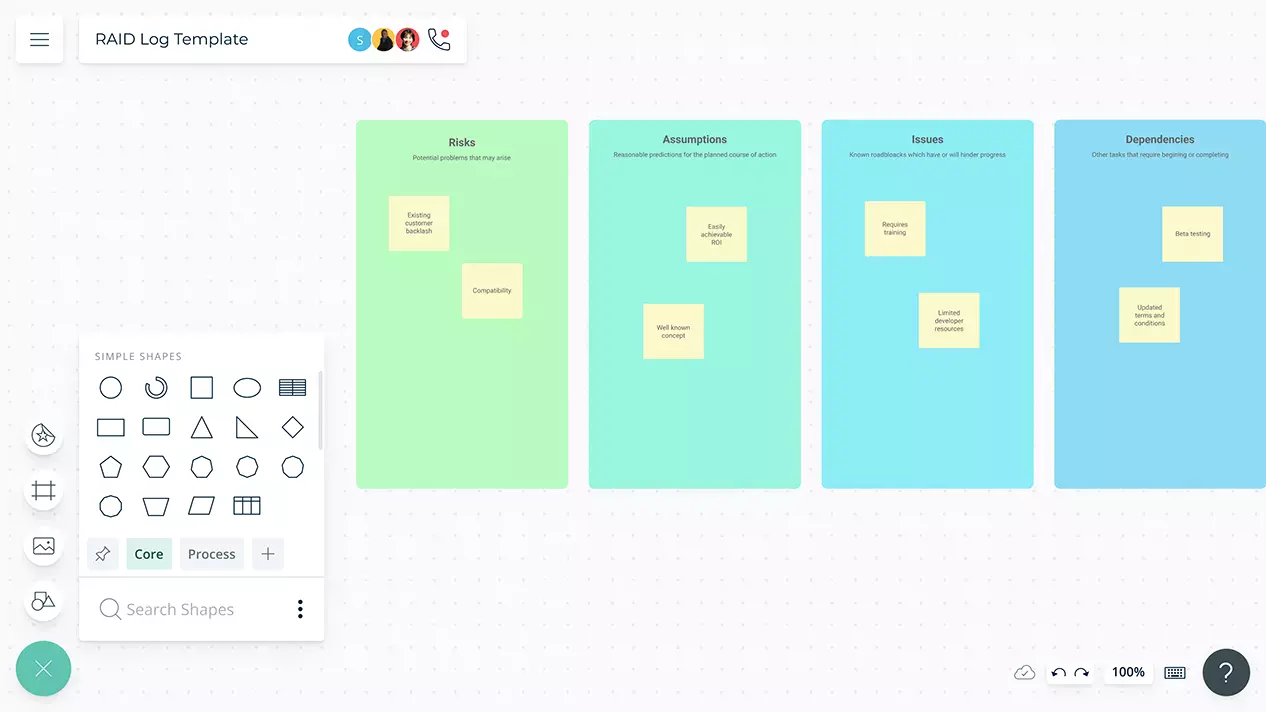
Identify risks, assumptions, issues and dependencies in your project and better manage constraints.
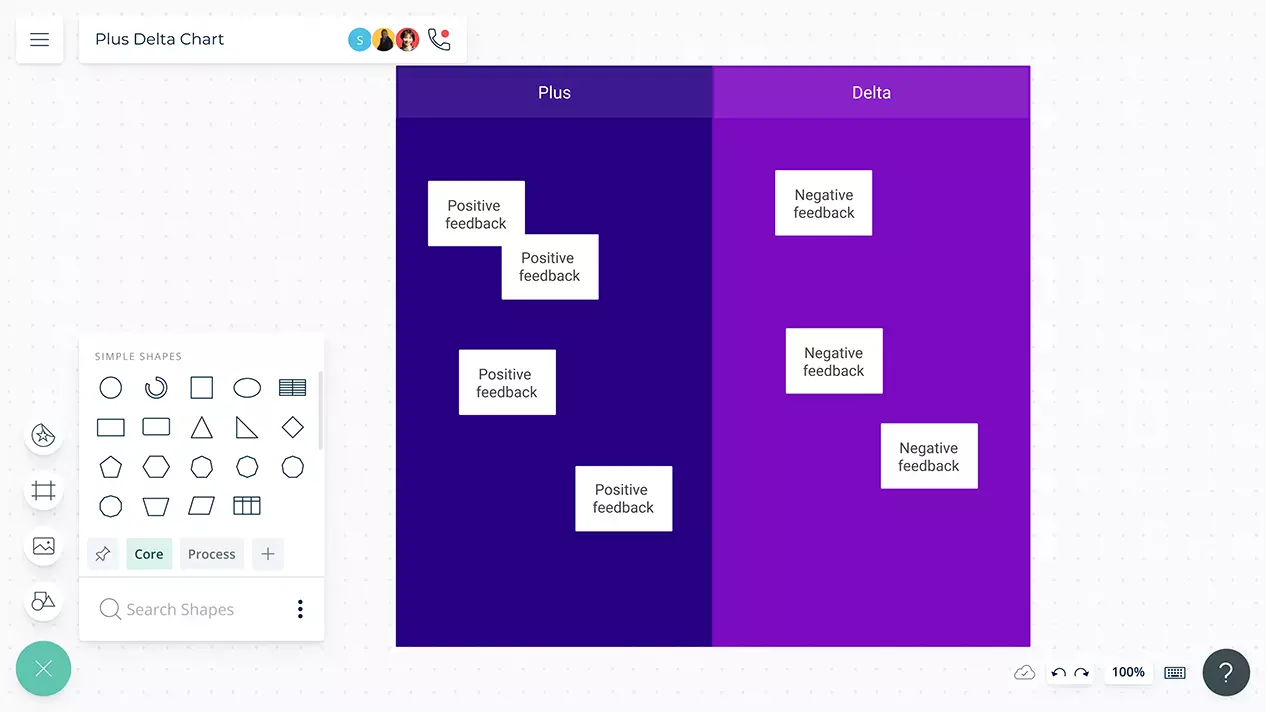
Enhance constructive criticism while continuously improving meetings and activities with your teams to boost organizational productivity.
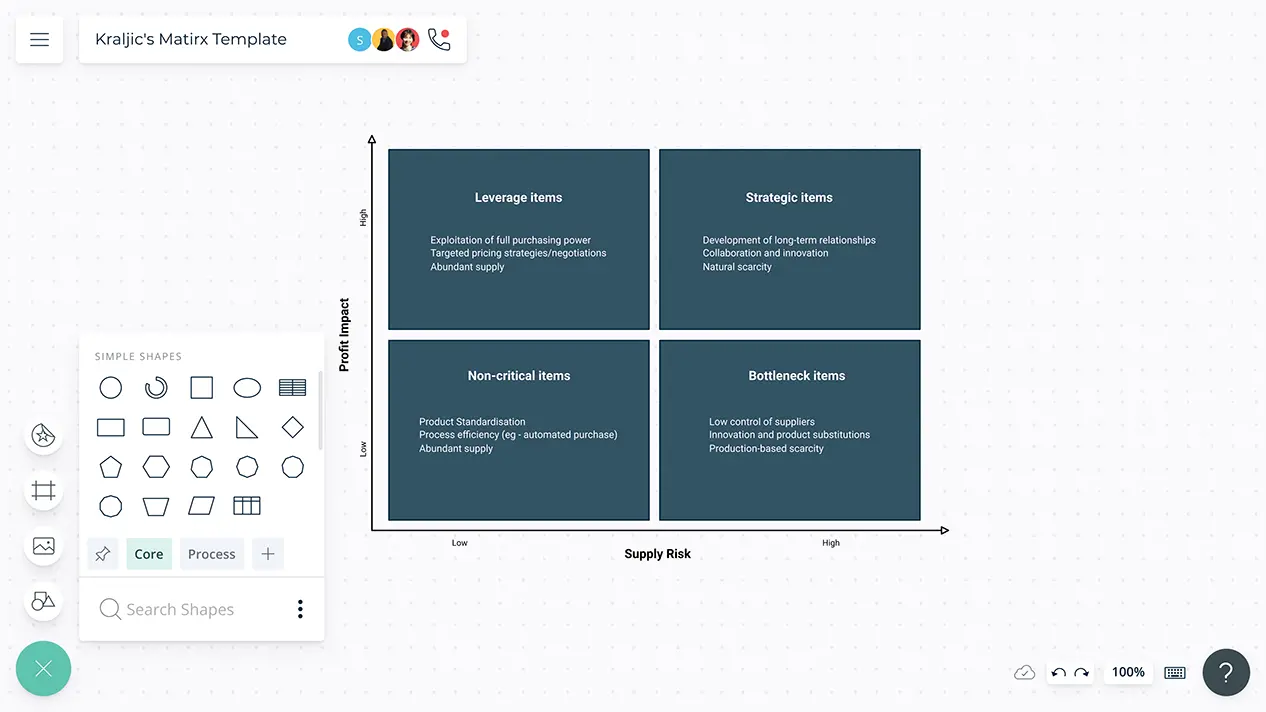
Use this visual framework to segment your vendor base and manage supplier relationships based on risk and profitability.
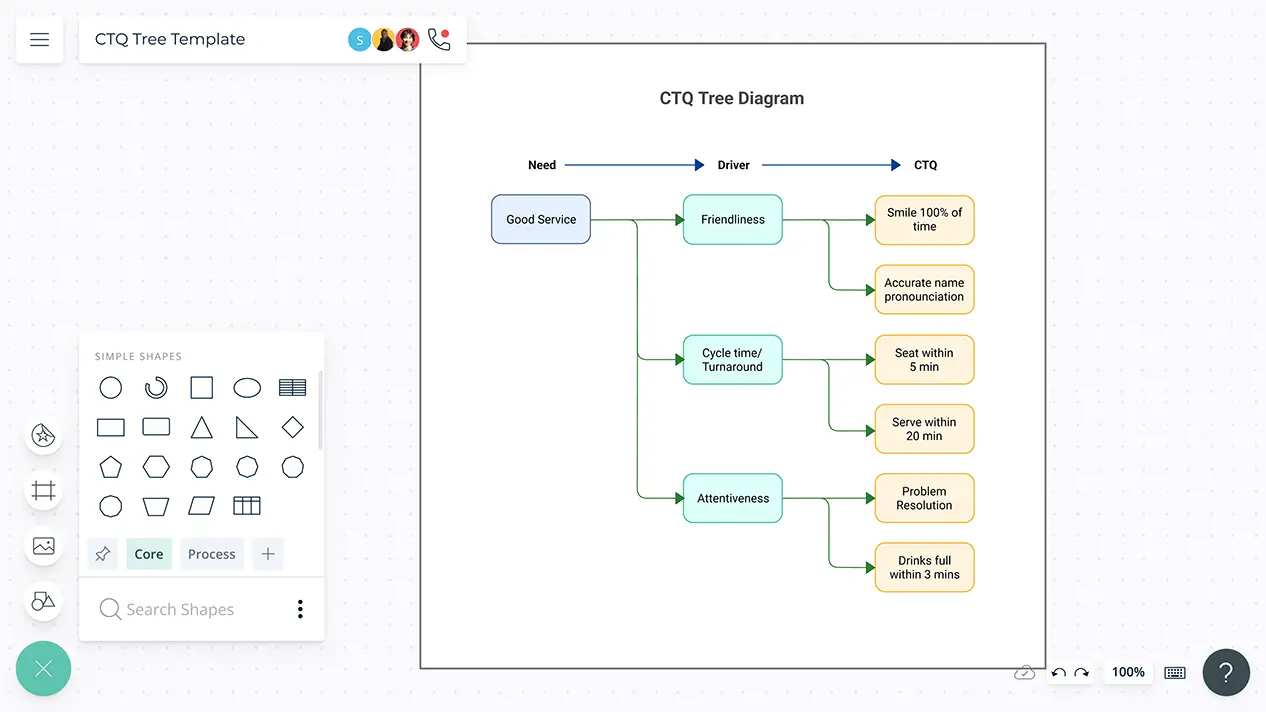
The Critical to Quality Tree is the most effective way to understand the critical needs of your customers and determine key drivers of quality in order to build better products.
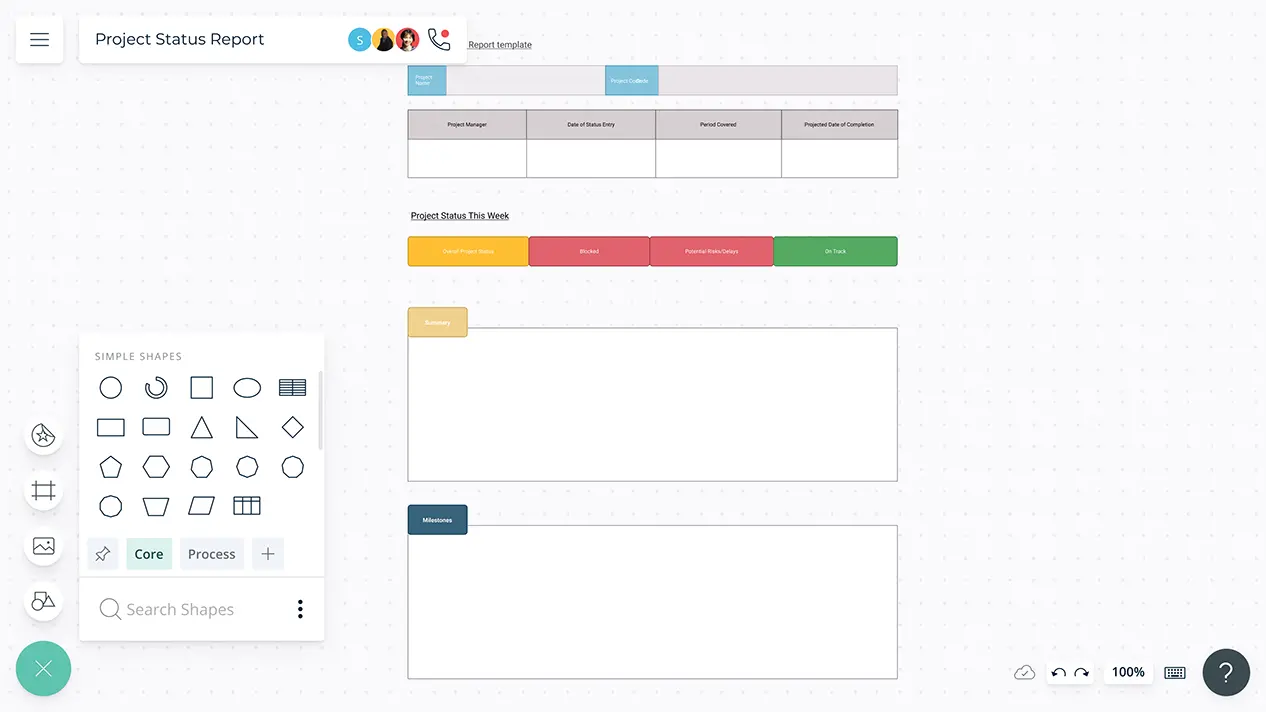
Keep your stakeholders aligned and in the loop during your project progress with effective project status reports.
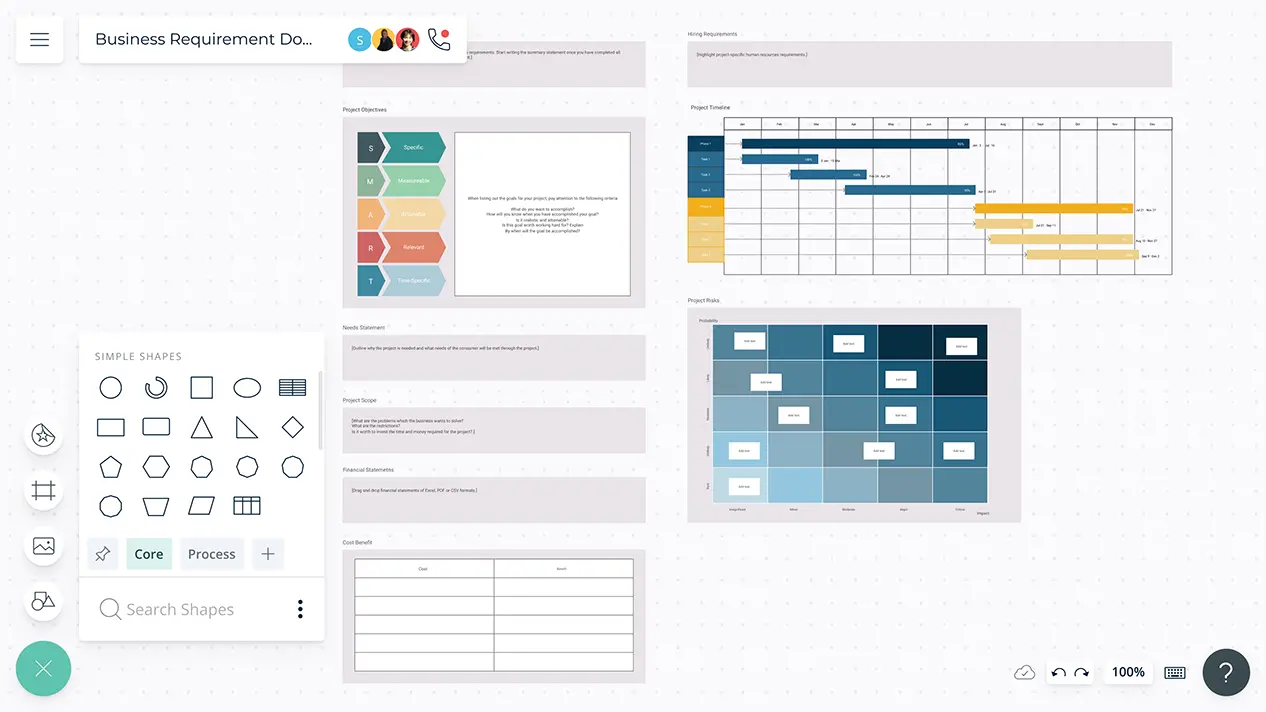
Effectively document and share intricate details of your projects and ensure that all stakeholders are on the same page.
Visualize project roles, responsibilities, and employee relationships with editable online templates.
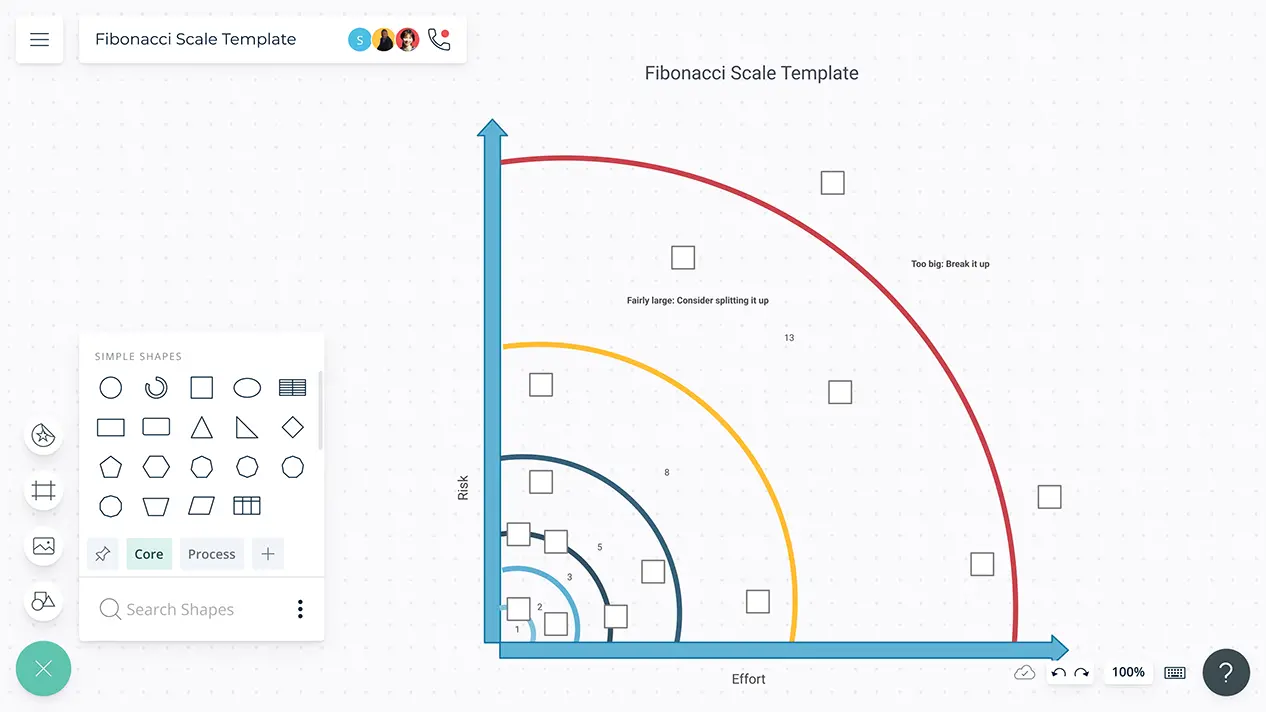
Visual tools to score tasks based on effort. Prioritize work and better manage builds.
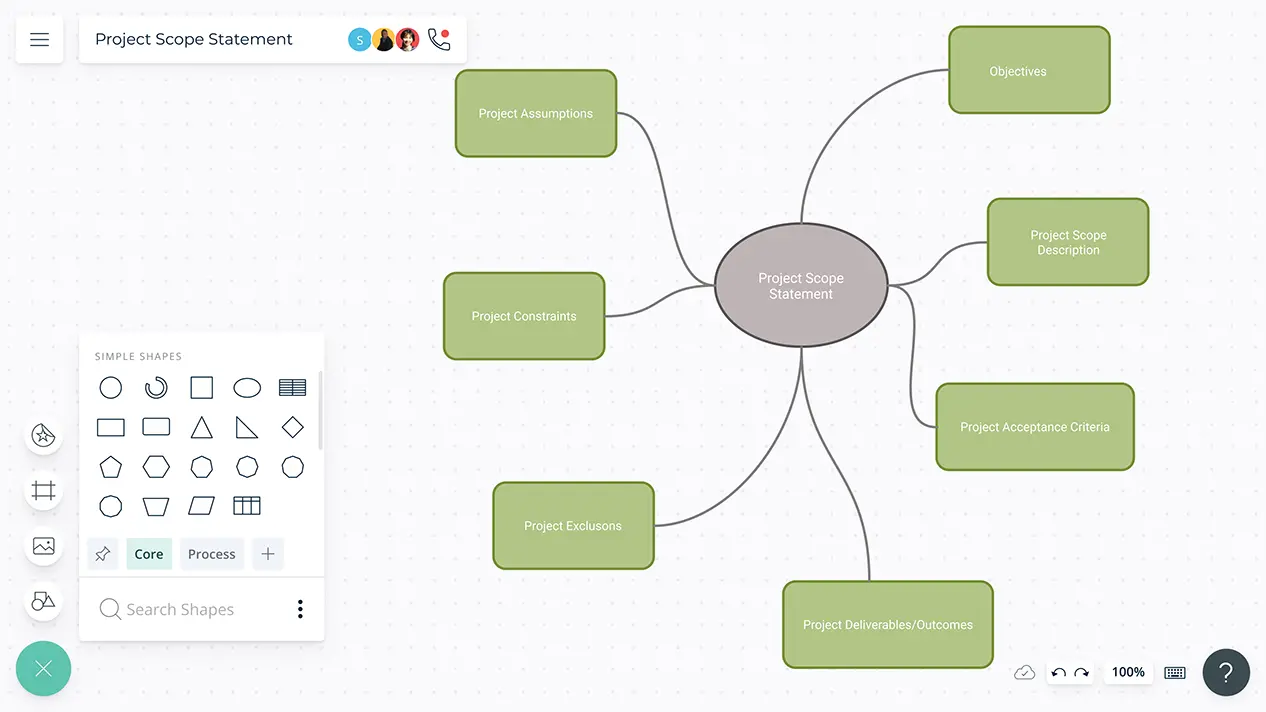
Custom-built templates for project scope statements, project charters, schedules, timelines, and more to help you brainstorm, plan, execute, and analyze your projects.
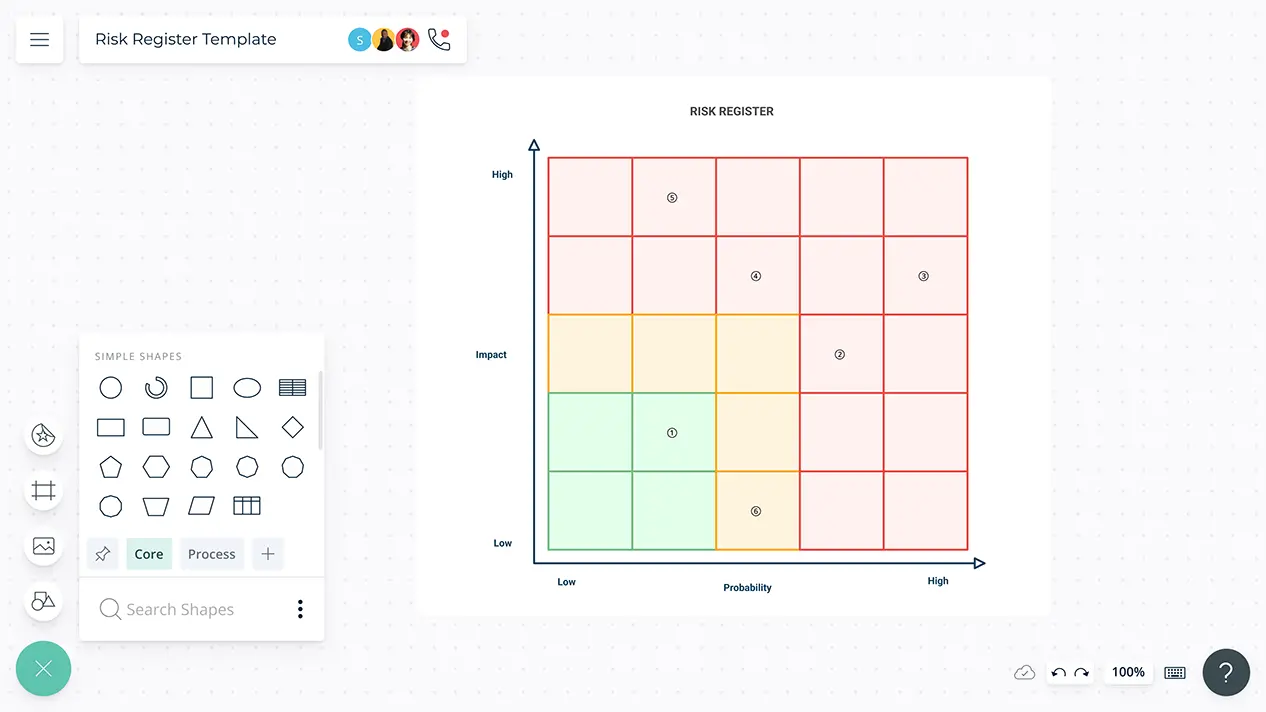
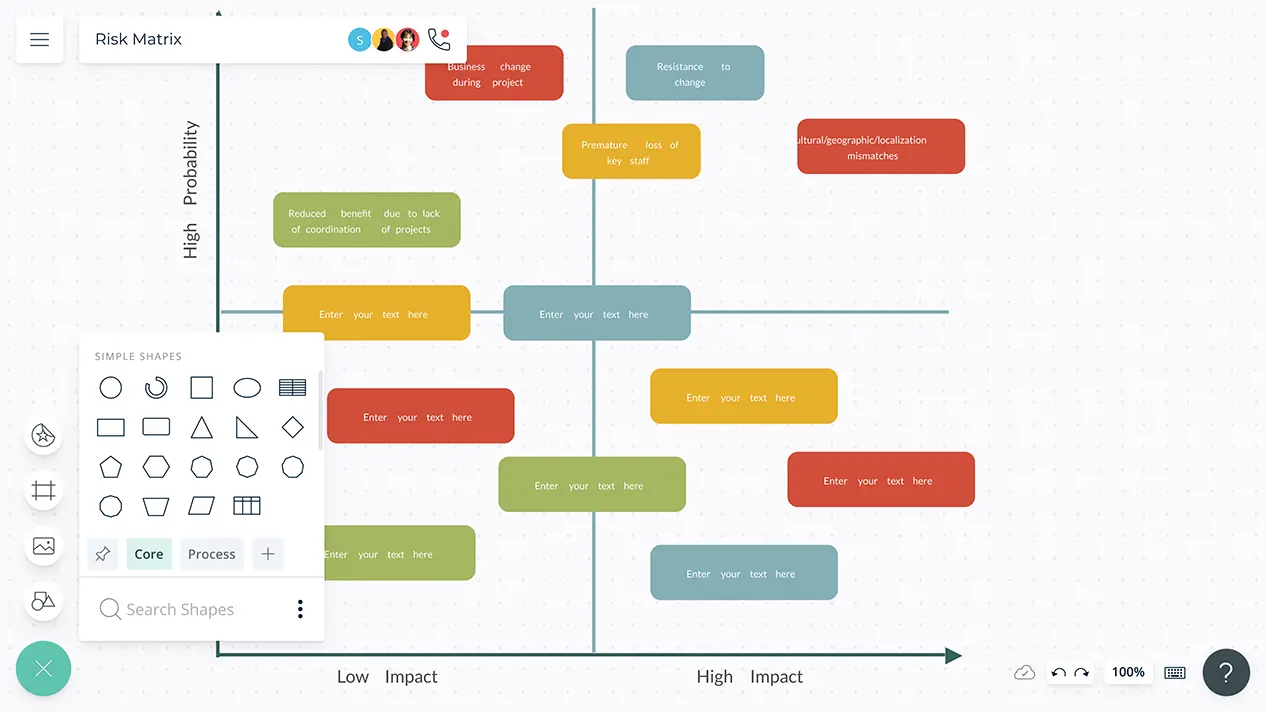
Identify, assess, and monitor risks affecting projects and plan mitigation measures.
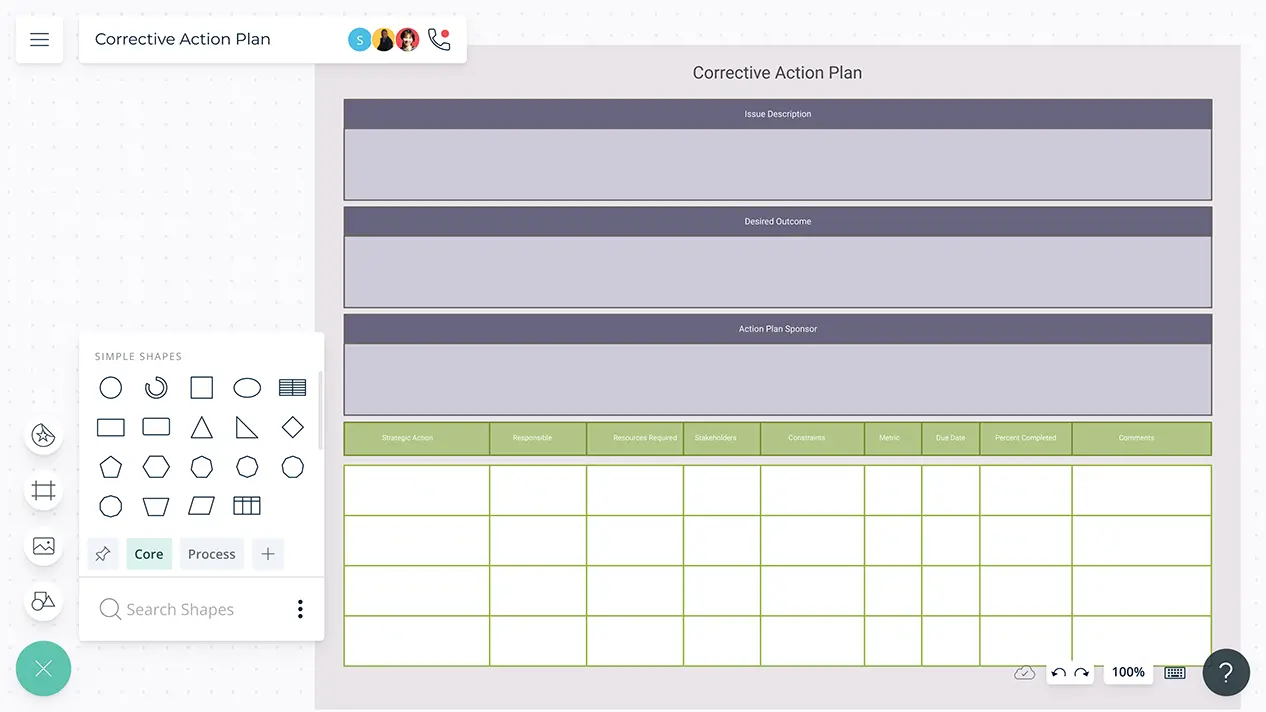
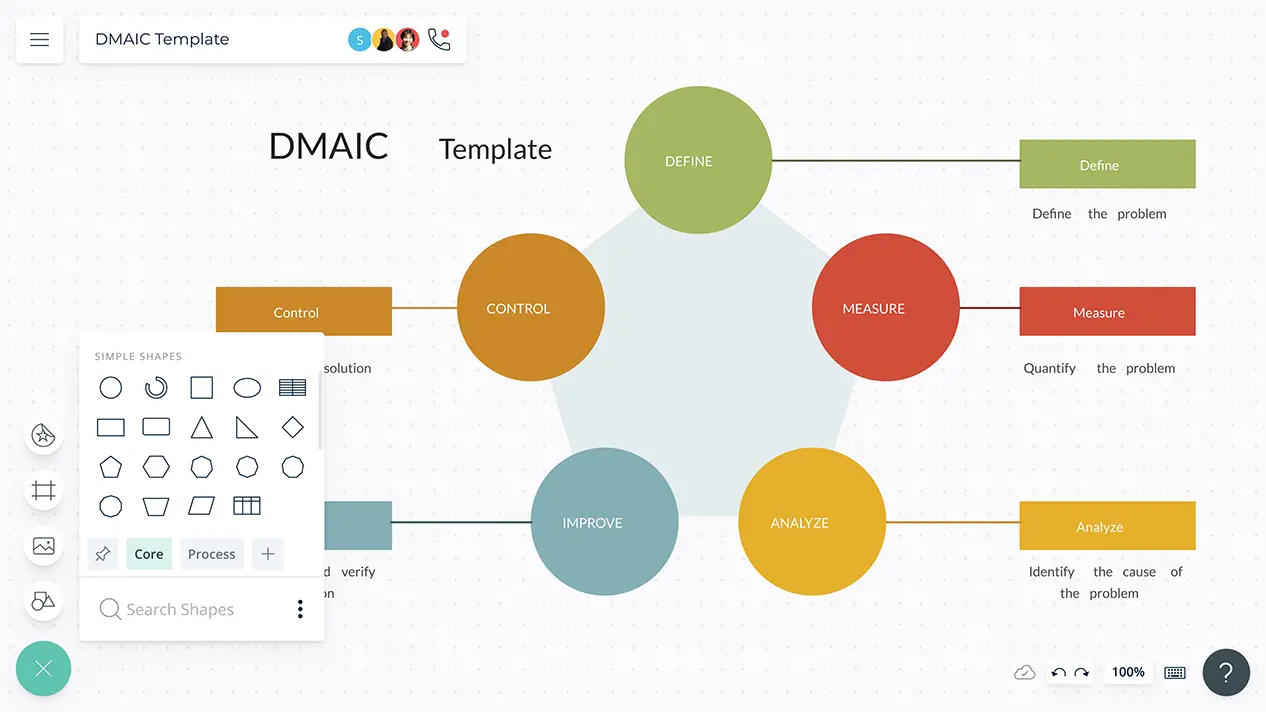
Improve inefficient processes in your organization by identifying root causes of problems and successfully mapping out corrective actions.
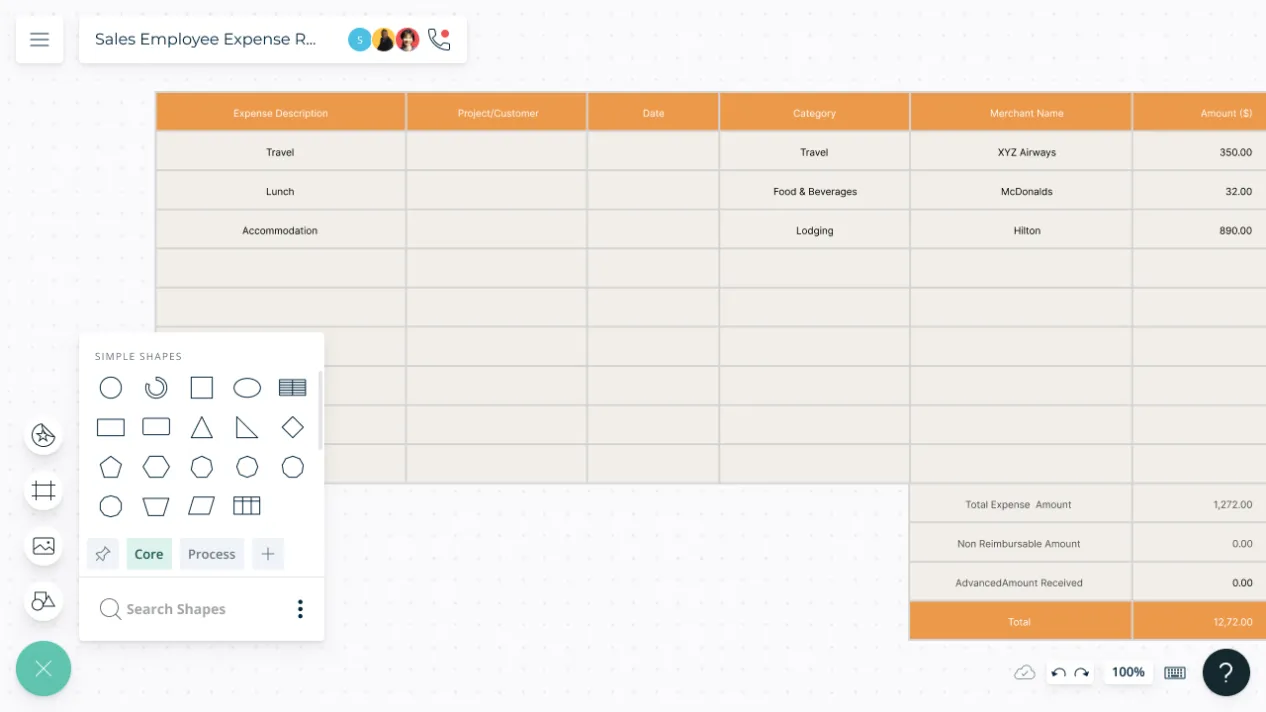
Use Creately to centralize all your expense reports for faster approvals and greater clarity.
The simplest and easiest way to organize and keep track of your daily tasks. Free up your time and mind to focus on the important objectives.
Visualize the risks associated with a project with greater transparency and accuracy.
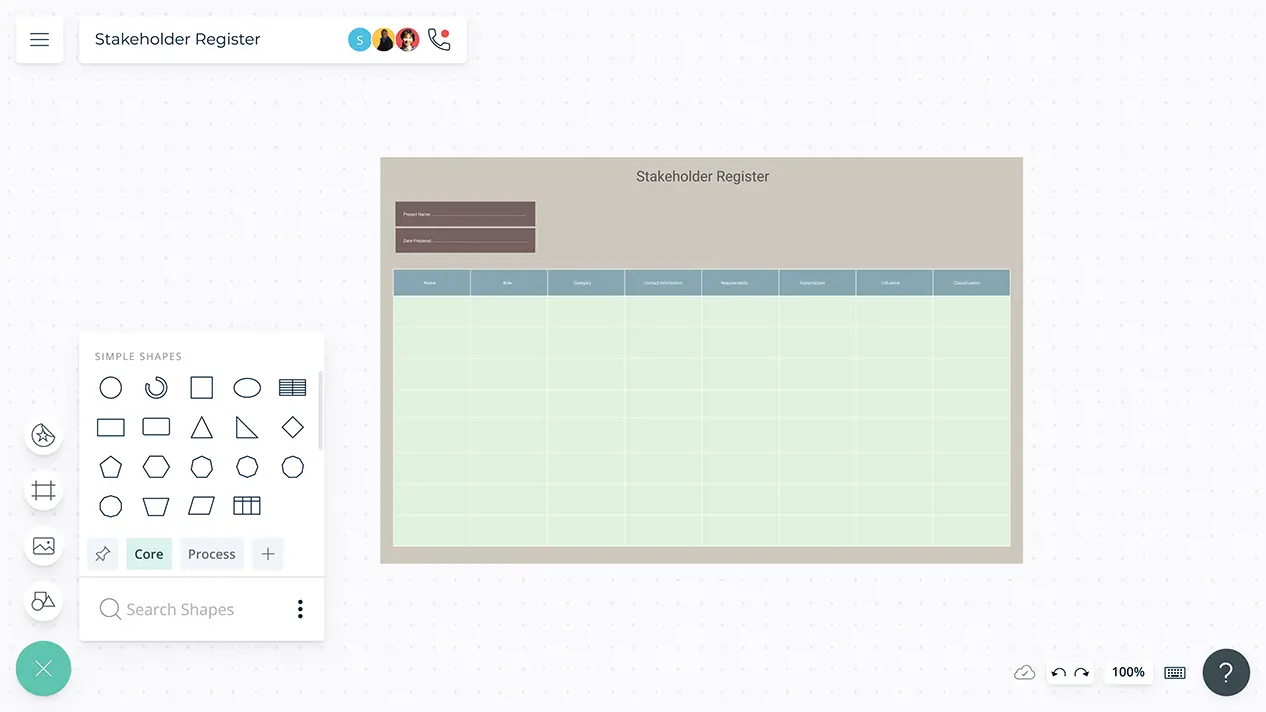
Identify and evaluate project stakeholders and their requirements for effective decision-making and communication.
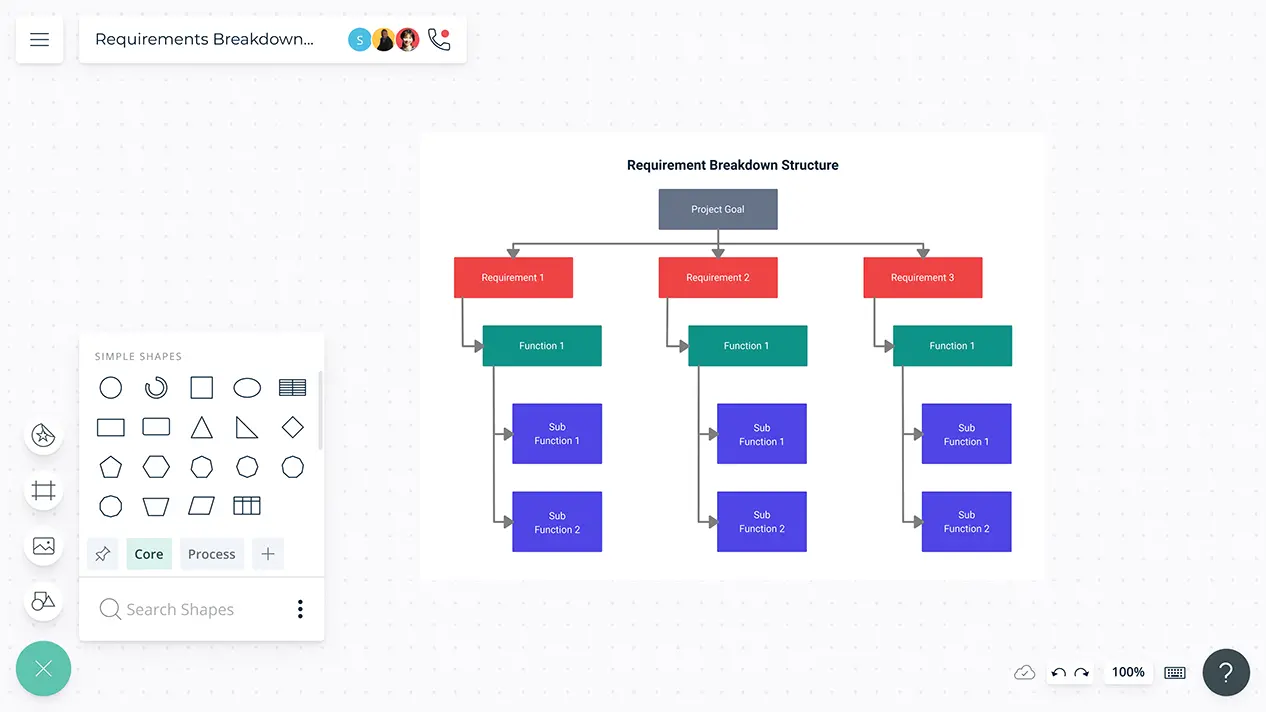
Visually identify all activities that must be completed to achieve a specific business goal.
Identify inefficiencies in your processes and make needed improvements to increase productivity.
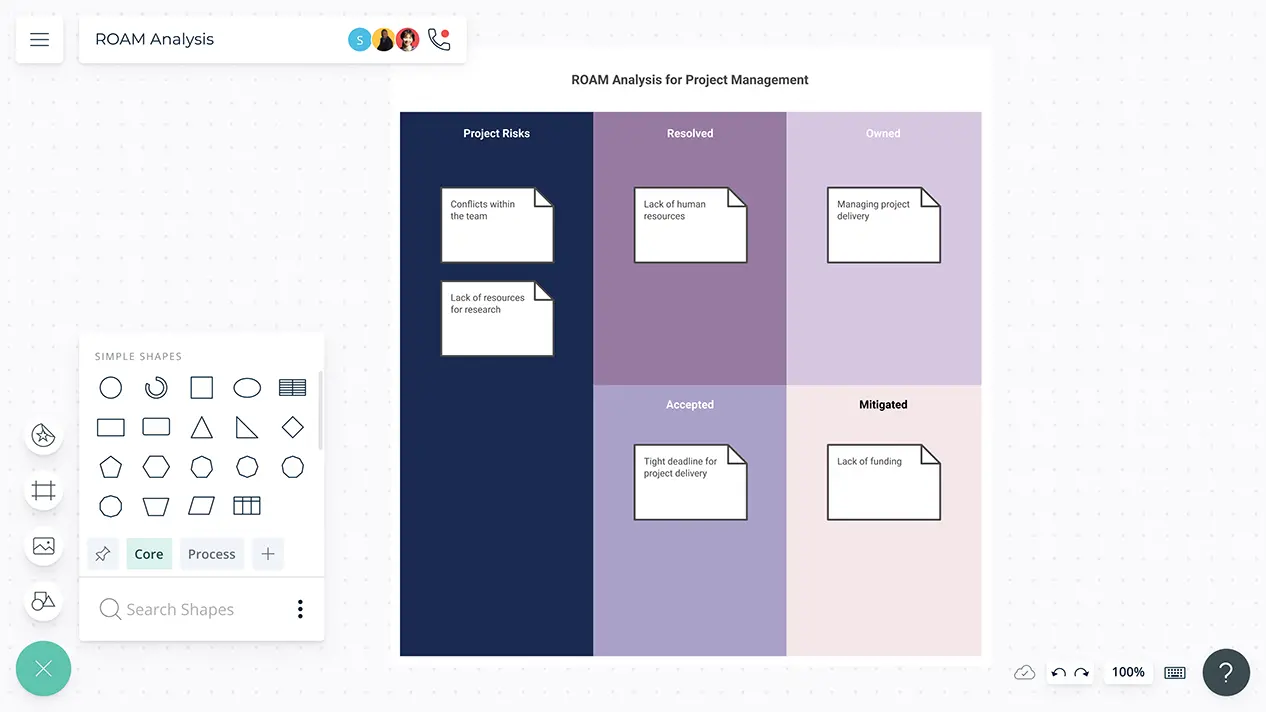
Visually identify the elements of risk associated with a project and prioritize steps needed to mitigate them.
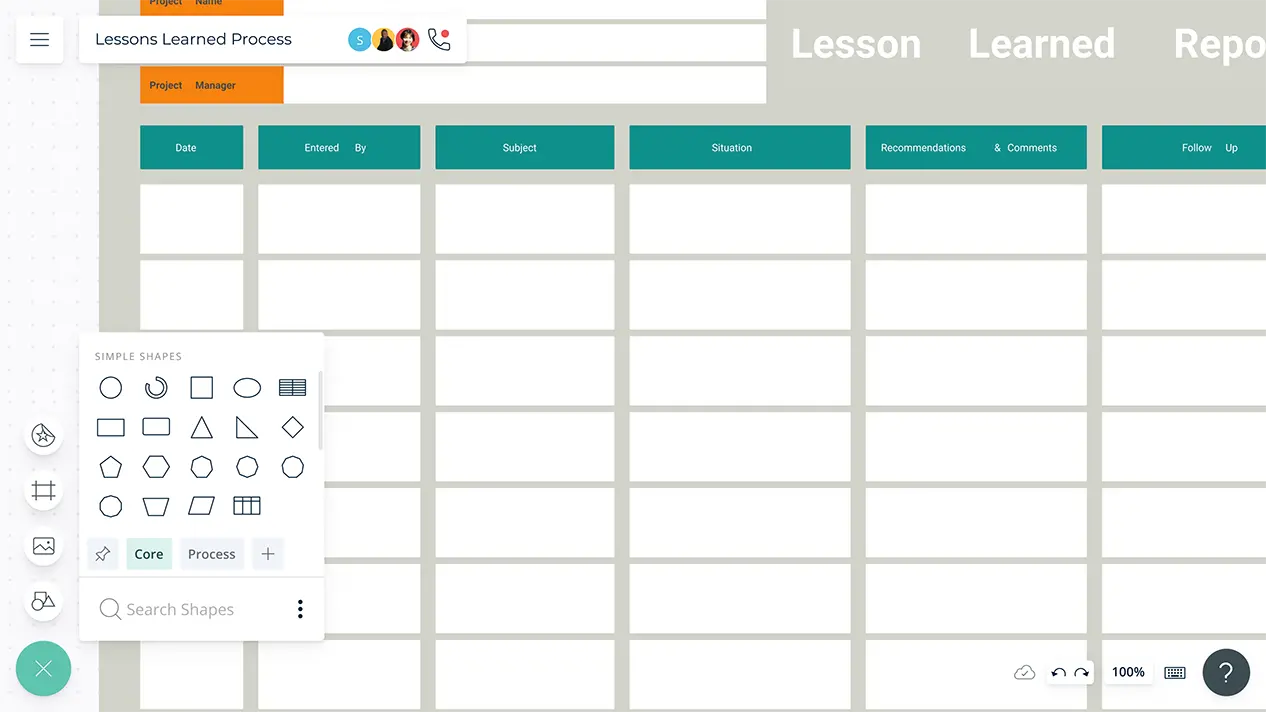
Create lesson learned reports in an infinite and interactive platform for any scale of projects. Our easy-to-use and collaborative application helps the project managers, peers easily onboard and use it for their day-to-day reporting and process management.
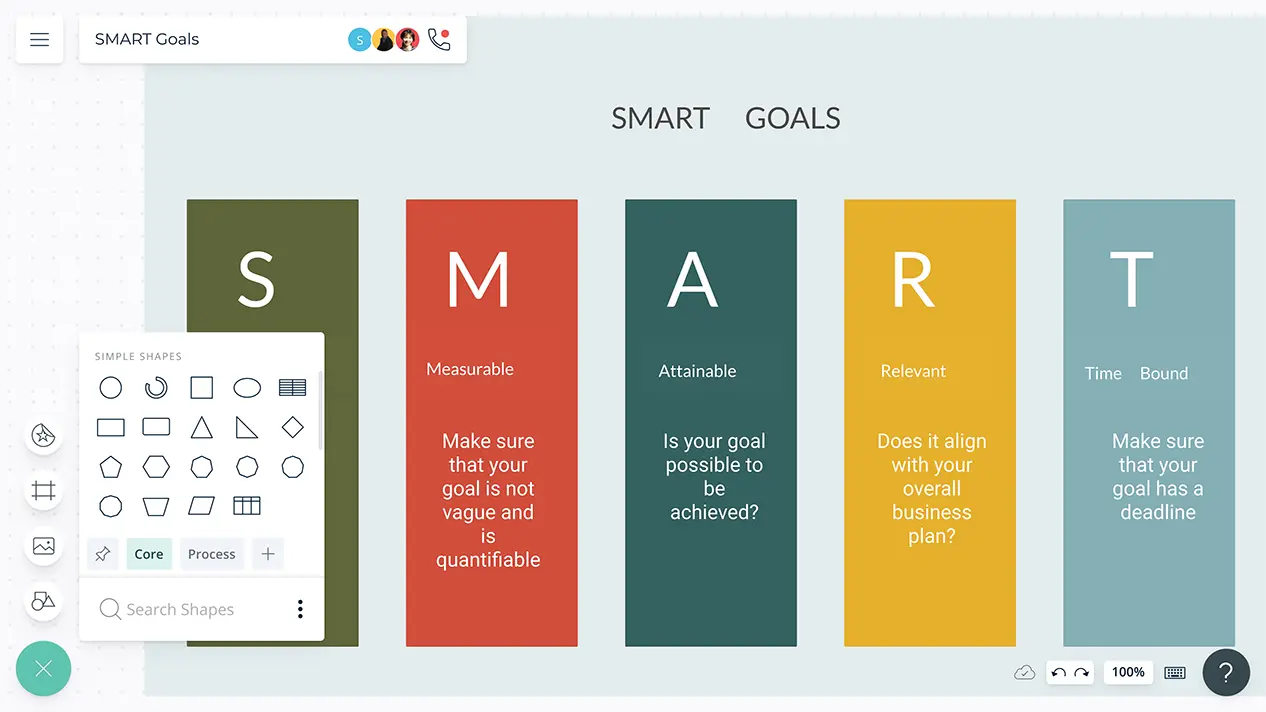
SMART goal template and worksheets to plan and improve the chances of succeeding in accomplishing organizational goals.
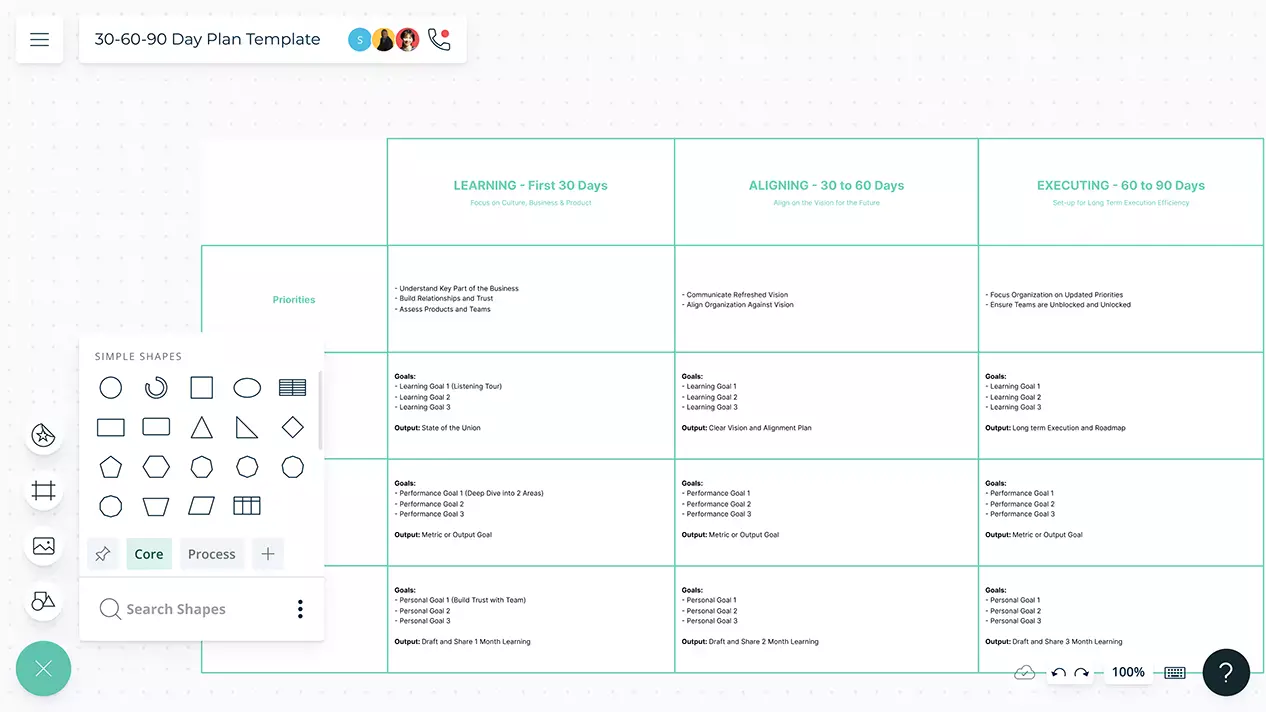
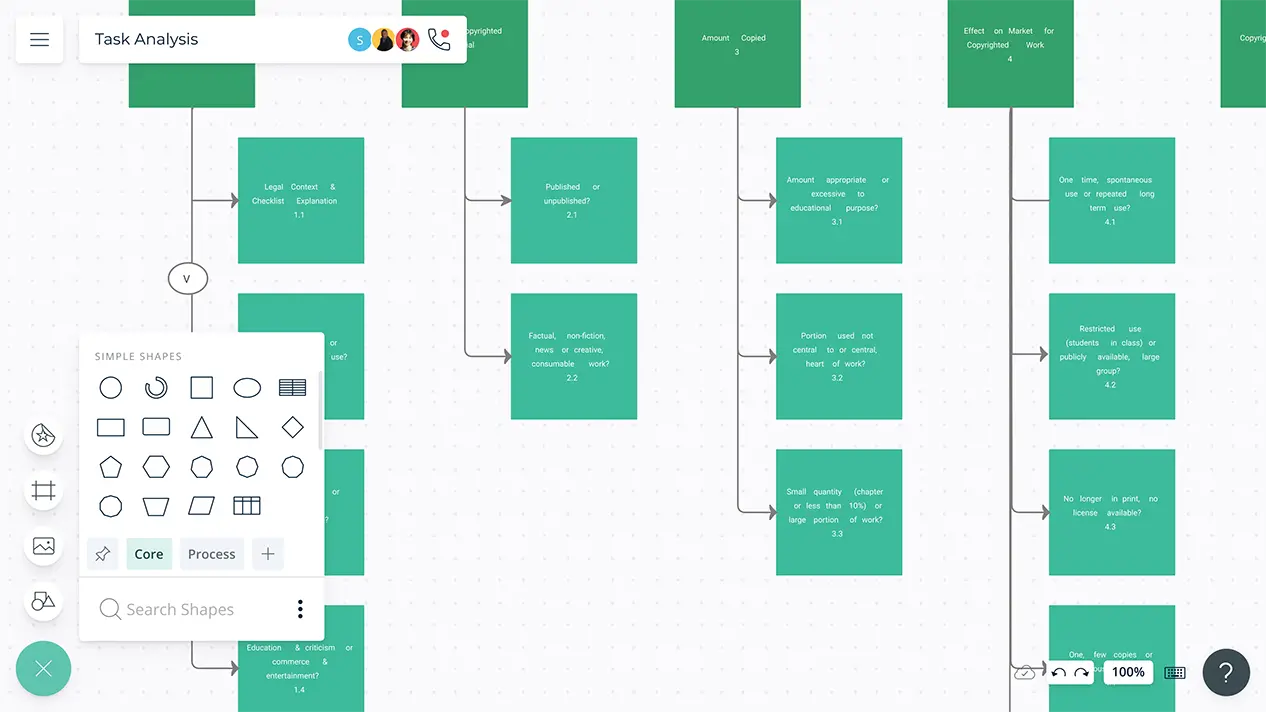
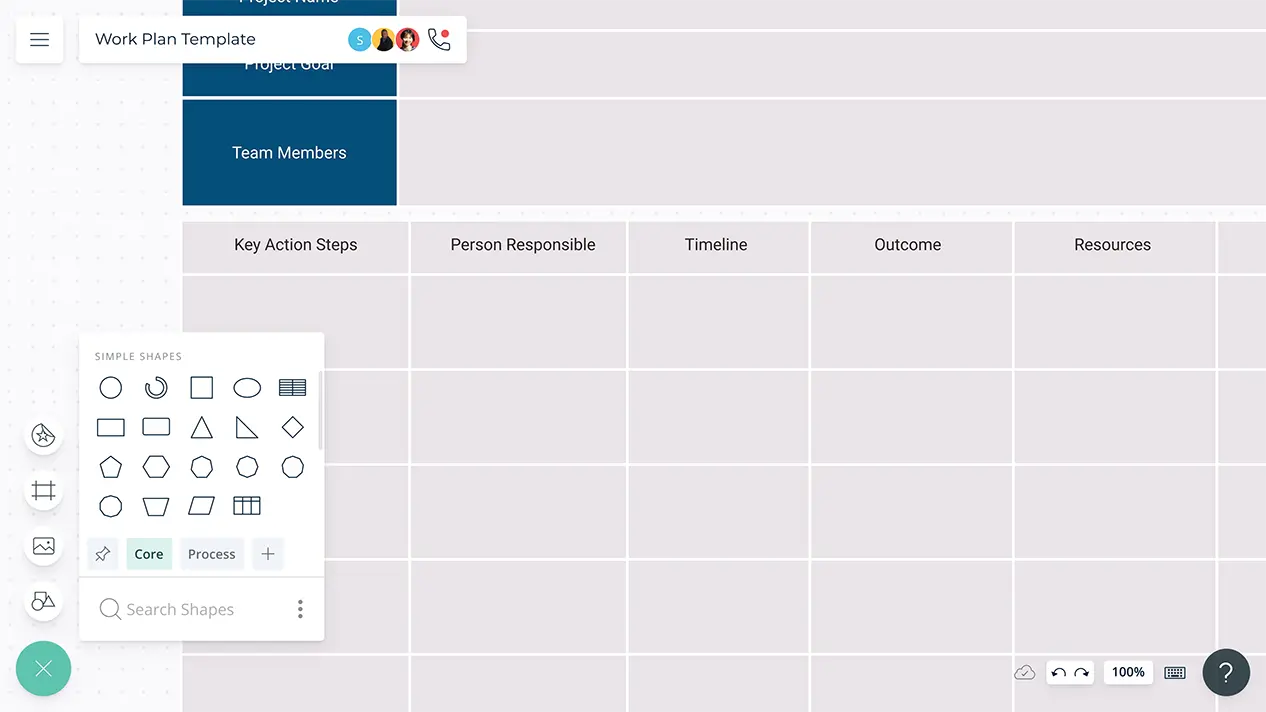
Bring all your tasks into a professionally-designed template on Creately and map the execution plan. Identify the tasks with priority and collaborate on analyzing ways to complete them.
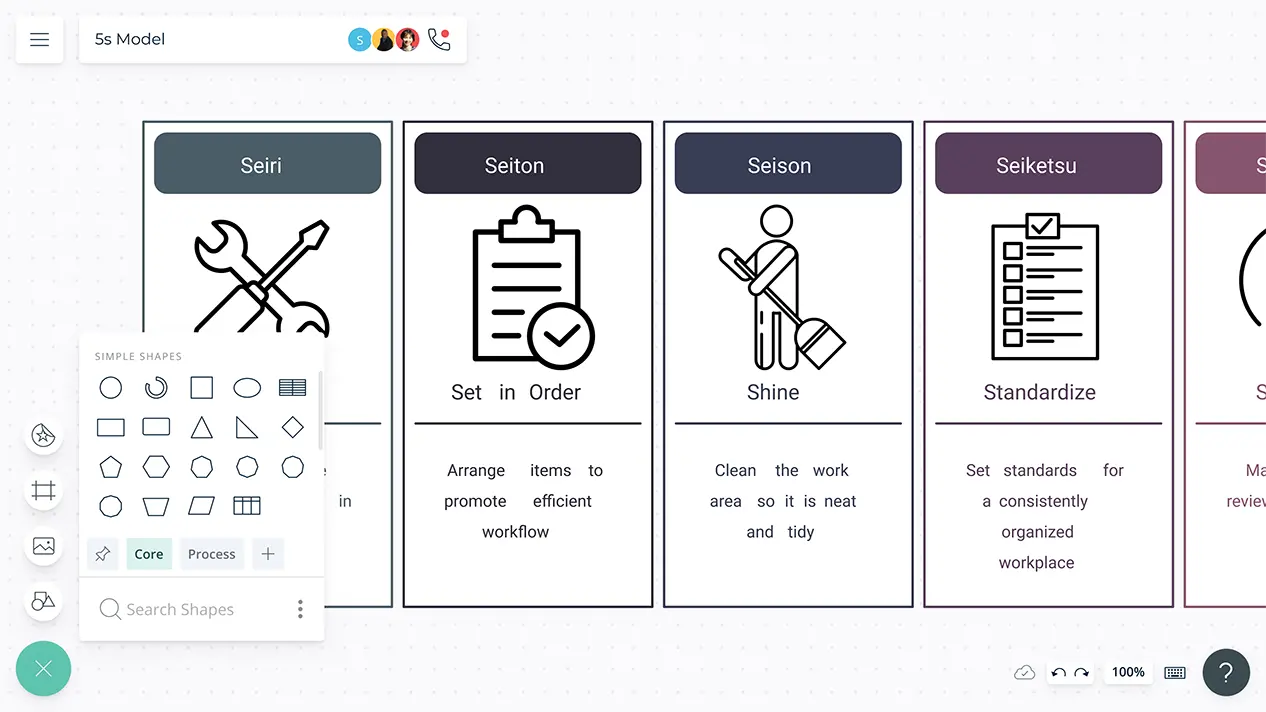
Originally from Japan, 5S stands for Sort, Straighten, Shine, Standardize, and Sustain. The 5S tool allows companies to organize and use space more effectively, efficiently, and safely.
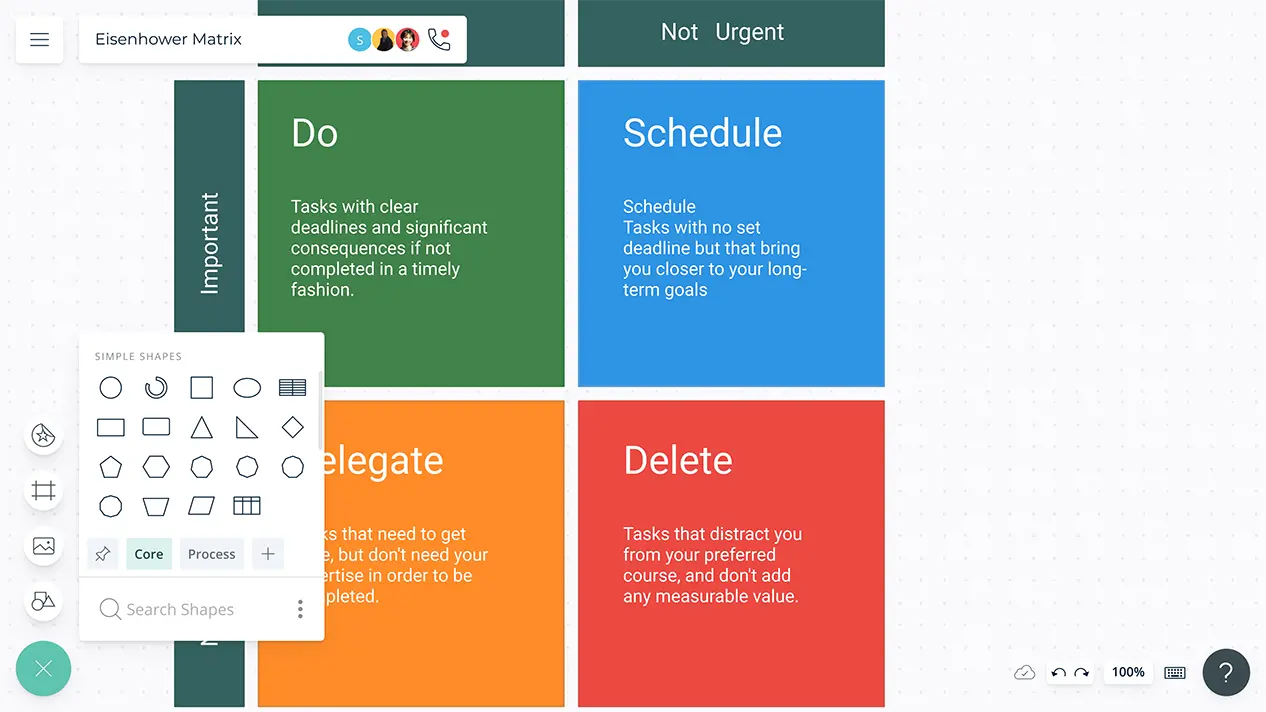
Manage your time effectively and plan ahead by using visual templates to prioritize tasks based on urgency and importance. Manage your workload efficiently.
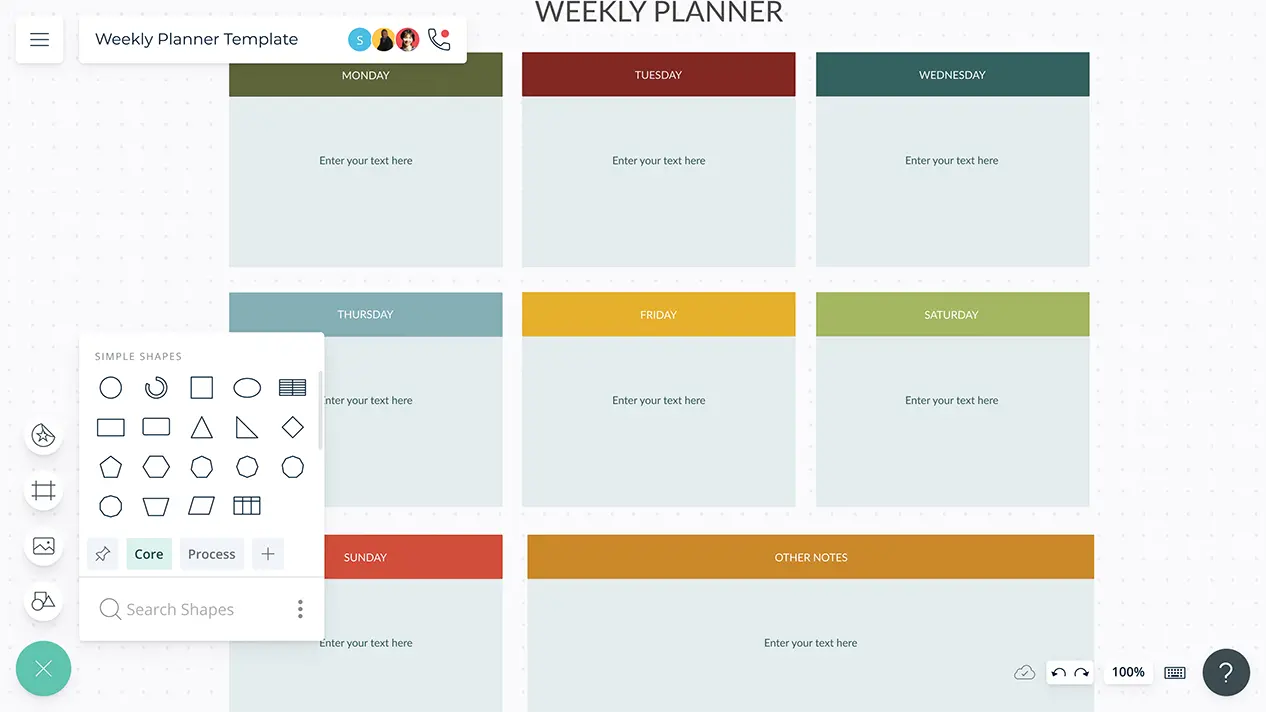
Visual templates to plan your goals and schedule your week. Use Creately’s customizable shapes and shape data capabilities to organize and arrange tasks and prioritize in a single place using frames.
Visualize, organize, and manage your project goals, teams, tasks, and workflows in an easy-to-use visual platform designed for true team collaboration.
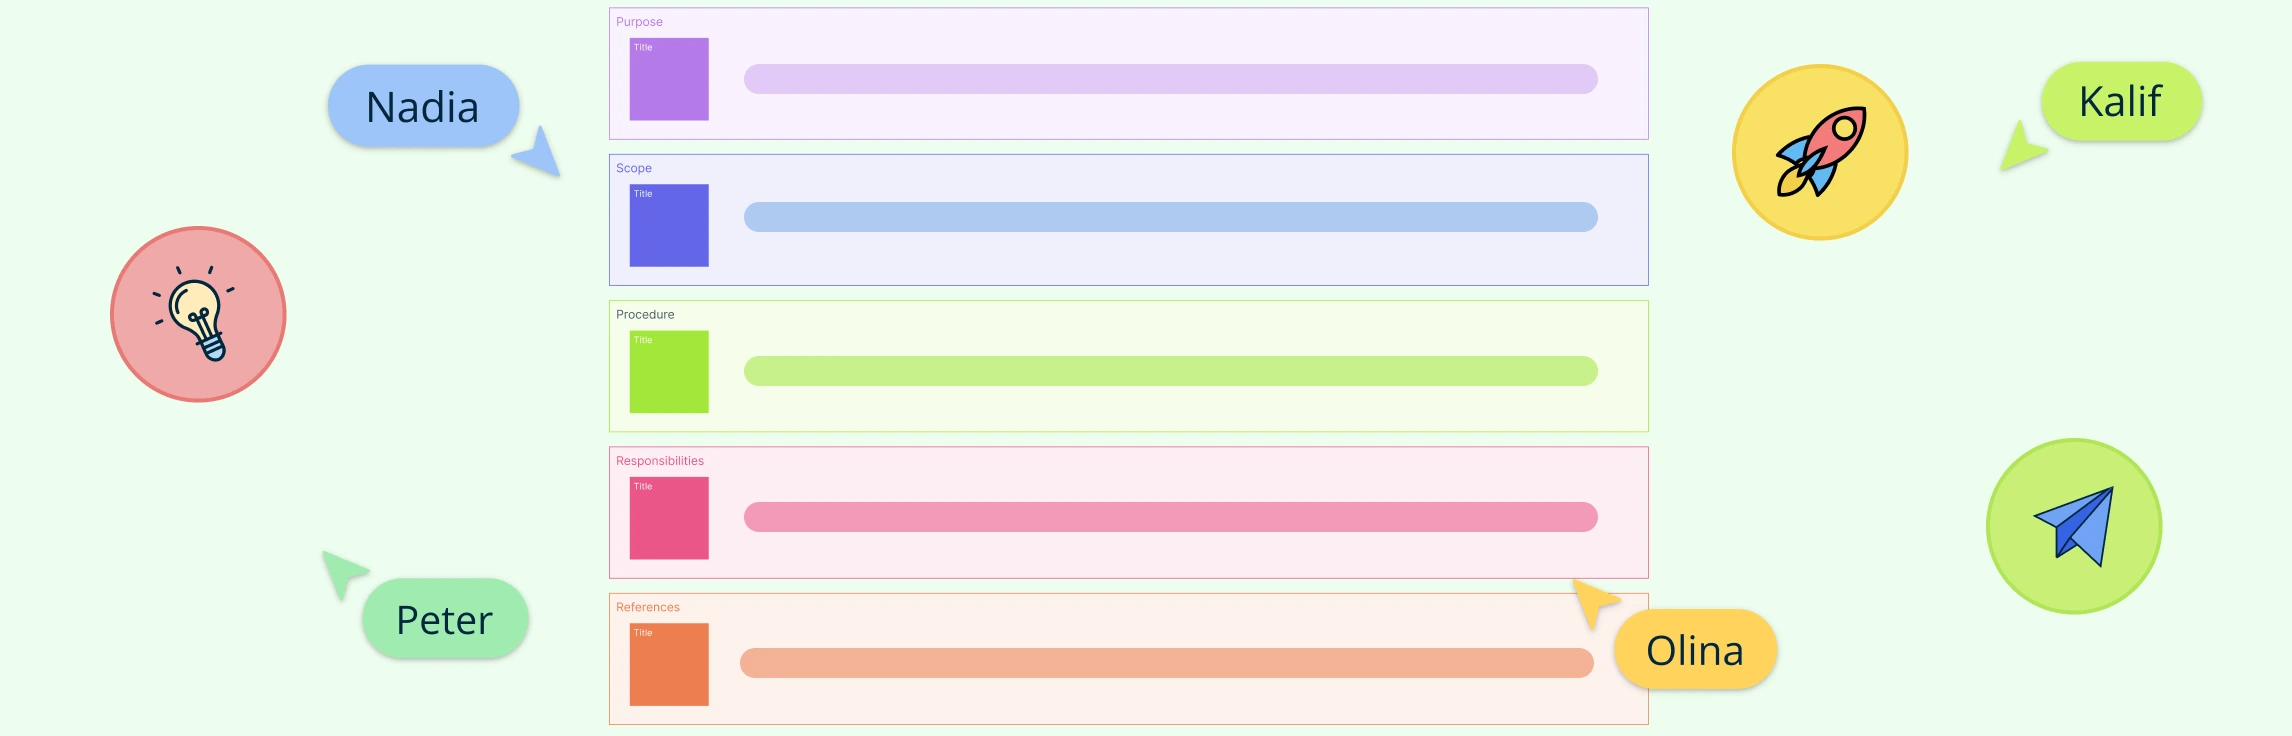
Clarify the goals, scope and responsibilities of your project and create brilliant elevator pitches to convince stakeholders or investors.
A connected visual canvas to plan team efforts, design action plans, keep track of your tasks and achieve goals.