T Chart Maker
Use T Charts to Organize Information for Better Evaluation
Compare and contrast opposing views, including facts vs. opinions, advantages vs. disadvantages or strengths vs. weaknesses, with our free intuitive T chart creator.
- Customizable templates for T Chart to get a quick start
- Real-time collaboration to make T charts online with your team
- Multiple export options for printing, sharing, & presentations



 Diagramming Visual Collaboration Org Chart


Make T Charts Online with Intuitive Tools
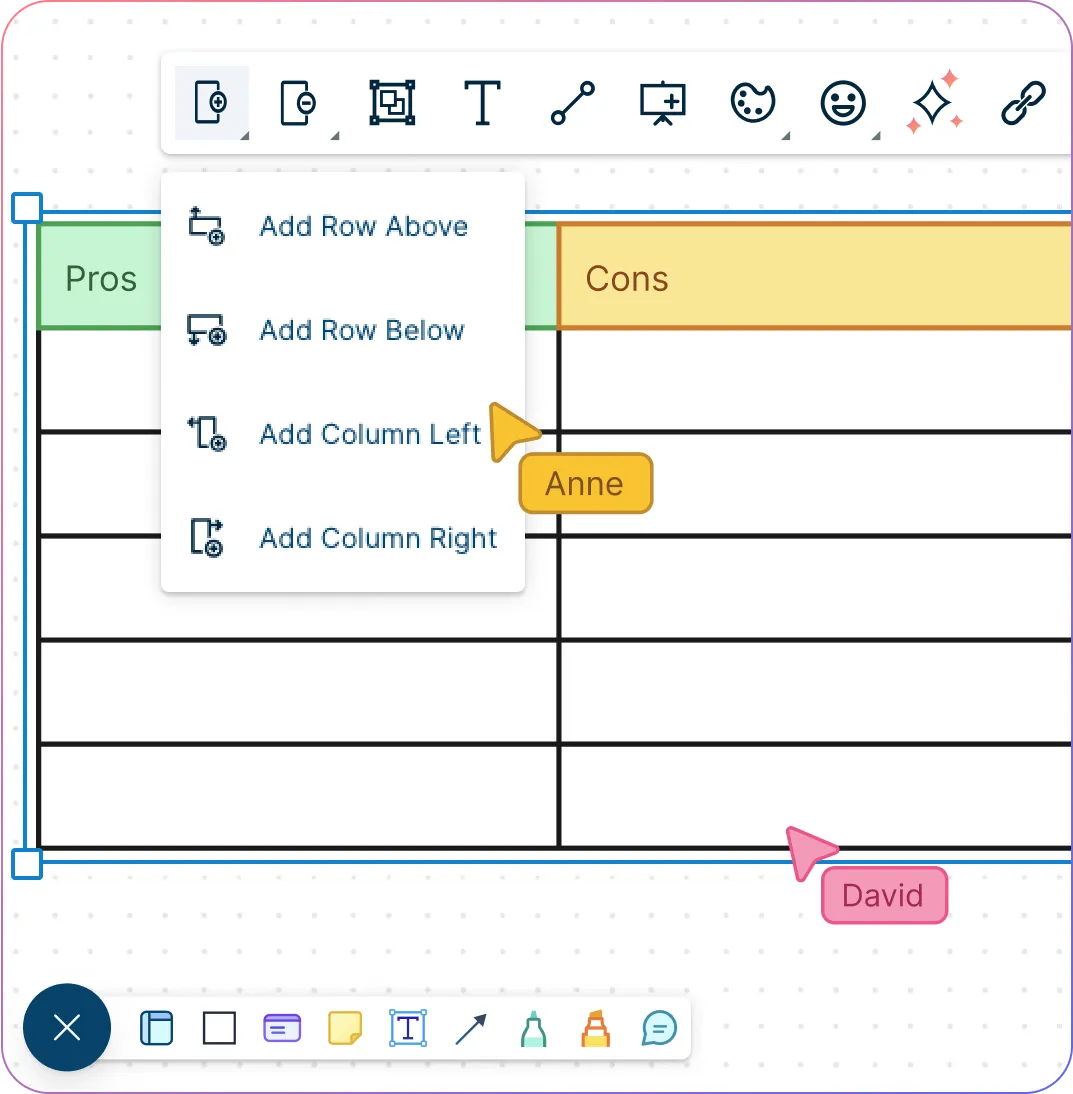
Intuitive drag-drop tools to add & arrange ideas fast in respective columns.
Easy-to-use quick toolbar to instantly add or delete rows, columns, and cells.
Customize the layout & design of the T Chart with custom colors & formatting options.
Add annotations to specific points in the T Chart with freehand drawing.
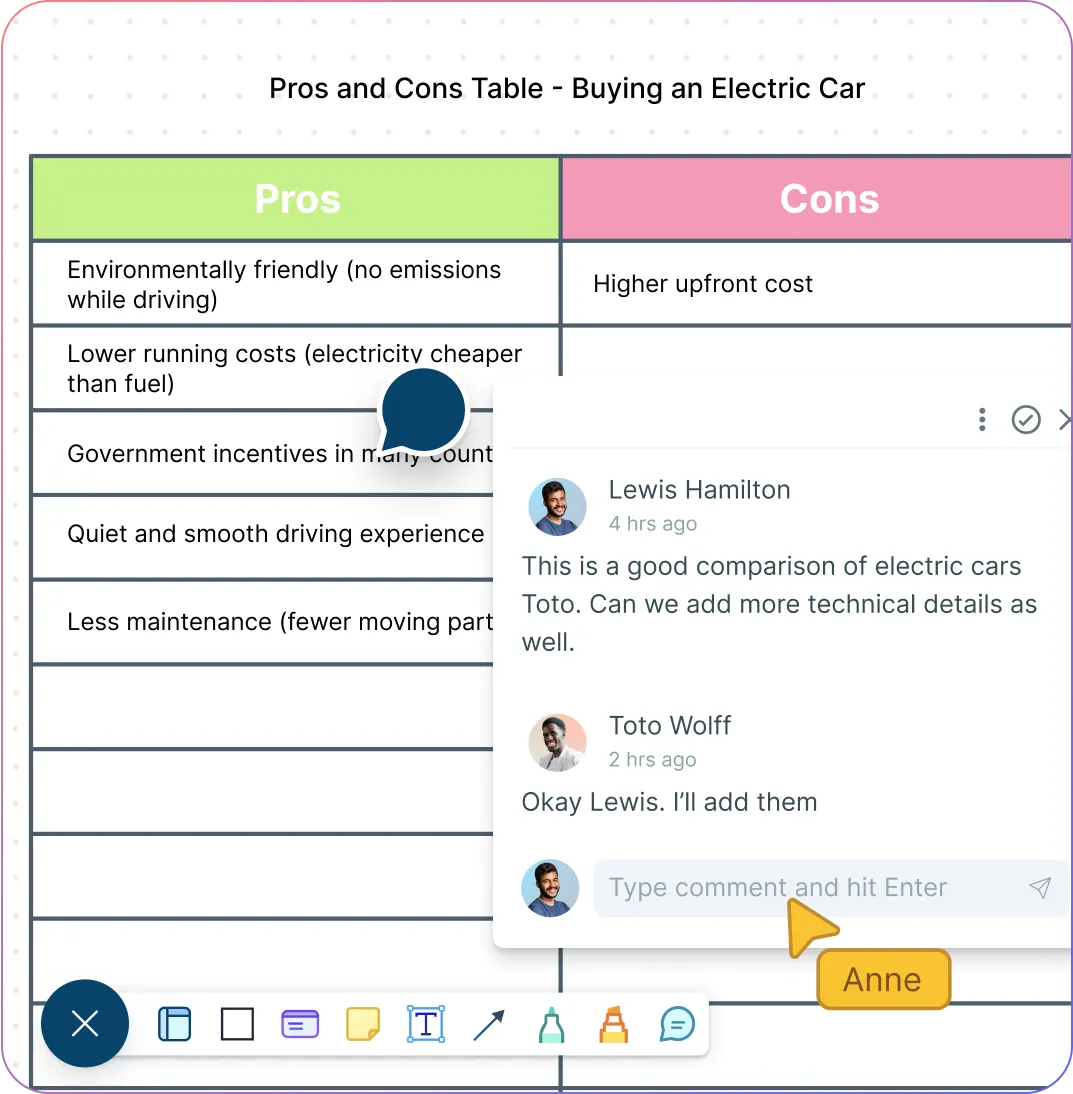
Collaborate with Others from Anywhere
Collaborate with peers on a shared canvas with real-time mouse cursors.
Comment with context, have discussions and follow-ups on the same canvas. Async!
Keep track of changes to your T chart template with full version history.
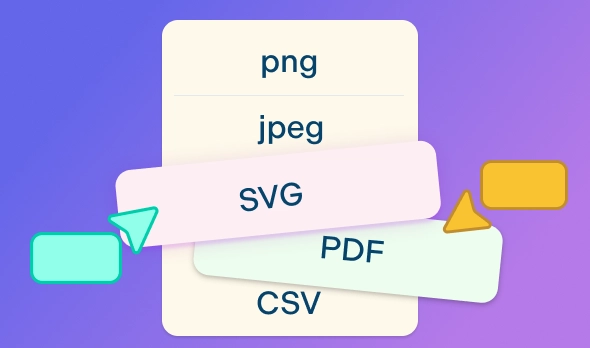
Export the T chart in multiple image formats to publish, present, print, or share.
Easily Evaluate and Compare Data
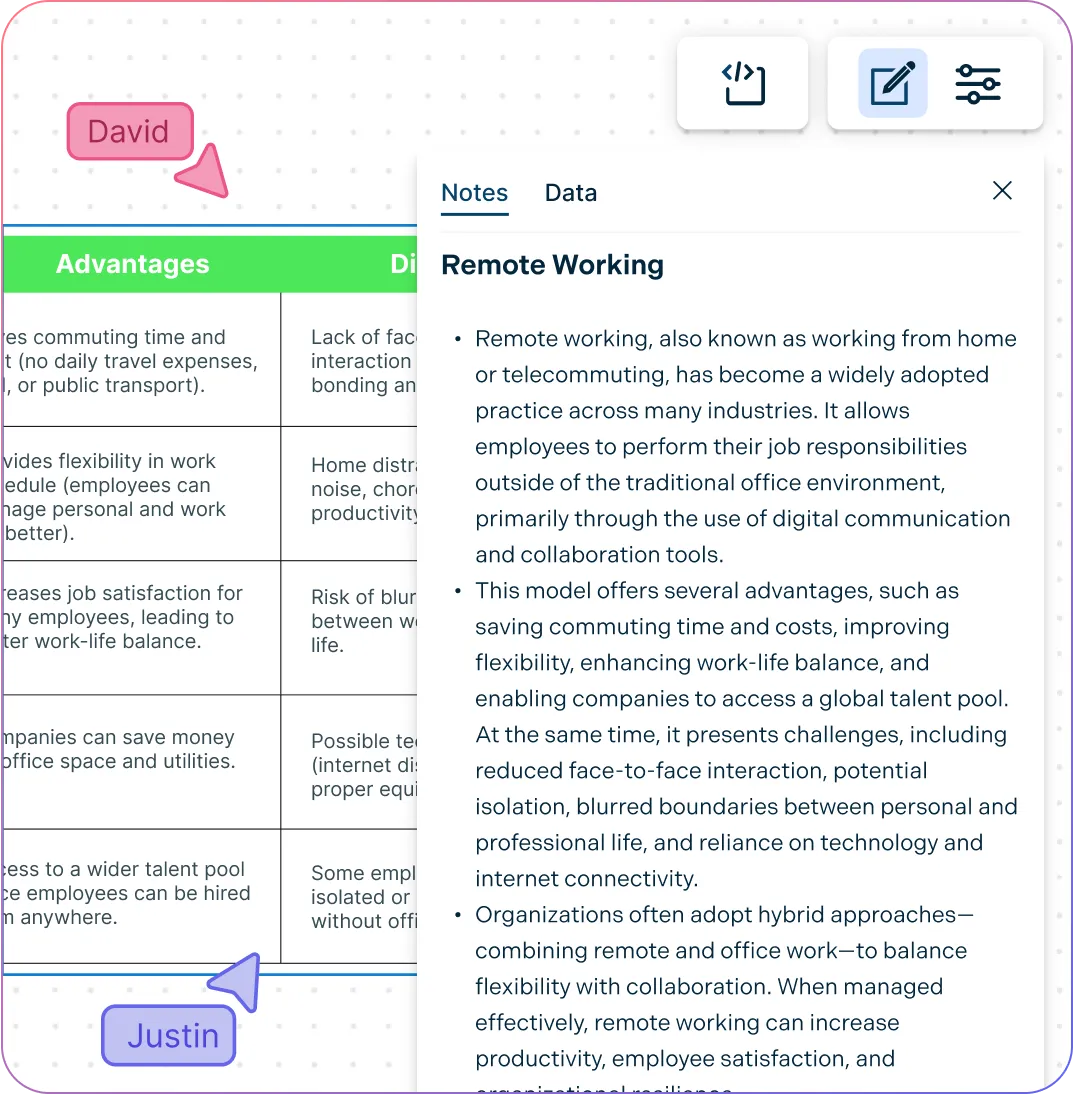
Import data from CSV files, Excel or Google sheets, and attach them to your T-chart.
Input information, such as text, images, or data, into the T Chart with notes & data fields.
10,000+ professional shape library to visualize anything from mind maps to action plans.
Embed your T-chart examples in any site, intranet or app for easy access.
What Is a T Chart
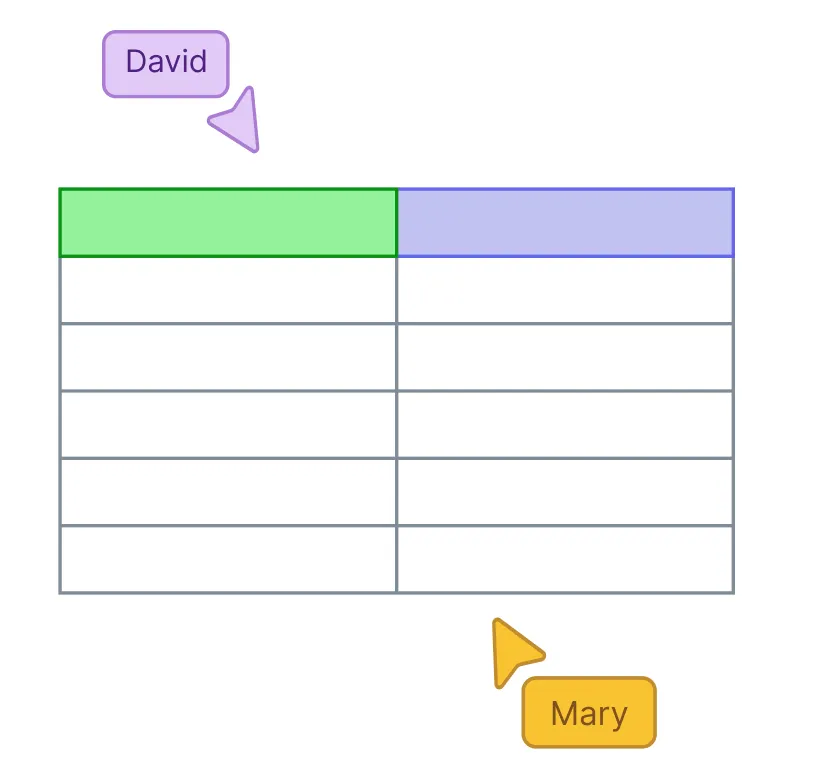
How Can Teams Use T Charts to Organize and Gather Information?
Working on organizing information using a T chart template collaboratively can help teams to clarify their thinking, identify areas for further exploration, and make informed decisions. It can also foster effective teamwork, communication, and collaboration within the team. Here are some ways teams can collaborate around a T chart.
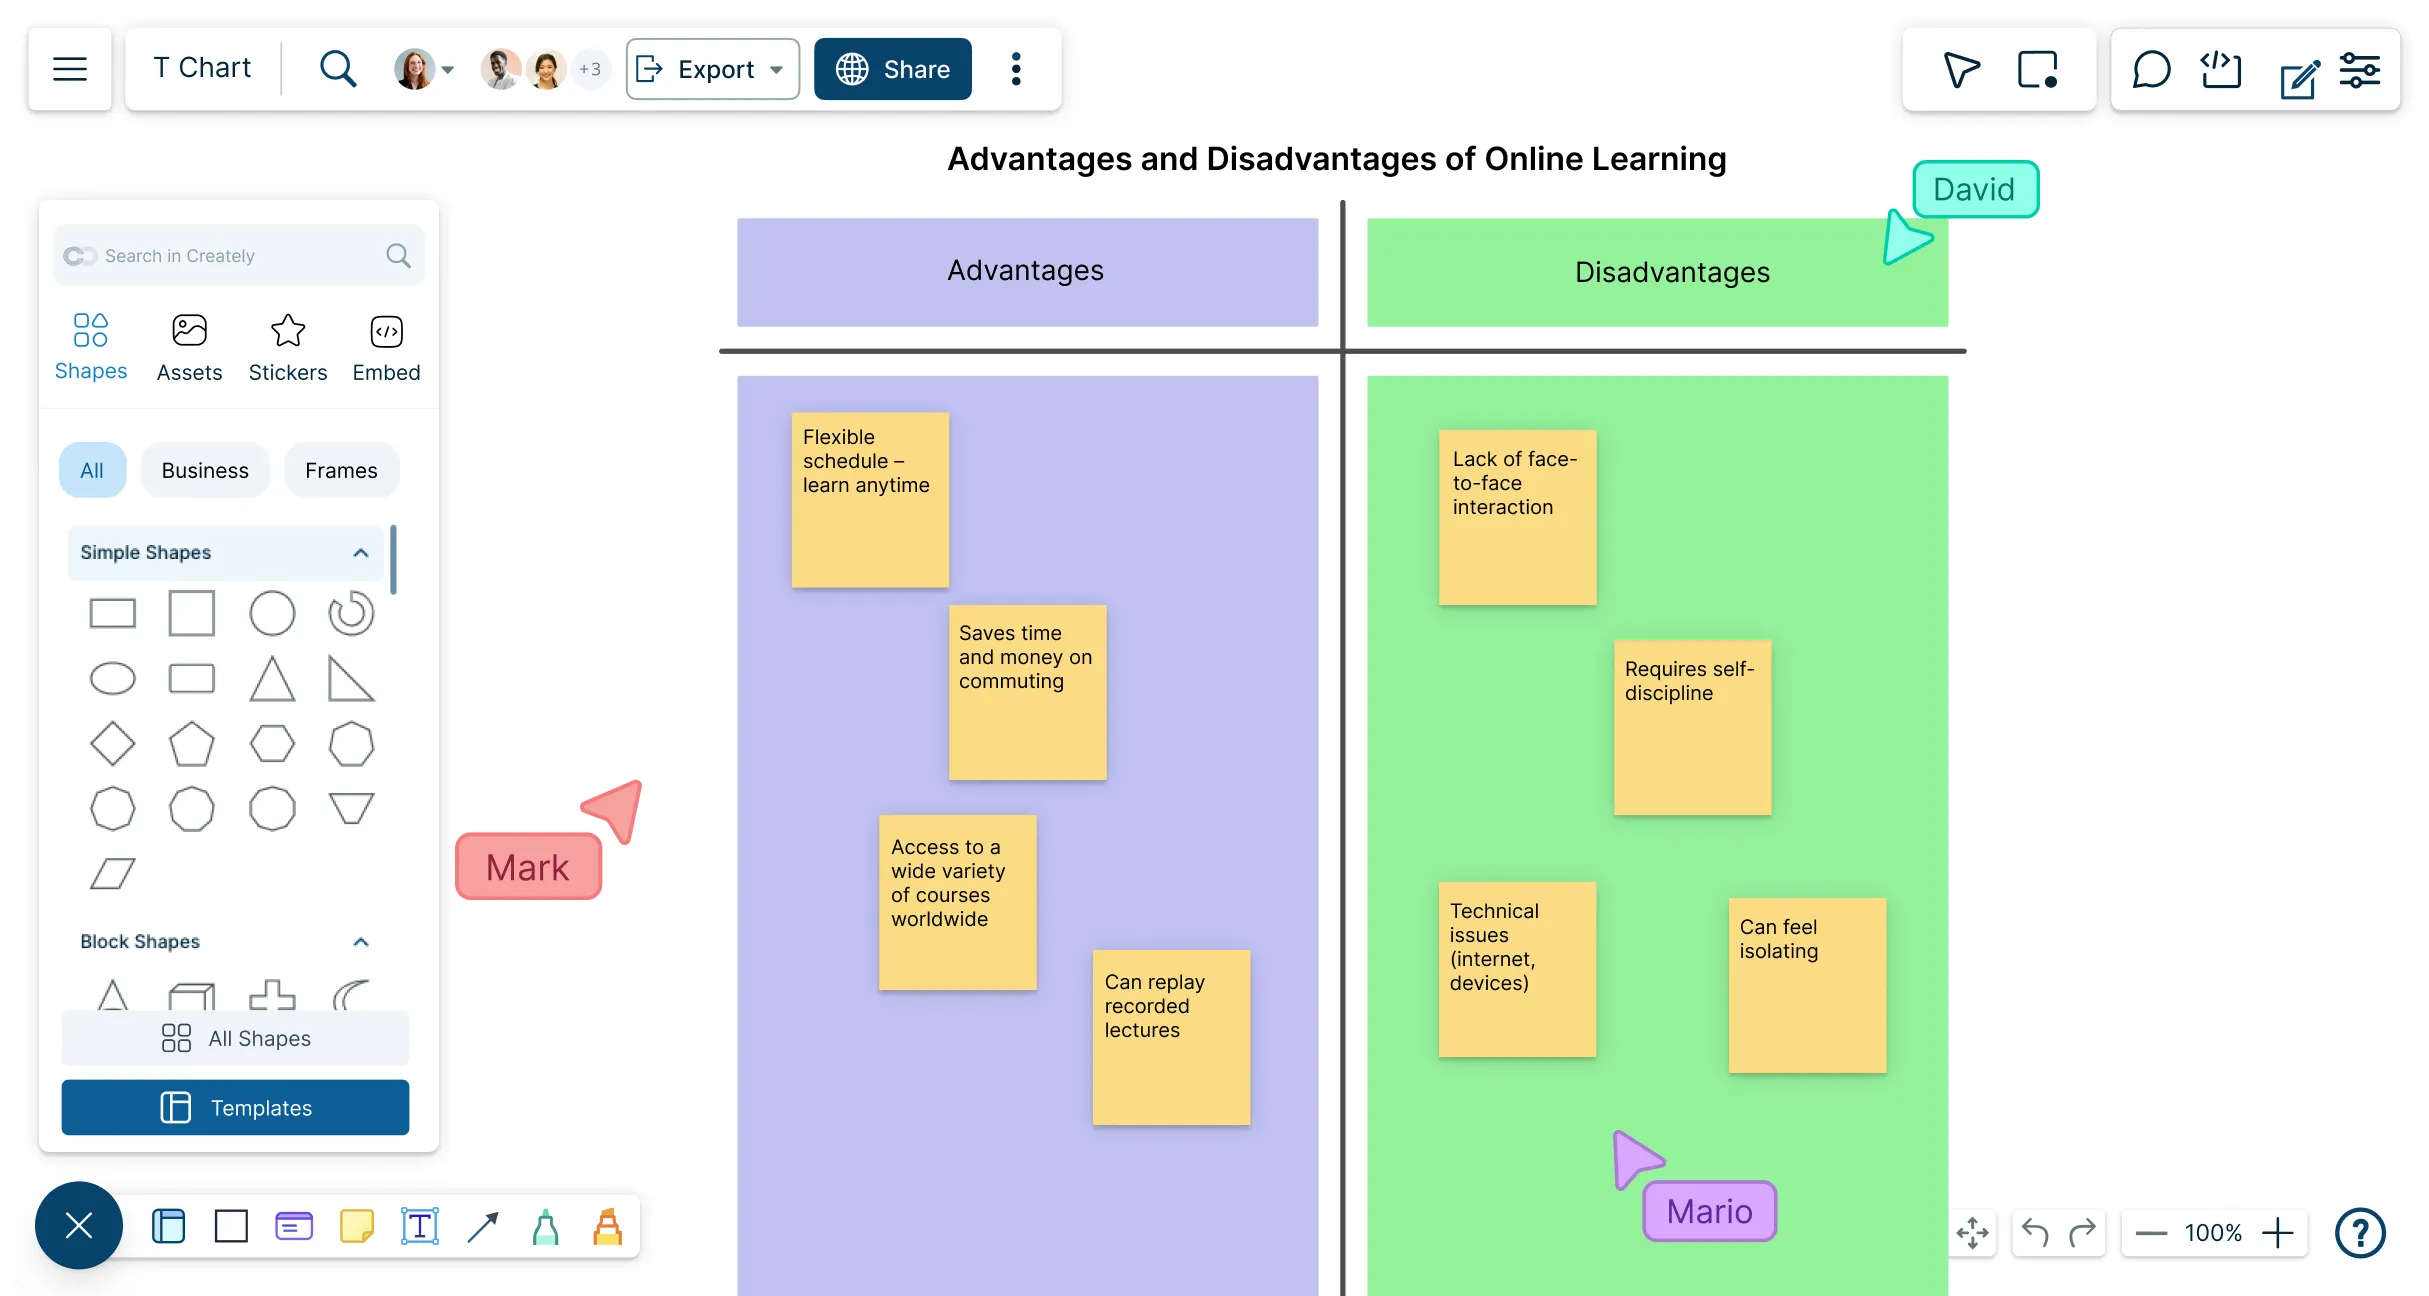
Brainstorming: A team can use a T-chart template to brainstorm ideas and categorize them into two groups. For example, one side of the T-chart can list the advantages of a particular project while the other side lists the disadvantages. Team members can then add their ideas to the appropriate side of the chart, facilitating discussion and analysis of the pros and cons of the project.
Comparing options: A T-chart can also be used to compare multiple options. The team can list the features, benefits, and drawbacks of each option in separate columns. This approach can help the team to make informed decisions based on a clear understanding of the advantages and disadvantages of each option.
Summarizing research: When conducting research, a T-chart can be used to summarize key findings. The team can list the main points of the research on one side of the chart and any supporting evidence on the other side. This approach can help to organize the research and make it easier to understand and use.
Evaluating progress: A T-chart can also be used to evaluate progress. The team can list the goals or objectives on one side of the chart and the progress made towards each goal on the other side. This approach can help to identify areas where the team is succeeding and areas where they need to improve.
How to Make a T Chart Using Creately's T Chart Creator?
Open a workspace and add collaborators
Sign in to Creately’s T chart creator and launch a new workspace. From the share panel, invite your peers as editors so they can work with you on the same T chart in real time. Use synced previews and live cursors to follow their contributions.
Choose a T chart template or start from scratch
Browse Creately’s template library and select a ready-made editable T chart, or drag a divider shape onto the infinite canvas to create one manually. You can expand or resize columns to fit your needs and create a T chart in no time.
Enter ideas directly on the canvas
Add text, sticky notes, or shapes into each column to record pros vs. cons, advantages vs. disadvantages, or facts vs. opinions. You can also attach links, images, or documents to provide context.
Organize and customize the chart
Use drag-and-drop to rearrange points, group related ideas, or highlight priorities. Apply the Creately tree chart generator’s color themes, tags, and shape data to keep the chart clear and visually consistent.
Review and share the T chart
Collaborate further by leaving comments on specific items or sections. Once finalized, export your T chart graphic organizer as a PDF, PNG, or SVG, or embed it into a document, presentation, or wiki for easy access.
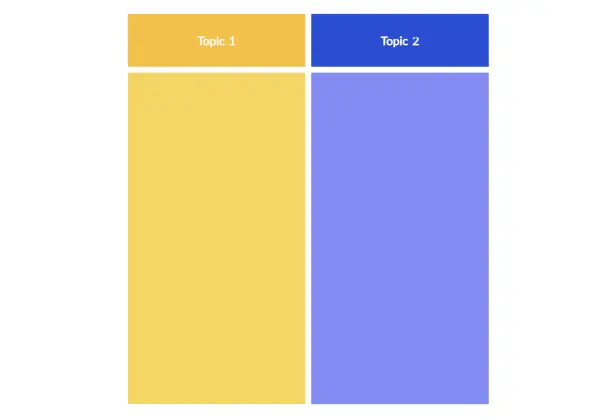
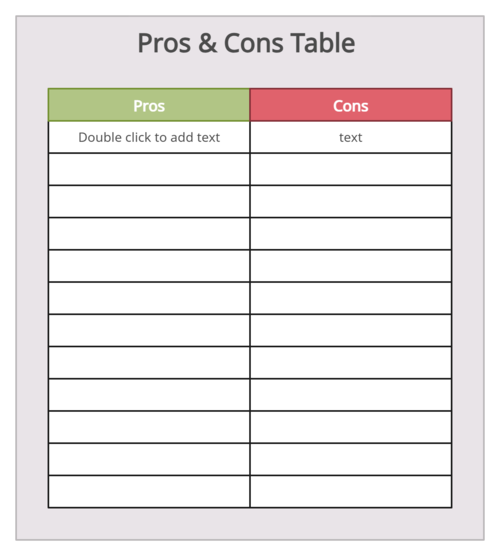
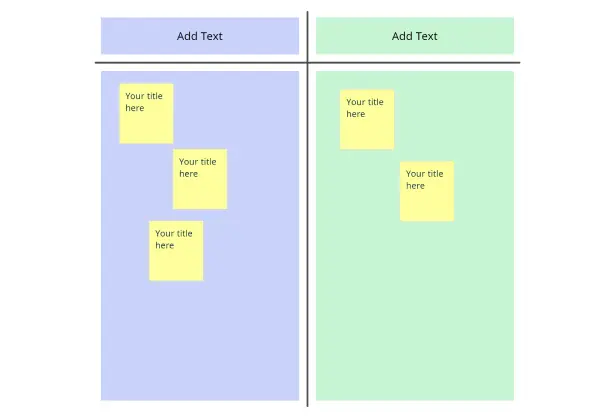
Organize Your Ideas Effectively with these Free Editable T Chart Templates

FAQs About the T Chart Maker
What are Creately’s t chart maker pricing plans?
- Free Plan — $0/month for basic t chart creation and collaboration
- Starter & Team Plans — $8/month or $5/month billed annually
- Business Plan — $149/month or $89/month billed annually
Annual billing helps you save more while unlocking advanced collaboration, workspace management, and enhanced t chart features. You can compare all available plans and features on the Creately Pricing Page.
How can you create t charts faster?
Are there templates for different t chart use cases?
Can teams collaborate on t charts?
Can I add notes, data, and files?
Can I share, present, or export t charts?