Free Venn Diagram Maker
The Easiest Way to Create Venn Diagrams
Better understand and represent data with our free venn diagram maker. Visually represent information with our shape library and simple drag and drop tools.
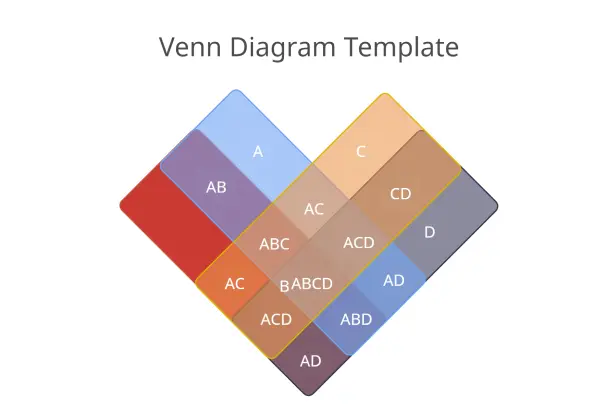
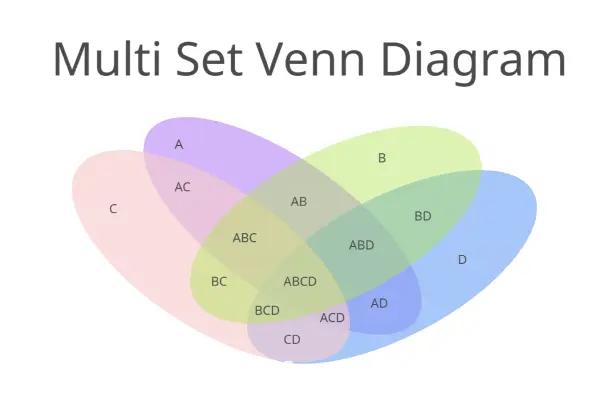
- Multiple free venn diagram templates
- Fully customizable styling options to easily input information
- Share with others, embed in any site, or export in multiple formats
- Multiple free venn diagram templates
- Fully customizable styling options to easily input information
- Share with others, embed in any site, or export in multiple formats

Over 10 Million people and 1000s of teams already use Creately



How to make a Venn Diagram?
Popular Use Cases for Visualizing Venn Diagram
Easily Create Venn Diagrams
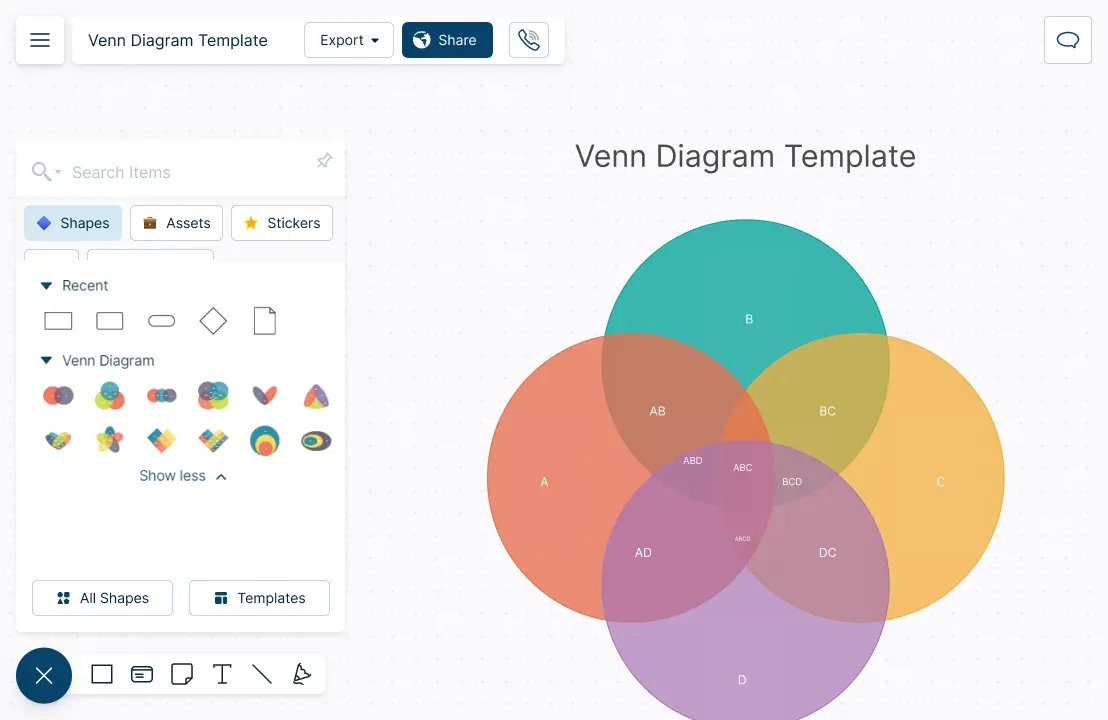
Create professional Venn diagrams with our extensive shape library.
Choose from over 1000+ industry-standard shapes to create detailed Venn diagrams.
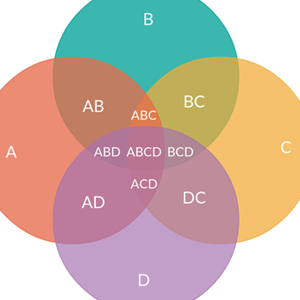
Visualize multiple data sets and represent Venn diagrams in multiple ways.

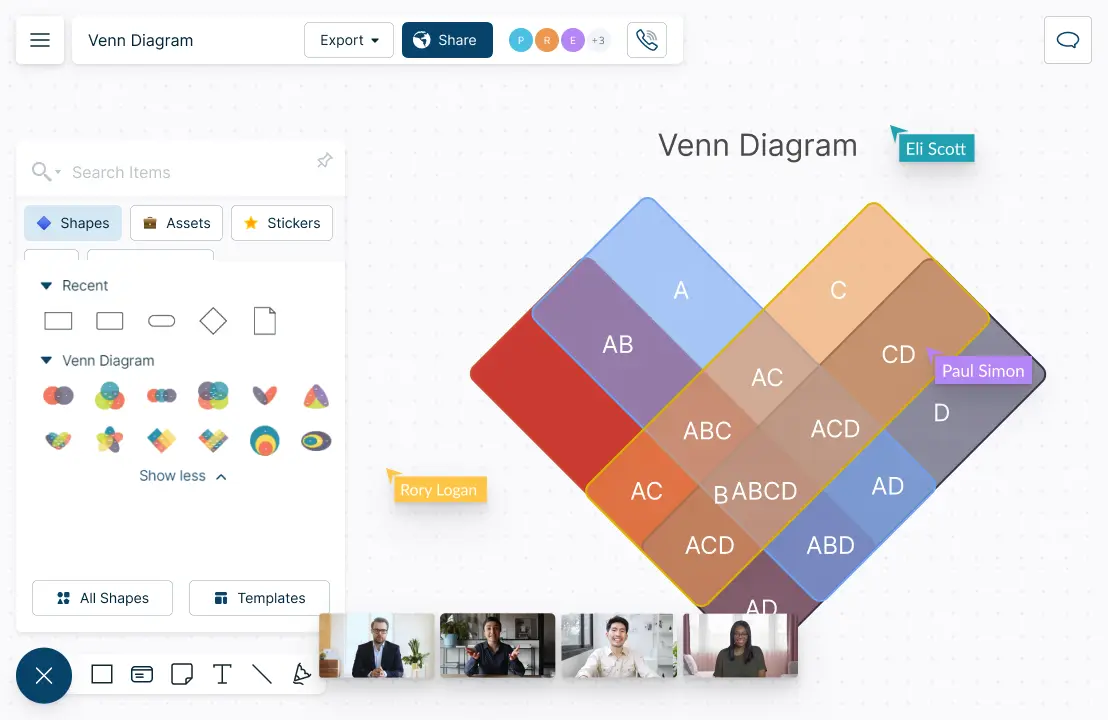
Understand, Discuss, and Modify Together

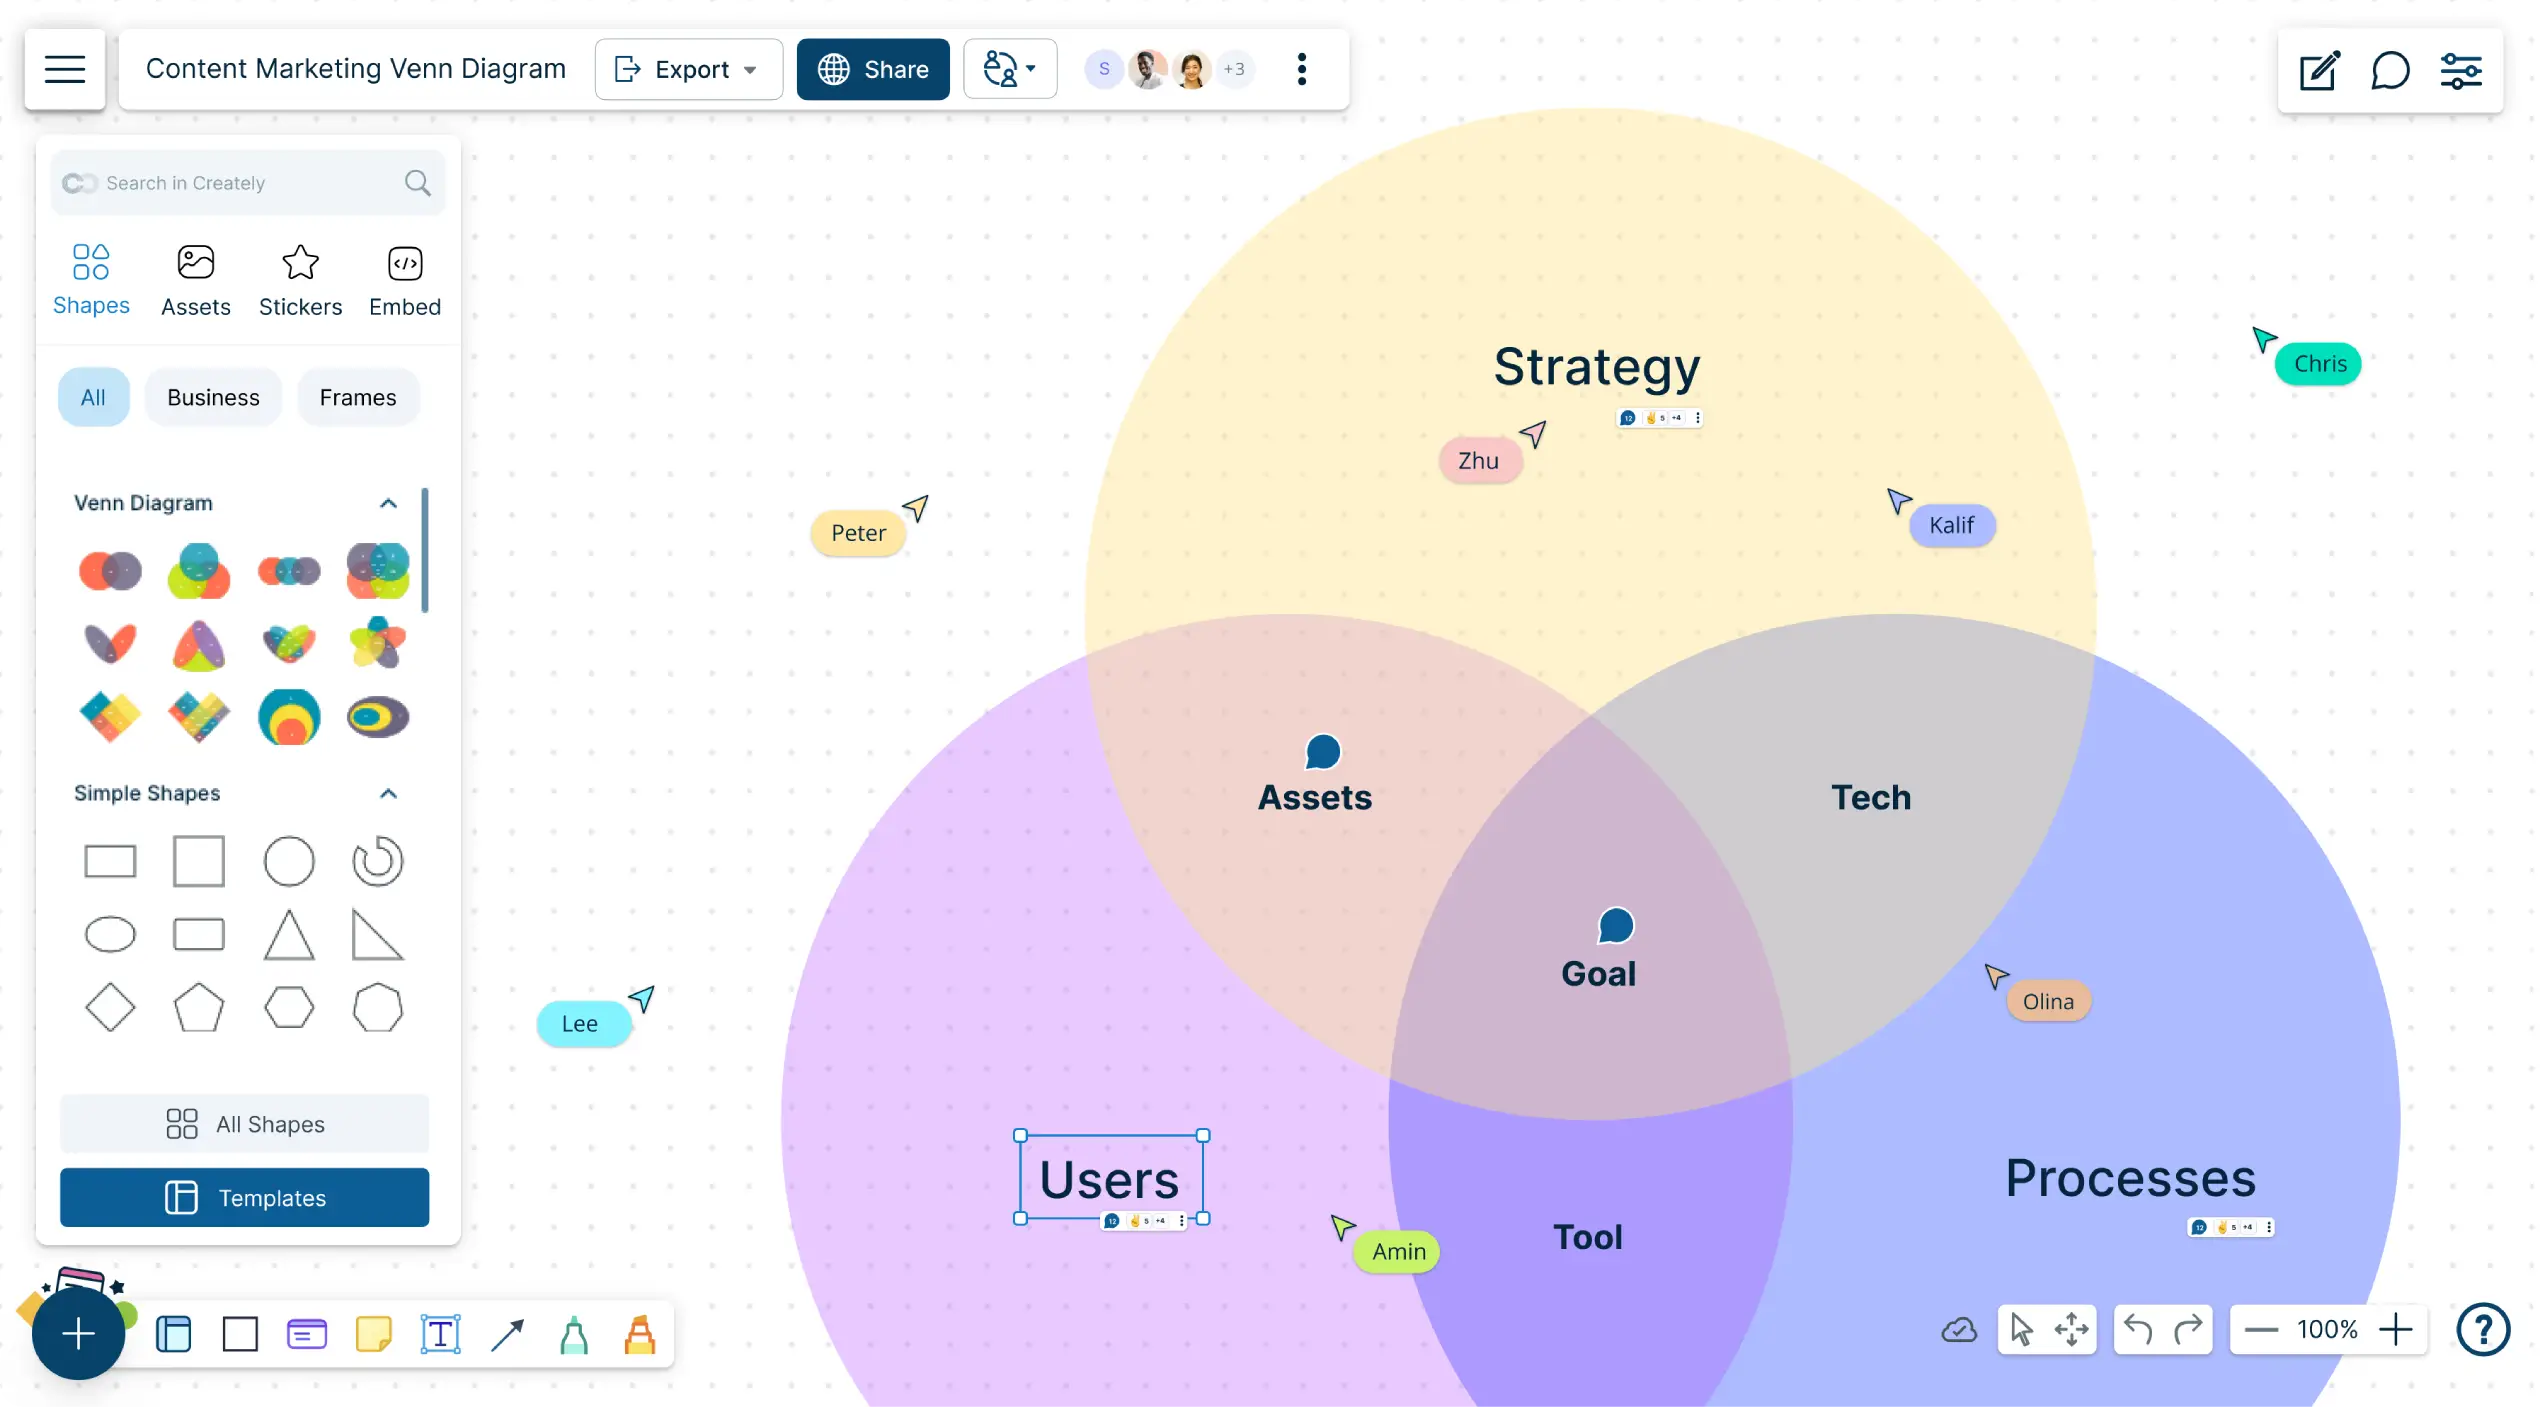
Work closely with teams in real-time with live mouse tracking and whiteboarding.
Multiple access and role levels to streamline sharing, reviewing, and editing workspaces and folders.
Make suggestions and make Venn diagrams together with in-line comments.
Share Across Multiple Platforms
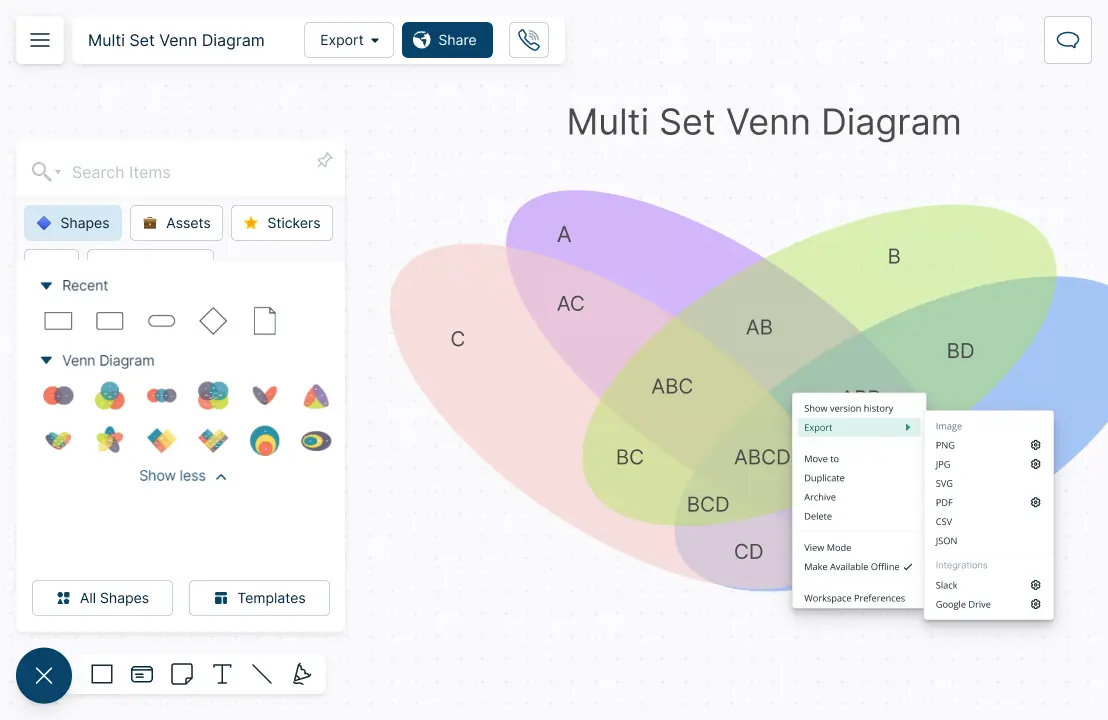
Publish, present, print, and share with multiple export options (SVGs, PNGs, JPEGs, and PDFs ).
Create presentation flows for multiple stakeholders with frames and other navigation features.
Multiple add-ons to easily embed the Venn diagram in Google/Microsoft documents, slides, and sheets.

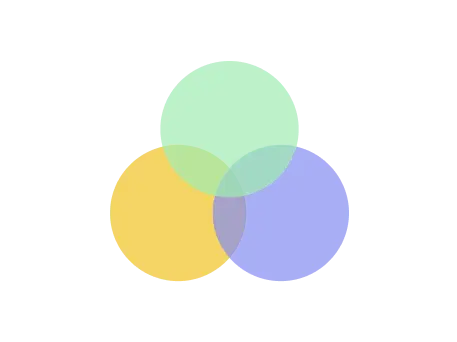
What is a Venn Diagram Maker?
Components of a Venn Diagram
How to Create a Venn Diagram?
Plan Your Process
Start by setting a timeline for gathering, analyzing, presenting, and sharing the information needed for your Venn diagram. Ensure that all necessary data is collected within this timeframe.
Collect and Organize Information
Gather all relevant information that will be included in your Venn diagram. Once collected, arrange the data chronologically to help identify key details and filter out less important information.
Design Your Diagram
Choose a layout that suits your needs. Creately offers a variety of popular templates that can help you get started quickly. These templates make it easy for you to create a venn diagram online effortlessly.
Customize the Venn Diagram
Style your Venn diagram with preset color themes using Creately’s tools. You can further customize your diagram by importing images, clipart, GIFs, logos, and icons. Alternatively, use Creately’s built-in Google image search for additional visuals.
Enhance with Additional Data
Add critical information directly into the diagram’s shapes, and use the data panel during your presentation to highlight these details. Share the diagram with stakeholders or team members through Creately to collect feedback via contextual comments.
Finalize and Share
Once finalized, present your Venn diagram on Creately. You can also embed it on any website, integrate it with Google or Microsoft platforms via add-ons, or download the diagram in high-quality formats such as PNG, SVG, PDF, or JPEG.
How Can Teams Use Venn Diagrams?
For Brainstorming
Teams can use the Creately canvas to have brainstorming sessions where they can share thoughts and ideas and place them in appropriate sections of the Venn diagram.
To Make Better Decisions
Teams can use these representations to clarify concepts, improve alignment and make better decisions together.
To Share with Others
These diagrams can be inserted into presentations and shared across the organization for easy reference.
Create Your Venn Diagram Online with Editable Templates
FAQs for Creately’s Venn Diagram Maker
Can I customize the text inside the Venn diagram?
Can I create Venn diagrams with more than two circles?
Can I collaborate on Venn diagrams?
How can I change the colors on my Venn diagram circles?
How do you visualize a disappeared intersection in a Venn Diagram?
What is the purpose of a Venn Diagram?
How are Venn Diagrams used for real-life problems?
How do you interpret a Venn Diagram?
What are the Components of Venn Diagrams?
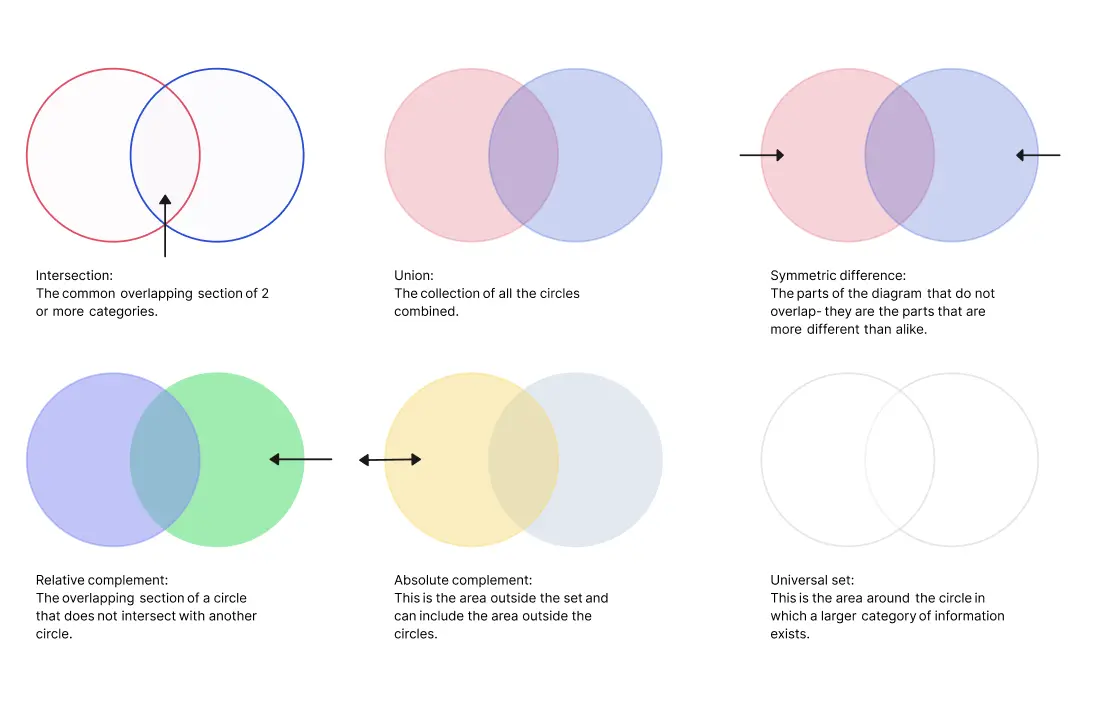
- Intersection: The common overlapping section of 2 or more categories.
- Union: The collection of all the circles combined.
- Symmetric difference: The parts of the diagram that do not overlap- they are the parts that are more different than alike.
- Relative complement: The overlapping section of a circle that does not intersect with another circle
- Absolute complement: This is the area outside the set and can include the area outside the circles.
- Universal set: This is the area around the circle in which a larger category of information exists.


