Gantt Chart Maker
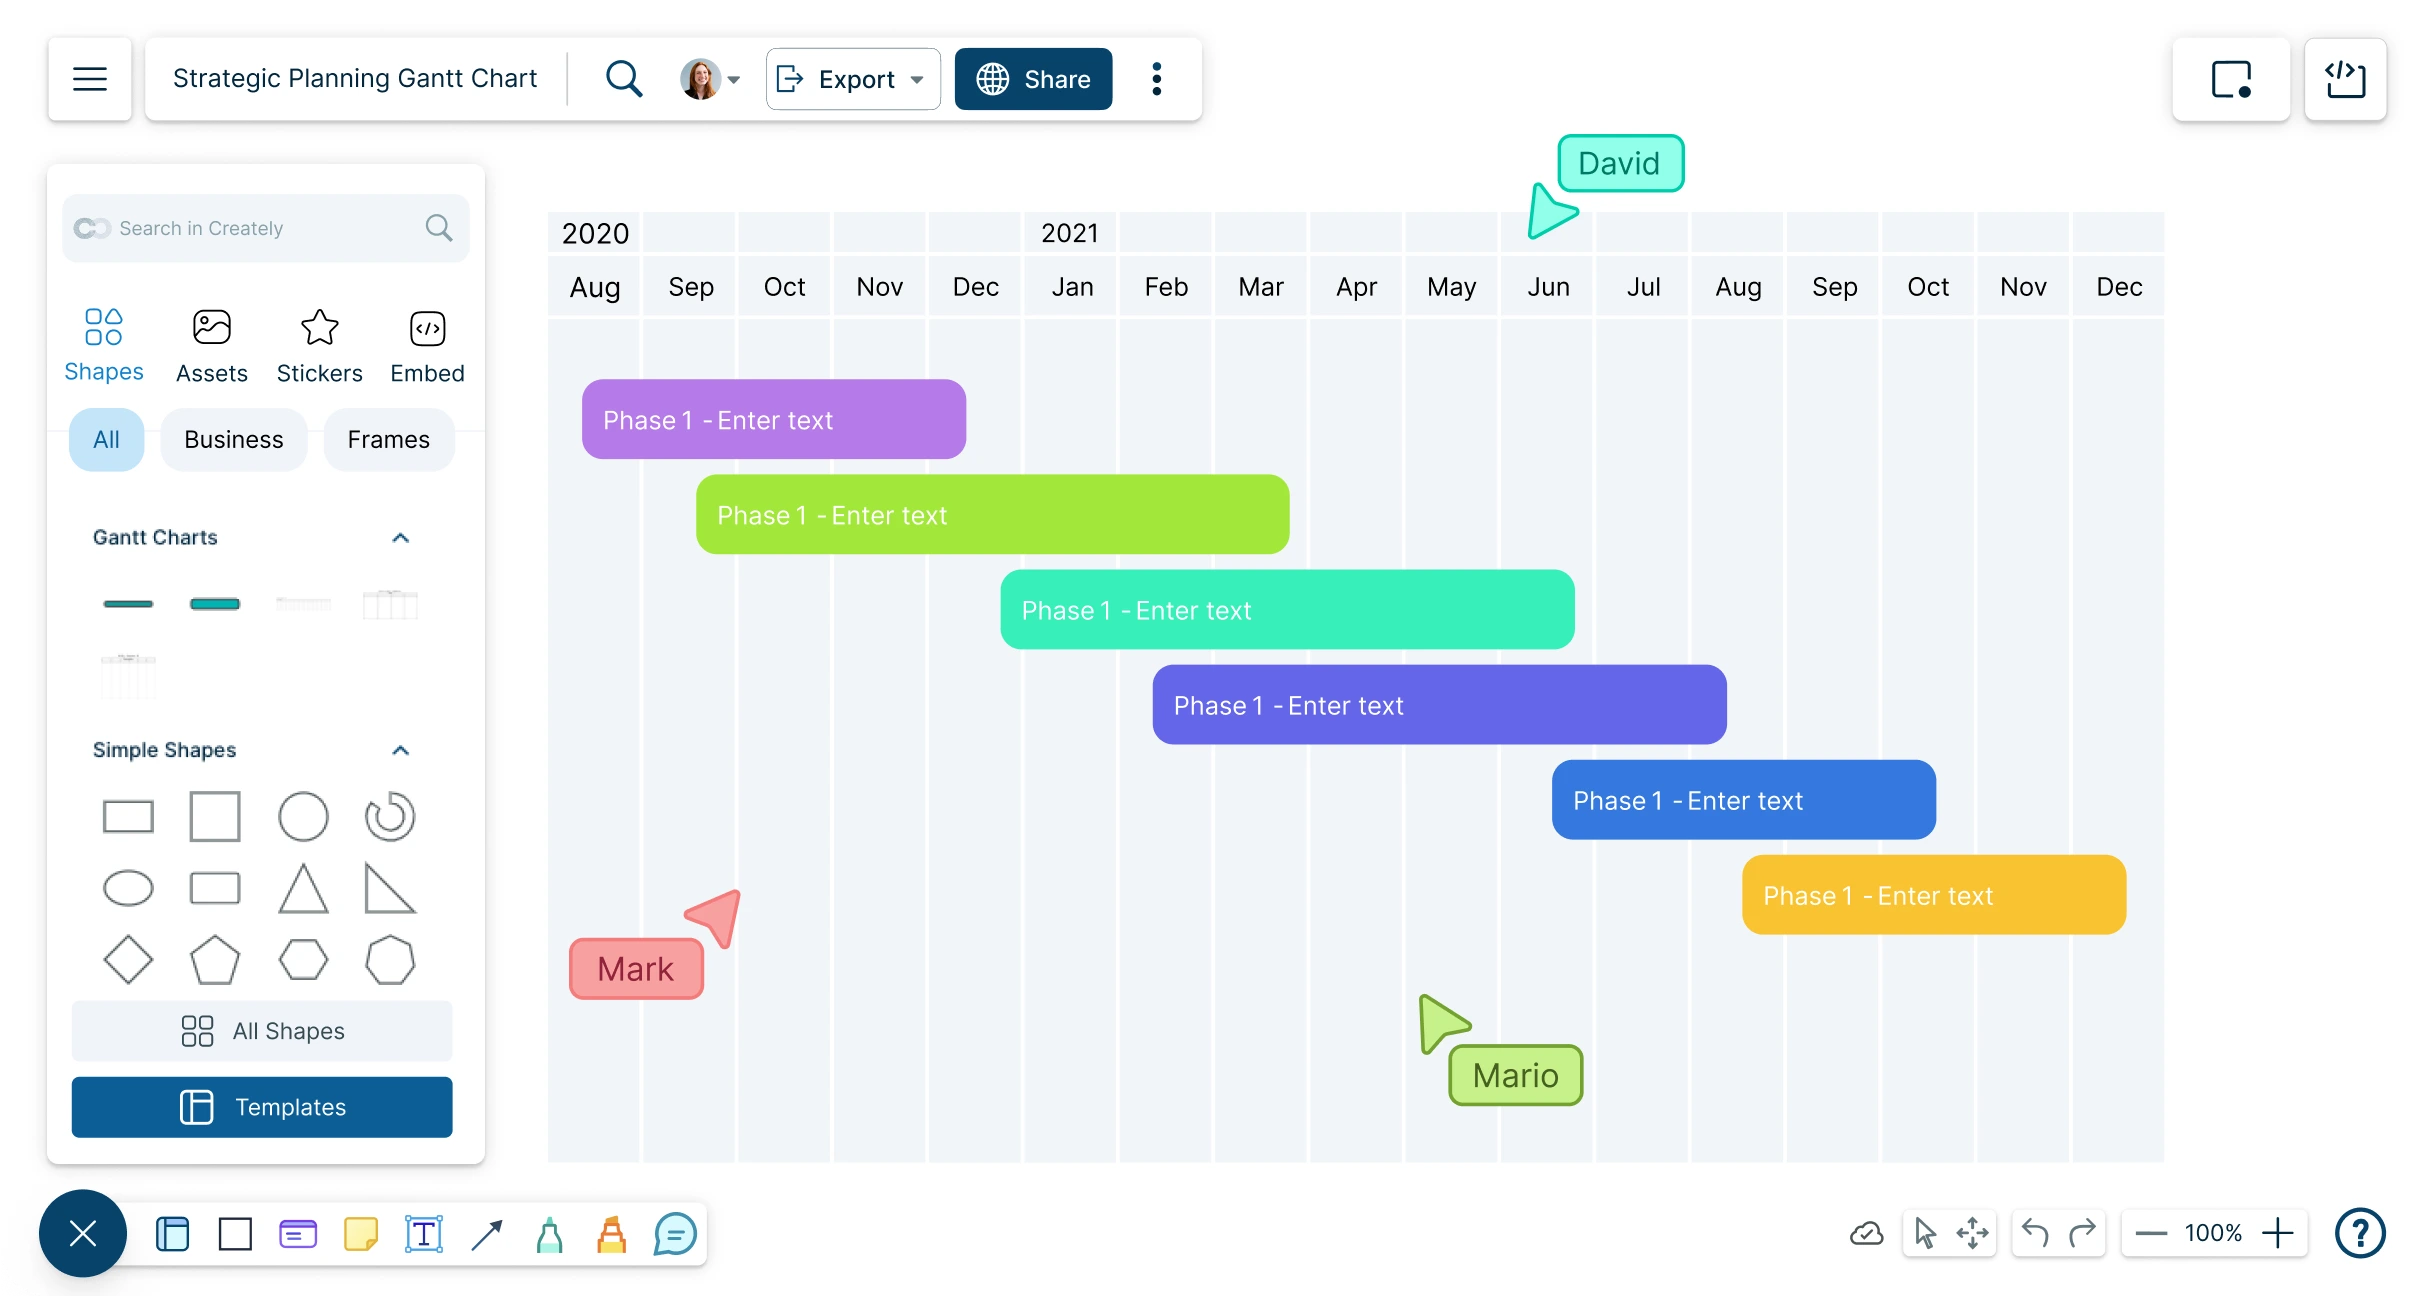
Visualize Project Timelines
Create timelines for any event; track and analyze your team’s projects and tasks from start to finish with Creately’s Online Gantt Charts.
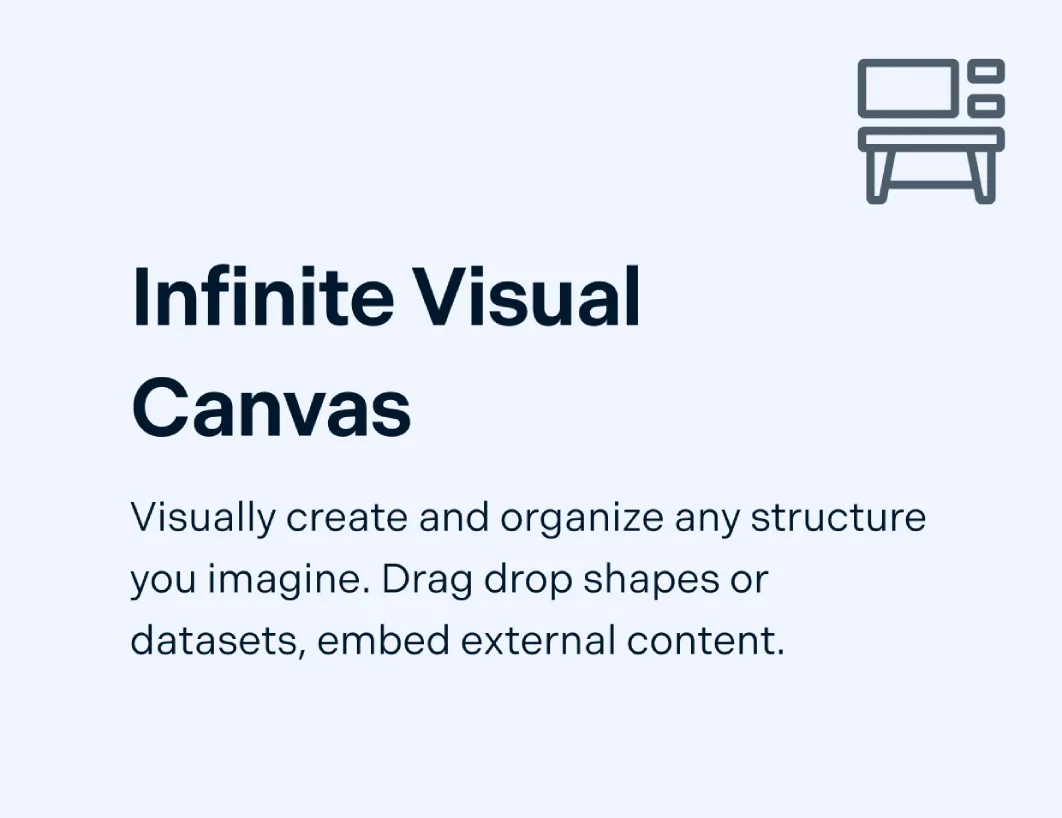
Visualize your entire project on a single canvas
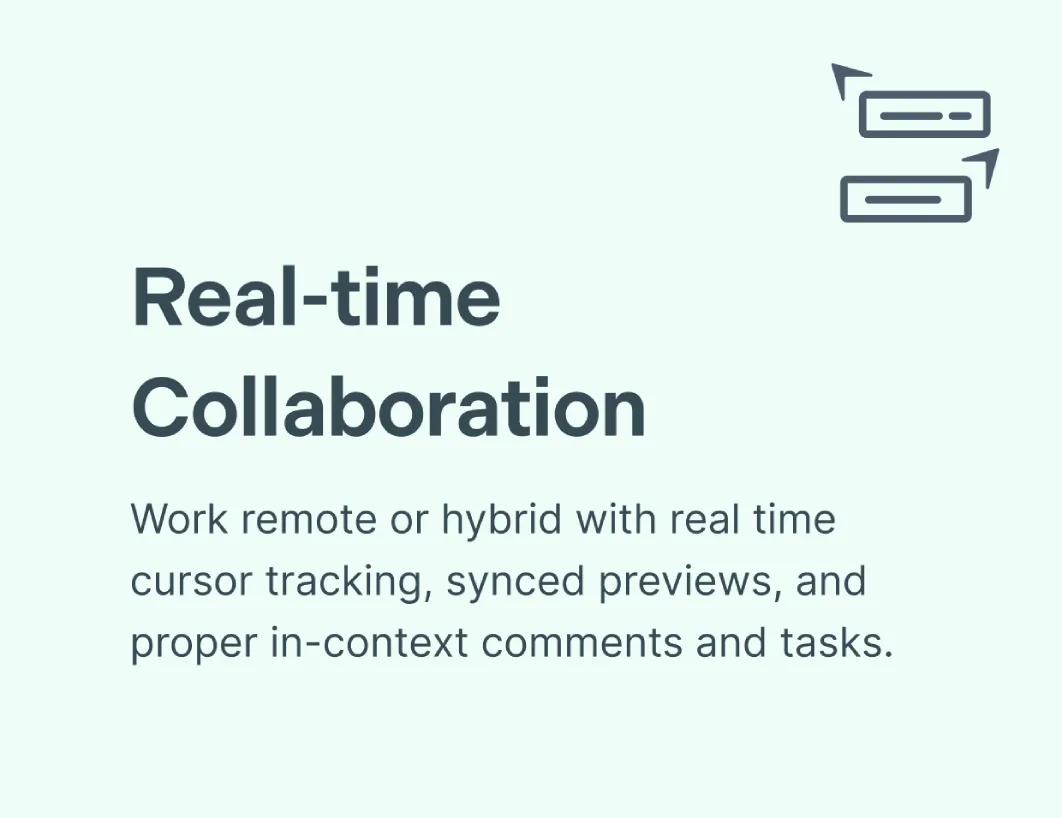
Real-time collaboration for planning and feedback
Style and customize Gantt charts easily


 Diagramming Visual Collaboration Org Chart


How to Make a Gantt Chart with Creately
Open a Gantt Chart Template
Launch Creately, open a workspace, and choose a Gantt chart template from the library or start with a blank canvas. Use the Notes Panel or sticky notes to define your project scope, goals, and deliverables so the whole team is aligned.
Add Project Tasks
Break down project objectives into smaller, manageable tasks and add these to the Gantt chart template. You can use brainstorming tools or a work breakdown structure (WBS) within the workspace to organize and prioritize tasks clearly.
Define Dependencies and Timelines
Connect tasks to show dependencies and set realistic durations. Draw the timeline, add milestones, and highlight critical tasks that must be completed before others can begin. This helps identify potential delays early.
Customize and Assign Tasks
Assign tasks to team members, track updates in real time, and use notifications to stay informed of changes. Use color coding for better readability of tasks.
Review, Update & Share
Regularly review progress within the workspace, mark completed tasks, and address delays with in-line comments or team discussions. Share your Gantt chart via secure links, set permissions for editing or viewing, and export it in formats like PNG or PDF for reports or presentations.
How to Create a Gantt Chart
Align Efforts and Keep Projects on Track

Build a working project plan by drawing it with Creately’s Gantt charts.
Drag-and-drop items to organize, actual tasks are updated automatically.
Combine with Kanban boards, priority grids or brainstorming tools to stay synced.
Add notes and attachments to tasks and milestones for additional context.

Gantt Chart Creator to Visualize Your Project - Your Way
Build presentation-ready project timelines by styling and arranging Gantt chart contents.
Use professional templates and designs to make Gantt charts online the way you want.
Build snapshots of project schedules while keeping in sync with the main project timeline.
Supercharge Meetings & Make Collective Decisions

With real-time collaboration features, you’ll feel like you’re in the same room with your team.
Share, review and edit your Gantt chart with stakeholders using multiple access and role levels.
Collaborate on a shared canvas during meetings with our Gantt chart maker.
Keep track of changes or branch out from an earlier version with full version history.

Faster, Smarter and More Transparent
Assign responsibilities, track progress and build workflows to action project plans.
Publish, present, print, or share your Gantt chart by exporting as SVGs, PDFs and PNGs.
Connect to your favorite tools with Creately plugins for Slack, Google Workspace, Confluence, and more.
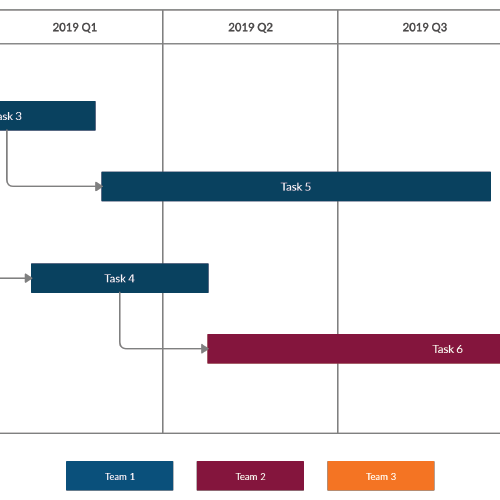
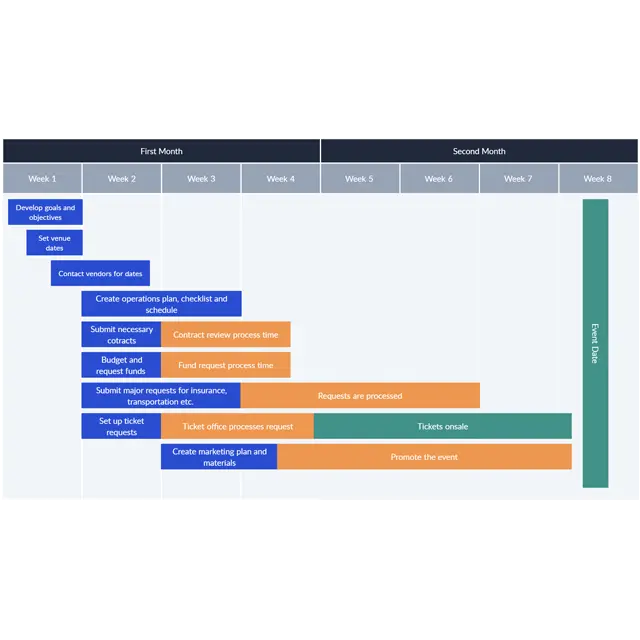
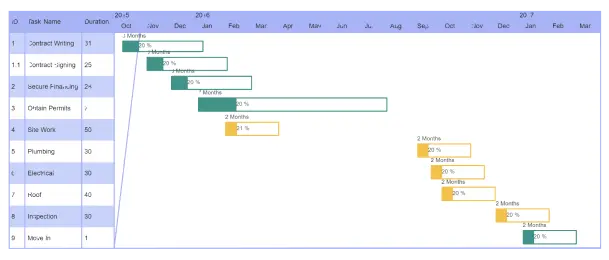
What is a Gantt Chart?


FAQs About the Online Gantt Chart Maker in Creately
What are Creately’s gantt chart maker pricing plans?
- Free Plan — $0/month for basic gantt chart creation and collaboration
- Starter & Team Plans — $8/month or $5/month billed annually
- Business Plan — $149/month or $89/month billed annually
Annual billing helps you save more while unlocking advanced collaboration, workspace management, and enhanced gantt chart features. You can compare all available plans and features on the Creately Pricing Page.
How can you create gantt charts faster?
Are there templates for different gantt chart use cases?
Can teams collaborate on gantt charts?
Can I add notes, data, and files?
Can I share, present, or export gantt charts?