Organizational Chart Maker
Make Organizational Charts Using Free Organizational Chart Generator
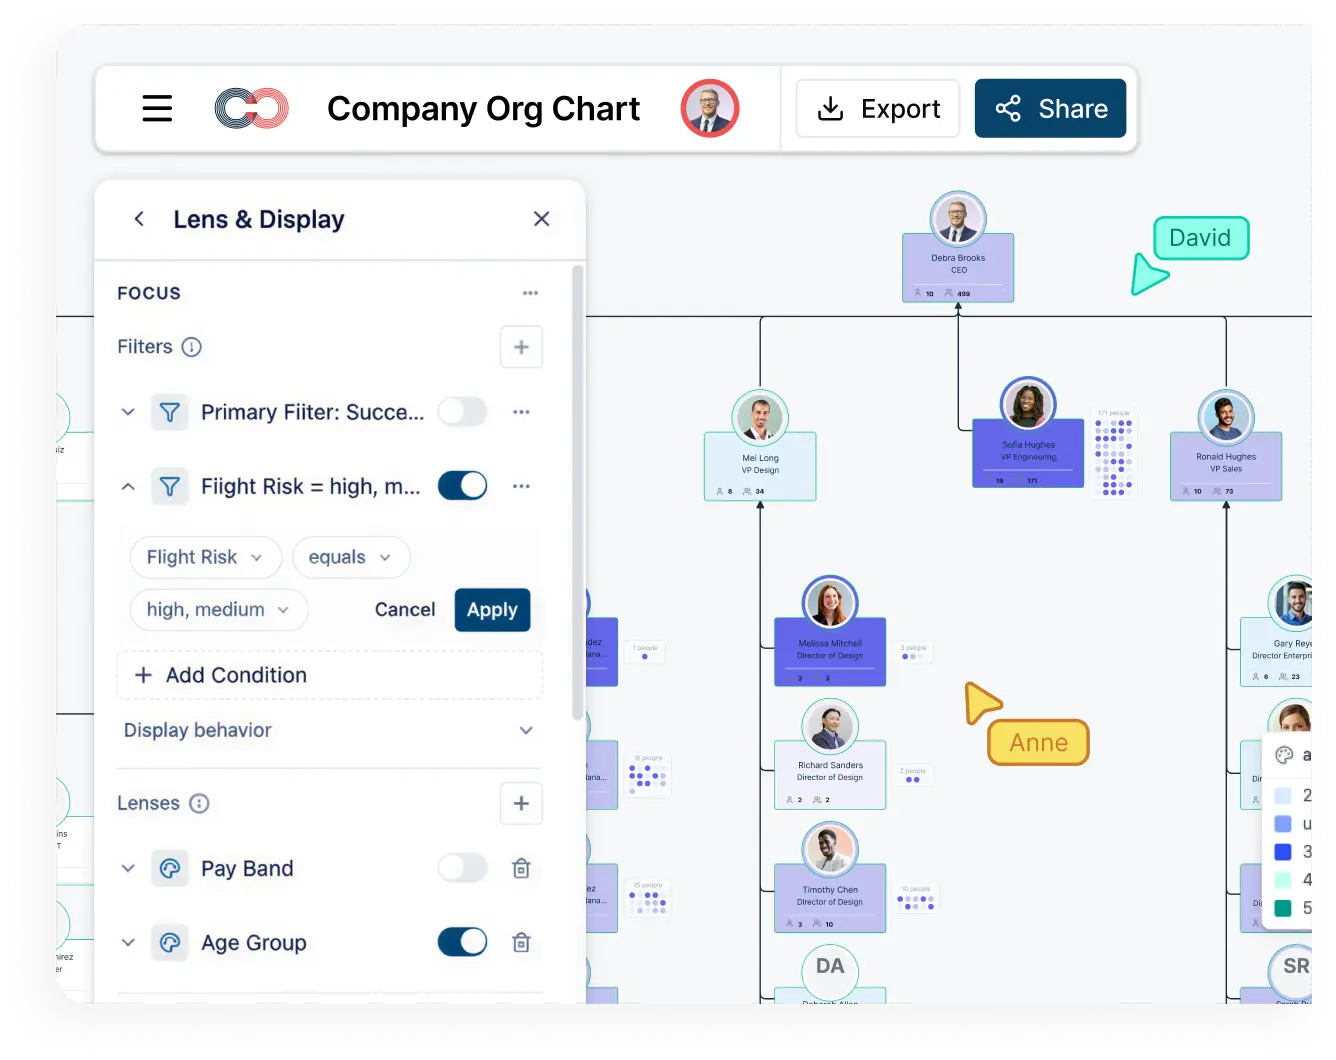
Build organizational charts that do more than show reporting lines—use them to support HR planning, workforce decisions, and succession reviews in one visual workspace.
- Simple drag and drop interface and automatic drawing to create organizational charts faster
- Unique color themes and styles, and image import options for quick customization using org chart maker
- 1000s of customizable organizational chart templates and org chart shape library to visualize organizational structures
- Multi-user editing & live mouse tracking to collaborate in real-time with others
Free Organizational Chart Templates
Creately’s organizational chart maker helps you turn reporting lines and employee data into a clear, editable org chart. Start with a free template, add roles and relationships, and collaborate on updates in one workspace. When teams need org-intelligence workflows like succession planning, workforce planning, and scenario modeling, this same foundation can extend into a more connected planning layer, where the chart can source from HRIS exports or CSVs, layer up to 204 fields across 15 field packs, and stay useful for both planning and day-to-day discovery.


What Is an Organizational Chart?
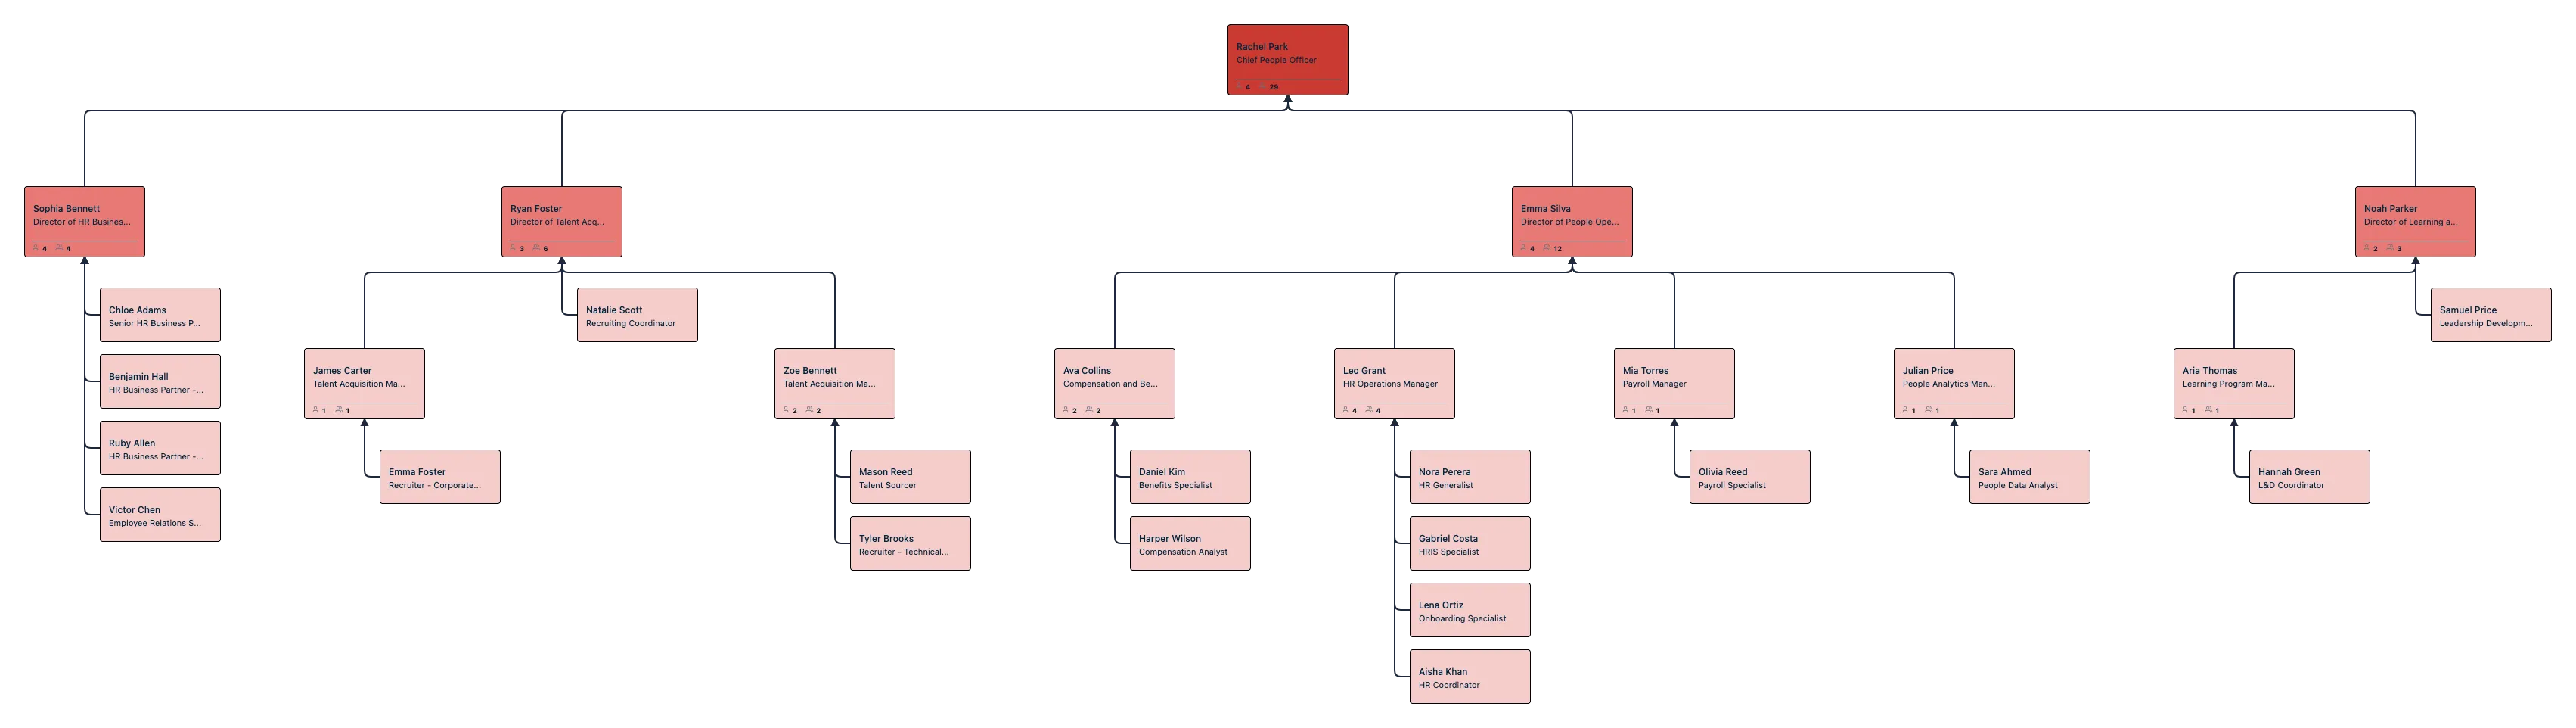
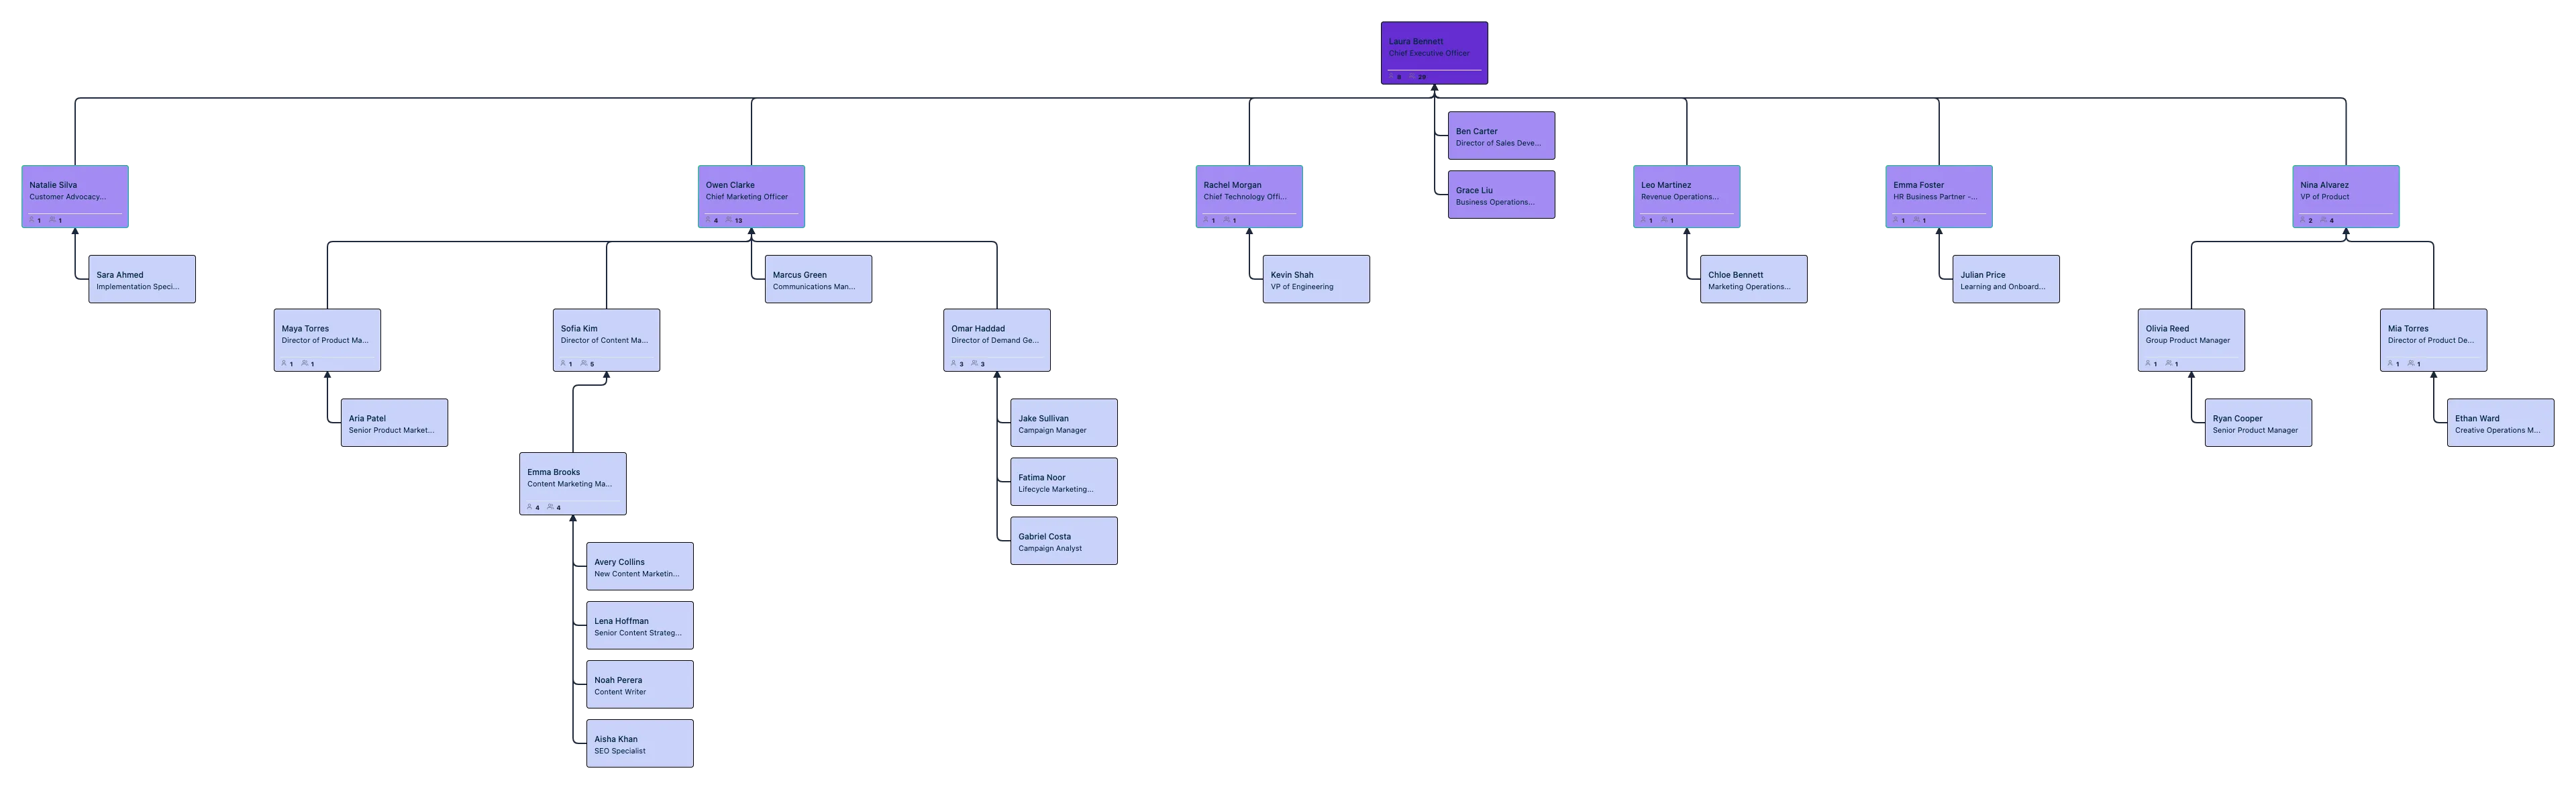
An organizational chart is a visual map of roles, teams, and reporting relationships. For CHROs and People Operations teams, a current org chart also provides a shared view for workforce planning, reorganizations, succession decisions, and onboarding as the organization changes.
Instead of rebuilding a static diagram after every personnel change, teams can connect employee data, collaborate on updates, and model possible structures without changing the live view. A growing HR team might, for example, compare a proposed manager split with the current structure before approving a reorganization. That same org chart can also become the bridge into succession planning, succession planning org charts, and workforce planning workflows when leaders need more than a static hierarchy.
Use Cases for Modern Organizations
Modern organizations use organizational charts for far more than static reporting lines. With live data, collaboration, and analytics, org charts become an operational system of record rather than a one‑time diagram.
HR & People Operations
Maintain living org charts that update as employees join, move, or leave the organization, supporting both day‑to‑day operations and org charts for employee onboarding. Track hundreds of data points such as role, department, location, tenure, and employment type to keep workforce visibility accurate and current. Teams can also auto-generate department views from the parent org chart, making it easier for HR business partners to work with focused subtrees without rebuilding the structure.
Succession Planning
Visualize successors for critical roles, identify bench strength, and map readiness levels across teams. Scenario views make it easy to plan leadership transitions without impacting the live organizational structure. Teams can layer readiness, risk, and successor relationships onto the chart while keeping restricted fields hidden from unauthorized viewers. Learn more about building future‑state models with org chart scenario planning or move directly into succession planning workflows.
Compensation & Pay Equity Analysis
Overlay compensation bands, compa‑ratios, and performance indicators directly on the org chart to uncover pay gaps and equity risks. Role‑based access controls ensure sensitive compensation data remains secure. See how teams run effective reviews with compensation analysis using org charts.
Reorganization & Change Planning
Model reorganizations, mergers, and team restructuring using scenario branches. Compare current‑state and future‑state org charts to evaluate impact and alignment before implementing changes. Named scenarios, historical as-of views, and side-by-side comparisons help leaders review the before-and-after structure without overwriting the live chart.
Workforce Analytics & Insights
Answer strategic questions such as average span of control, manager workload, or team distribution across locations using workforce planning org charts. AI‑assisted insights help leaders make faster, data‑driven organizational decisions and model workforce capacity more effectively, especially when they are working from a shared workforce planning model. View presets, heatmaps, focus views, and an AI assistant help answer those questions on the chart instead of through offline reports.
Steps to Create an Organizational Chart
Import your organizational data from a CSV, Excel file, or HR system, including fields such as name, role, manager, department, and location.
Choose an organizational chart template or start with a blank canvas. Automatically map reporting relationships using manager or reporting fields.
Configure which data fields appear on each role, such as title, tenure, team, or location, and customize the layout, colors, and structure.
Create scenarios to model reorganizations, succession plans, or future‑state org structures without impacting the live chart.
Apply visibility and sensitivity controls for fields like compensation or performance using role‑based access permissions.
Collaborate with stakeholders in real time, then share, export, or embed the org chart across internal tools and documentation.
Why Creately Is Better Than Visio, PowerPoint & Excel
Traditional tools like Visio, PowerPoint, and Excel are designed for static diagrams, not modern organizational needs. As one of the best org chart software options available, Creately goes beyond drawing to help teams manage, analyze, and evolve organizational structures in real time.
| Feature | Creately | Visio | PowerPoint | Excel |
|---|---|---|---|---|
| AI assistant | ✓ | ✗ | ✗ | ✗ |
| Live org data (200+ fields) | ✓ | ✗ | ✗ | Partial |
| Scenario planning & reorg modeling | ✓ | ✗ | ✗ | ✗ |
| Real‑time collaboration | ✓ | ✗ | Limited | Limited |
| Auto‑update from CSV / HRIS | ✓ | ✗ | ✗ | Manual |
Organizational Chart Articles


FAQs About Creately Organizational Chart Maker
What are the types of organizational charts?
How do you create an org chart from Excel data?
What is the purpose of an organizational chart?
What is the difference between a functional and matrix org chart?
What are the uses of an organizational chart?
Can I collaborate with my team using Creately’s org chart maker?
What types of organizational charts can I create with Creately?
What are the most important elements of an org chart?
What are the top tips for creating an effective org chart?
Keep your org chart easy to read by maintaining the right size and breaking large structures into smaller sections. Use consistent shapes and colors to represent roles and departments. Display essential details clearly, and store additional information in notes or data fields to avoid clutter while keeping the chart informative.
For more best practices, refer to our article here.