BCG Matrix Maker
Unlock Growth Insights with Visual Clarity
Take the guesswork out of strategic planning. Use our visual BCG Matrix Creator to assess your competitive landscape and focus your team’s efforts where they’ll deliver the highest return.
- Multiple BCG frameworks to analyze your industry's competitive landscape
- Collaborate in real-time to align key decisions, and map product positions
- Advanced visuals to map your BCG matrix and build strategic plans
Over 10 Million people and 1000s of teams already use Creately

Strategic Planning to Amplify Business Growth
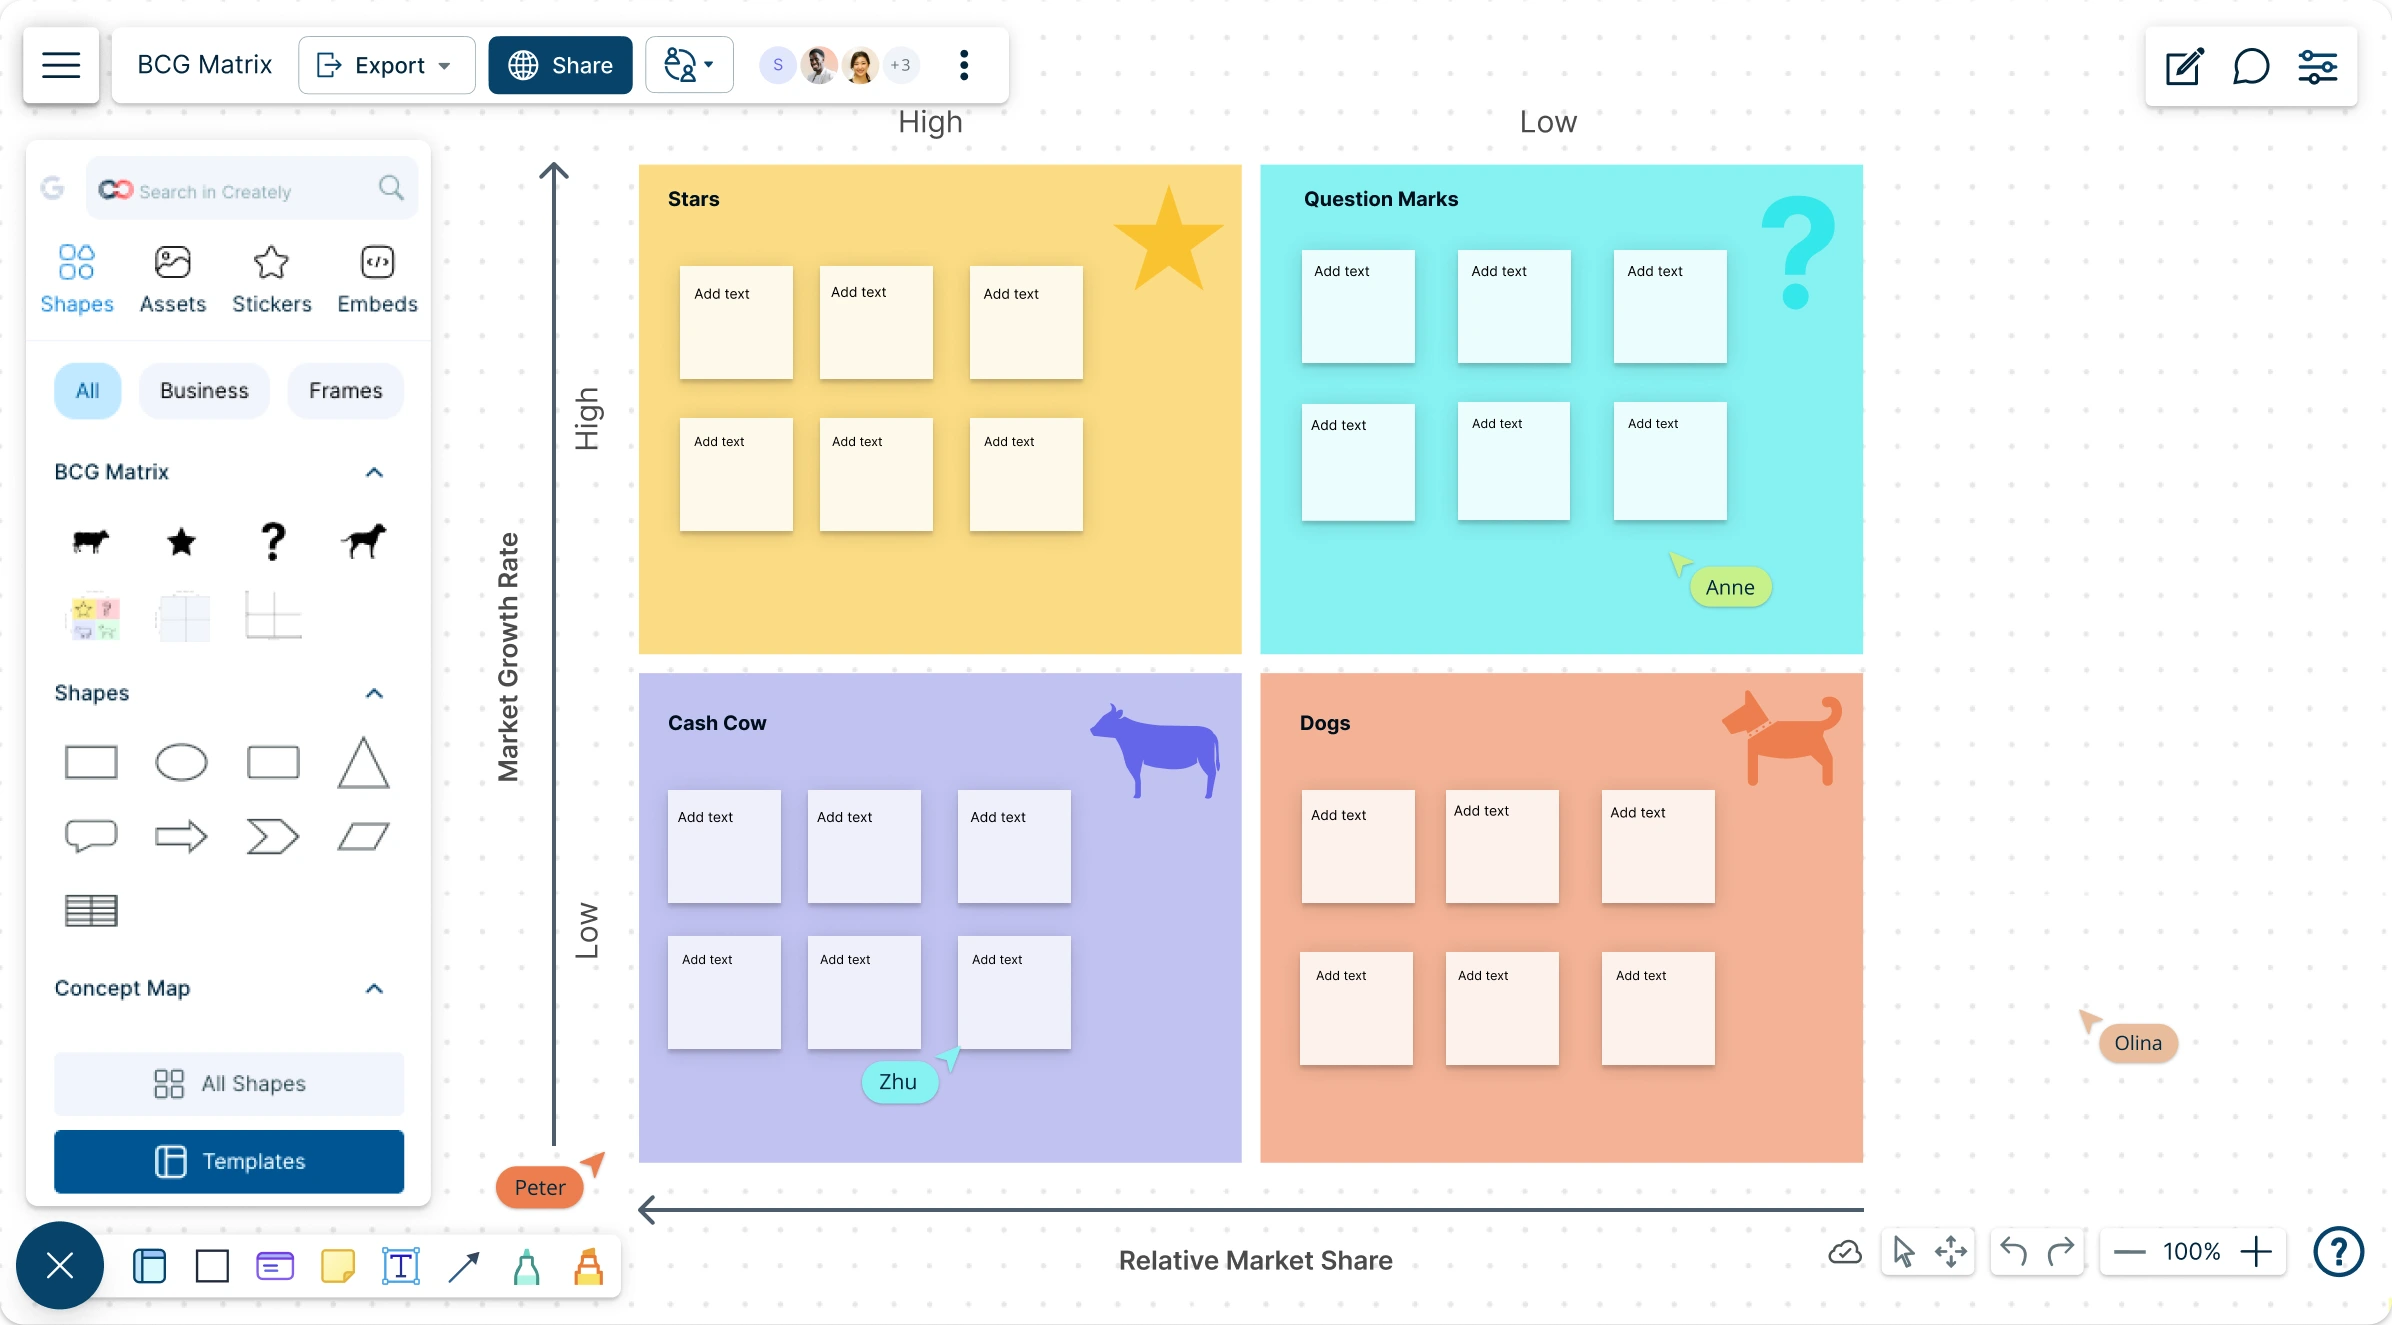
Quickly import your data into Creately’s BCG Matrix Creator to map product performance and market share on one interactive canvas for smarter strategic decisions. With drag-and-drop functionality, you can quickly categorize business units by growth potential and profitability. Add context by attaching documents, links, and notes directly to each item, keeping all relevant information in one place. Intuitive and customizable BCG templates help you structure your strategy clearly and align resources where they’ll deliver the greatest value.
Work Together to Find Great Opportunities

Bring cross-functional teams into a shared canvas to align on strategy and uncover high-impact opportunities. Real-time cursors enable everyone to contribute simultaneously, making it ideal for remote or hybrid strategy sessions. With advanced collaborator controls, you can manage access, streamline reviews, and co-edit your BCG matrix effortlessly. Add contextual comments, track follow-ups, and keep all strategic discussions in one place—right where the decisions are made.

Turn Strategic Insights into Actionable Plans
With a built-in presentation mode, users can turn their BCG matrix into a polished, shareable strategy board—perfect for presenting insights and gaining stakeholder buy-in in just a few clicks. Seamlessly integrate with tools like Slack, Google Workspace, and Confluence to keep your workflow connected. When it’s time to share, export your matrix in SVG, PDF, PNG, or JPEG formats for easy presenting, printing, or collaboration with decision-makers. You can also embed the matrix directly into wikis, dashboards, or documentation to keep strategic planning visible and actionable across the organization.
What is a BCG Matrix Maker?

How to Use the BCG Matrix Maker in Creately?
Choose a BCG Matrix Template:
Start by selecting a professionally designed BCG matrix template from Creately’s template library. Whether you’re analyzing product lines, business units, or market segments, there are multiple layout options available. You can also start from a blank canvas and build your own structure from scratch.Pick the Products and Define the Market:
Choose an area or unit to be analyzed using the BCG matrix. This could be a product line, individual brand or business unit, or the business as a whole. Based on the area you chose for the analysis, define the market. Make sure to pick the most appropriate and relevant market for your unit.Calculate Relative Market Share and Growth Rates:
Calculate the relative market share for the chosen unit, based on market share or revenue. The measurement should be plotted on the x-axis. Estimate the growth rate of the industry with the help of industry growth reports. This measurement should be plotted on the y-axis.Add Your Business Units and Market Data:
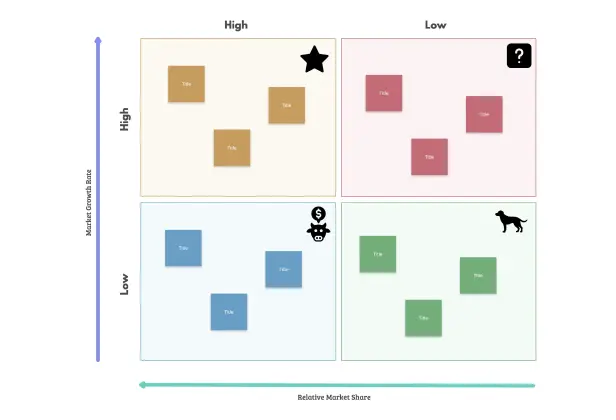
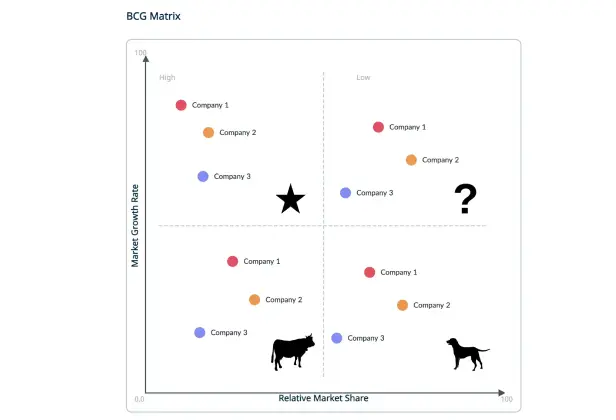
Place the units you are analyzing on the appropriate box in the BCG matrix template, based on their market share and growth. Creately’s BCG templates use standard frameworks that will help you visualize where each unit falls—Stars, Cash Cows, Question Marks, or Dogs. Invest in the products in the Stars quadrant, consider phasing out the Dogs, milk the Cows and allocate experimental funds for the Question Marks.Customize the BCG Matrix to Fit Your Strategy:
Once your BCG template is filled in, you can start tailoring it to your needs. Move items via drag-and-drop, update labels, or change quadrant titles to reflect your internal frameworks. Customize the design with your brand colors, fonts, or additional visual elements to make it presentation-ready.Collaborate & Align in Real-Time:
Invite team members, stakeholders, or clients to work with you on the matrix in real-time. Use live cursors, contextual comments, and collaborative editing to refine strategies together. Control who can edit, view, or comment with detailed permission settings.Present, Export & Share Seamlessly:
Use Creately’s built-in presentation mode to walk through your matrix during meetings or strategy sessions. When ready to share, export it in PDF, PNG, SVG, or JPEG formats—or embed it directly in documents, dashboards, or internal wikis. Version history ensures you can always track changes or revisit past decisions.
Free BCG Matrix Templates to Get Started


FAQs About BCG Matrix Maker
What are Creately’s BCG matrix maker pricing plans?
- Free Plan — $0/month for basic BCG matrix creation and collaboration
- Starter & Team Plans — $8/month or $5/month billed annually
- Business Plan — $149/month or $89/month billed annually
Annual billing helps you save more while unlocking advanced collaboration, workspace management, and enhanced BCG matrix features. You can compare all available plans and features on the Creately Pricing Page.
How can you create BCG matrices faster?
Are there templates for different BCG matrix use cases?
Can teams collaborate on BCG matrices?
Can I add notes, data, and files?
Can I share, present, or export BCG matrices?