Circular Flow Diagram Maker
Identify the Economical Inter-connections in Minutes
Bring in data from any source to create a circular flow diagram to trace interconnections between various elements of an economy.
- Multiple templates to visualize the circular flow model
- Real-time collaboration to connect with multiple participants
- Export your diagram in SVG, PNG, JPEG, or PDF formats to share, publish, or to print

- Multiple templates to visualize the circular flow model
- Real-time collaboration to connect with multiple participants
- Export your diagram in SVG, PNG, JPEG, or PDF formats to share, publish, or to print

Over 10 Million people and 1000s of teams already use Creately


Unlock Creativity, Think Visually

Professional templates to select and quickly get started with the circular flow model.
Advanced styling and color options to color-code and customize the template for your reference.
Draw anything you want based on your business and household relationships.
Dynamic connectors to trace the interconnections between the economy and the elements in it.
Feel Like You are in the Same Room

In-app video and audio calls to connect with your team/s to brainstorm the flow of money to the economy and clarify everything instantly.
The most flexible sharing model with workspace, folder, team, and organizational levels to customize with whom you want to collaborate.
Always in sync, even if you go offline and come back you can continue collaborating with the household and business relationships.
Comment with context, have discussions and follow-ups on the same canvas. Async!
Real-time mouse cursors help everyone work together.


Keep Everything Organized

Folder structures to help you organize the circular flow diagrams in folders and provide access as required.
Full-version history is automatically tracked for all workspaces. Every change is recorded separately. Name the versions as per the date, meeting, or the collaborator.
Bring data as CSV, Excel files, or spreadsheets from any source to visualize them in tables, grids, timelines, tree charts, and more.
Extend your circular flow diagram to include additional contextual information on each step with data fields and custom properties.
Export circular flow diagrams as PNGs, JPEGs, SVGs, or PDFs for printing and publishing or embed them in any site or intranet with a secure link.
What Is a Circular Flow Diagram?
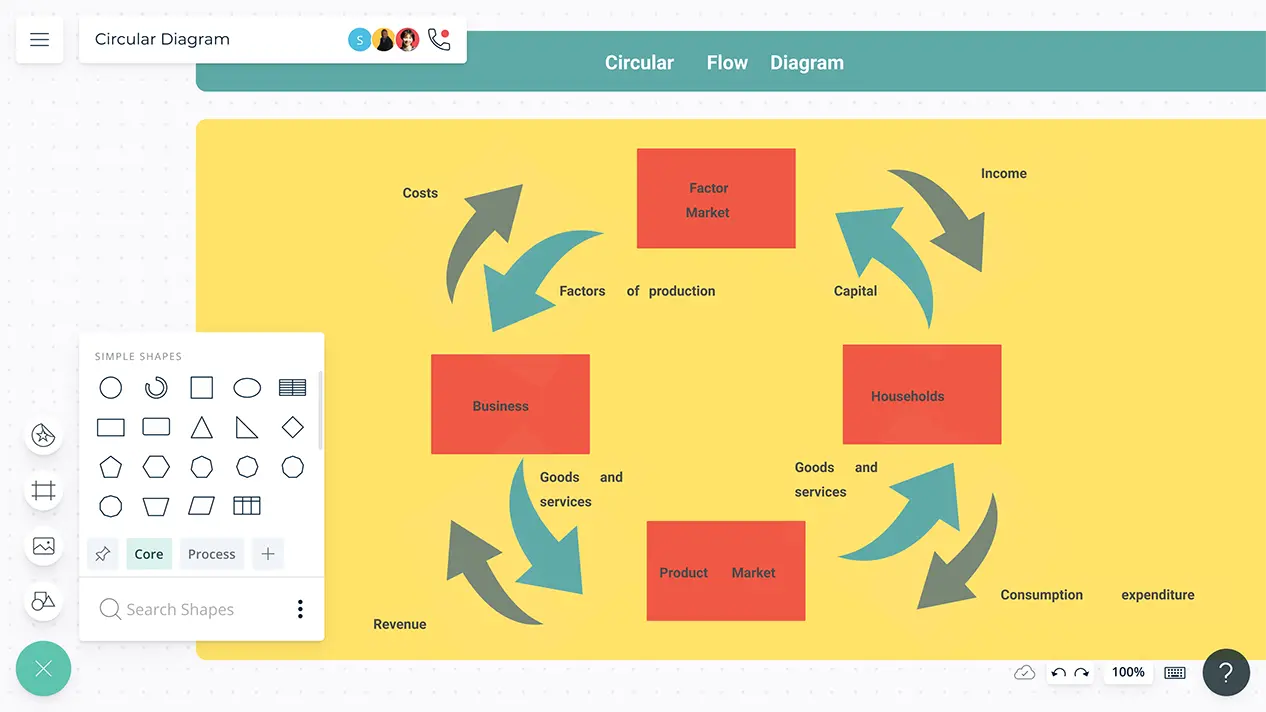
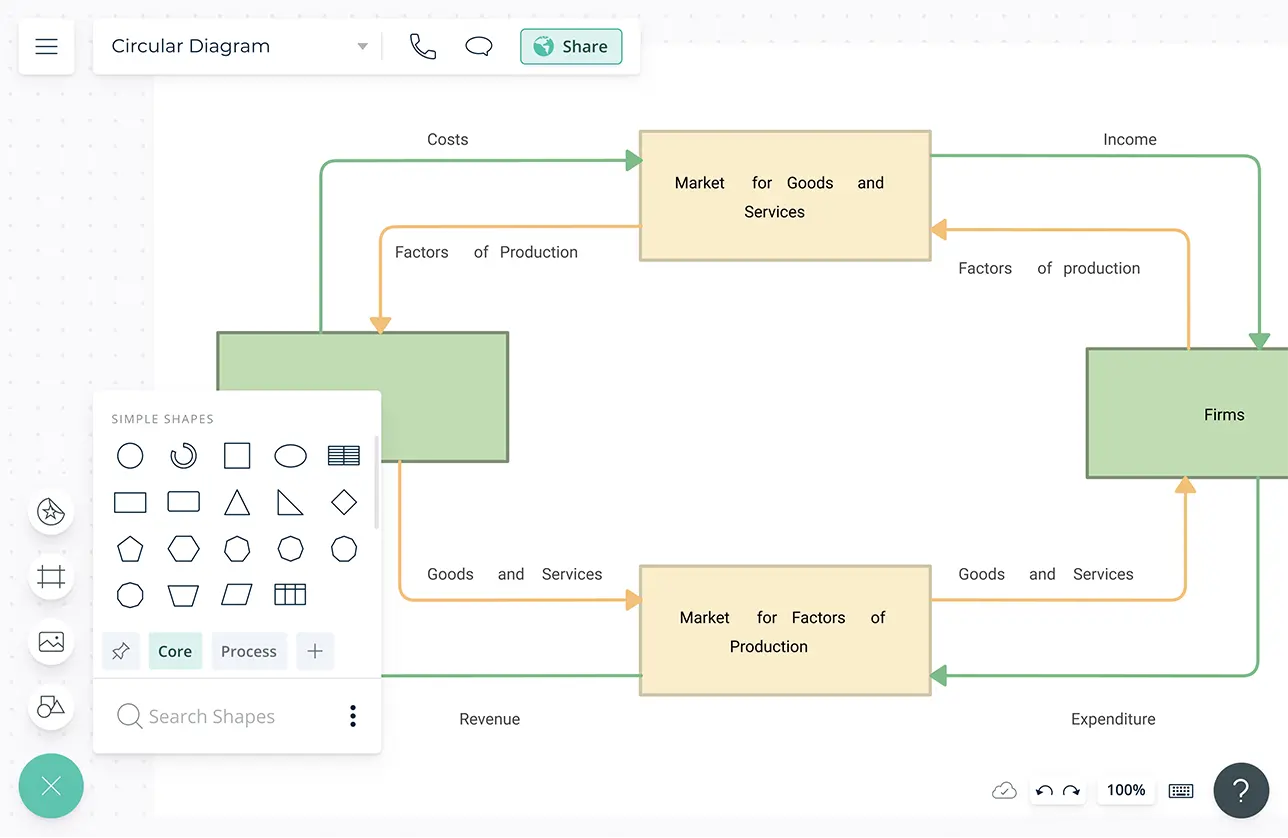
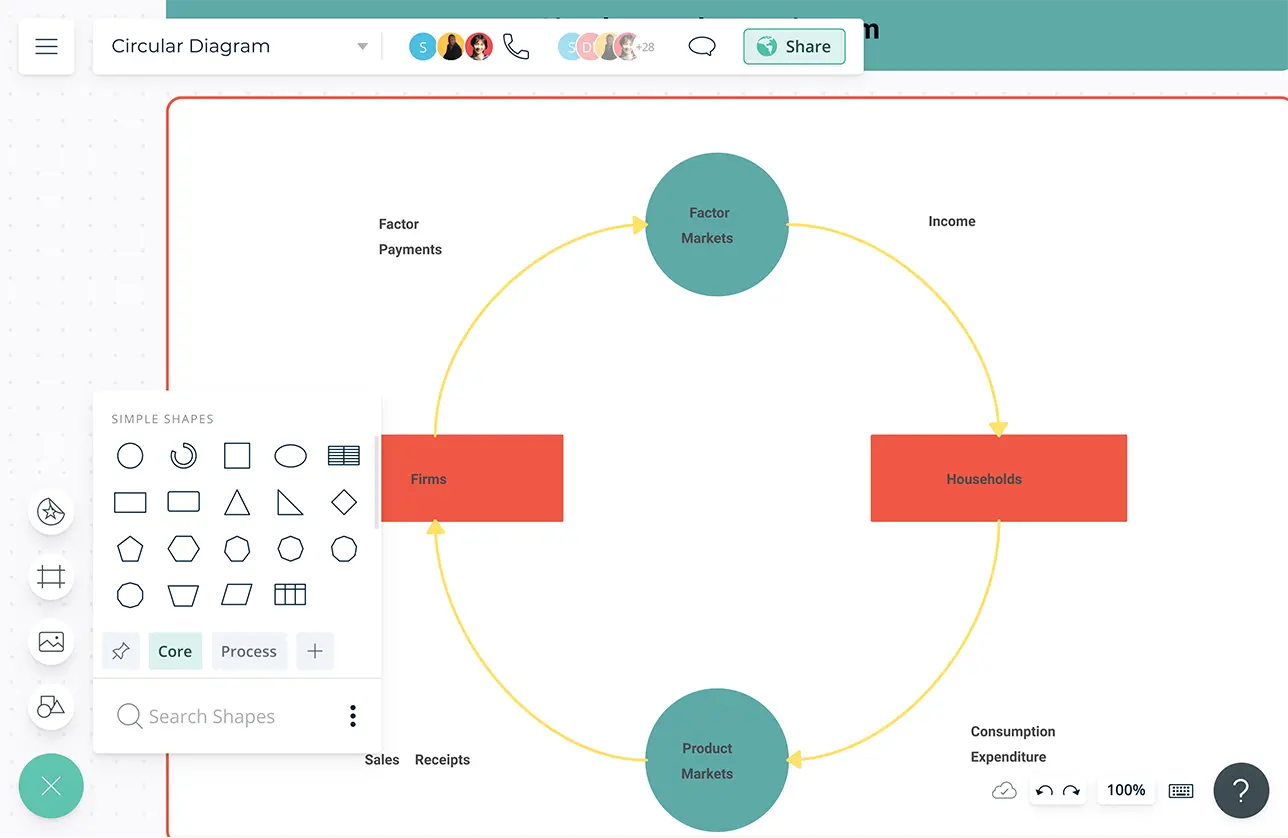
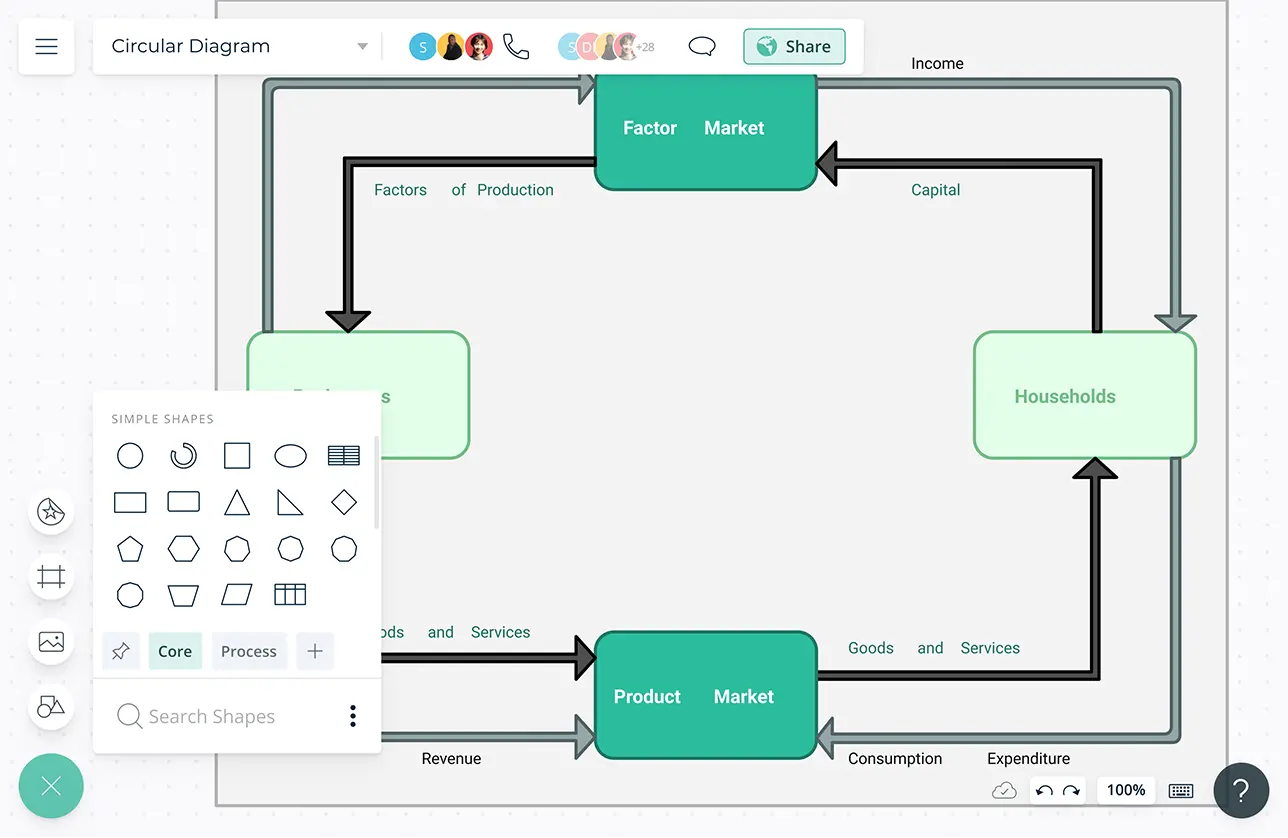
Circular flow diagram is an economic model in which the major exchanges are represented as flows of money, goods, and services. This model helps you determine the condition of the economy for maintaining stability.
How to Draw a Circular Flow Diagram?
- Plan the timeline for information gathering, analyzing, presentation, and sharing. Gather the information you need to create the circular flow diagram. Make sure to collect the information within the planned time frame.
- Create a rough outline of the circular flow diagram by arranging the gathered information in chronological order. This step will also help you filter out the key details from the rest of the researched data.
- Pick a layout for your diagram. Creately has a wide range of professional templates that you can pick to start quickly.
- With Creately, you can quickly style your circular flow diagram with preset color themes. While you can import images, clipart, gifs, logos, icons, etc. to customize your diagram, you can also use the built-in Google image search to find more images.
- Add important information right into the shapes and use them during the presentation via the data panel. Share your diagram with other key stakeholders or team members to gather their feedback with contextual comments on Creately.
