Cladogram Maker
Build Clear Cladograms Faster
Make evolutionary relationships easier to explain by turning species, traits, and shared characteristics into a clean branching diagram. Ideal for biology assignments, classroom lessons, study materials, and research discussions.
- Multiple cladogram & phylogenetic tree templates to start quickly
- Organize species, traits, branches, and ancestors clearly
- Add notes, collaborate, and export as PDF, PNG, SVG, or JPEG


 Diagramming Visual Collaboration Org Chart


How to create a cladogram in Creately?
- Start with a template or shared workspace
Open a cladogram template or create a blank workspace for your class, group project, or research activity.
- Collect and organize your data
List the organisms you want to compare and organize their traits, characteristics, or evidence using tables, sticky notes, or text boxes.
- Identify shared and derived traits
Mark the ancestral and derived traits that help show how organisms are related. Use colors, labels, or notes to make the comparisons easier to follow.
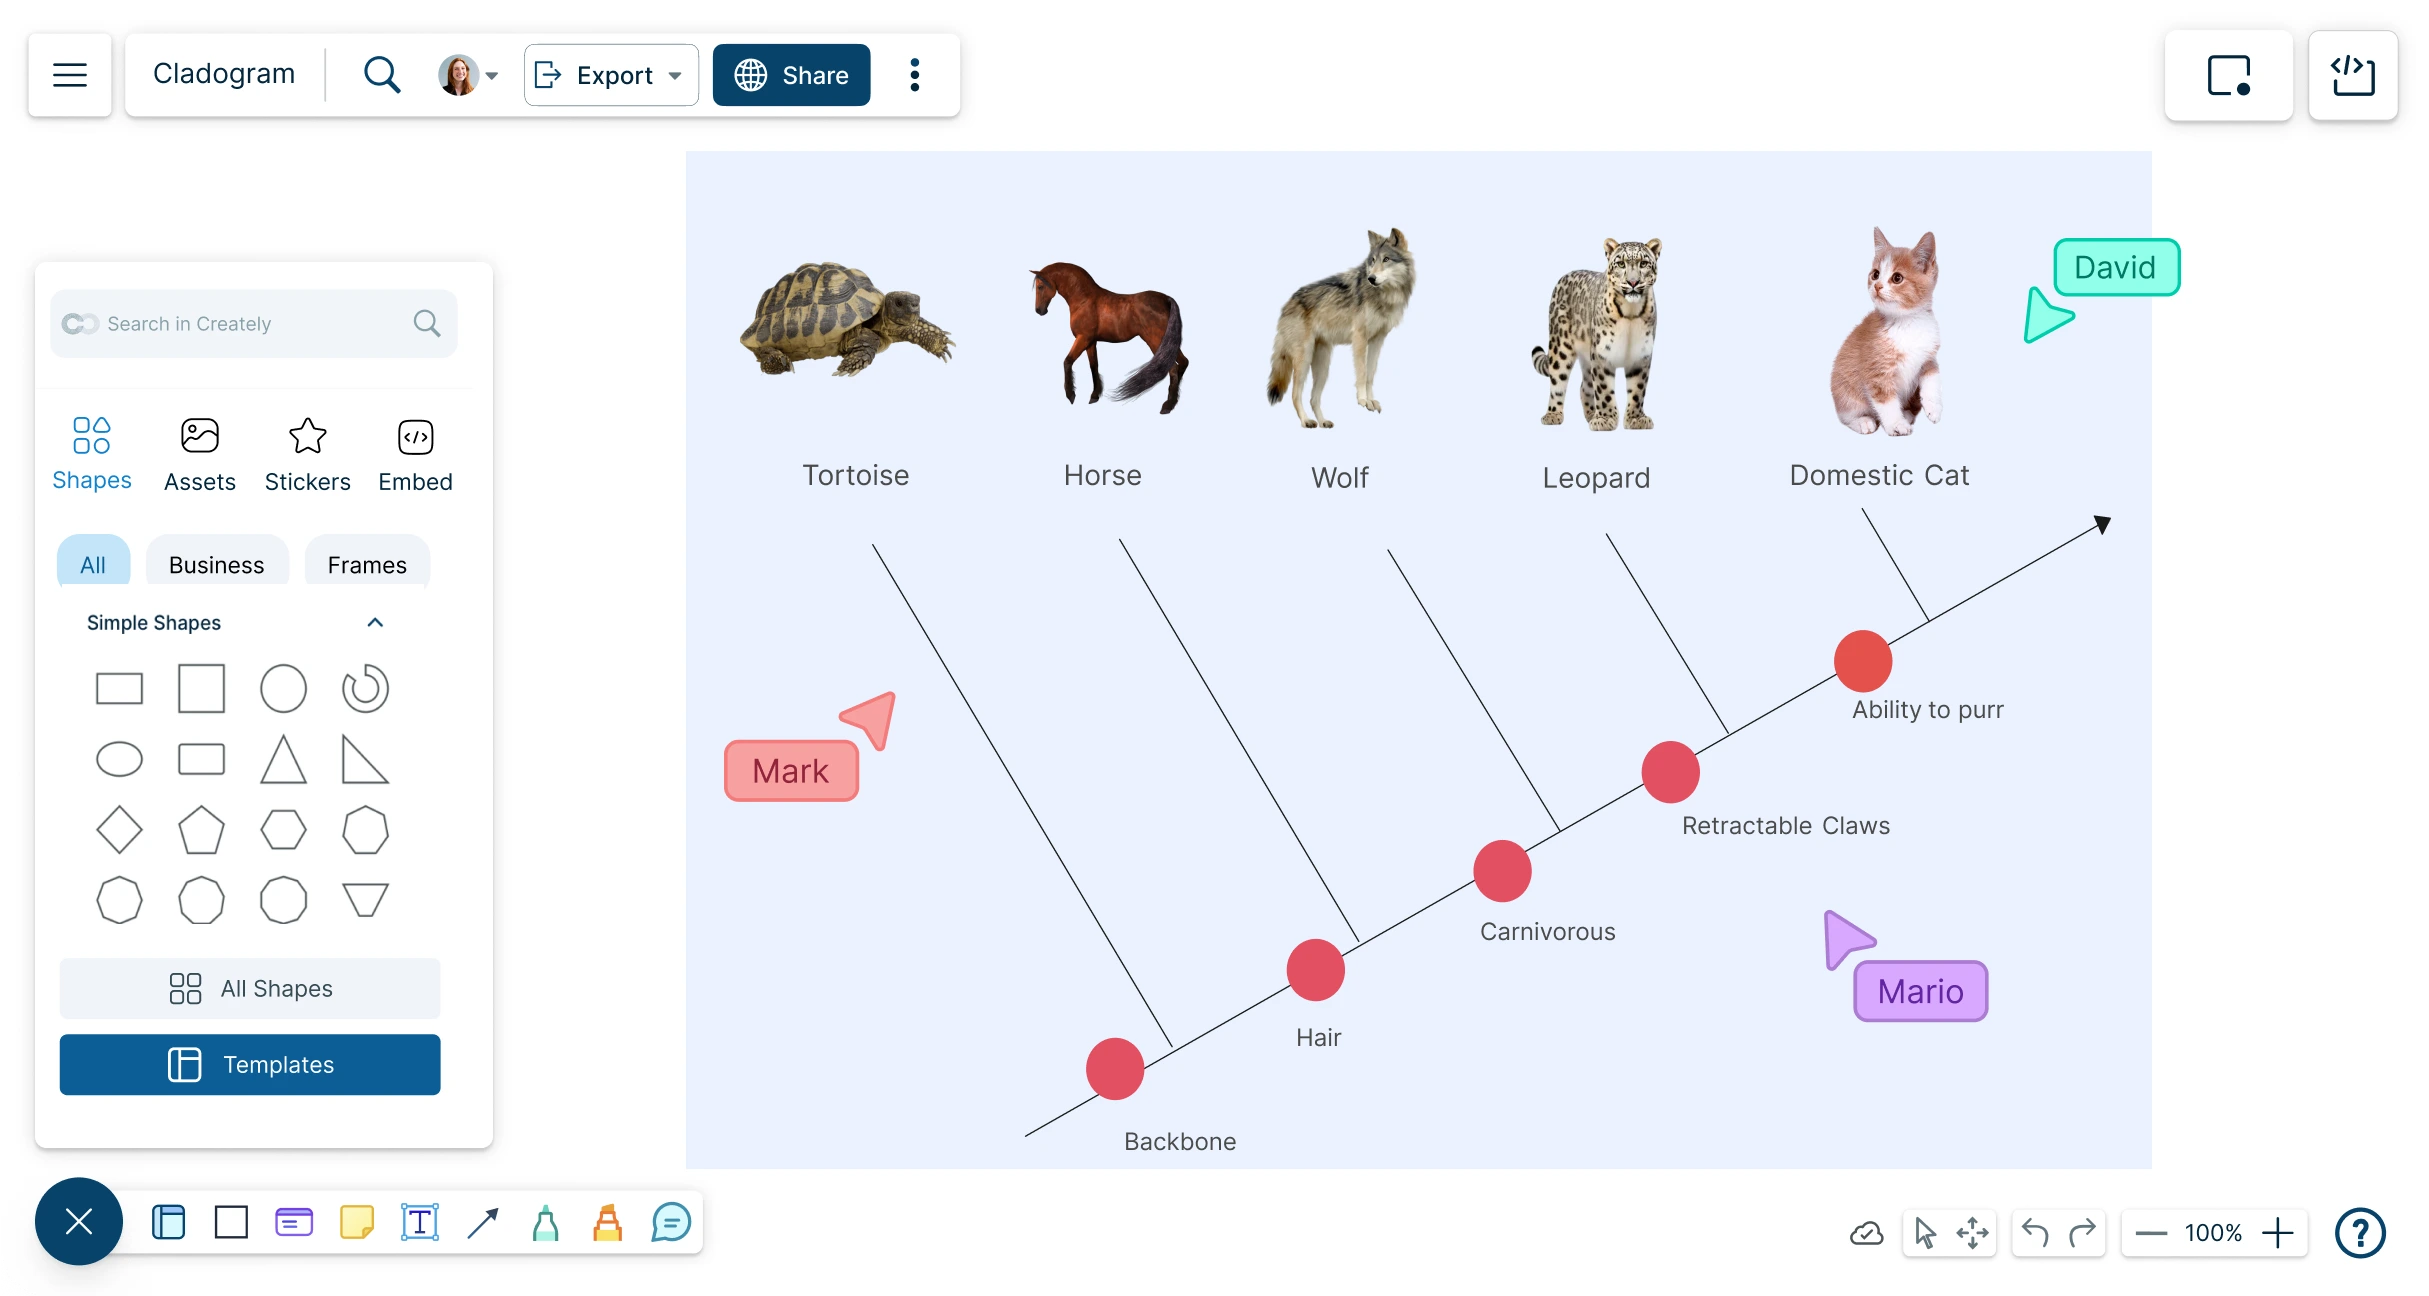
- Build the cladogram
Drag and drop shapes, connect branches, add labels, and include images to show relationships between organisms and common ancestors.
- Review, present, and refine
Add notes to explain your reasoning, invite feedback through comments, present the cladogram using frames, and update the diagram as your understanding improves.
Build Cladograms That Are Easy to Follow

Cladograms can quickly become confusing when organisms, traits, and branches are spread across notebooks, worksheets, or research files. A visual workspace helps students, teachers, and researchers arrange everything clearly before turning it into a polished cladogram.
Start with cladogram templates instead of building from a blank page.
Use drag-and-drop shapes and connectors to create clean branching diagrams.
Add labels for species, traits, common ancestors, and branch points.
Customize colors, text, spacing, and layout to make relationships easier to read.

Keep Species, Traits, and Research Data in One Place
Cladistic analysis is easier when your organisms, traits, notes, and references are not scattered across separate files. Use one visual workspace to compare characteristics, group organisms, and keep supporting information connected to the diagram.
Organize organisms and characteristics using tables, sticky notes, and visual groups.
Group species based on shared characteristics before building the cladogram.
Add notes, links, files, and references to specific organisms or branch points.
Use frames and presentation mode to walk through each part of the cladogram step by step.
Review Cladograms With Students, Teachers, or Research Partners

Cladograms are easier to improve when others can check the logic, question branch choices, or add missing information. Shared review helps groups refine the diagram and explain their reasoning more clearly.
Work with students, classmates, teachers, or researchers on a shared canvas.
Use real-time cursors to see what others are editing during group work or review.
Add comments and @mentions to discuss traits, branches, and relationship choices.
Share the cladogram for feedback, presentation, or final review.
What Can You Create With Creately’s Cladogram Maker?
- Classroom Cladograms:
Create simple cladograms for biology lessons, worksheets, group projects, and classroom discussions. Students can compare organisms, identify shared traits, and explain their reasoning visually.
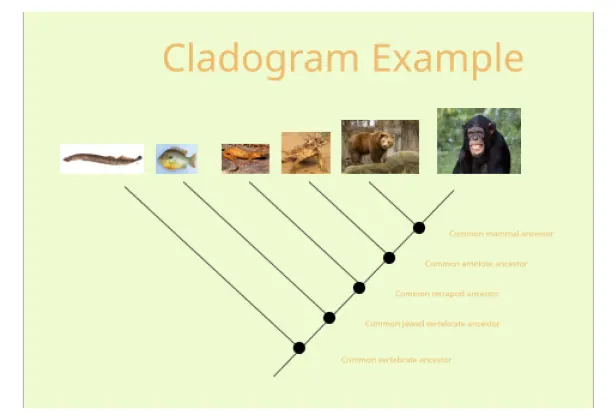
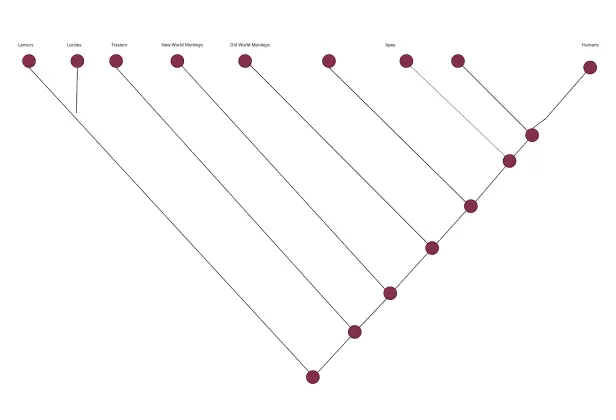
- Evolutionary Relationship Diagrams:
Show how species or groups are connected through shared characteristics and common ancestors. Use labels and connectors to make each branching point easier to understand.
- Trait Comparison Diagrams:
Organize organisms by physical features, adaptations, genetic similarities, or derived characteristics before building the final cladogram.
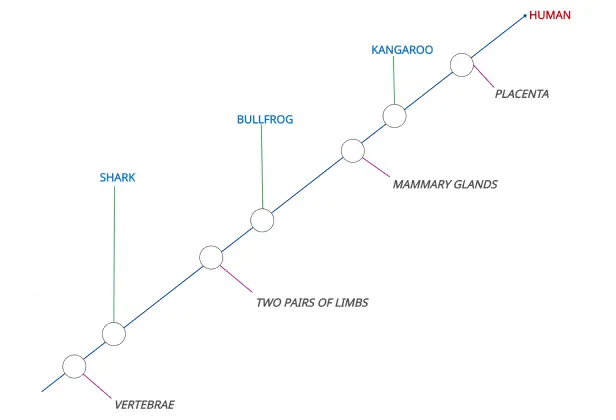
- Phylogenetic Tree-Style Visuals:
Create tree-like diagrams that help explain relationships between organisms, species groups, or biological classifications.
- Research And Study Diagrams:
Bring notes, images, references, and observations into one visual workspace so learners and researchers can connect evidence to the diagram as they work.
- Presentation And Report Visuals:
Turn cladograms into polished visuals for lab reports, class presentations, research summaries, posters, and teaching materials.
Create Your Cladogram with Free Editable Templates

FAQs About Creately’s Cladogram Maker
What are Creately’s free cladogram maker pricing plans?
- Free Plan — $0/month for basic cladogram creation and collaboration
- Starter & Team Plans — $8/month or $5/month billed annually
- Business Plan — $149/month or $89/month billed annually
Annual billing helps you save more while unlocking advanced collaboration, workspace management, and enhanced cladogram features. You can compare all available plans and features on the Creately Pricing Page.
How can you create cladograms faster?
Are there templates for different cladogram use cases?
Can teams collaborate on cladograms?
Can I add notes, data, and files?
Can I share, present, or export cladograms?
What is a Cladogram?