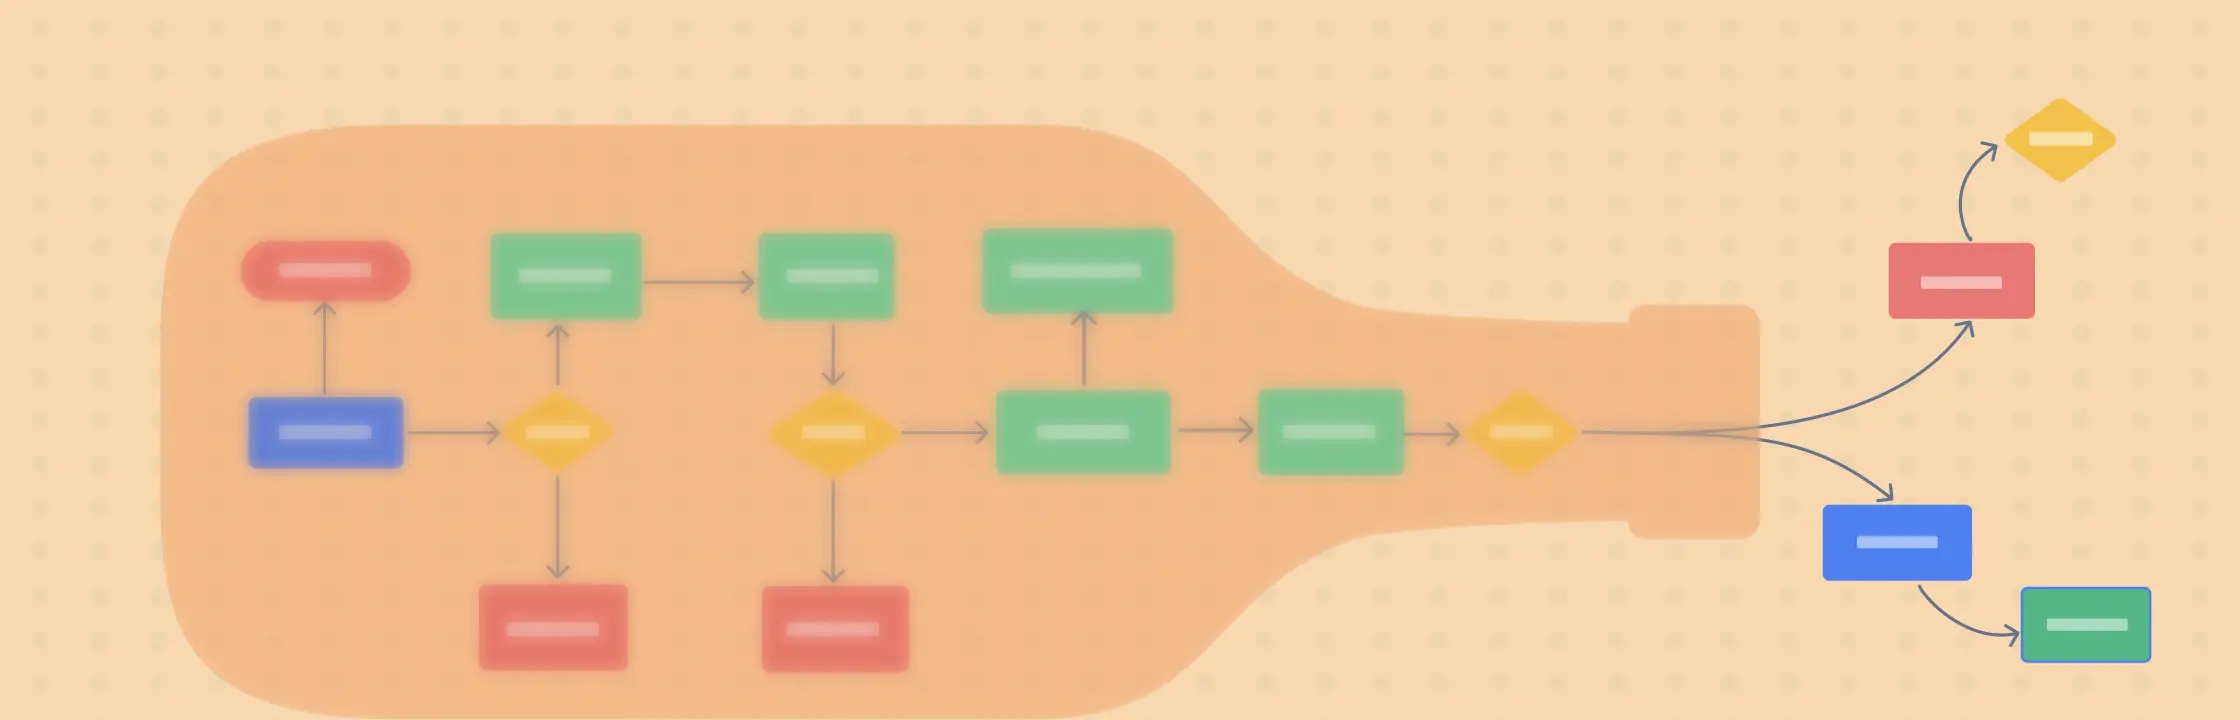
A process bottleneck occurs when one step has less capacity than the demand placed on it, restricting the flow and performance of the entire workflow. Bottlenecks can increase cycle time, create queues, delay handoffs, raise costs, and reduce the quality of the final outcome.
This guide explains how to identify bottlenecks using process data and visual frameworks, distinguish common bottleneck types, resolve the underlying constraint, and monitor the improved process so the problem does not recur.
What is a Bottleneck in a Process?
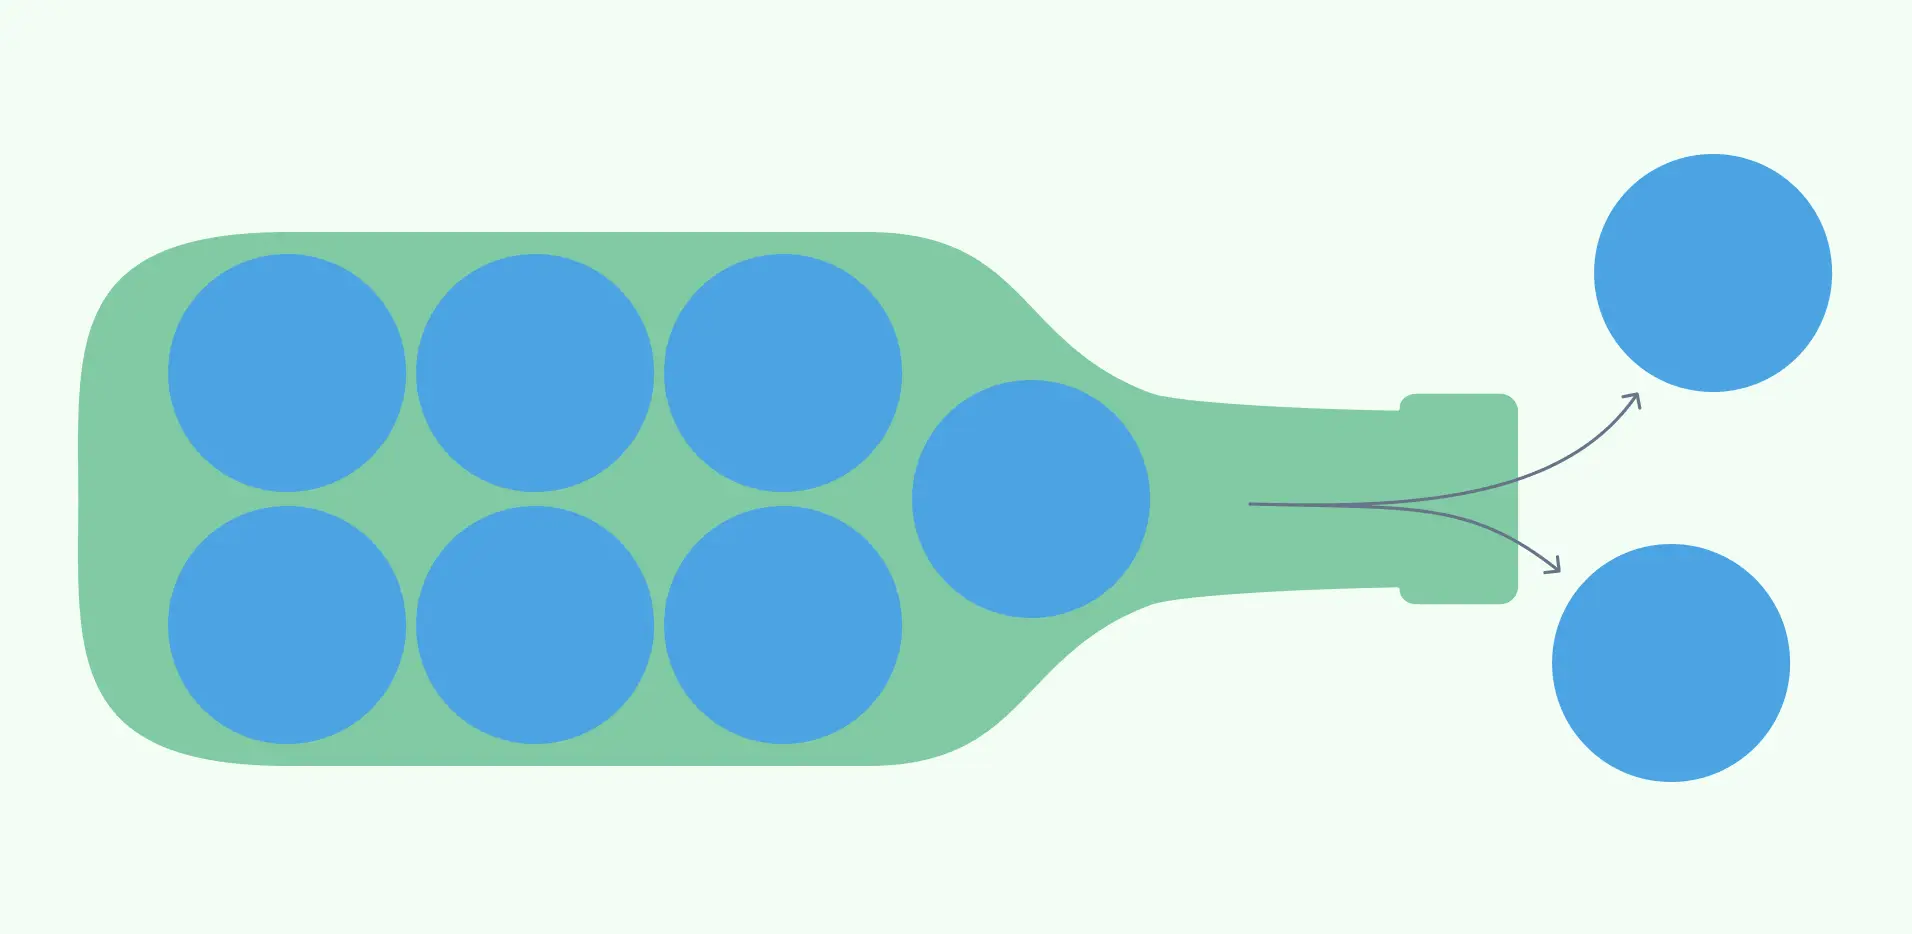
A bottleneck is a point in a process where the flow of work is slowed down or stopped by an obstacle or constraint. It can cause delays, waste, frustration and lower quality in your project outcomes. Bottlenecks can occur in any type of process, whether it is manufacturing, service, creative or administrative.
Some common examples of bottlenecks are:
- Slow approval process that delays the launch of a new product
- Limited budget that restricts the scope of a project
- High turnover rate that affects the continuity of a team
- Lack of feedback that hinders the improvement of a service
In this post, we will cover the following topics:
- How to Identify a Bottleneck in a Process
- Visual Frameworks to Identify Bottlenecks
- Types of Bottlenecks in Work Processes
- Techniques to Resolve a Bottleneck in the Process
- Wrapping Up
How to Identify a Bottleneck in a Process
Use the following steps to identify the constraint that is limiting the performance of a process:
- Map the process as it actually operates: Capture every step, decision, queue, rework loop, and handoff. Validate the map with the people who perform the work instead of relying only on the documented procedure.
- Establish baseline measures: Record cycle time, wait time, queue length, throughput, work in progress, resource utilization, defect rate, and rework where those measures are relevant.
- Find where demand exceeds capacity: Look for the stage with persistent queues, long waits, high utilization, repeated escalations, or work that regularly arrives faster than it can be completed.
- Confirm the root cause: Use observations, stakeholder feedback, the 5 Whys, a fishbone diagram, or a Pareto chart to distinguish the true constraint from symptoms elsewhere in the workflow.
- Measure the constraint over time: A one-time delay may be an exception rather than a recurring bottleneck. Compare performance across normal periods, demand peaks, and different work types before choosing an intervention.
Visual Frameworks to Identify Bottlenecks
Visualizing the workflow makes queues, repeated work, overloaded roles, and delayed handoffs easier to investigate. The right framework depends on whether you need a simple view of the sequence, responsibility across teams, or detailed time and waste analysis.
Flowchart
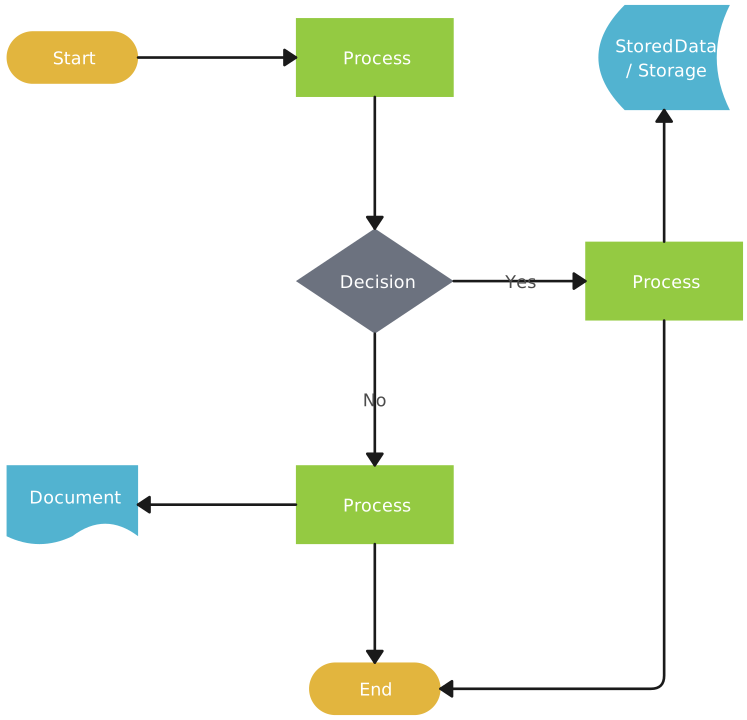

A flowchart shows the sequence of activities and decisions from start to finish. Add cycle time, wait time, queue size, or error data beside each step, then look for stages where work accumulates or repeatedly loops backward.
Swimlane Diagram
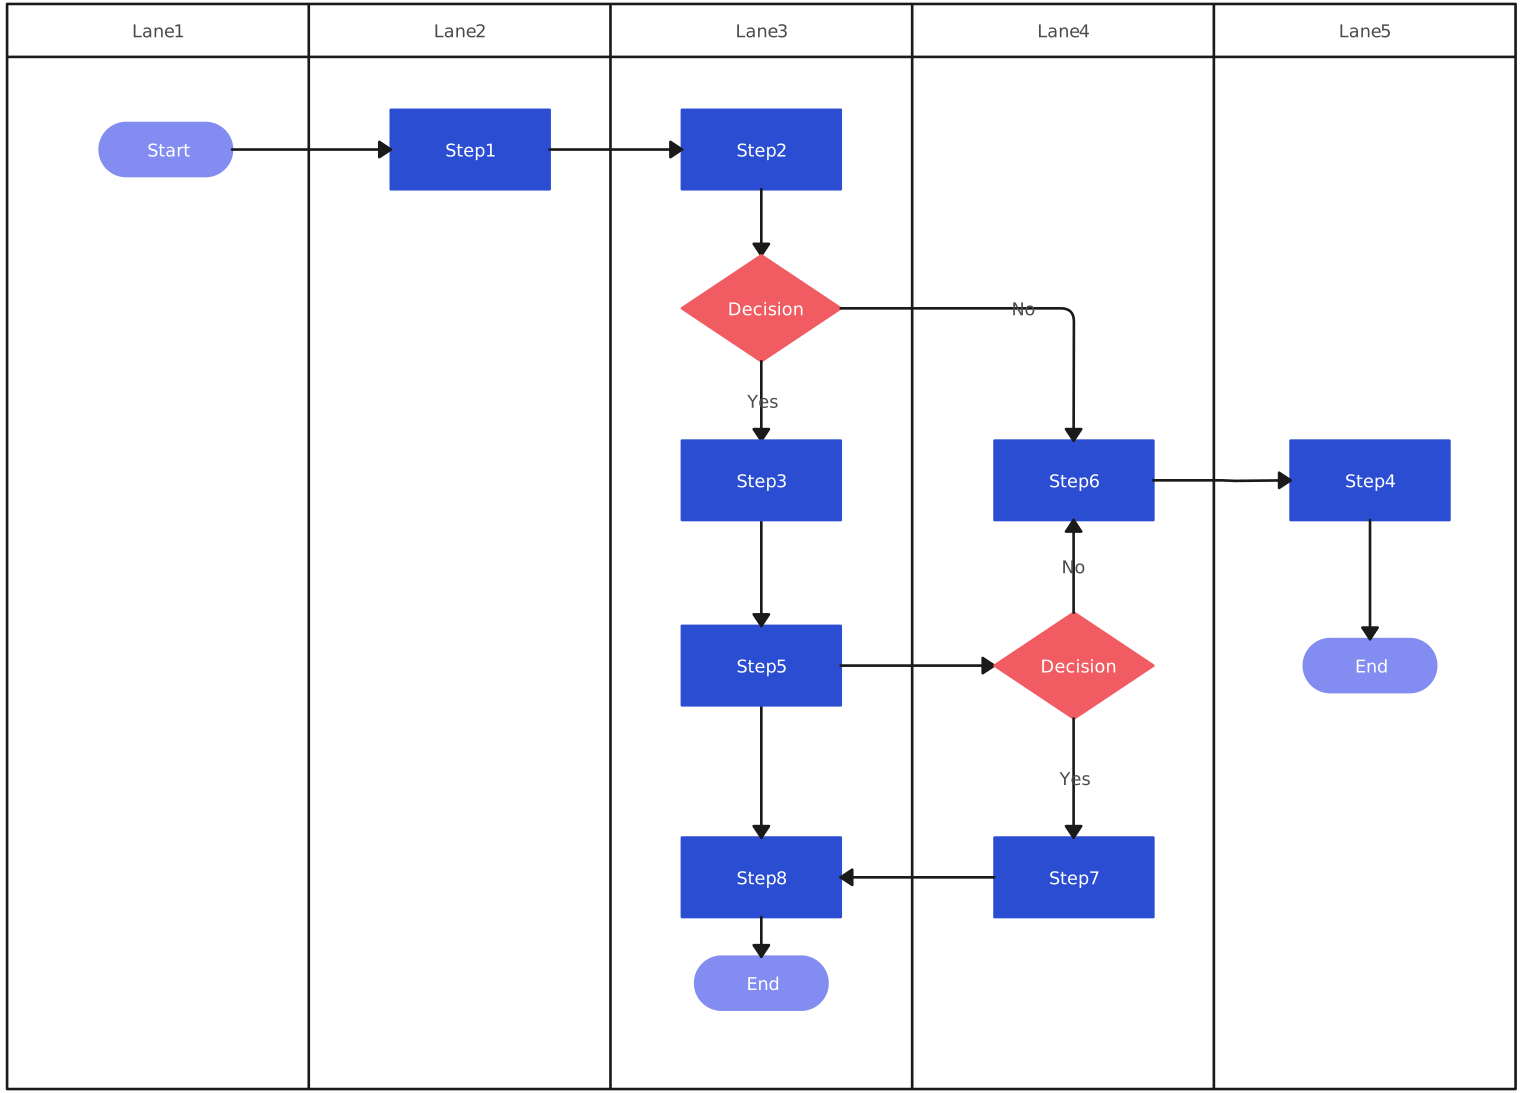
A swimlane diagram groups steps by role, team, or system. It is particularly useful for finding cross-functional bottlenecks because it exposes frequent handoffs, unclear ownership, duplicated approvals, and delays between departments.
Value Stream Map
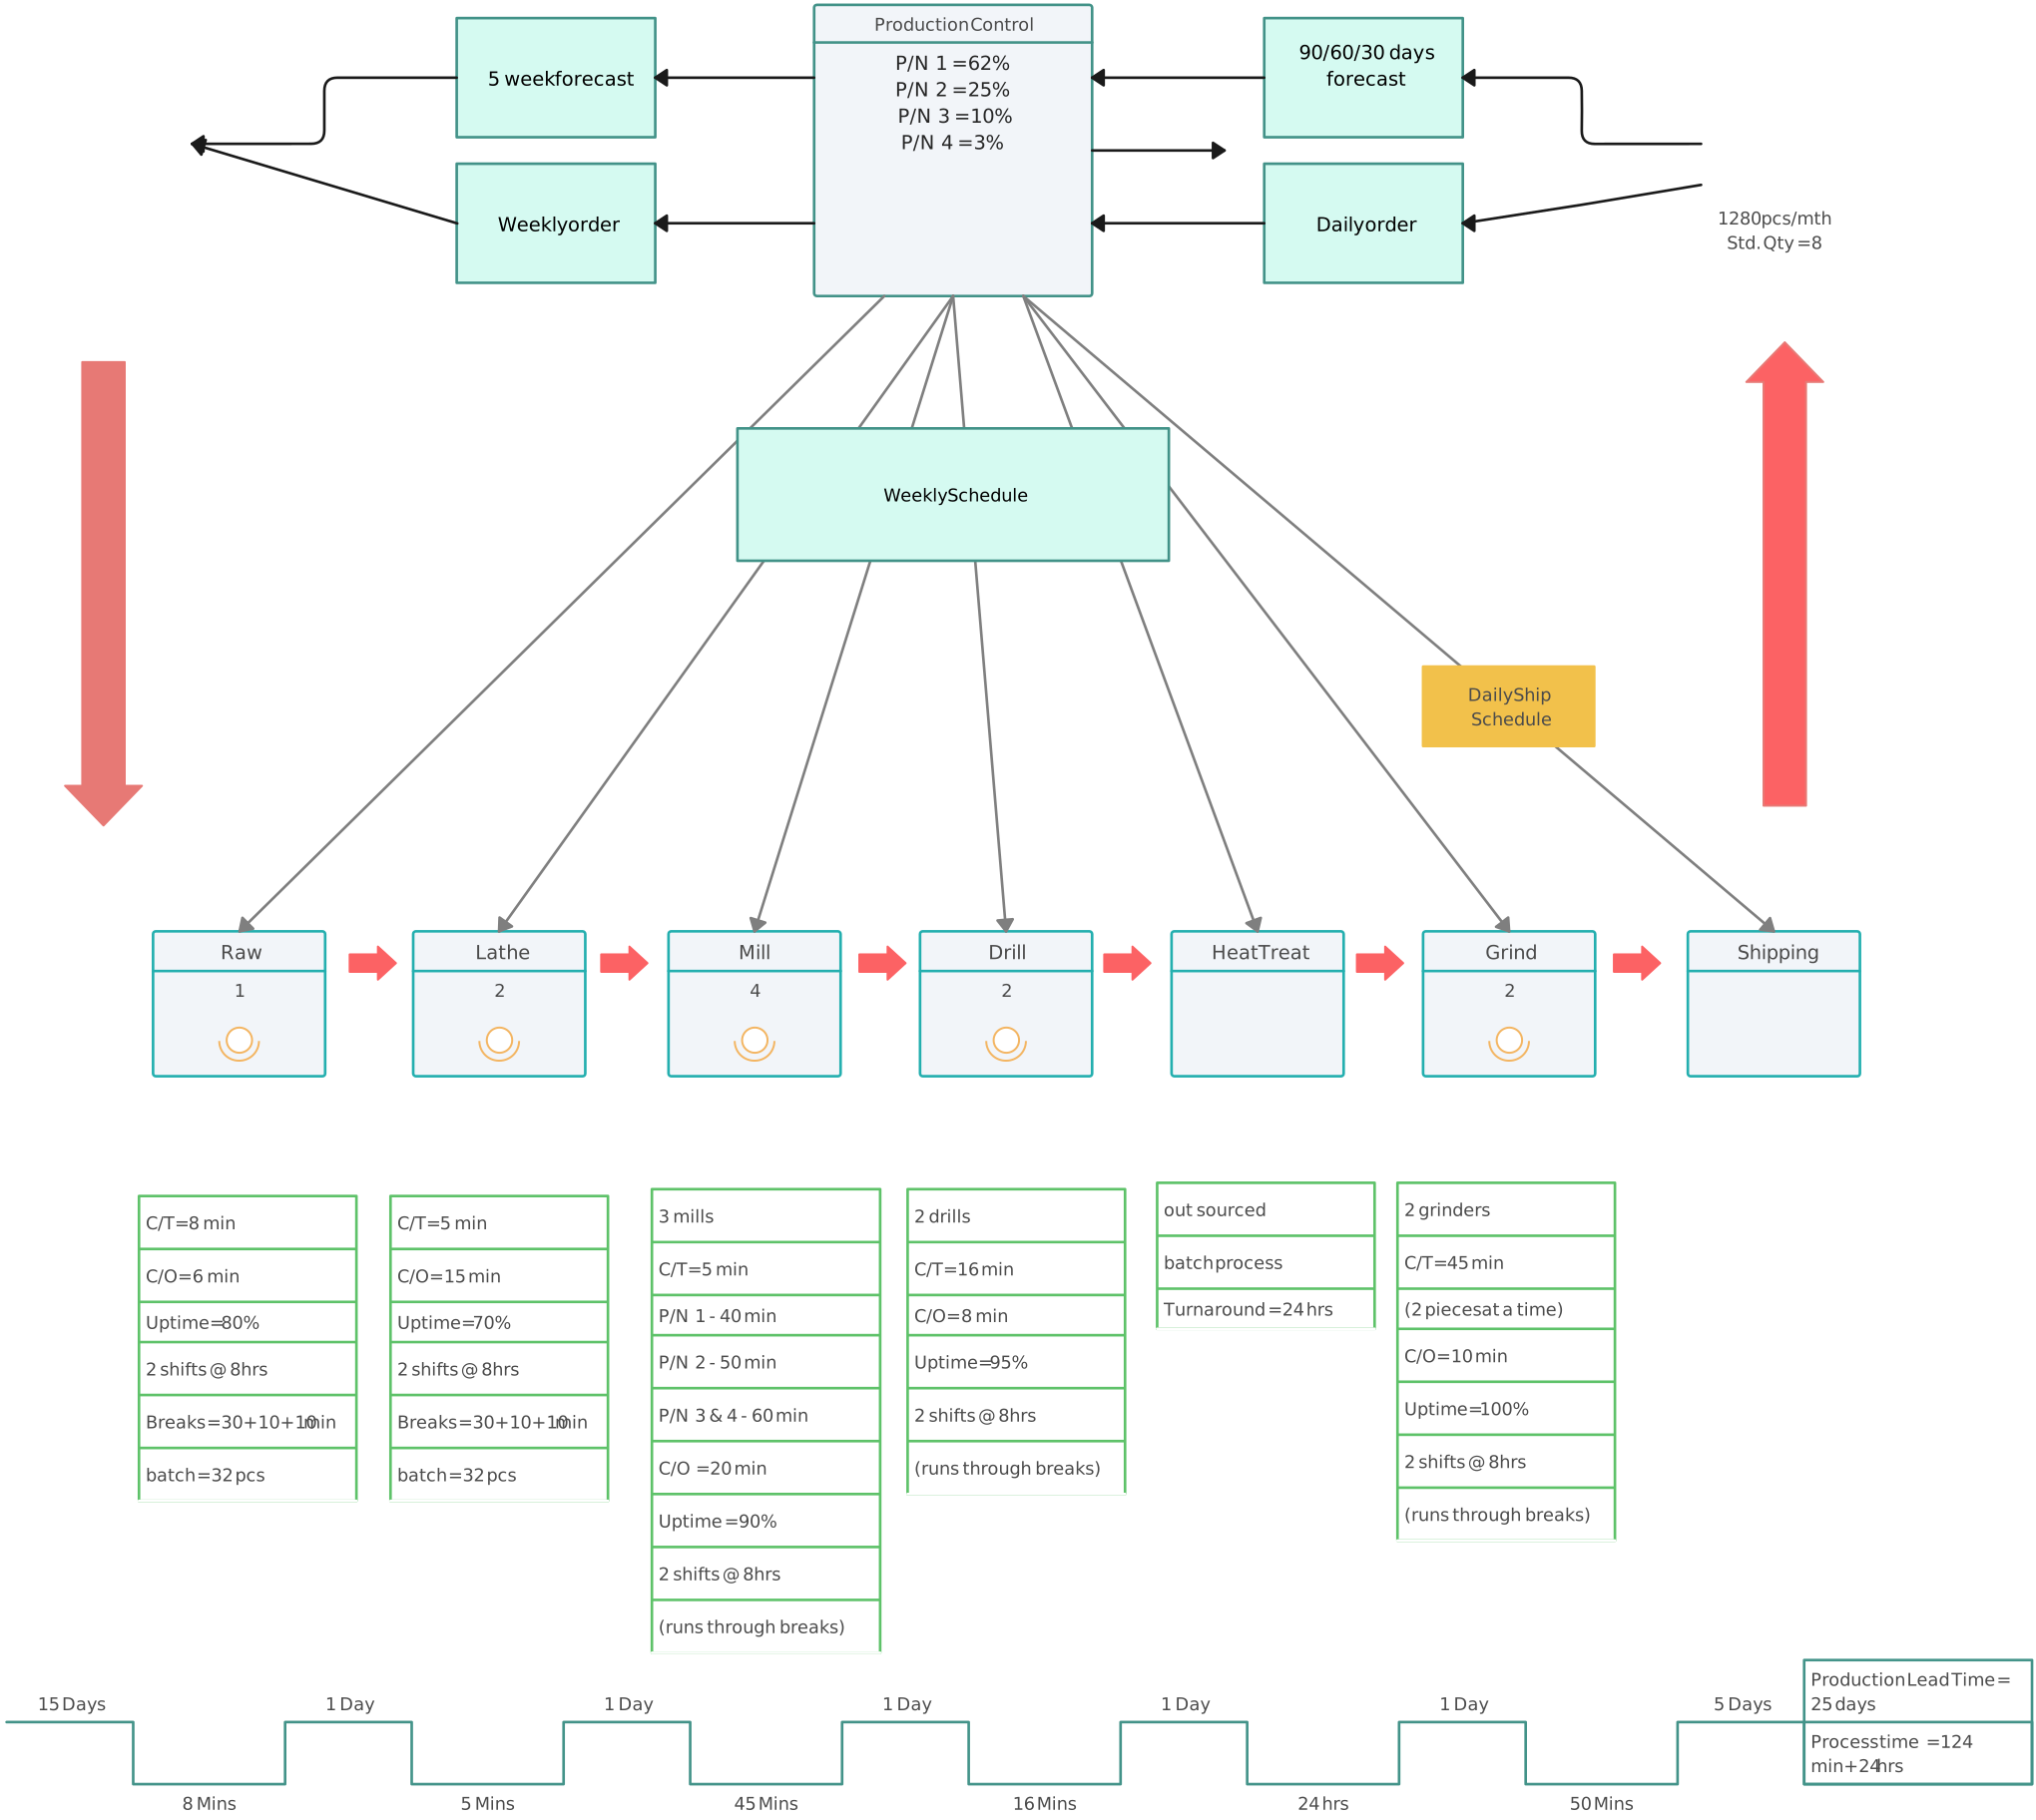
A value stream map separates value-adding work from waiting and other waste. Comparing process time with lead time helps reveal whether the main constraint is the work itself or the queue before it.
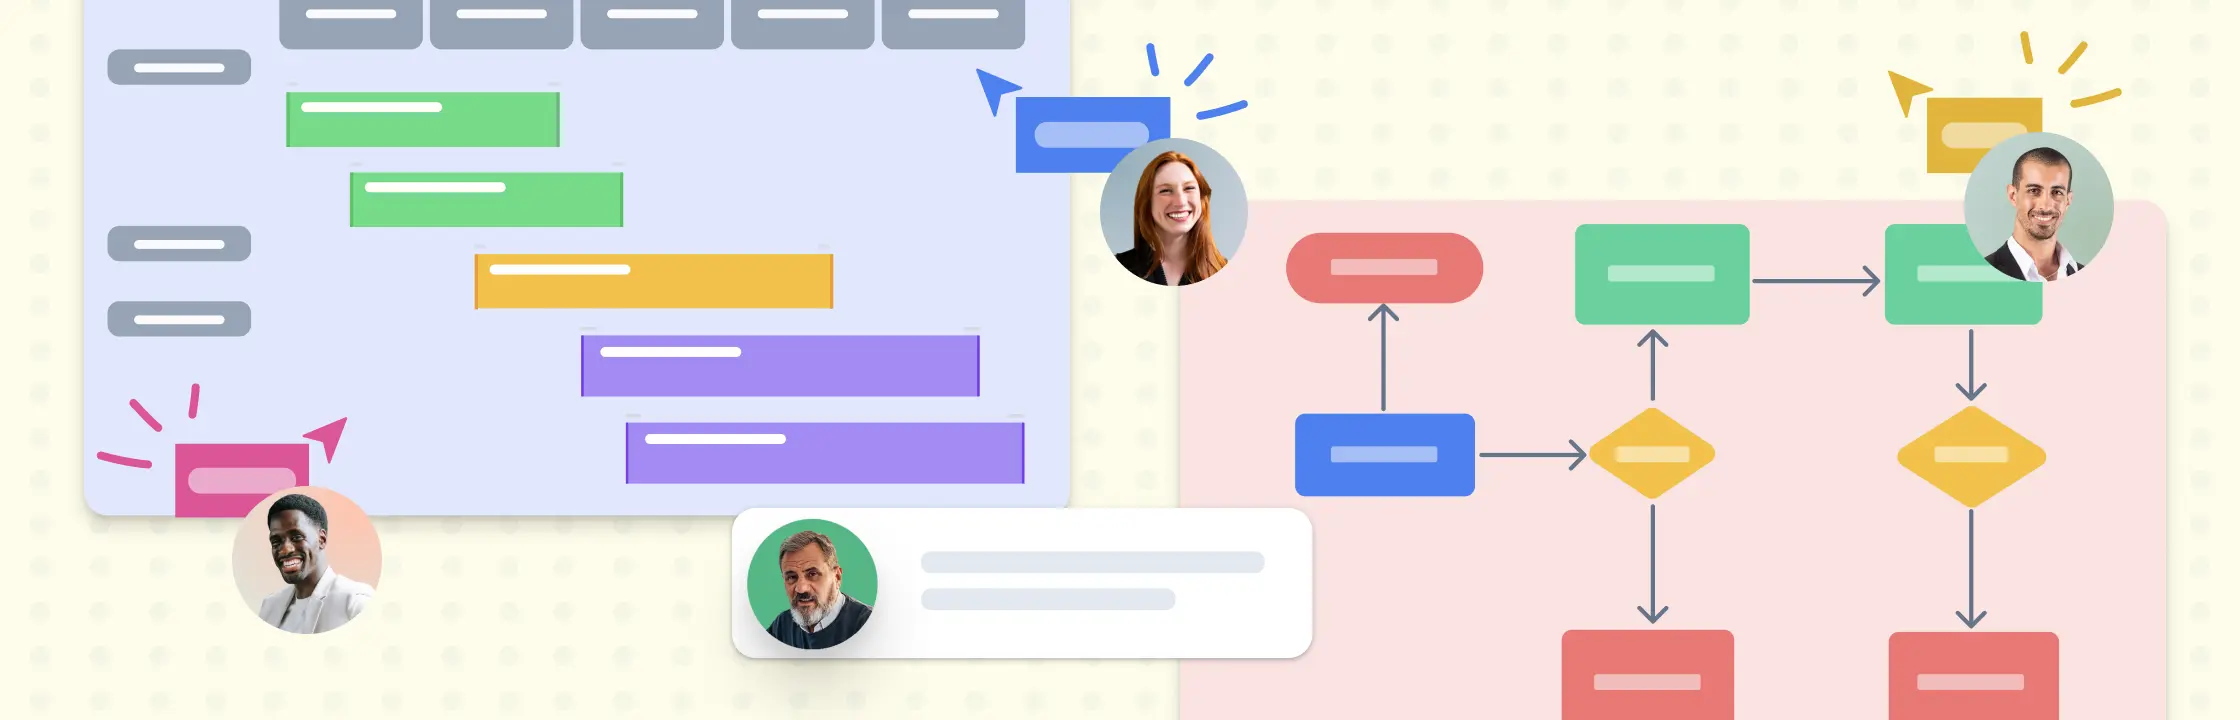
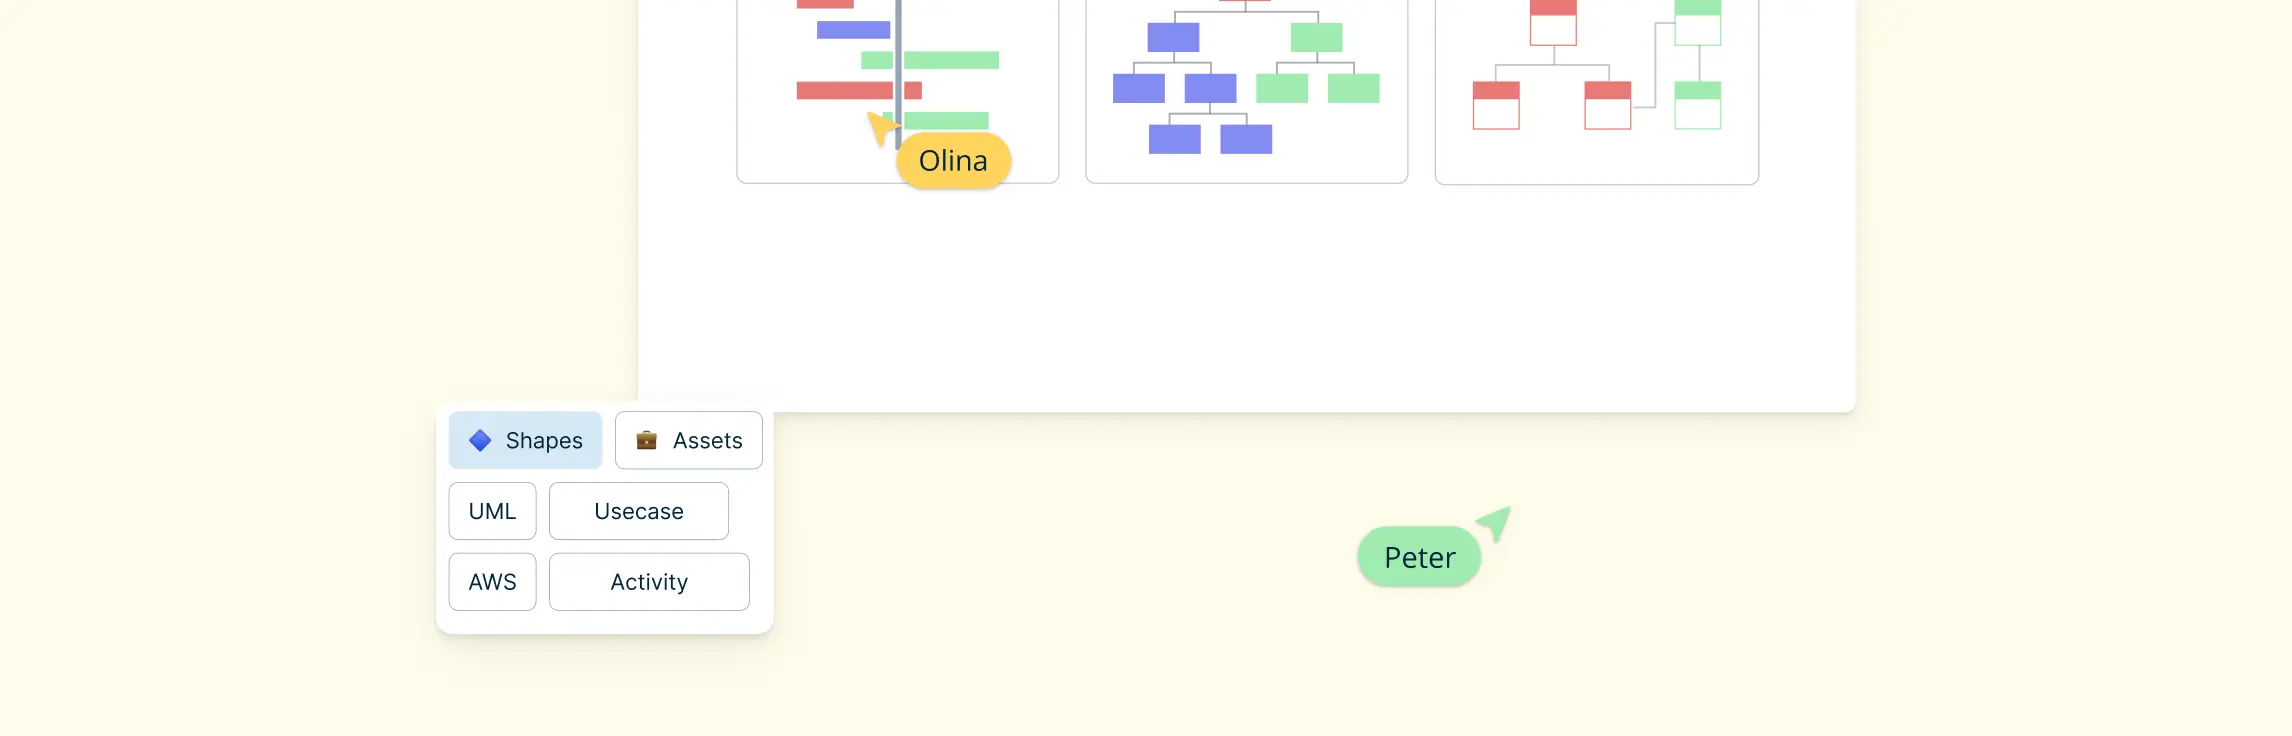
With Creately’s process mapping software, teams can map the current flow with flowchart or BPMN notation and add structured details such as owners, duration, status, SLA, trigger type, systems, tags, and linked subprocesses to relevant steps. Real-time editing and threaded comments help the people involved review the map, clarify handoffs, and keep feedback beside the workflow while the accountable owner updates the process documentation.
Types of Bottlenecks in Work Processes
There are different types of bottlenecks that can affect your work processes, such as:
Resource bottlenecks: These occur when there is a lack of resources, such as people, equipment, materials or space, to complete a task or process. For example, if you have only one printer for a large team, it can create a bottleneck when everyone needs to print their documents.
Capacity bottlenecks: These occur when there is a mismatch between the demand and the supply of a task or process. For example, if you have more orders than you can fulfill, it can create a bottleneck in your production or delivery process.
Skill bottlenecks: These occur when there is a gap in the knowledge, skills or abilities of the people involved in a task or process. For example, if you have a complex task that requires specialized expertise, but you don’t have enough qualified staff to handle it, it can create a bottleneck in your project.
Communication bottlenecks: These occur when there is a breakdown or delay in the exchange of information, feedback or instructions among the people involved in a task or process. For example, if you have poor communication channels, unclear roles and responsibilities, or conflicting expectations among your team members, it can create a bottleneck in your collaboration.
Bottlenecks can also be short-term or chronic. A short-term bottleneck may result from an unusual demand spike, an absent specialist, or temporary equipment failure. A chronic bottleneck persists under normal operating conditions because the process design, capacity, ownership, or policy repeatedly restricts flow. This distinction matters: temporary constraints may need contingency planning, while chronic constraints usually require process redesign or additional capacity.
Techniques to Resolve a Bottleneck in the Process
Once you have verified the constraint and its cause, address it in a controlled sequence:
- Reduce avoidable work at the bottleneck: Remove redundant checks, prevent defects from reaching the constrained step, standardize inputs, and move suitable preparation work elsewhere. Use the 5 Whys and fishbone diagrams to test the cause before changing the workflow.
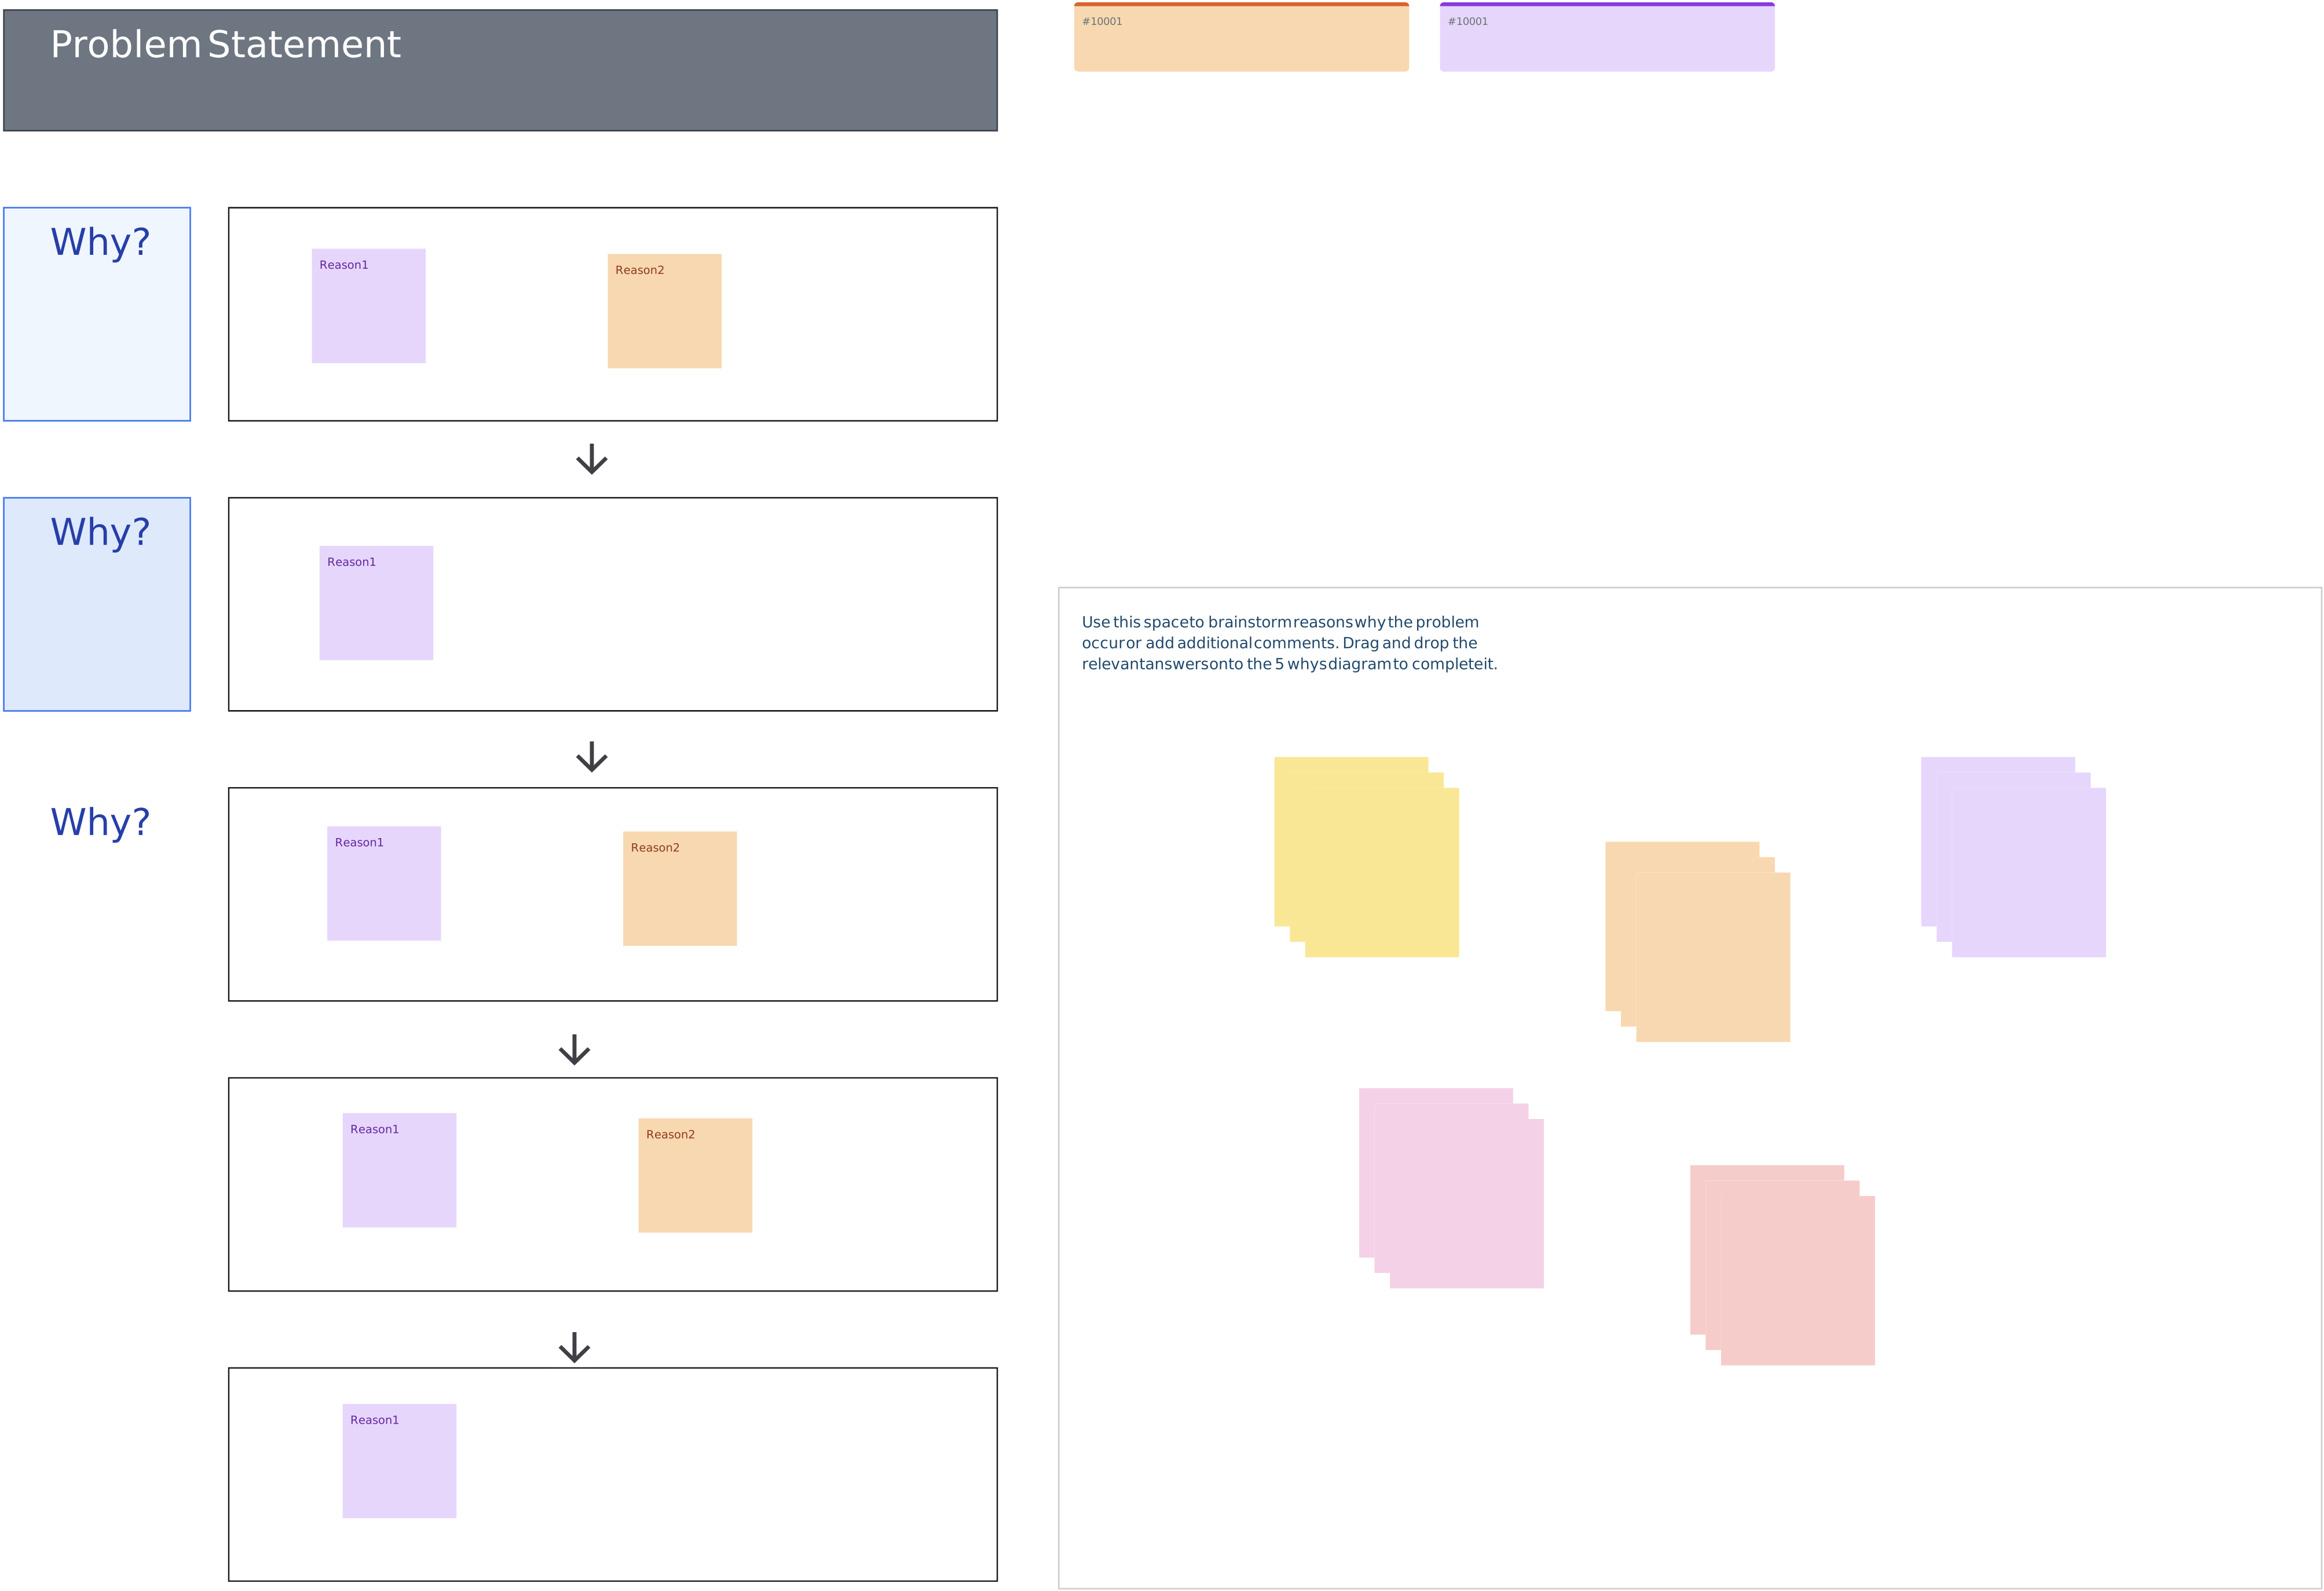
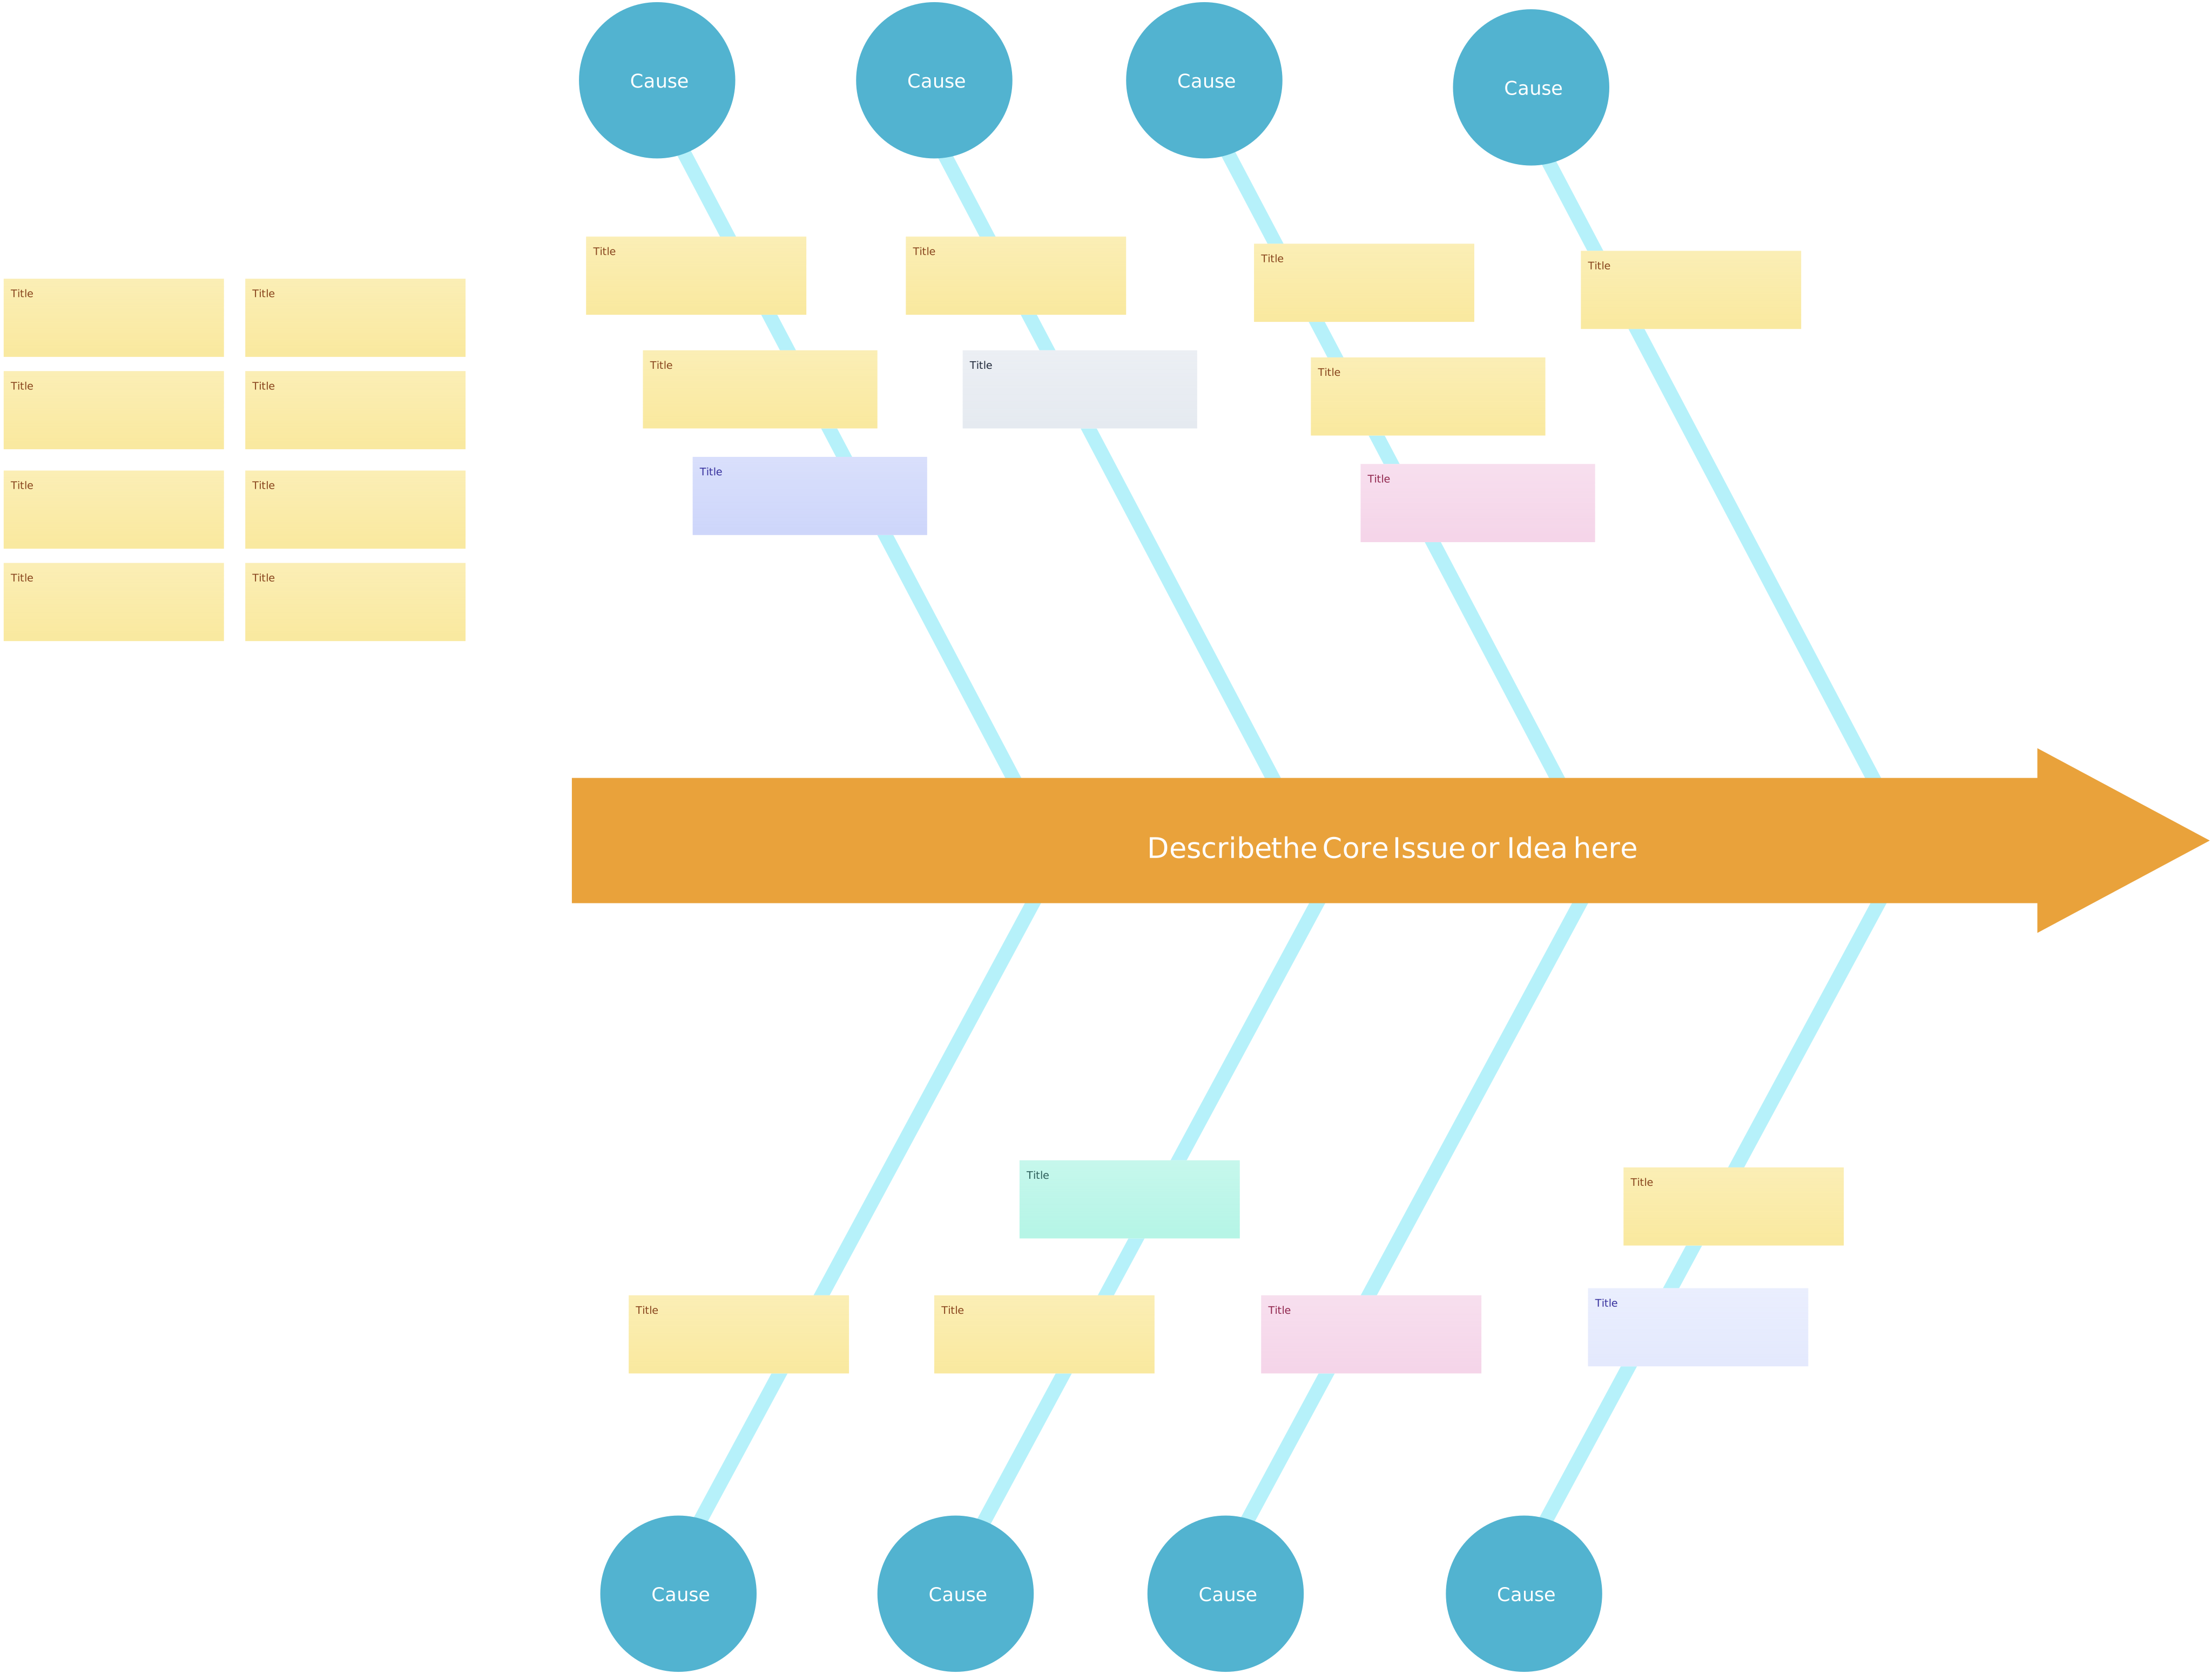
Protect the constraint from interruptions: Prioritize work based on business value, provide complete inputs, schedule maintenance outside critical periods, and avoid assigning unrelated work to the constrained resource.
Align the rest of the process with the constraint: Set work-in-progress limits and pace upstream activity so it does not create an excessive queue. Clarify ownership and handoff criteria so work reaches the constrained step ready to process.
Increase capacity when necessary: Cross-train team members, improve tools, adjust schedules, automate suitable repetitive work, or add resources when process changes alone cannot meet demand.
Monitor the whole workflow after the change: Compare the new cycle time, throughput, queue length, utilization, and defect rate with the baseline. Once one constraint improves, another step may become the new bottleneck.
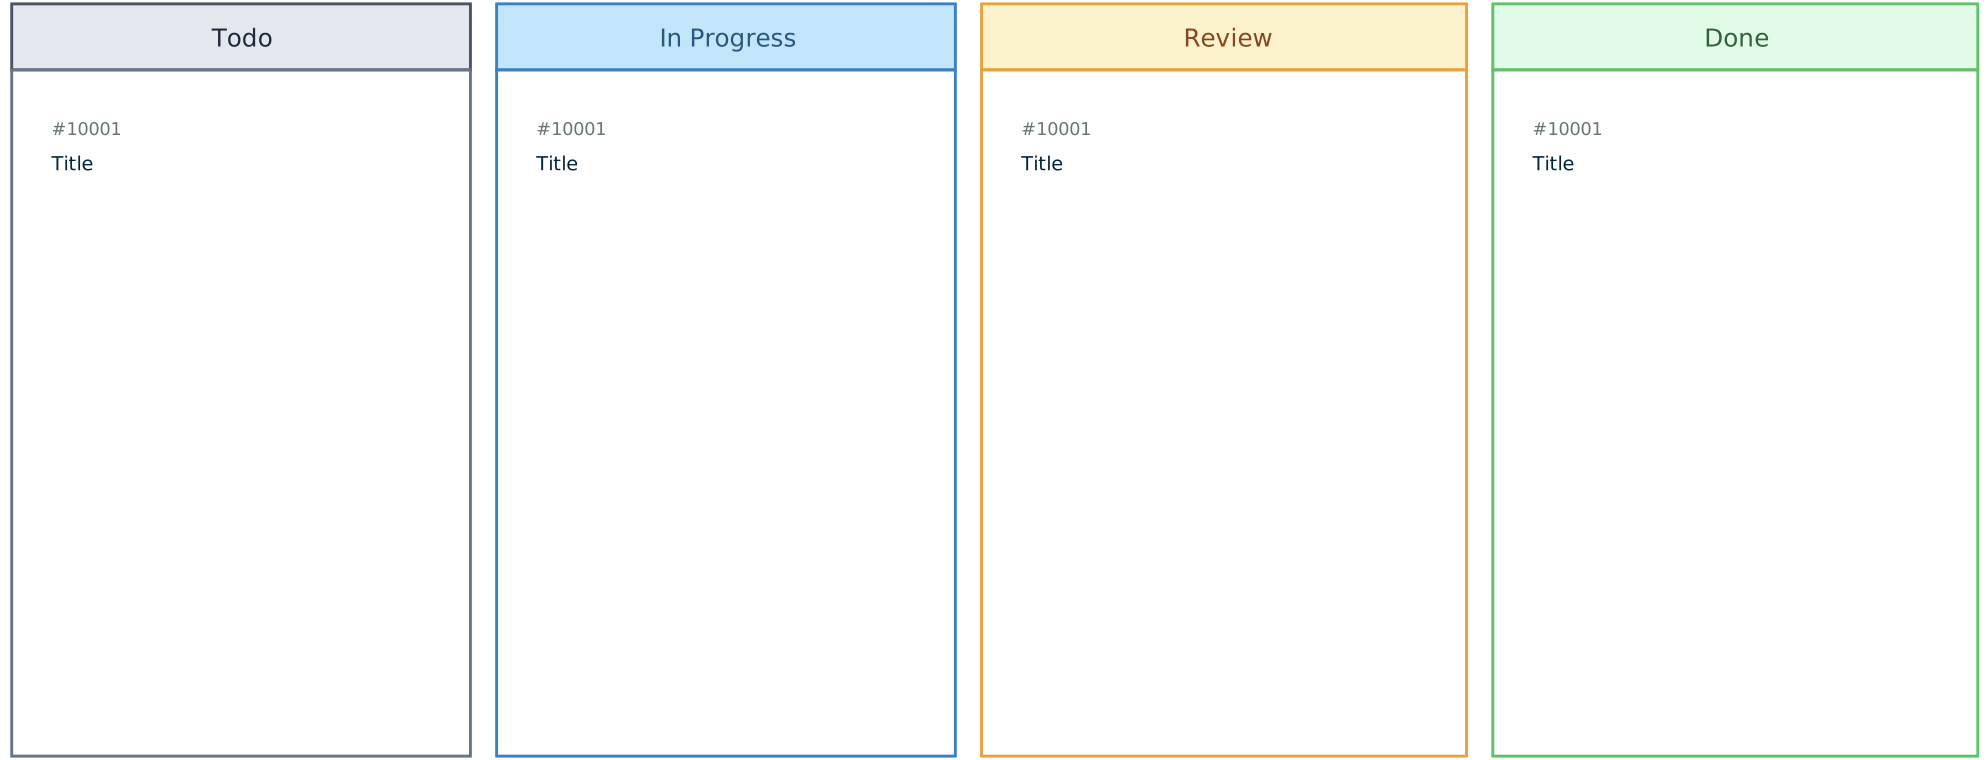
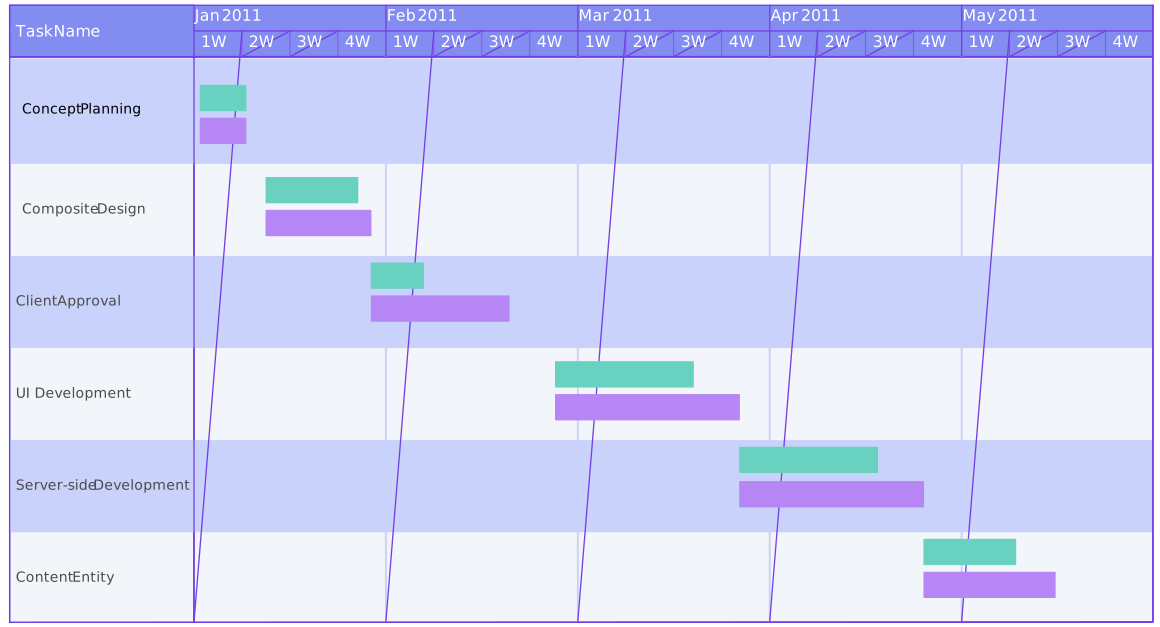
Gantt charts, Kanban boards, and checklists can support scheduling and work-in-progress control, but they should be paired with process measures that show whether overall flow is improving.
Wrapping Up
Bottlenecks can emerge whenever demand, capacity, policies, skills, or handoffs change. The goal is not simply to make every resource busy; it is to improve the flow and output of the process as a whole. Map the current workflow, verify the constraint with data and frontline feedback, address the root cause, and measure the result against a clear baseline.
Treat the process map as living documentation after the initial fix. Keep ownership and relevant process details current, invite stakeholders to comment on recurring issues, and have the process owner incorporate agreed changes. This review cycle helps teams detect new constraints before queues and delays become established.