Easily visualize your processes and workflows with smart automation.
Create visual organizational structures with images and detailed profiles.
Visualize concepts and their relationships on an infinite visual canvas.
Map family history and understand the relationships with detailed genograms.
Visualize relationships between entities using Crows Foot or Chen notation.
Visualize your network infrastructure. Support AWS, CISCO, Azure and more.
Visualize and expand your ideas using our powerful mind mapping tool.
Easily create family trees with our professionally designed templates.
Infinite canvas to add diagrams, images, sticky notes and more.
Run collaborative meetings, workshops or brainstorming sessions.
Collaborative diagramming for educators and students at discounted rates.
Log In
Sign Up Free
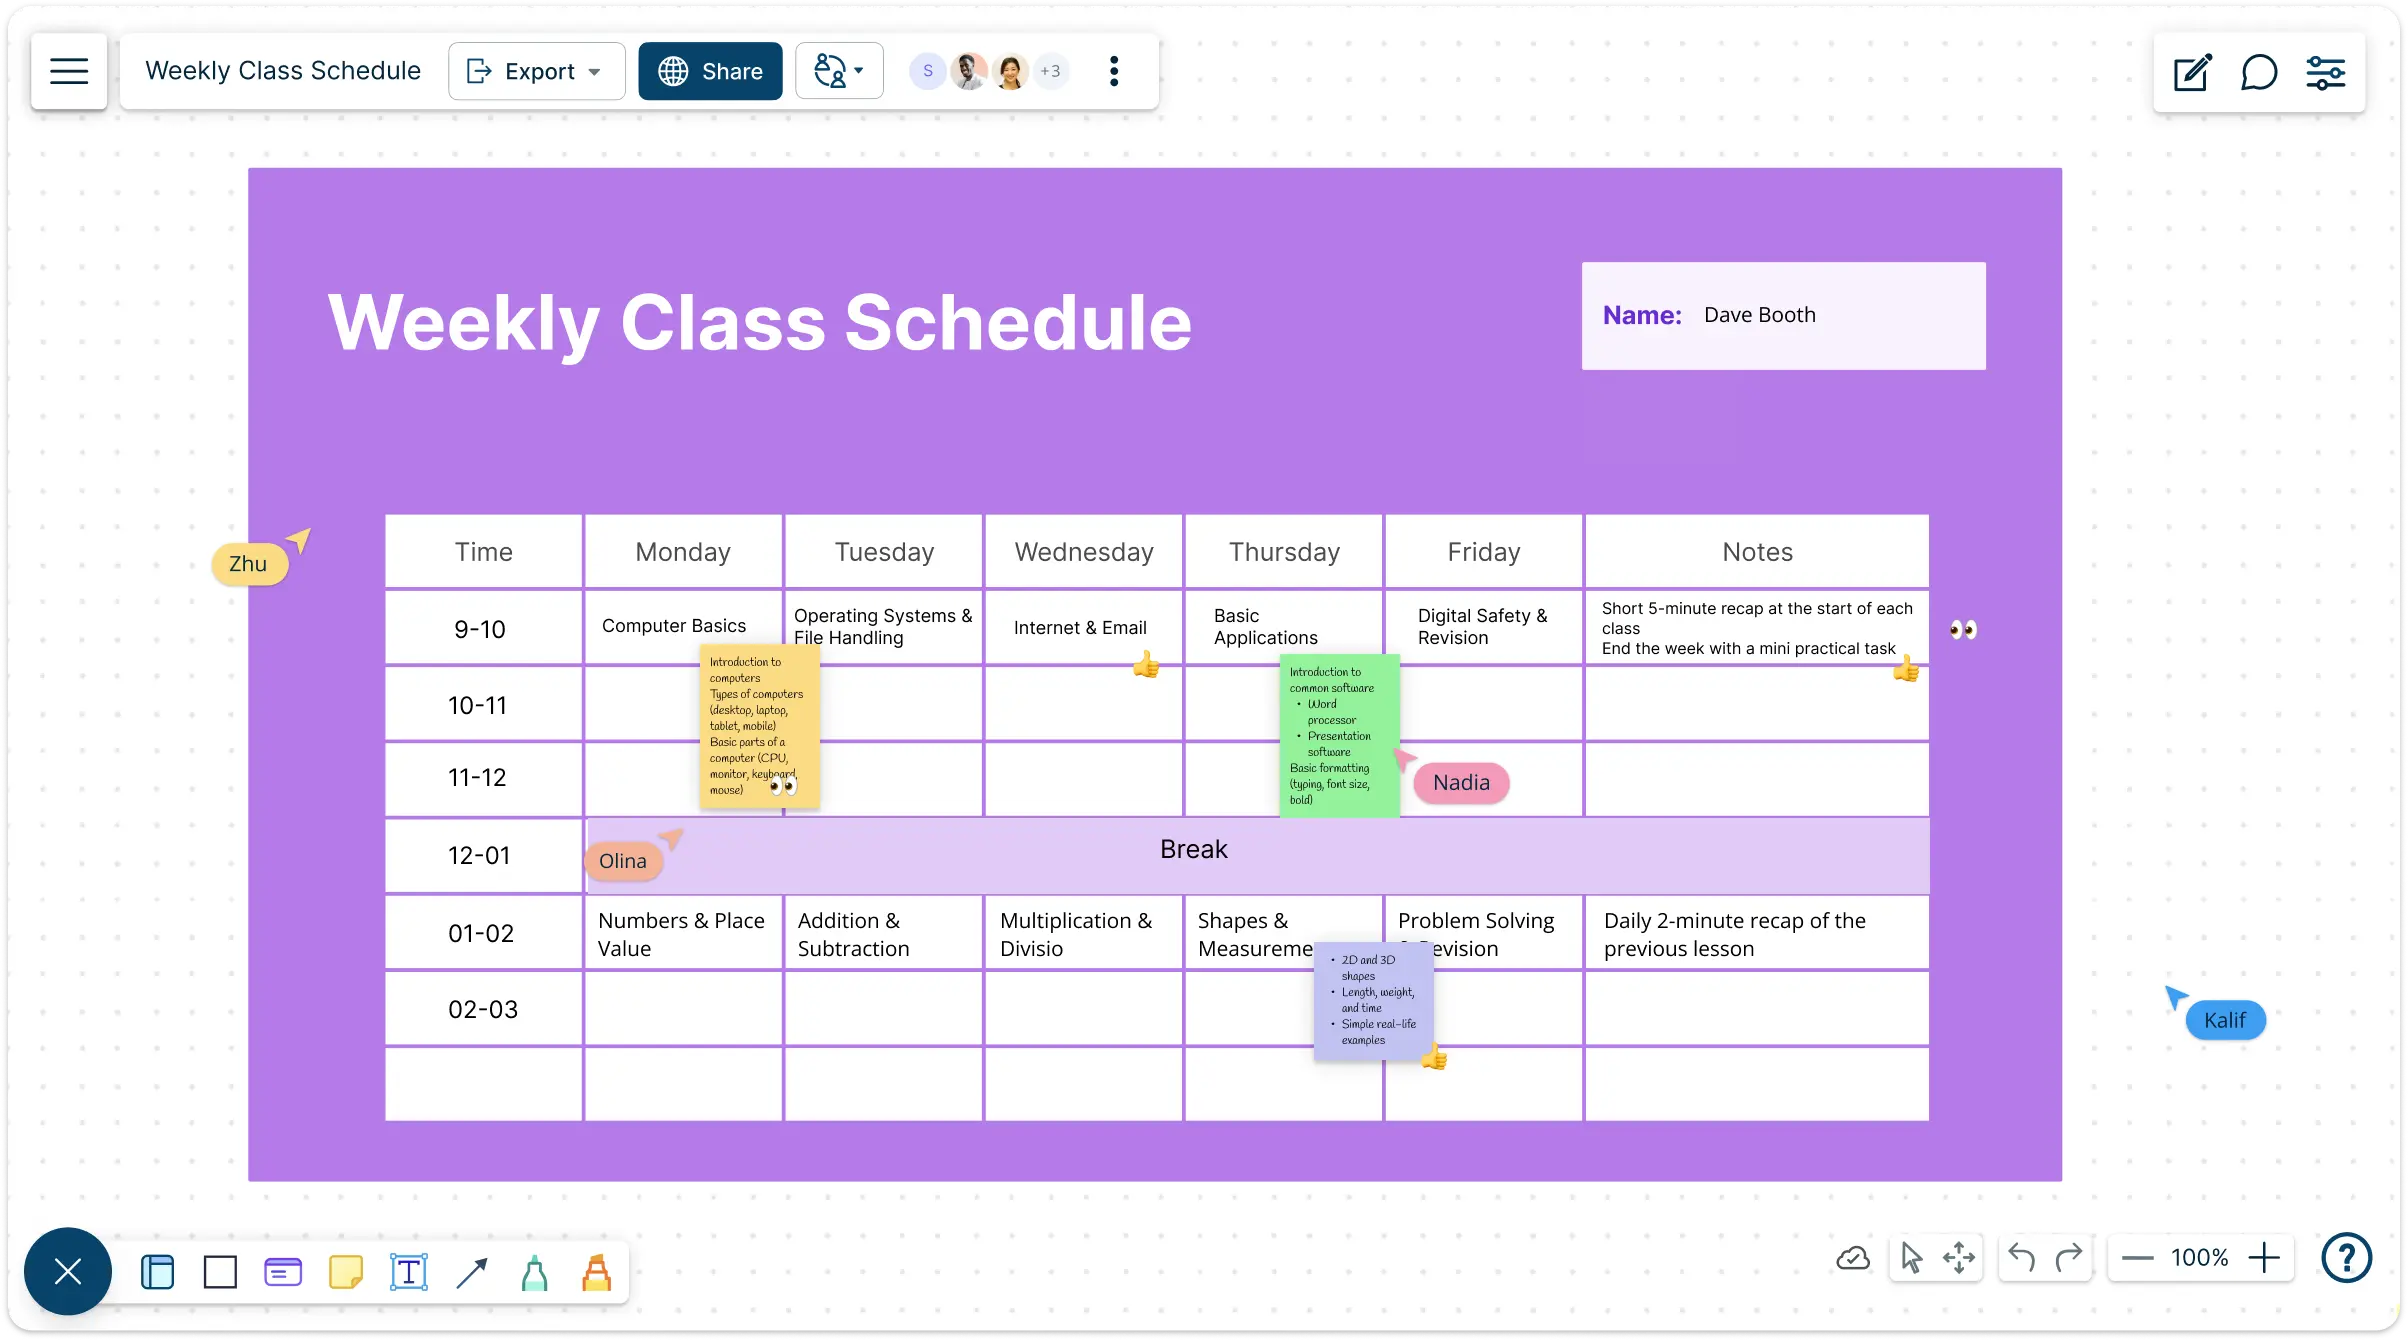
Effortlessly design your school timetable with our intuitive class schedule maker. Build using templates, import data from multiple sources, and centralize everything on one interactive canvas that’s easy to share.
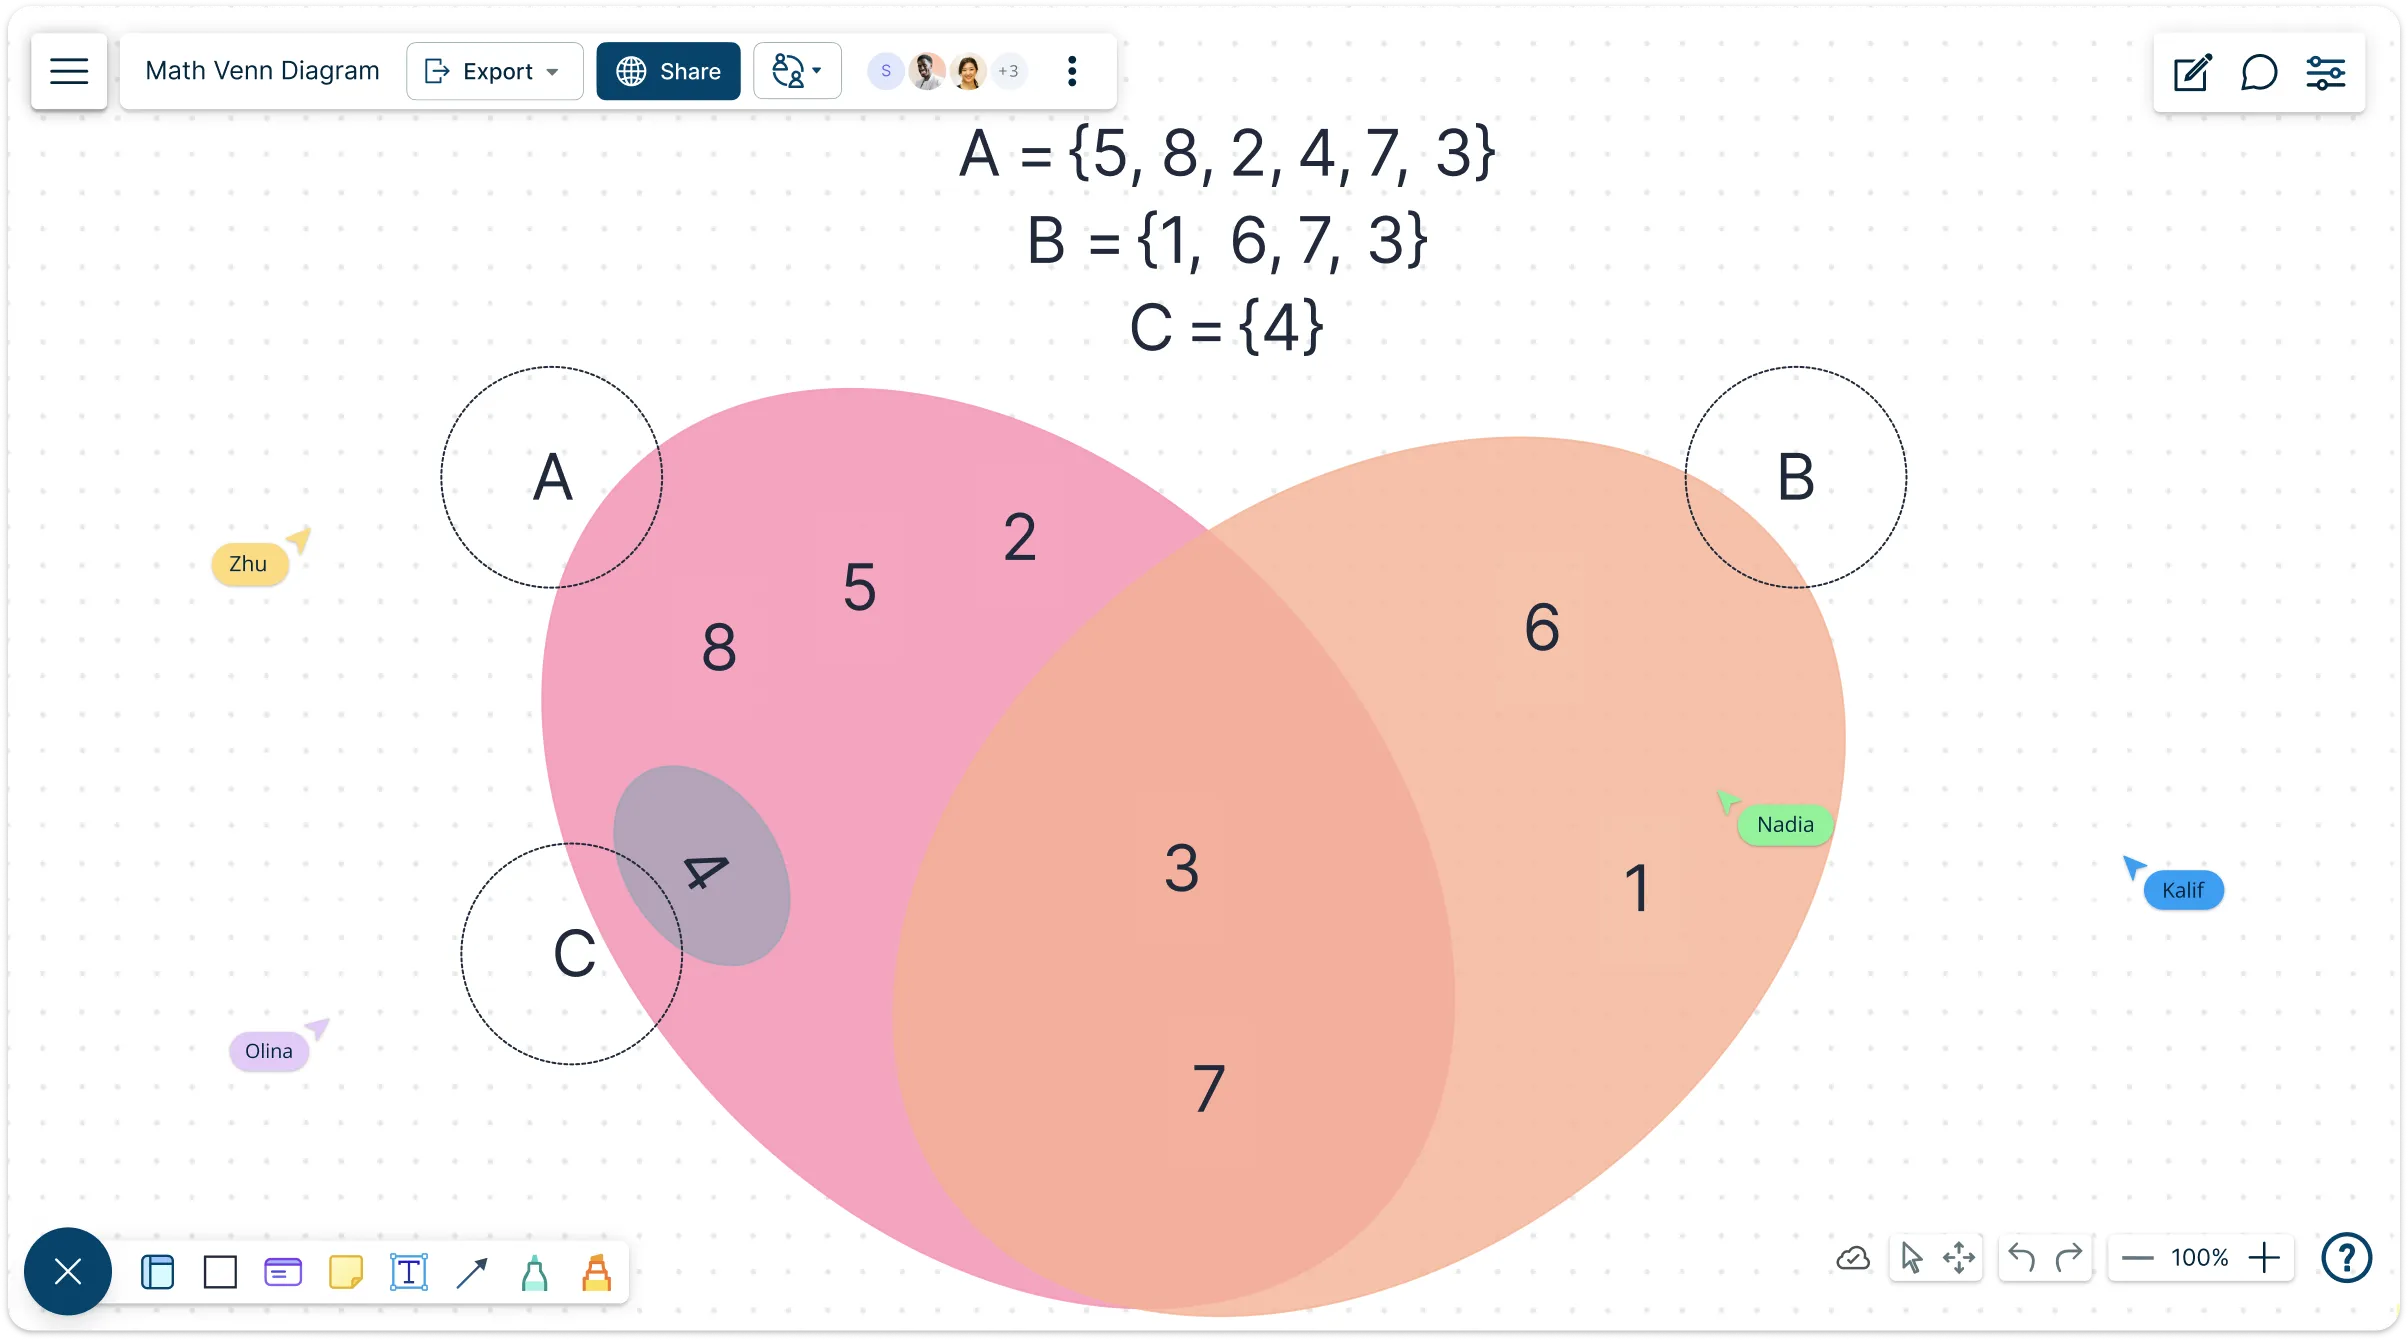
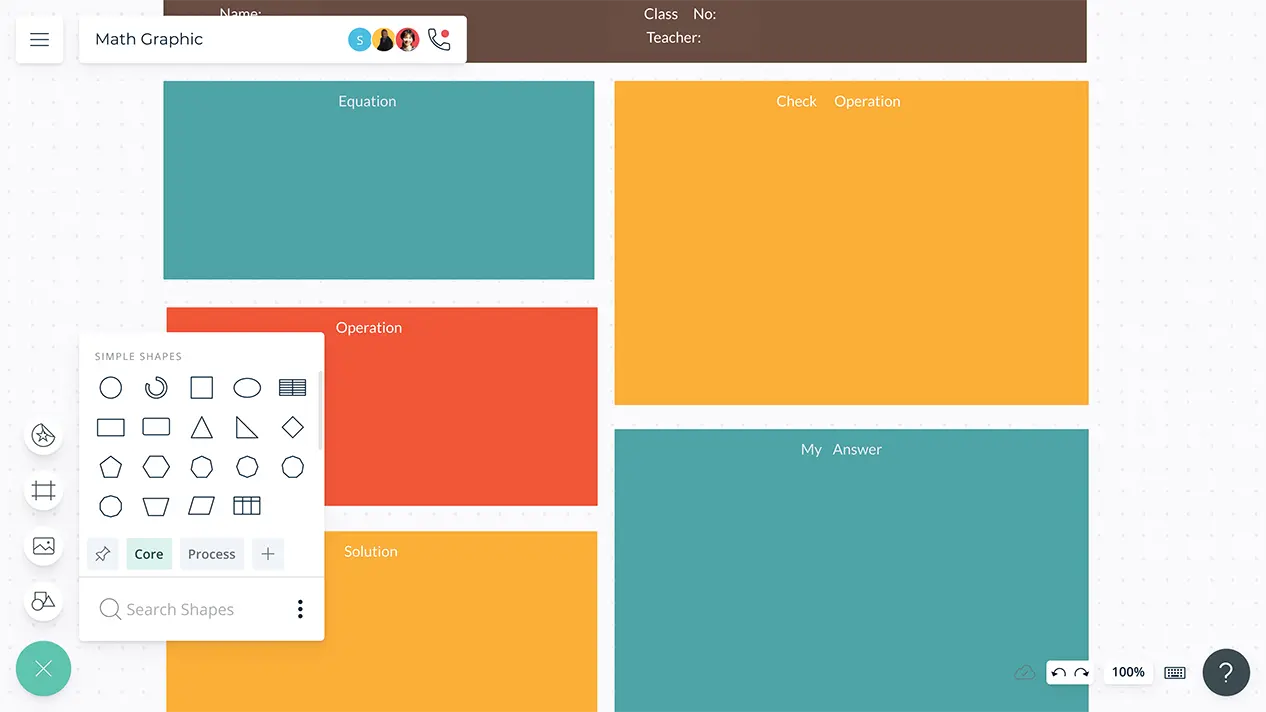
Bring math concepts to life with intuitive, interactive diagrams. From algebra and geometry to vectors and formulas, Creately’s math diagram creator helps you turn abstract ideas into clear, visual presentations that are easy to analyze, share, and solve together.
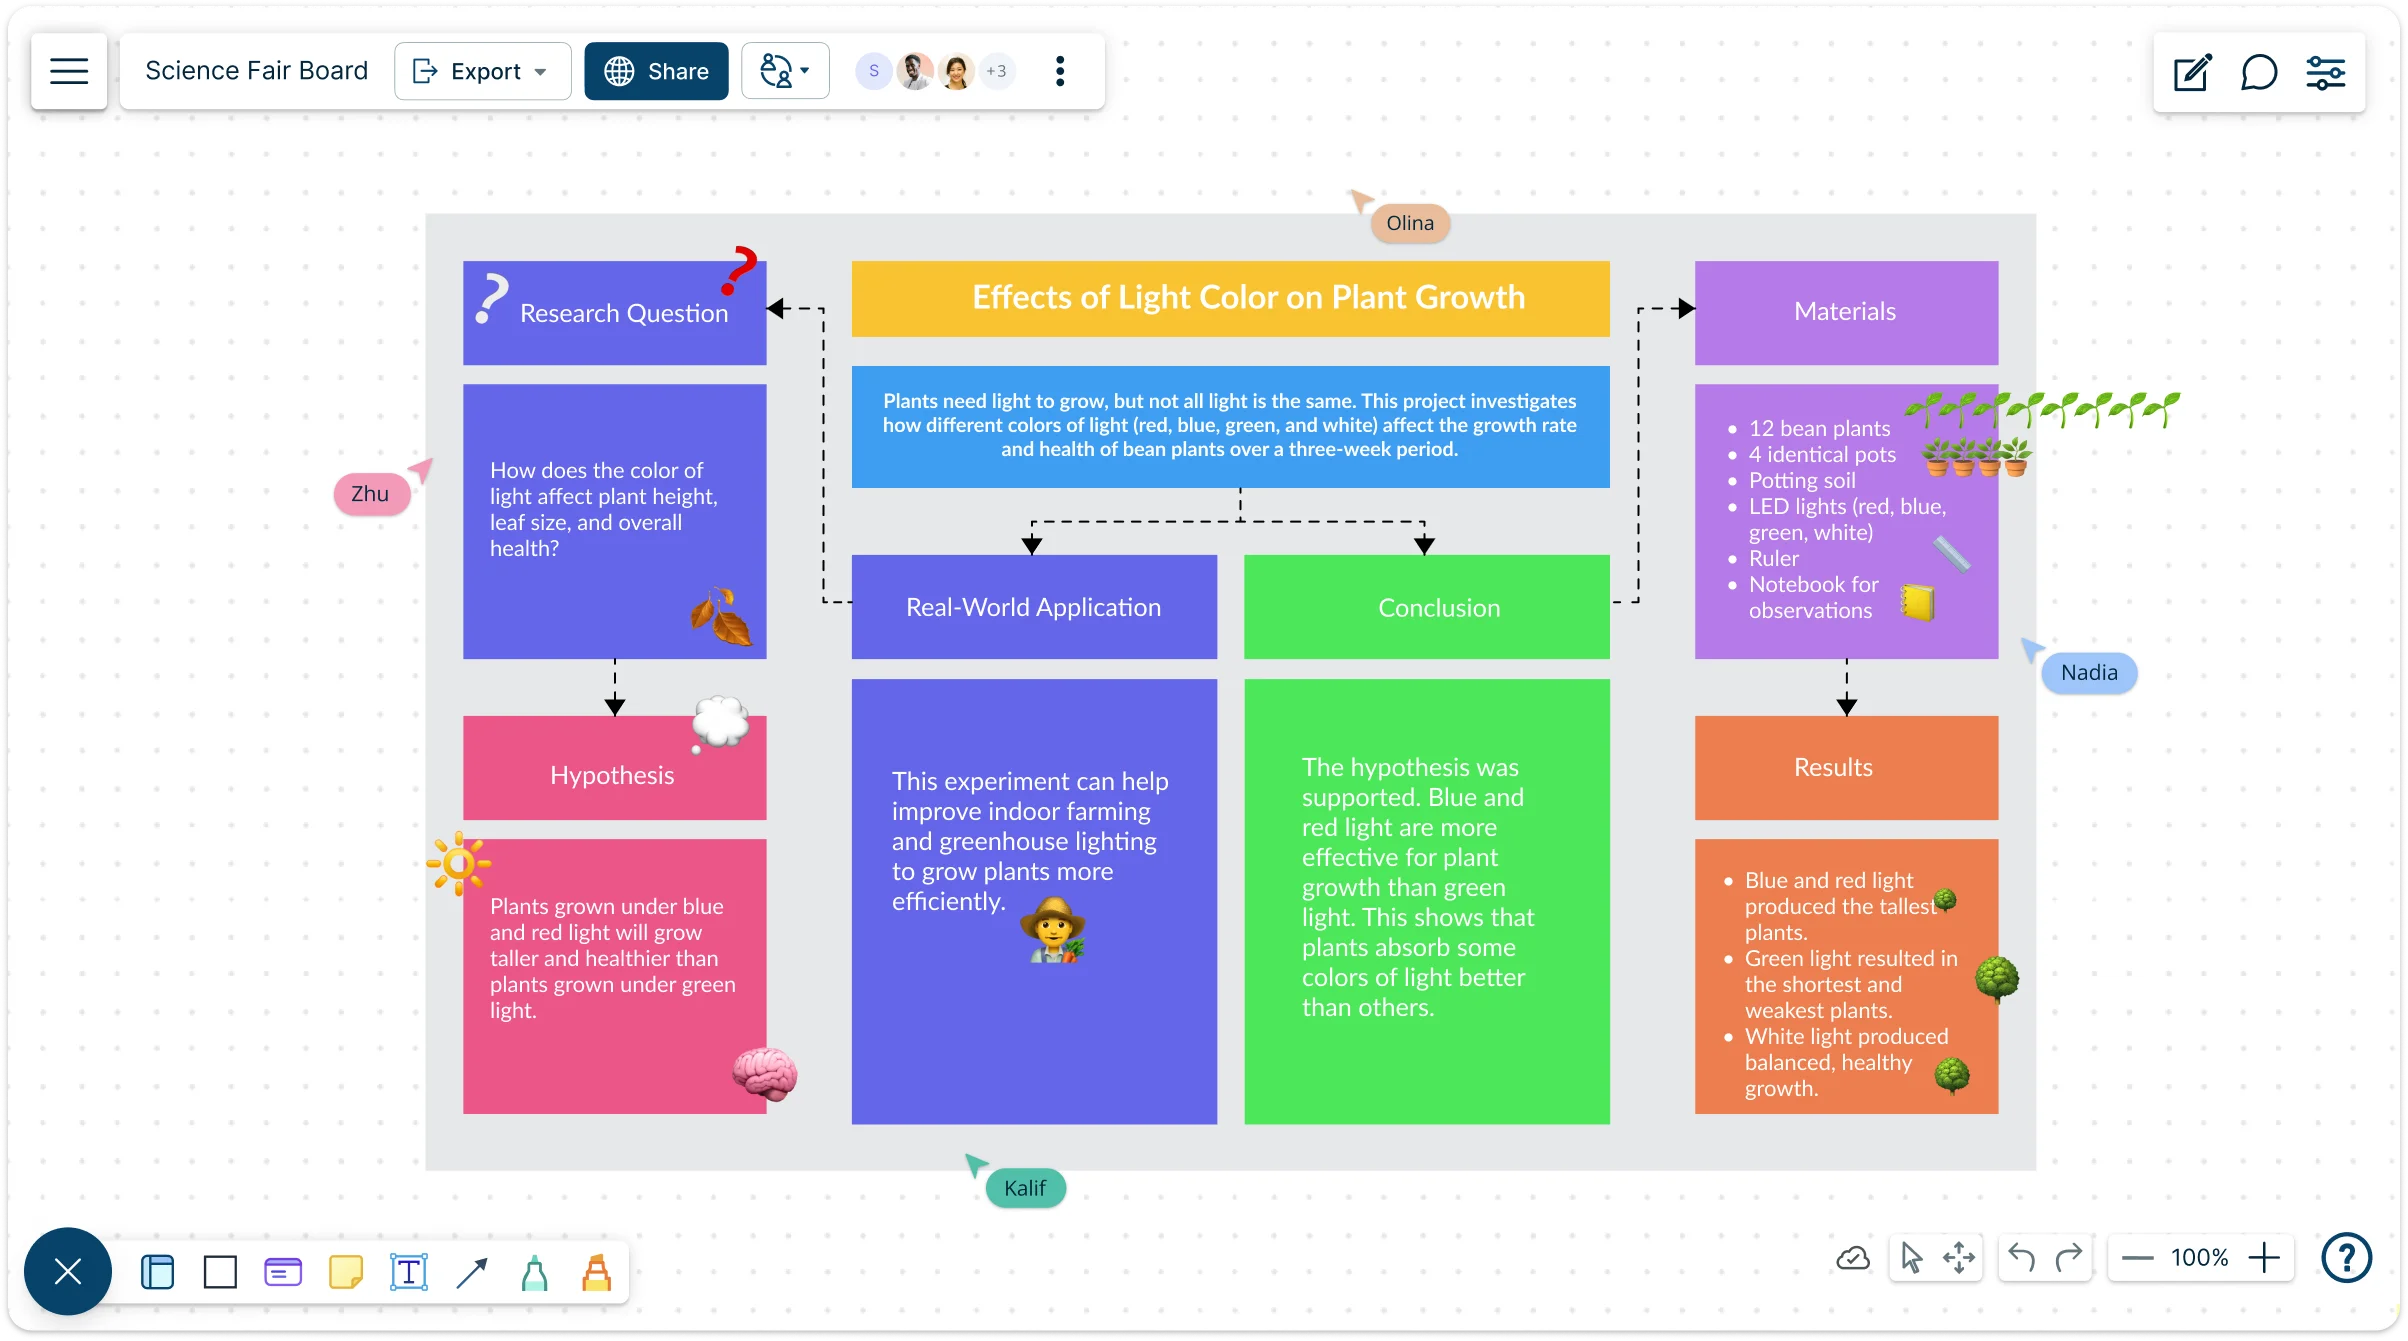
Bring your scientific investigations or engineering projects to life with our virtual science fair boards. Designed to help you plan the perfect science fair display and present your ideas with confidence.
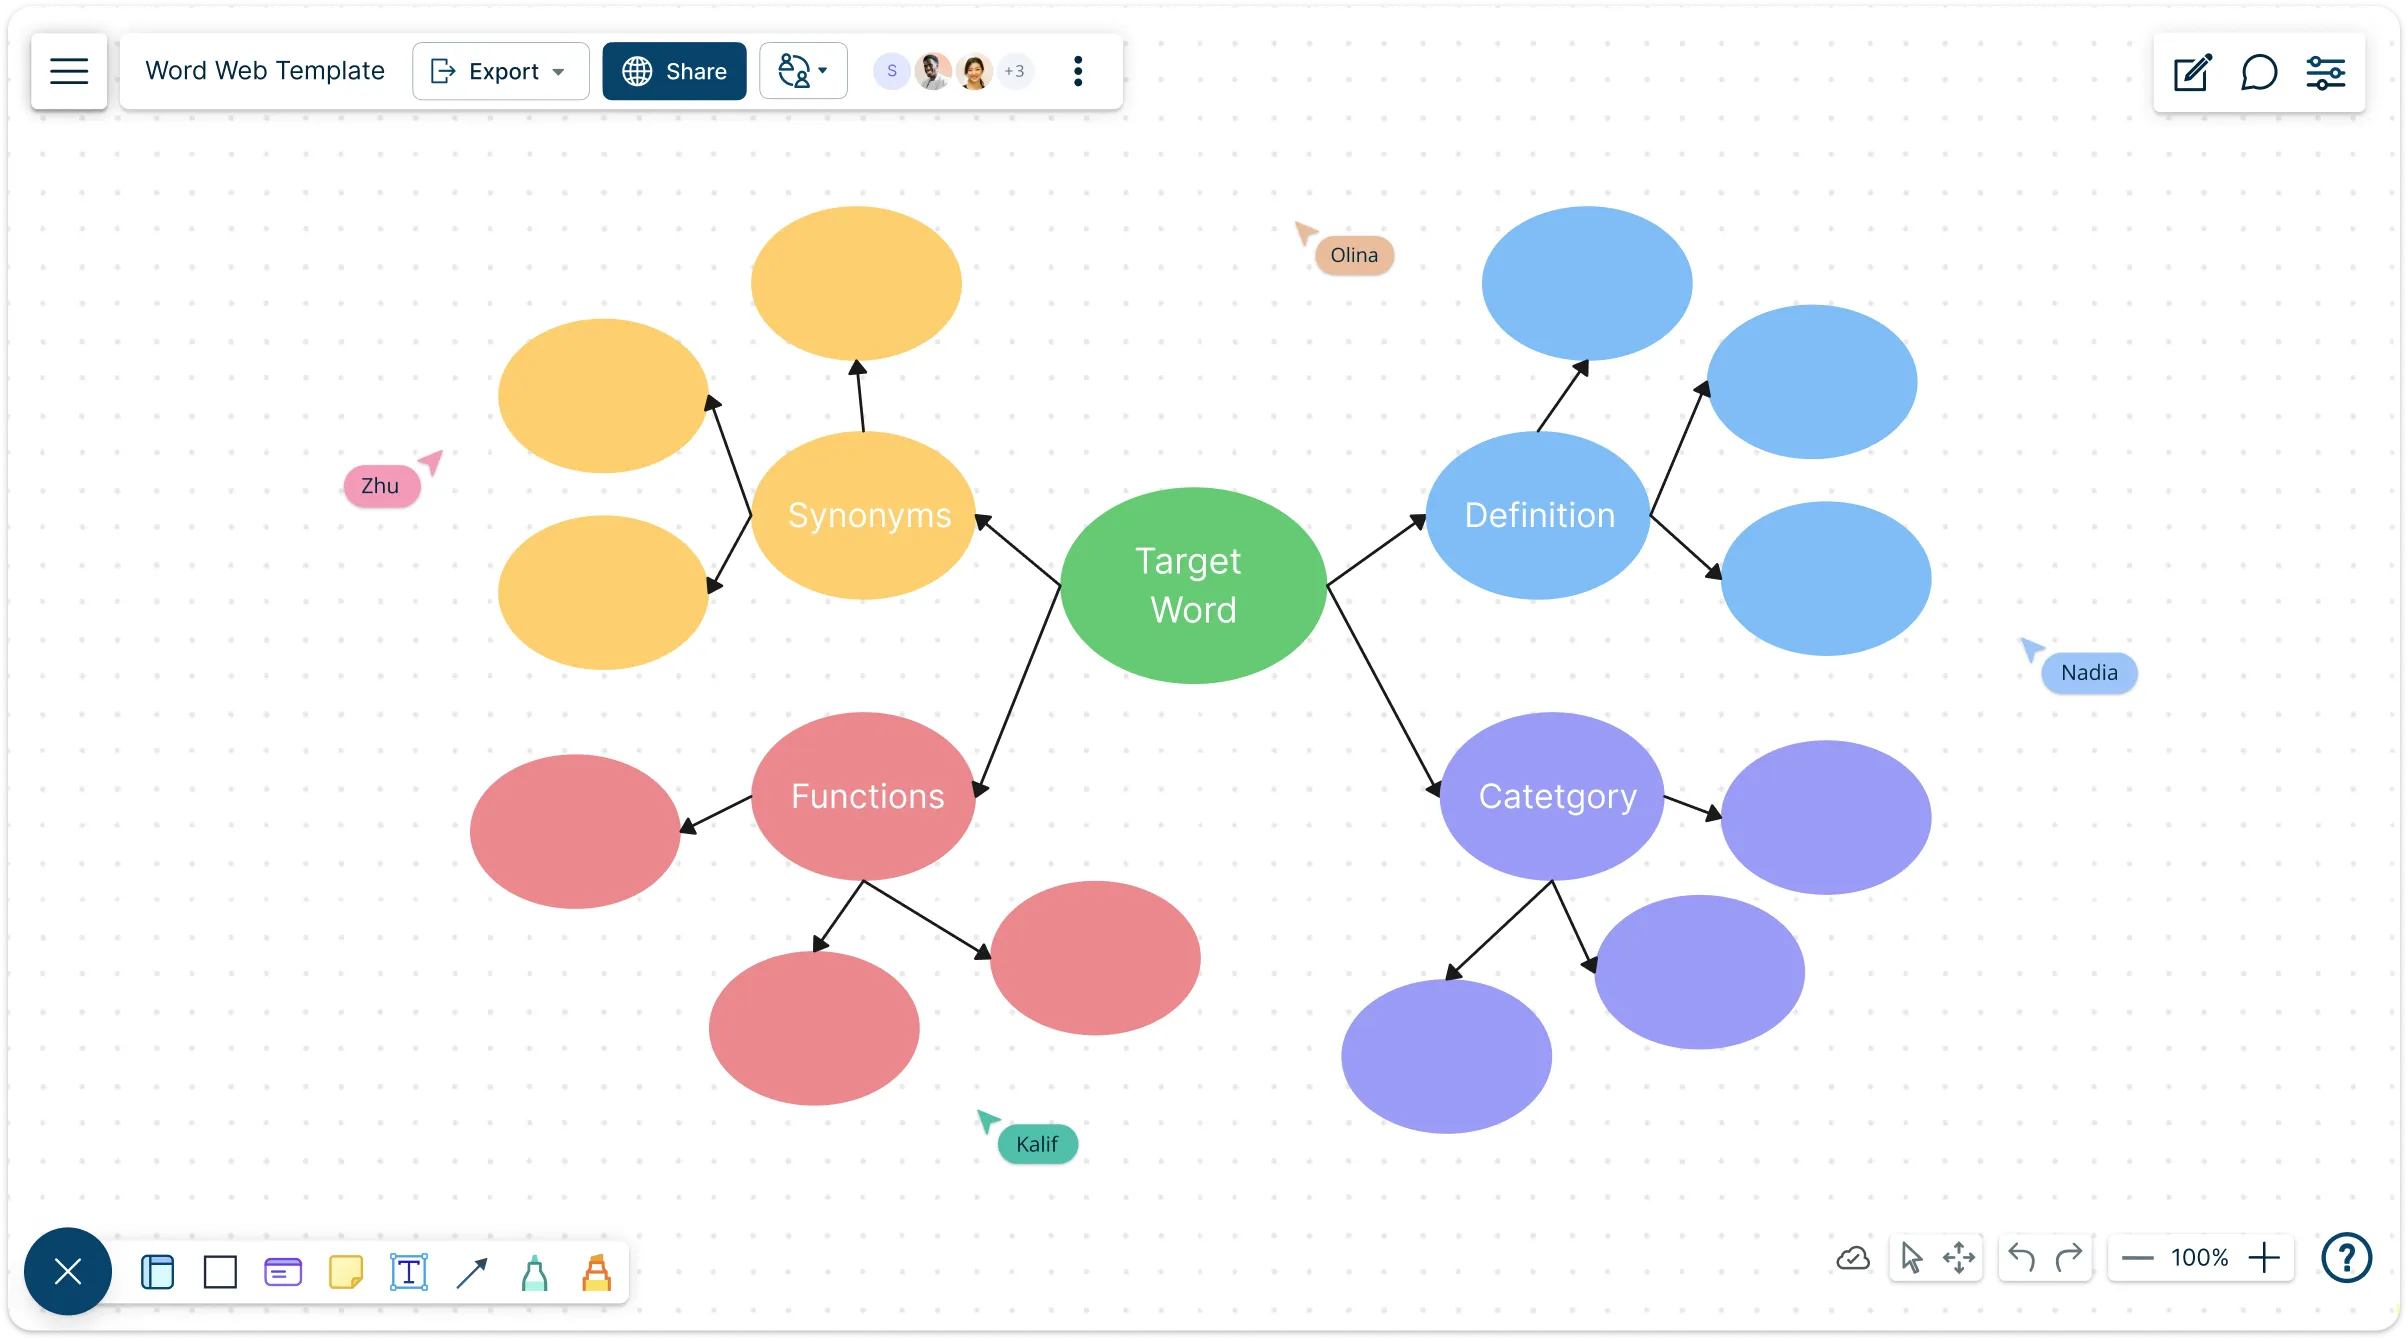
Unlock meaning fast — whether you’re a student, teacher, or writer. Creately’s word web template helps you brainstorm around any word or topic, see connections clearly, and turn ideas into a visual web you can understand, remember, and share.
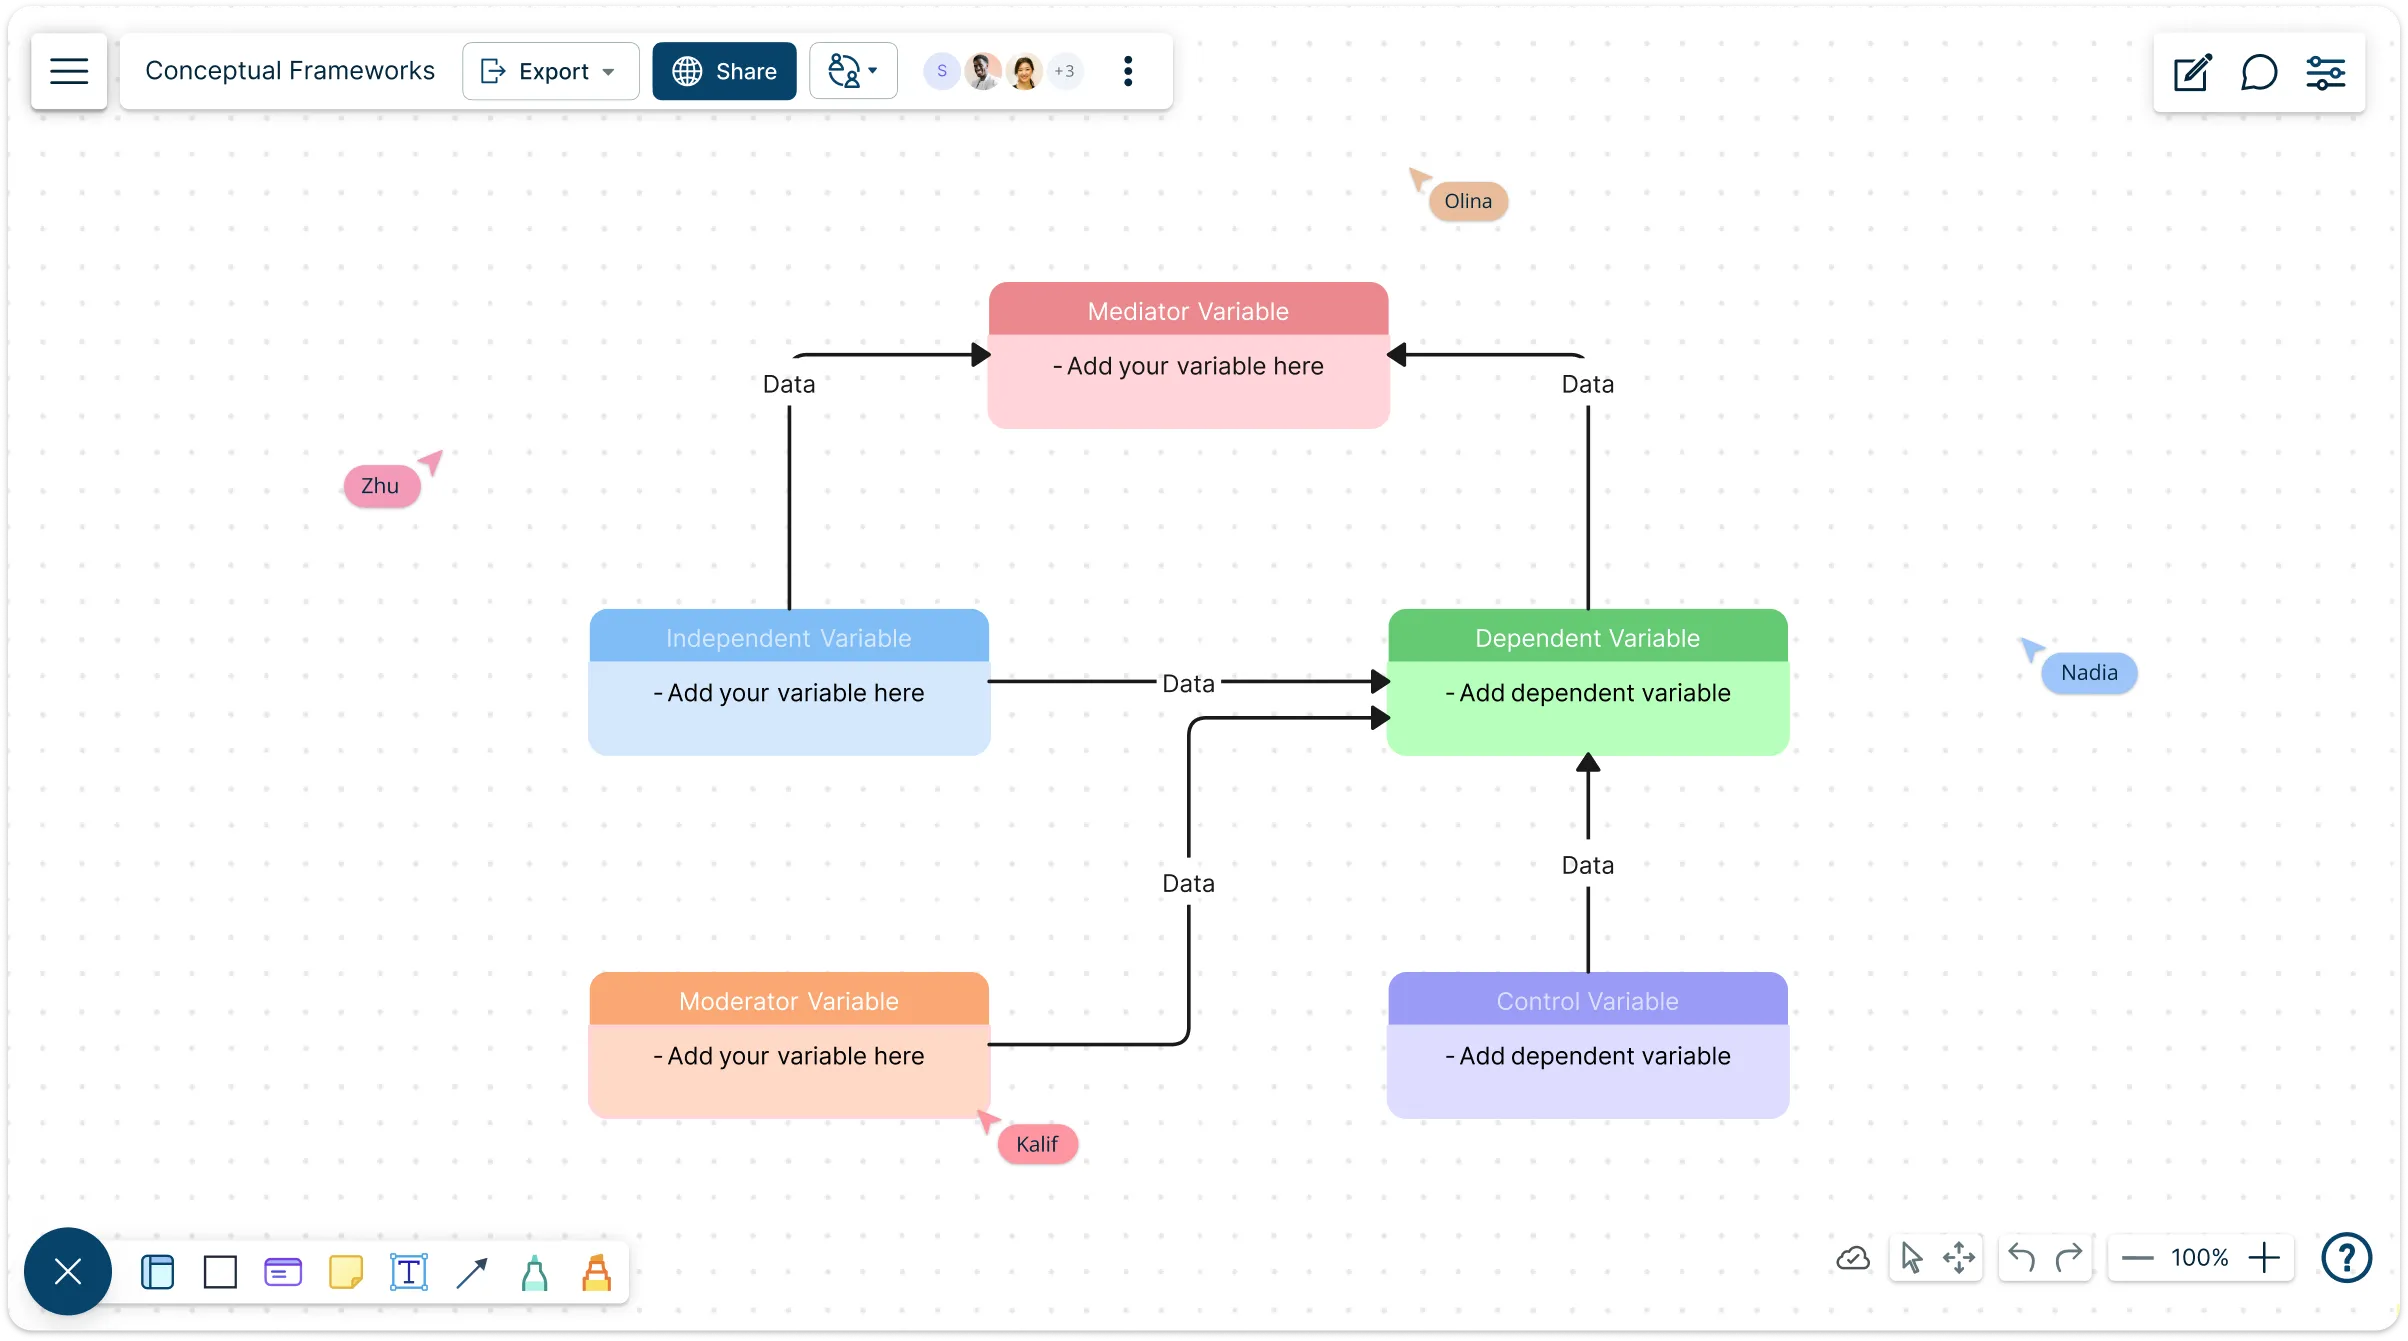
Quickly turn complex ideas into clear, visual frameworks. Easily map relationships, organize key concepts, and refine your thinking in one flexible workspace—so your framework is easy to build, easy to update, and easy for others to understand.
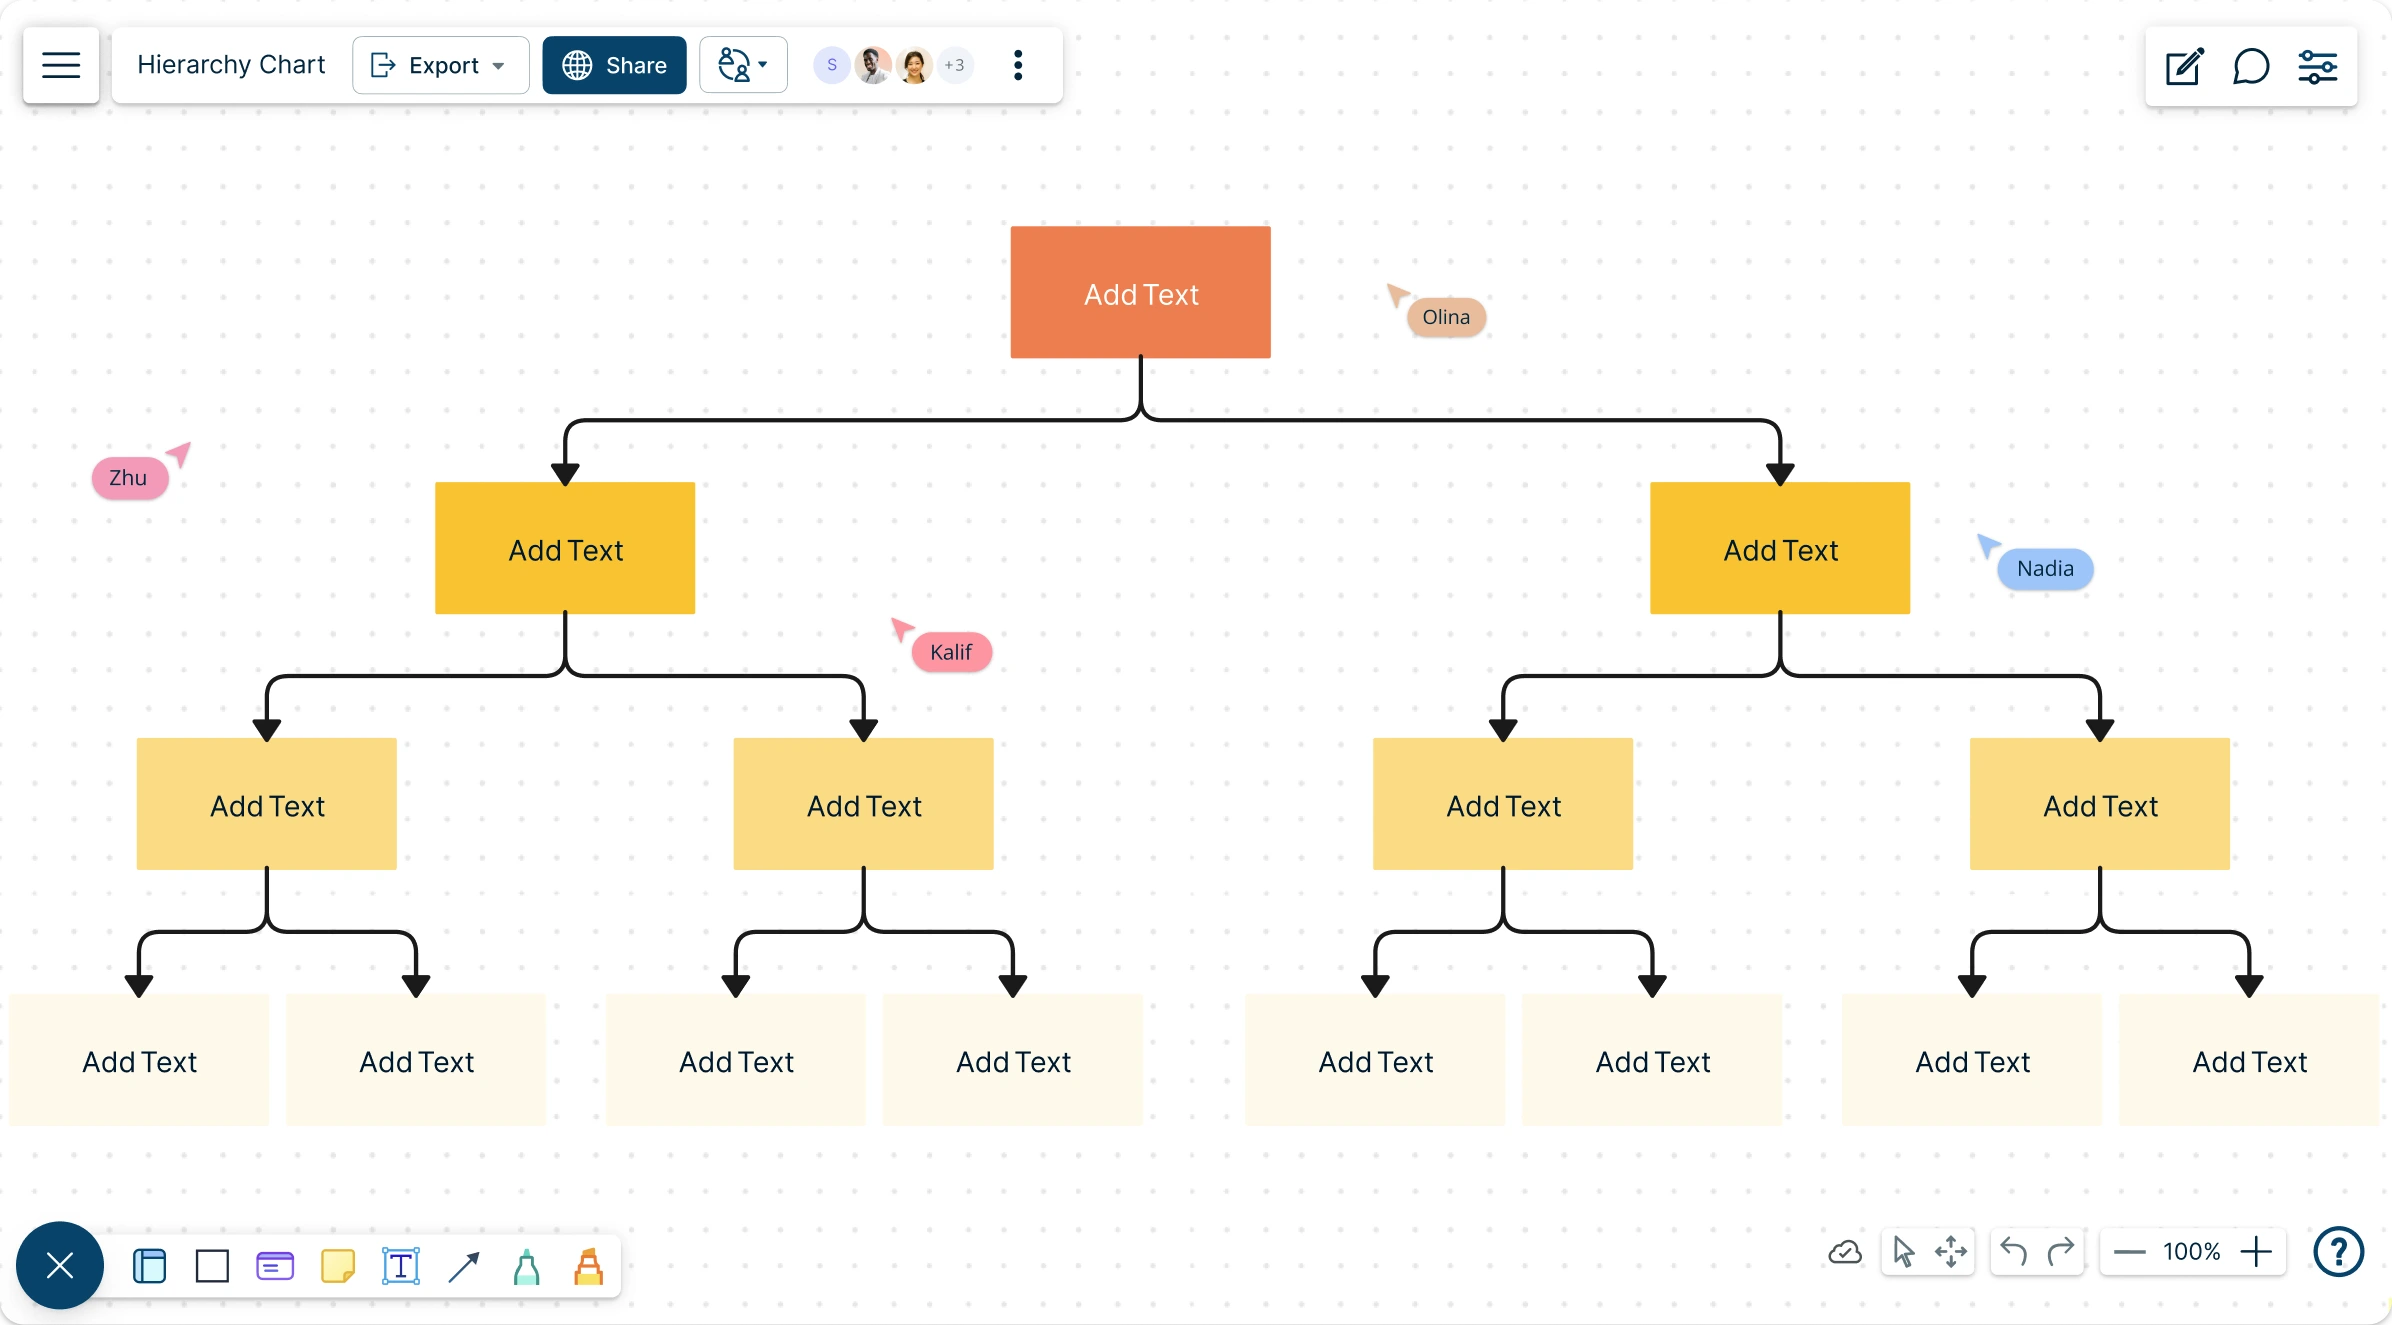
Quickly build and visualize your hierarchies with Creately hierarchy chart maker. Get clear, actionable insights into your team's structure in no time.
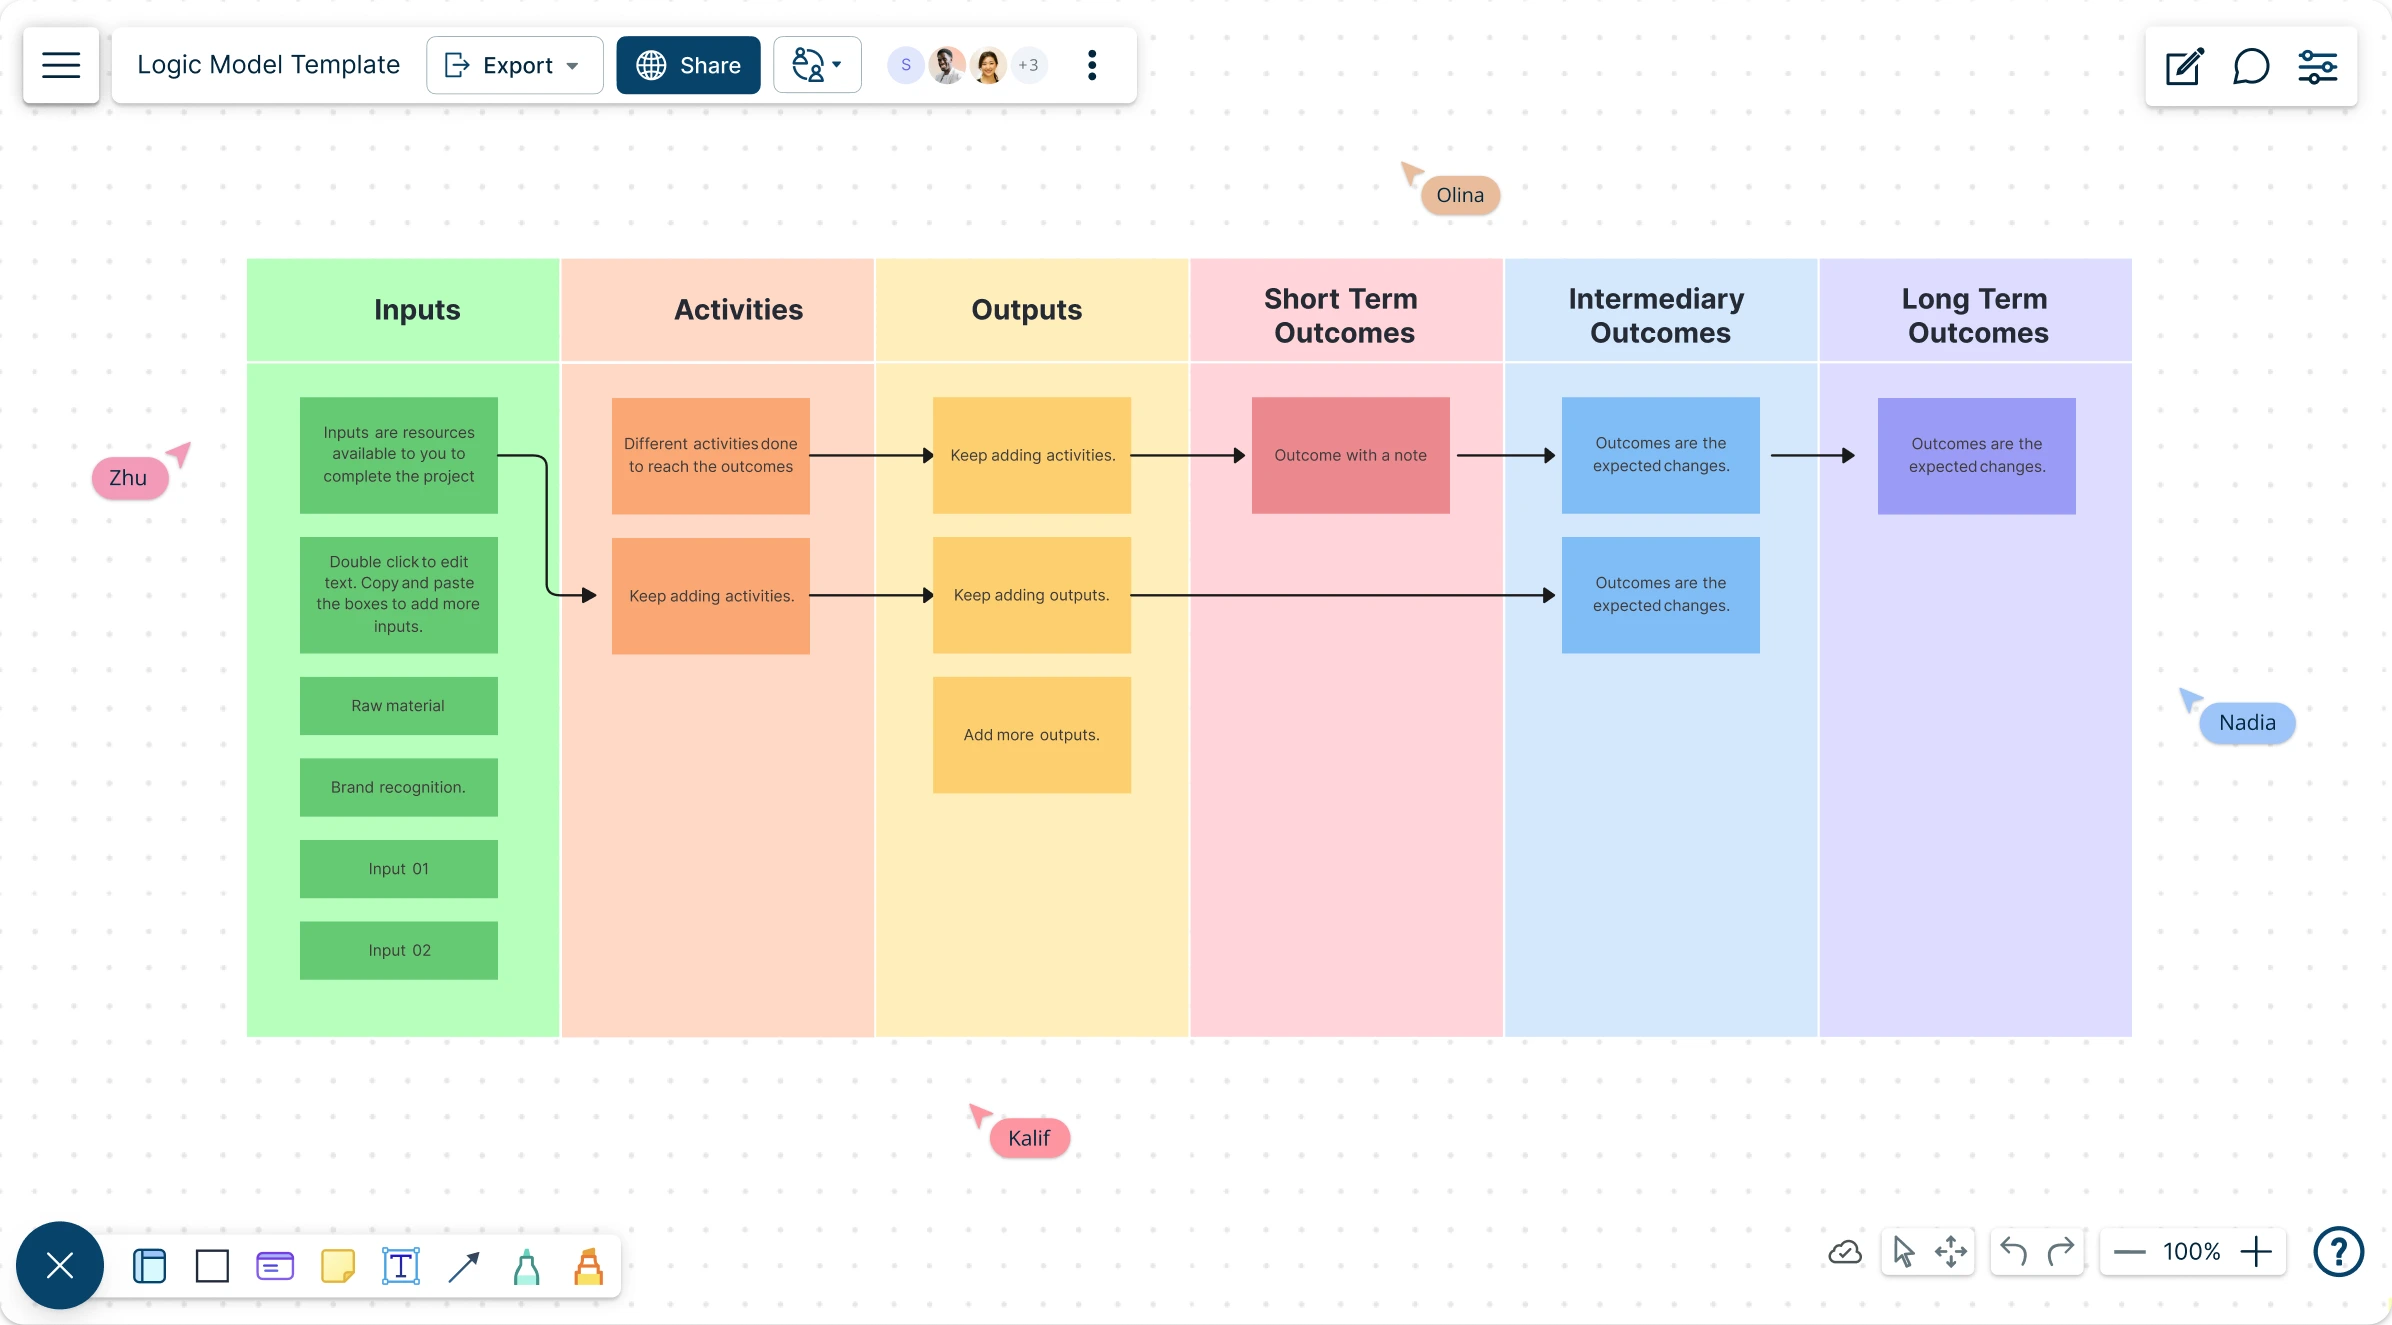
Facilitate effective program planning, implementation, and evaluation with your team on a single collaborative, visual platform.
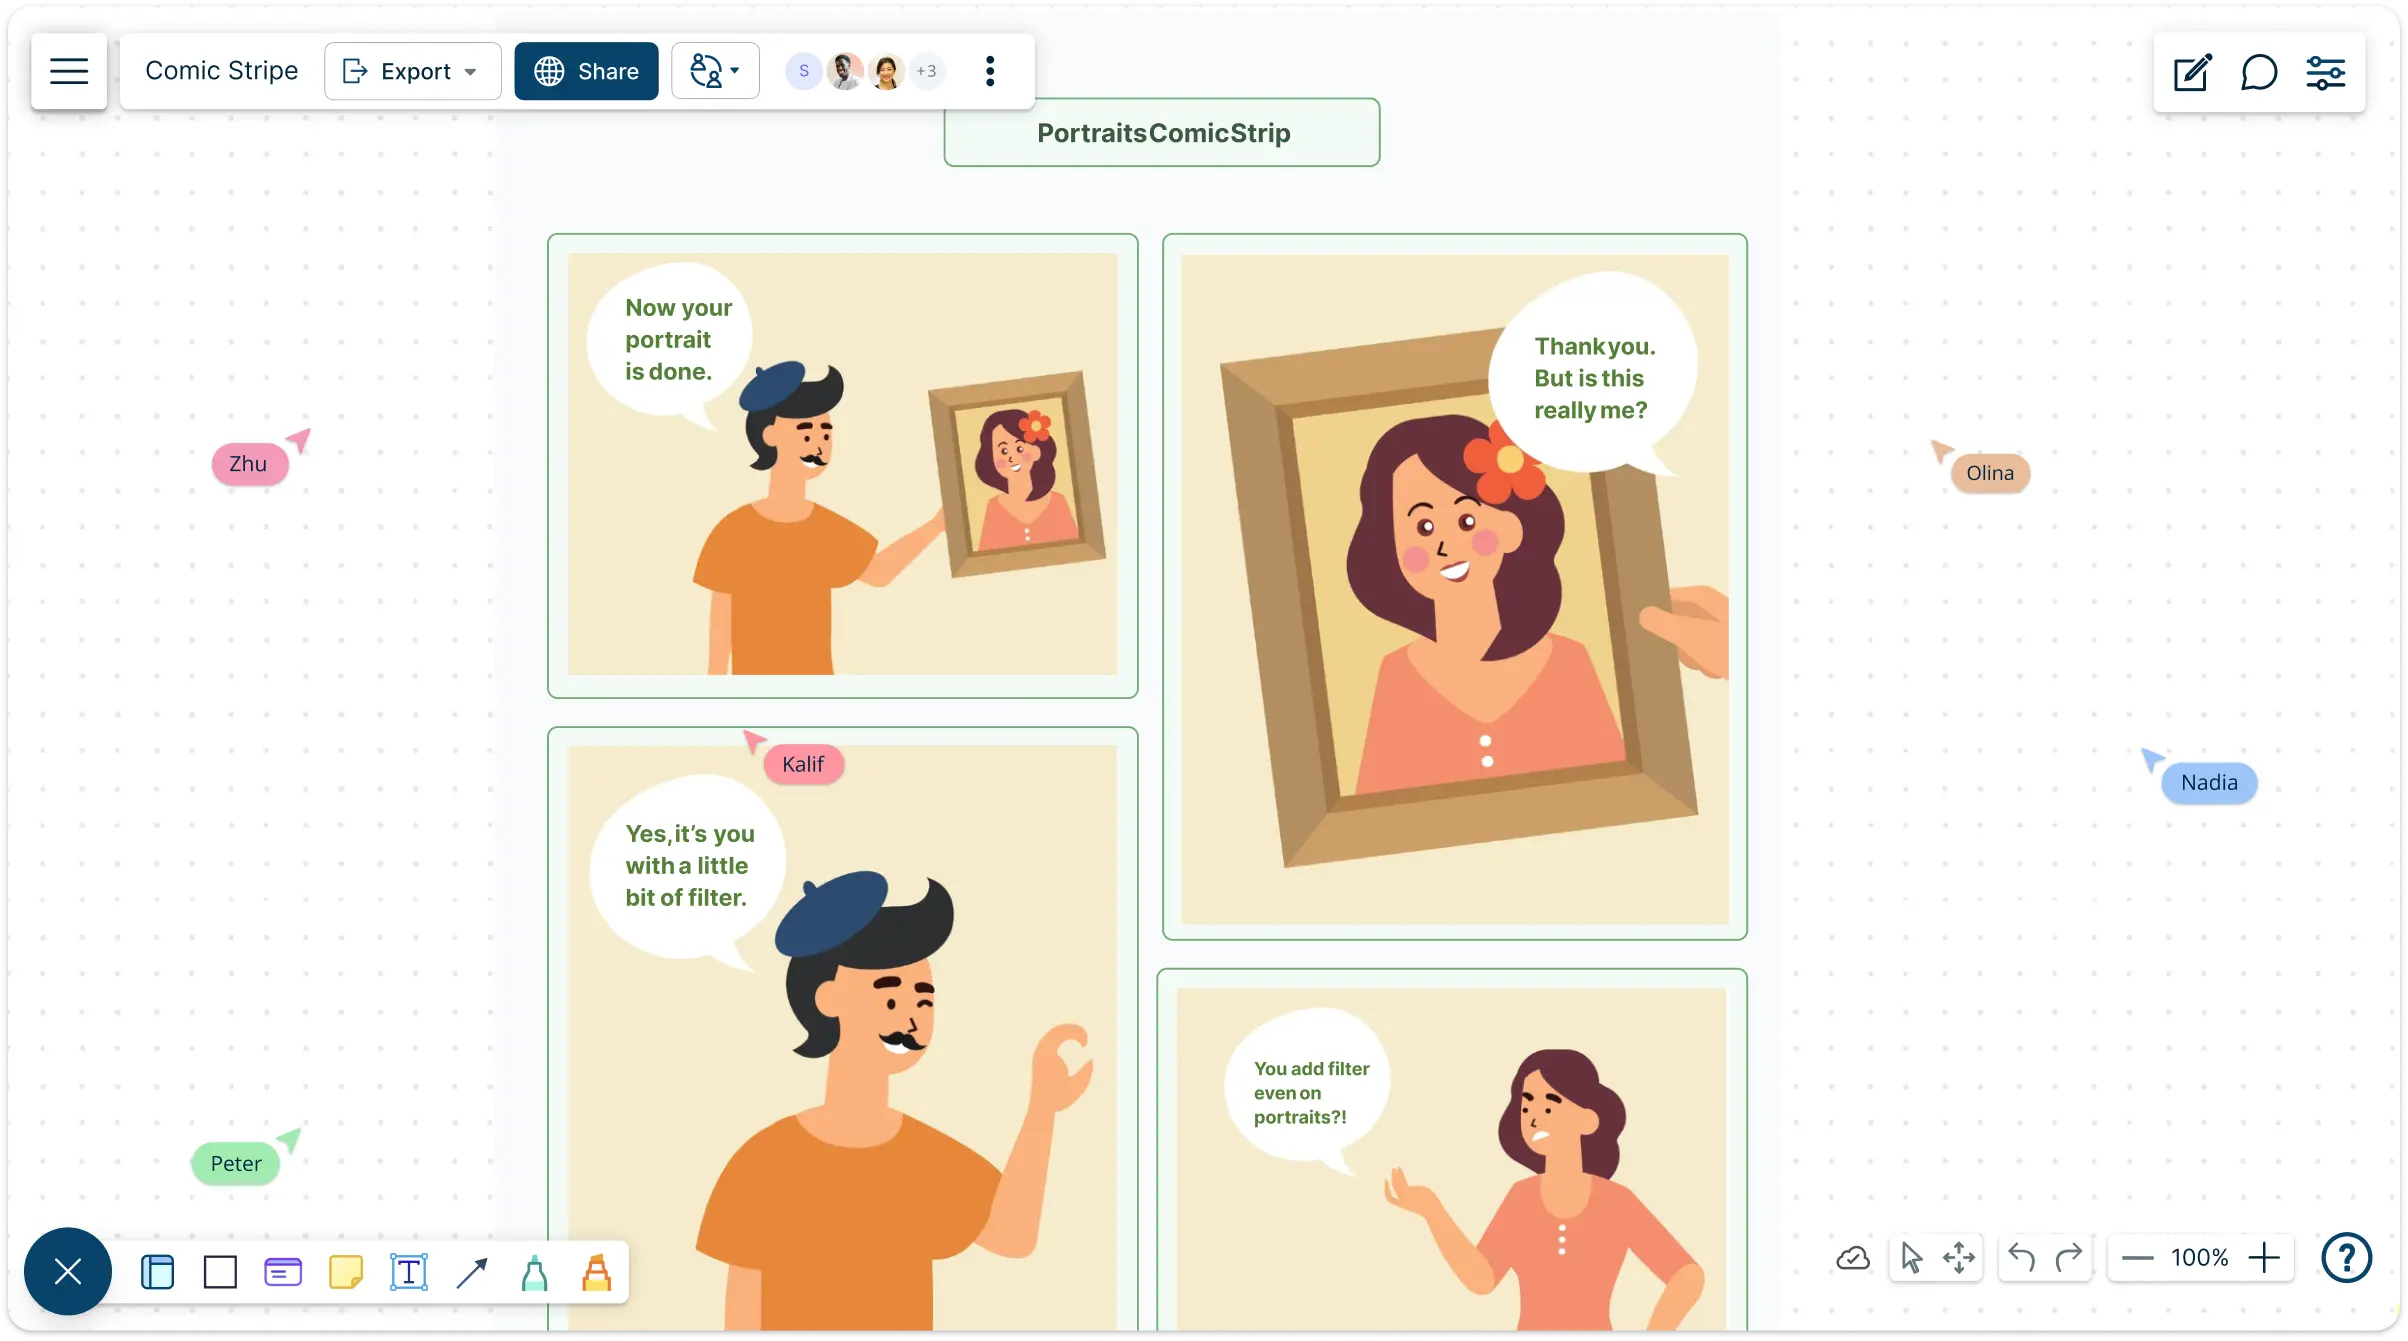
Capture imagination and awaken the storyteller in you with Creately’s easy-to-use visual platform to make fantastic comic strips. Visualize characters, storyboard ideas, design panels, add dialogue, and share, all in one collaborative canvas. Start from free comic strip templates or build your style from scratch.
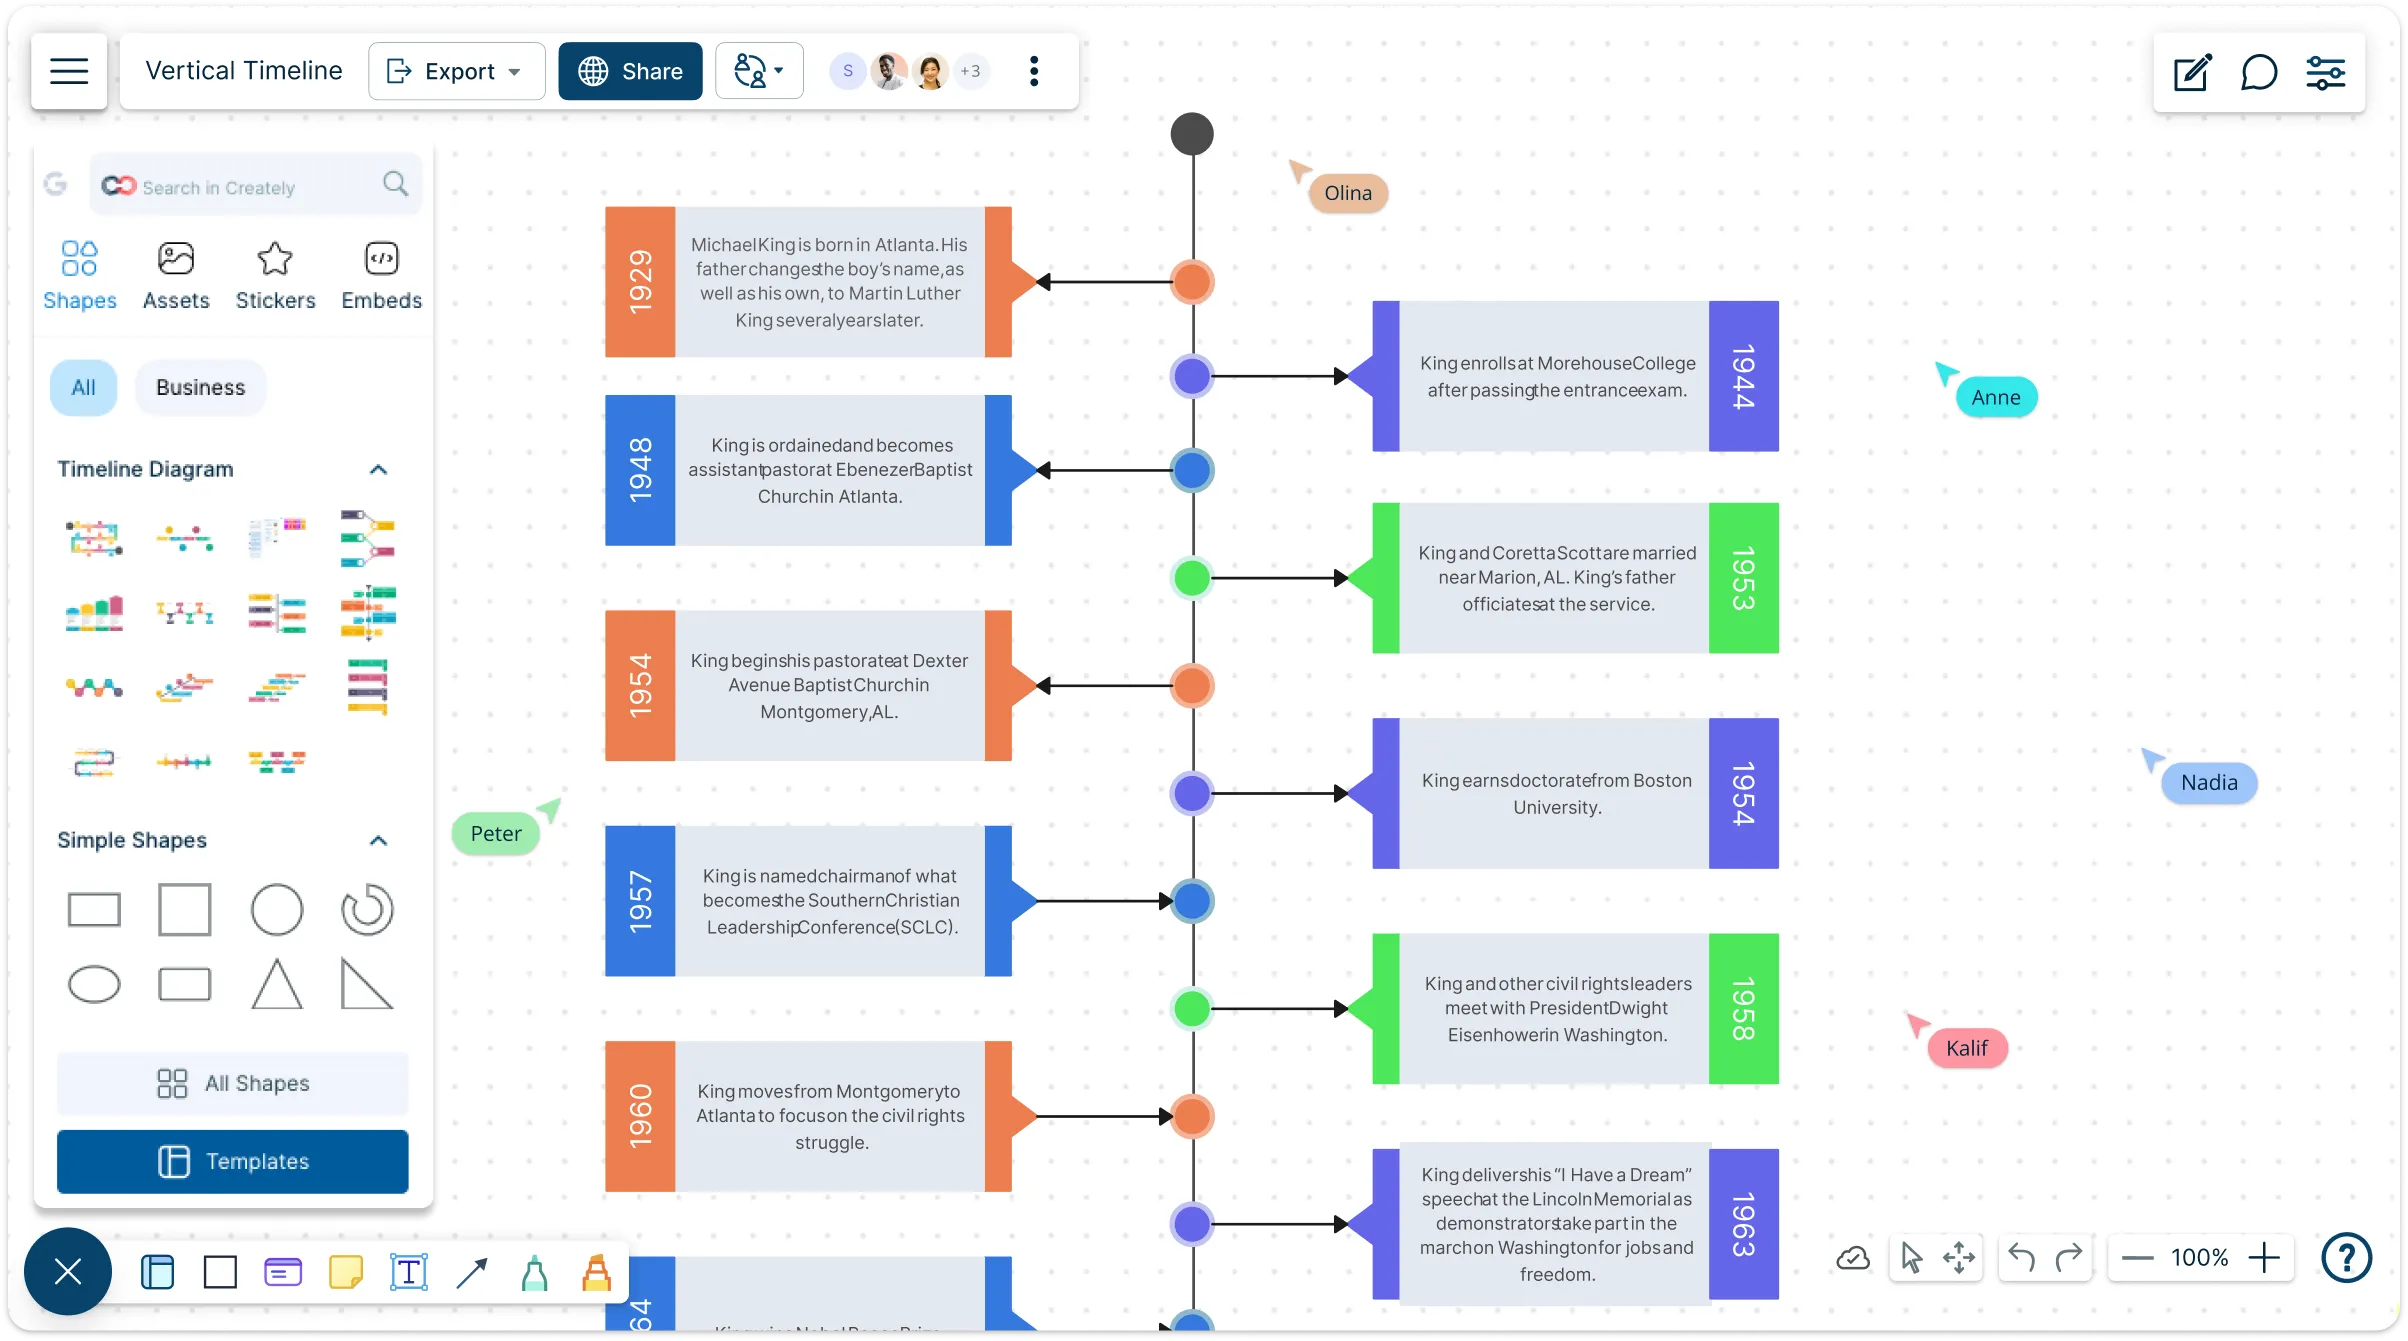
Turn complex timelines into clear, actionable plans. With Creately’s vertical timeline template, track projects, events, and milestones from start to finish—all in a single, intuitive view.
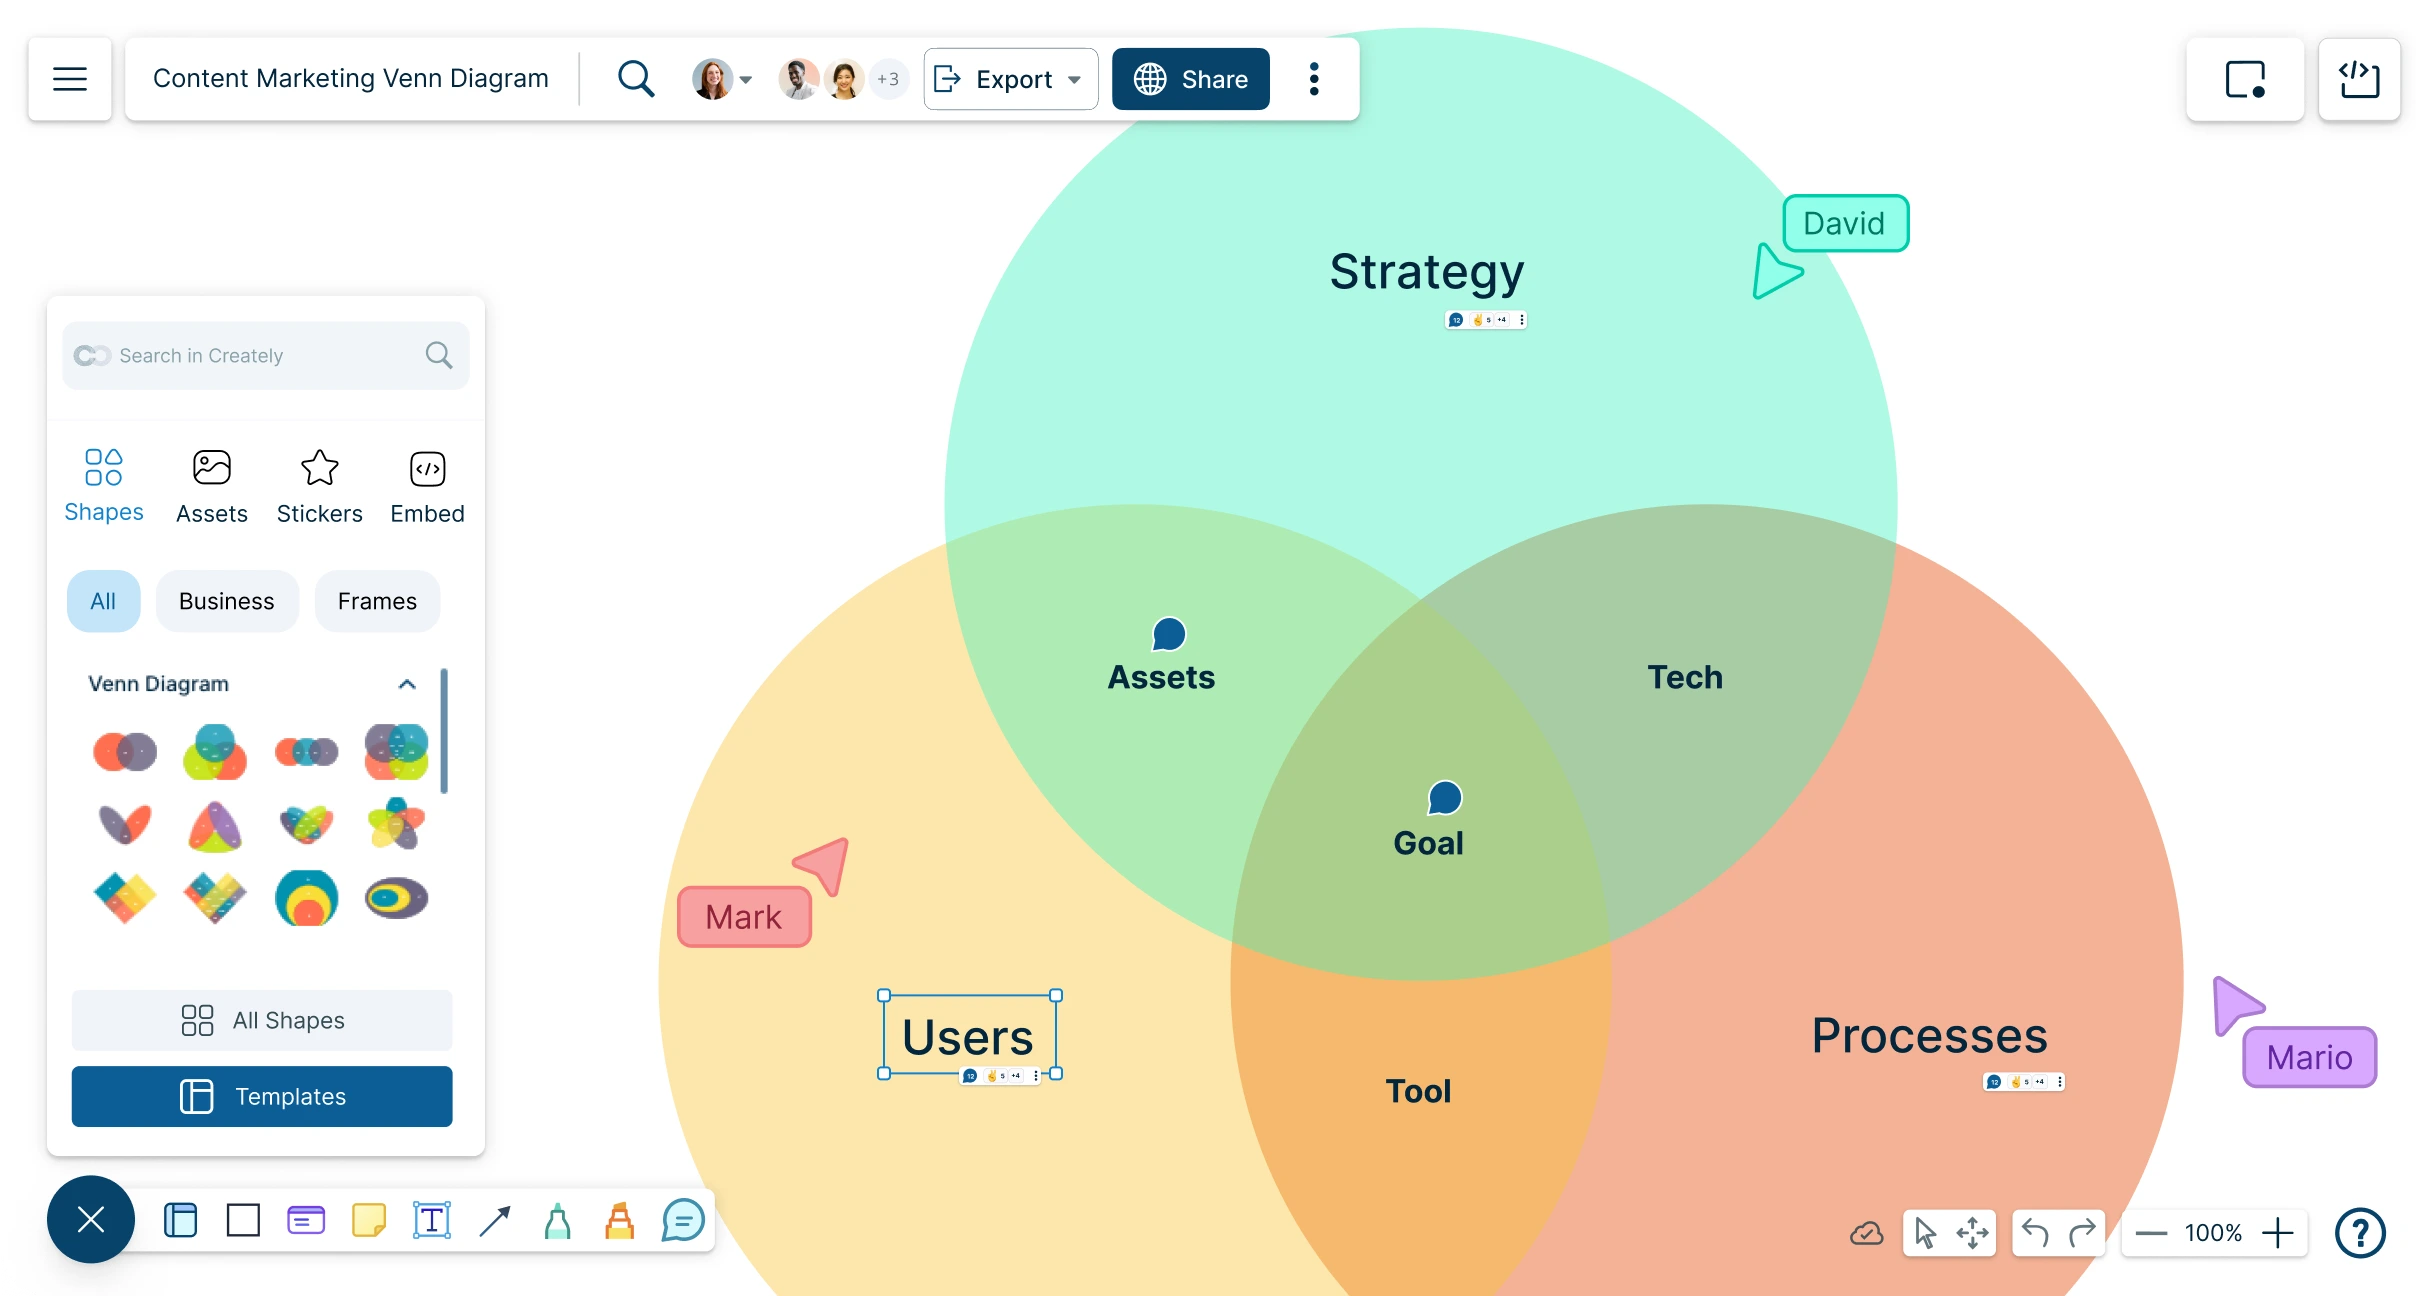
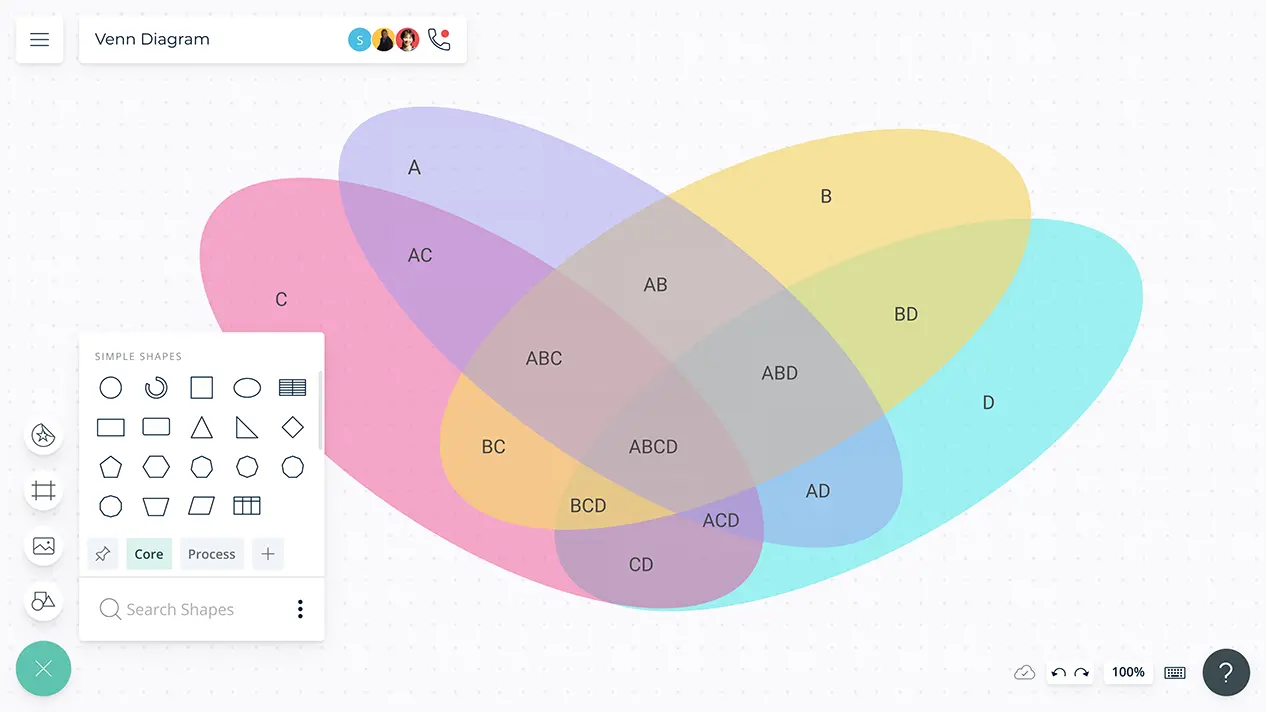
Compare ideas, options, concepts, or groups with editable Venn diagrams that help people see what is different, what overlaps, and what matters most.
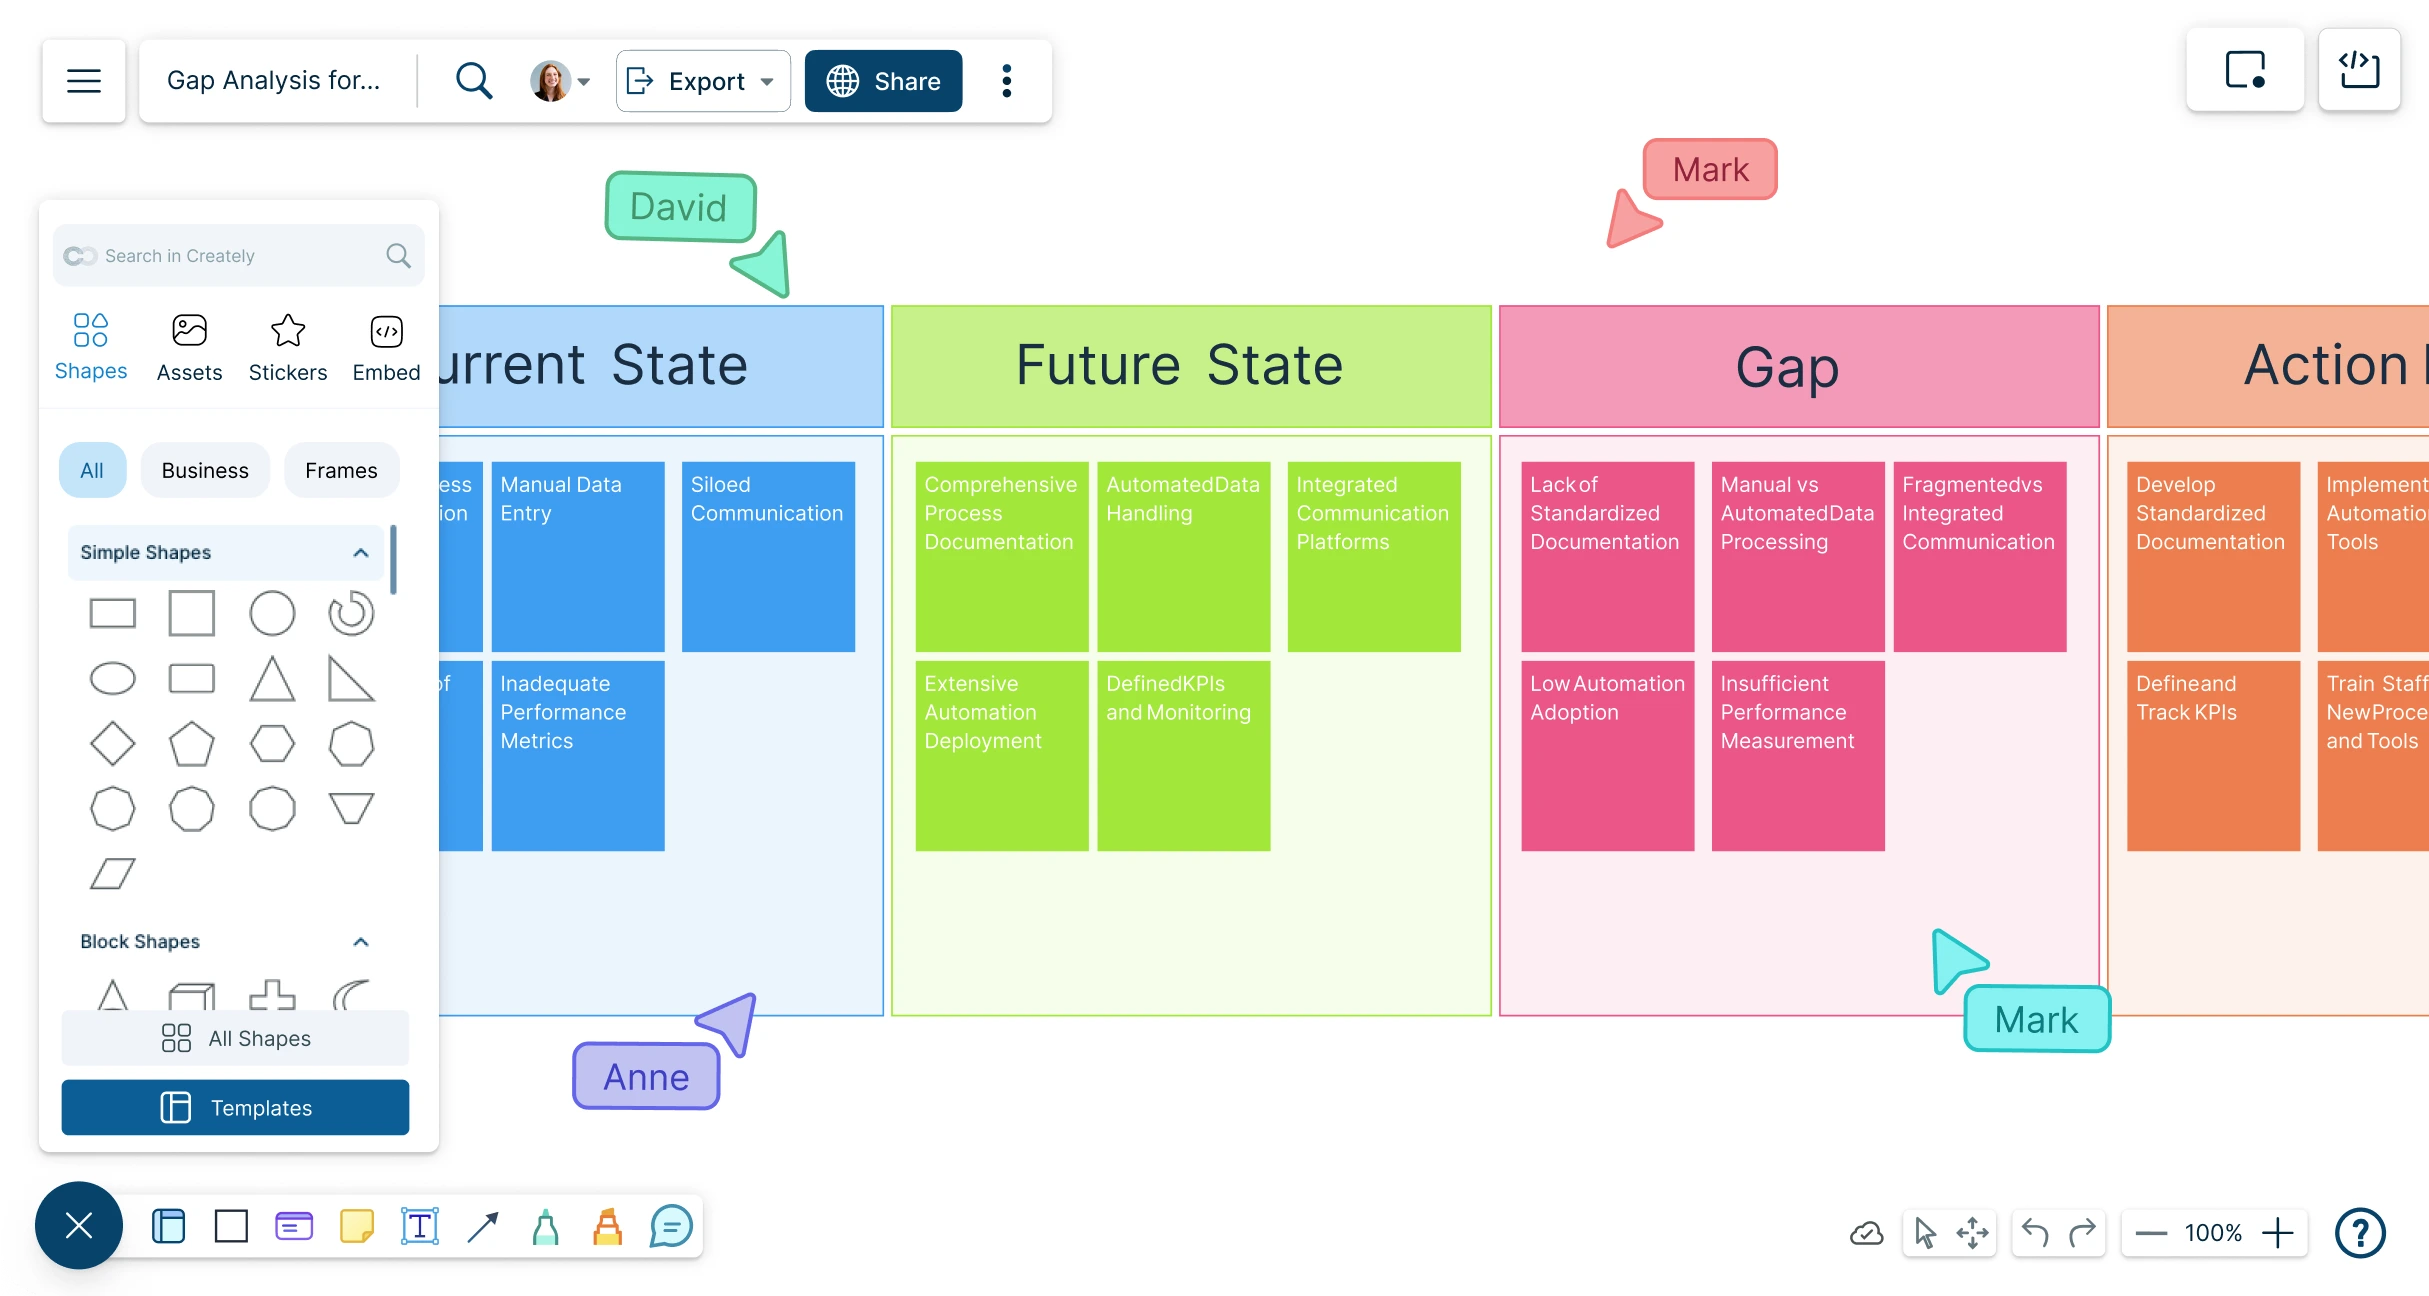
Quickly map your current vs. target state, identify gaps, and align teams on a clear path forward with Creately’s visual and collaborative gap analysis tool.
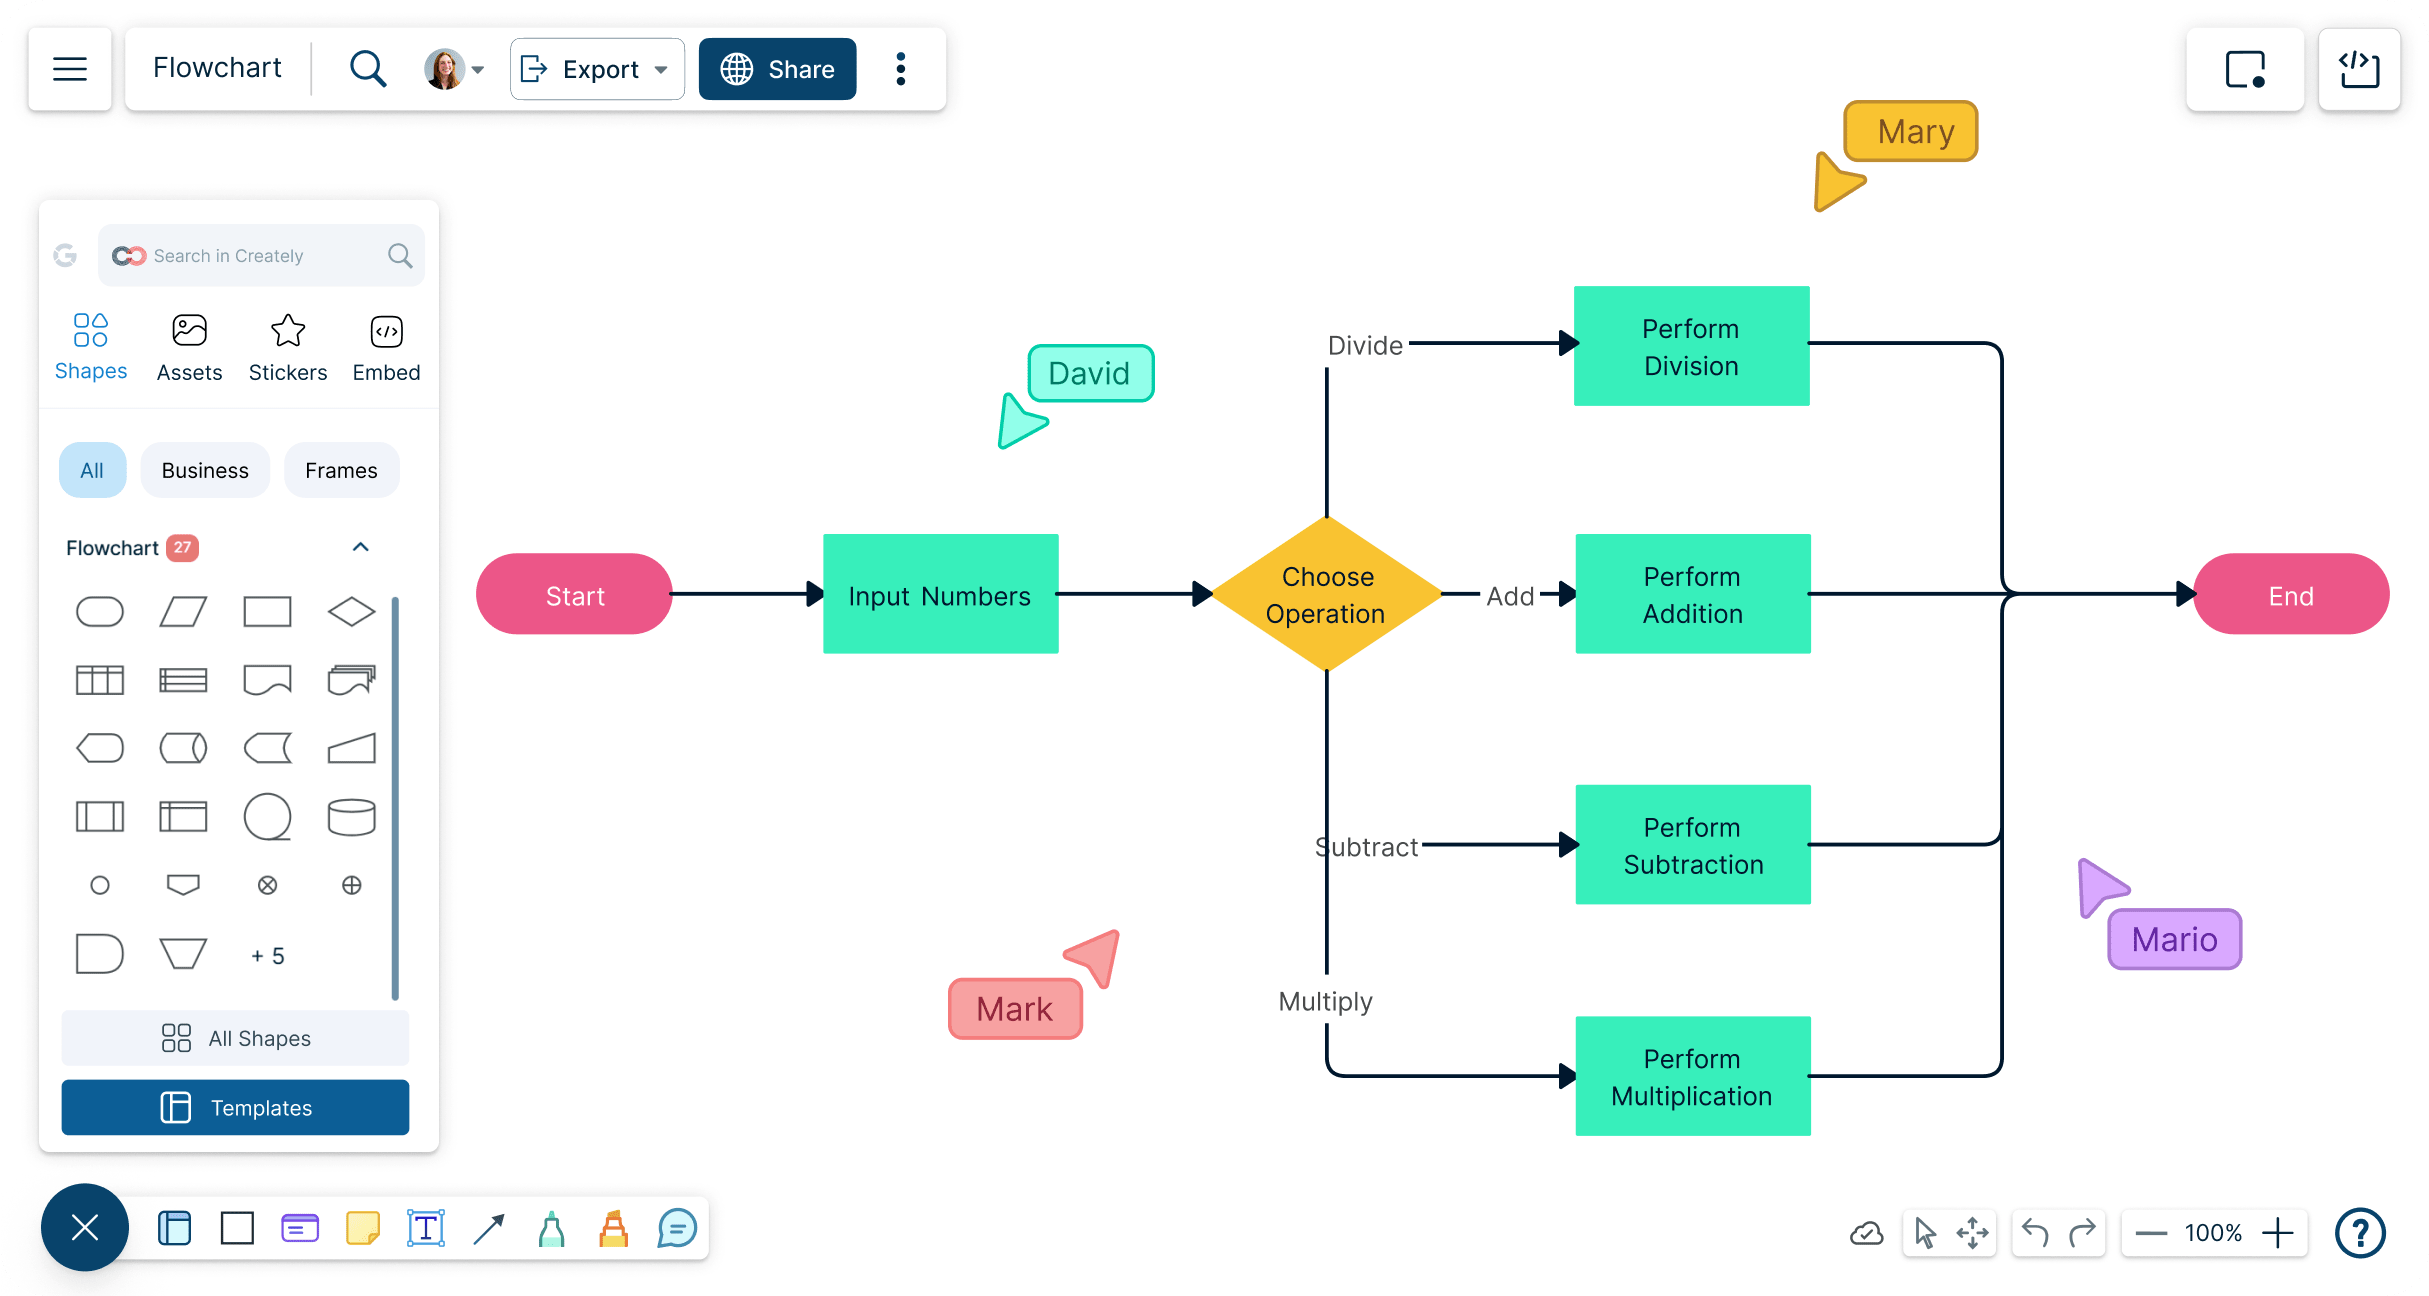
Collaboratively map processes and workflows with Creately’s flowchart software for Mac, delivering a smooth, optimized experience on Safari, Chrome, and other macOS browsers.
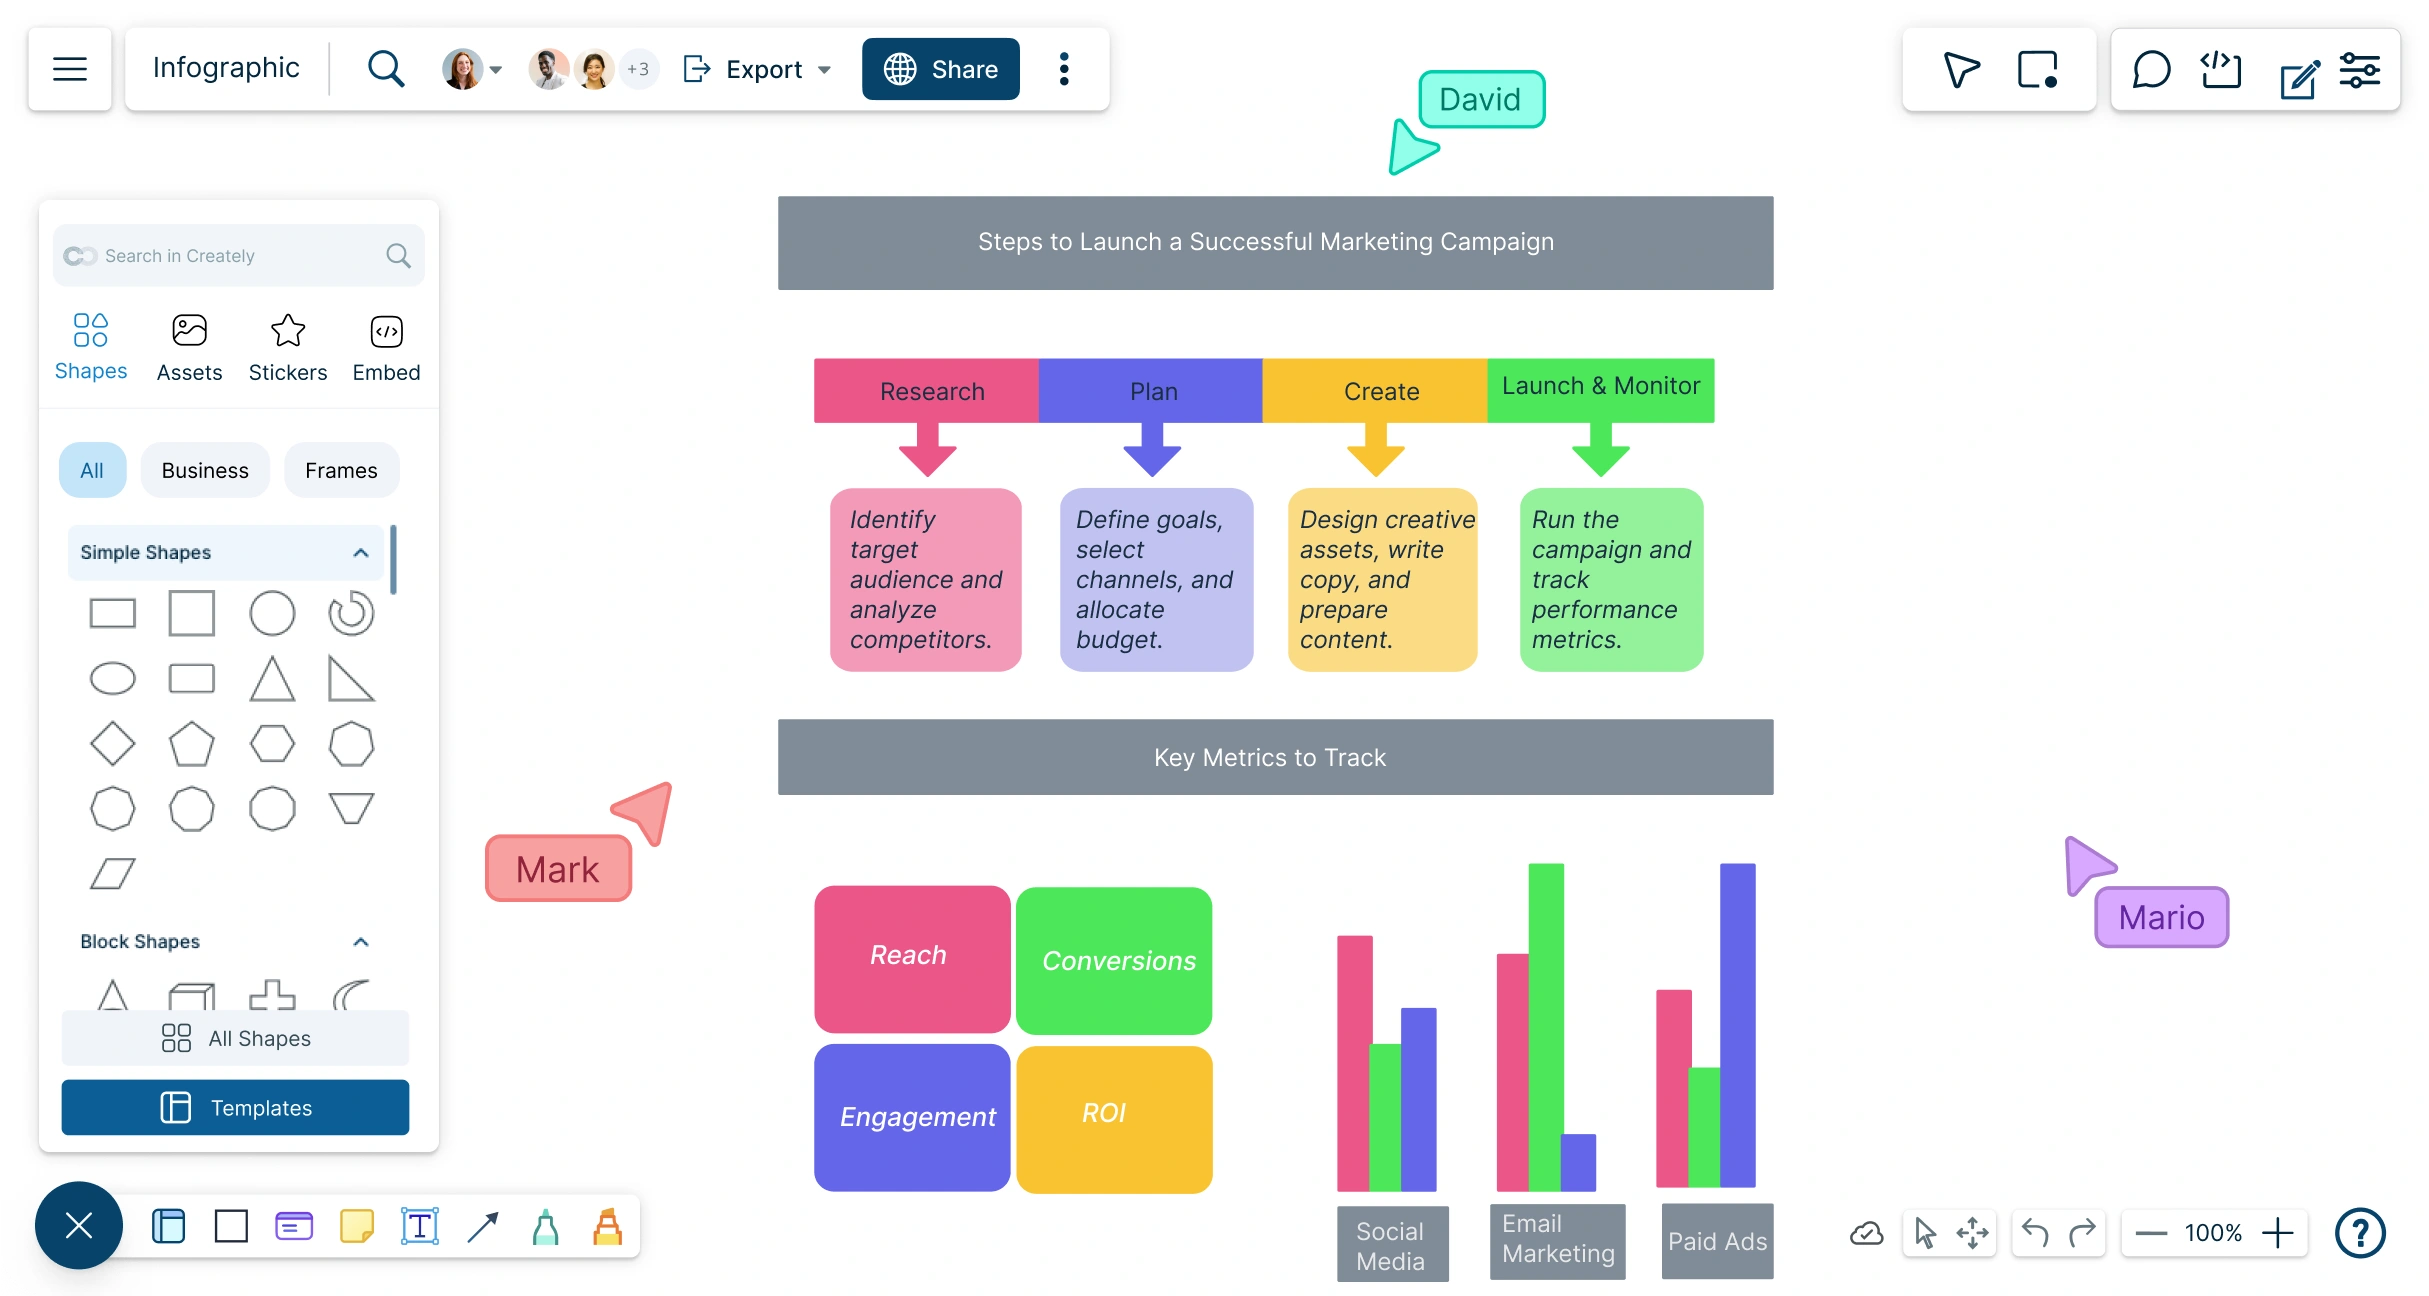
Generate interactive infographics with Creately’s easy-to-use infographic creator. Customize templates, collaborate with your team, and illustrate complex data or information.
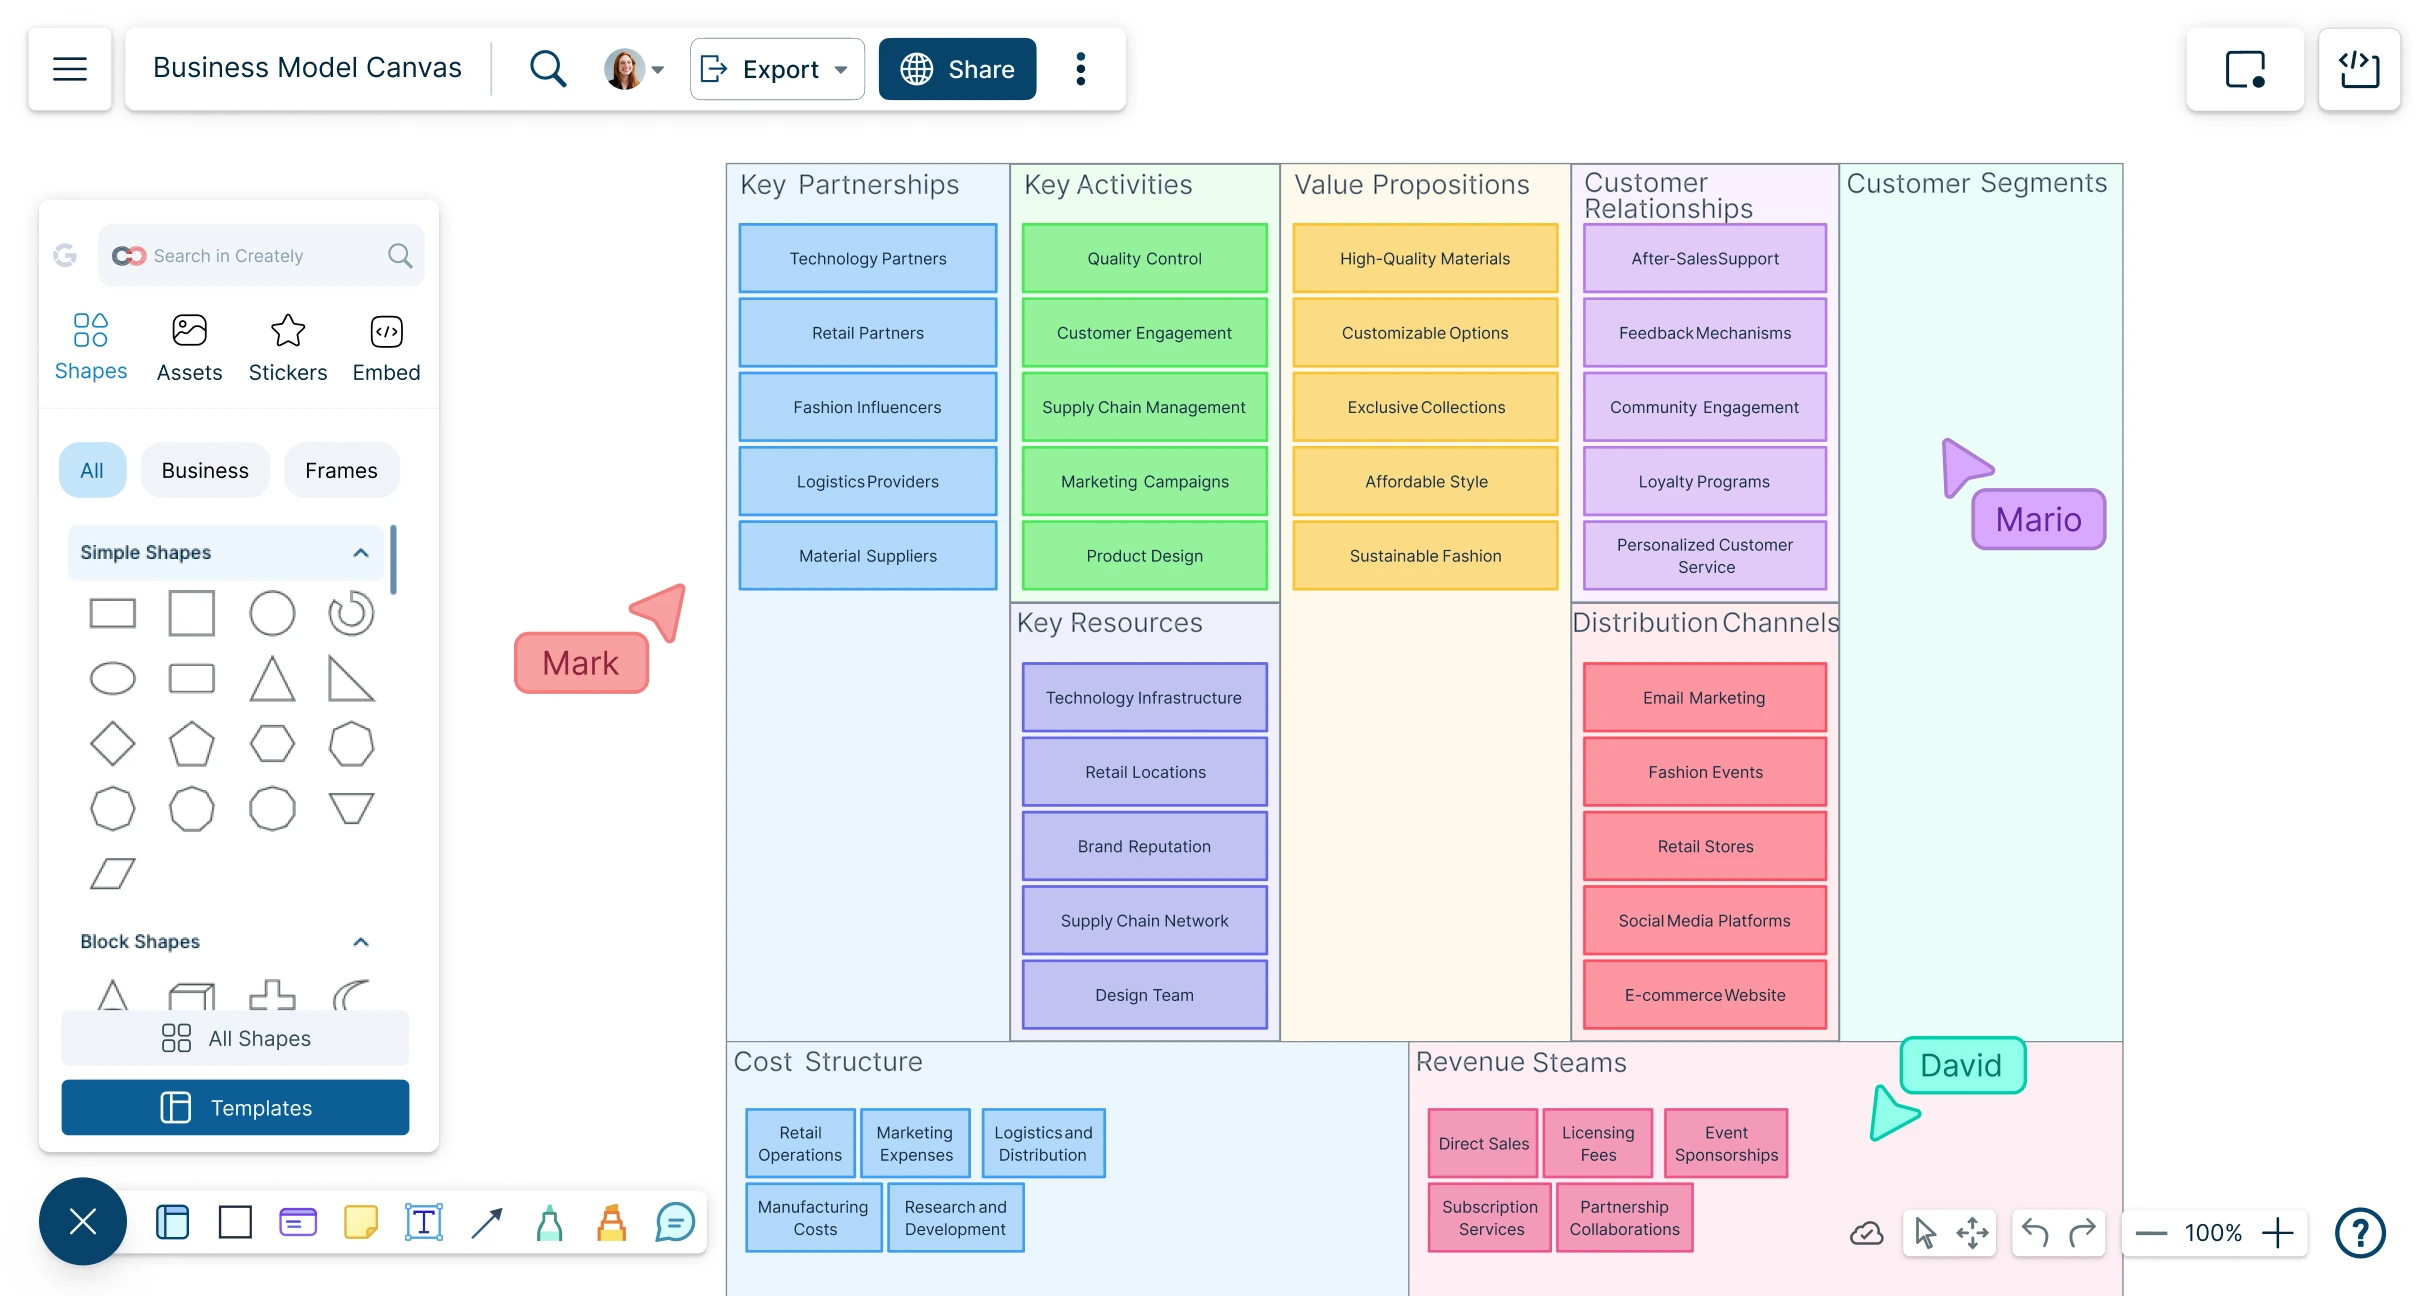
Easily transform business planning with Creately’s Business Model Canvas Generator — ideal for quickly creating, refining, and collaborating on business models.
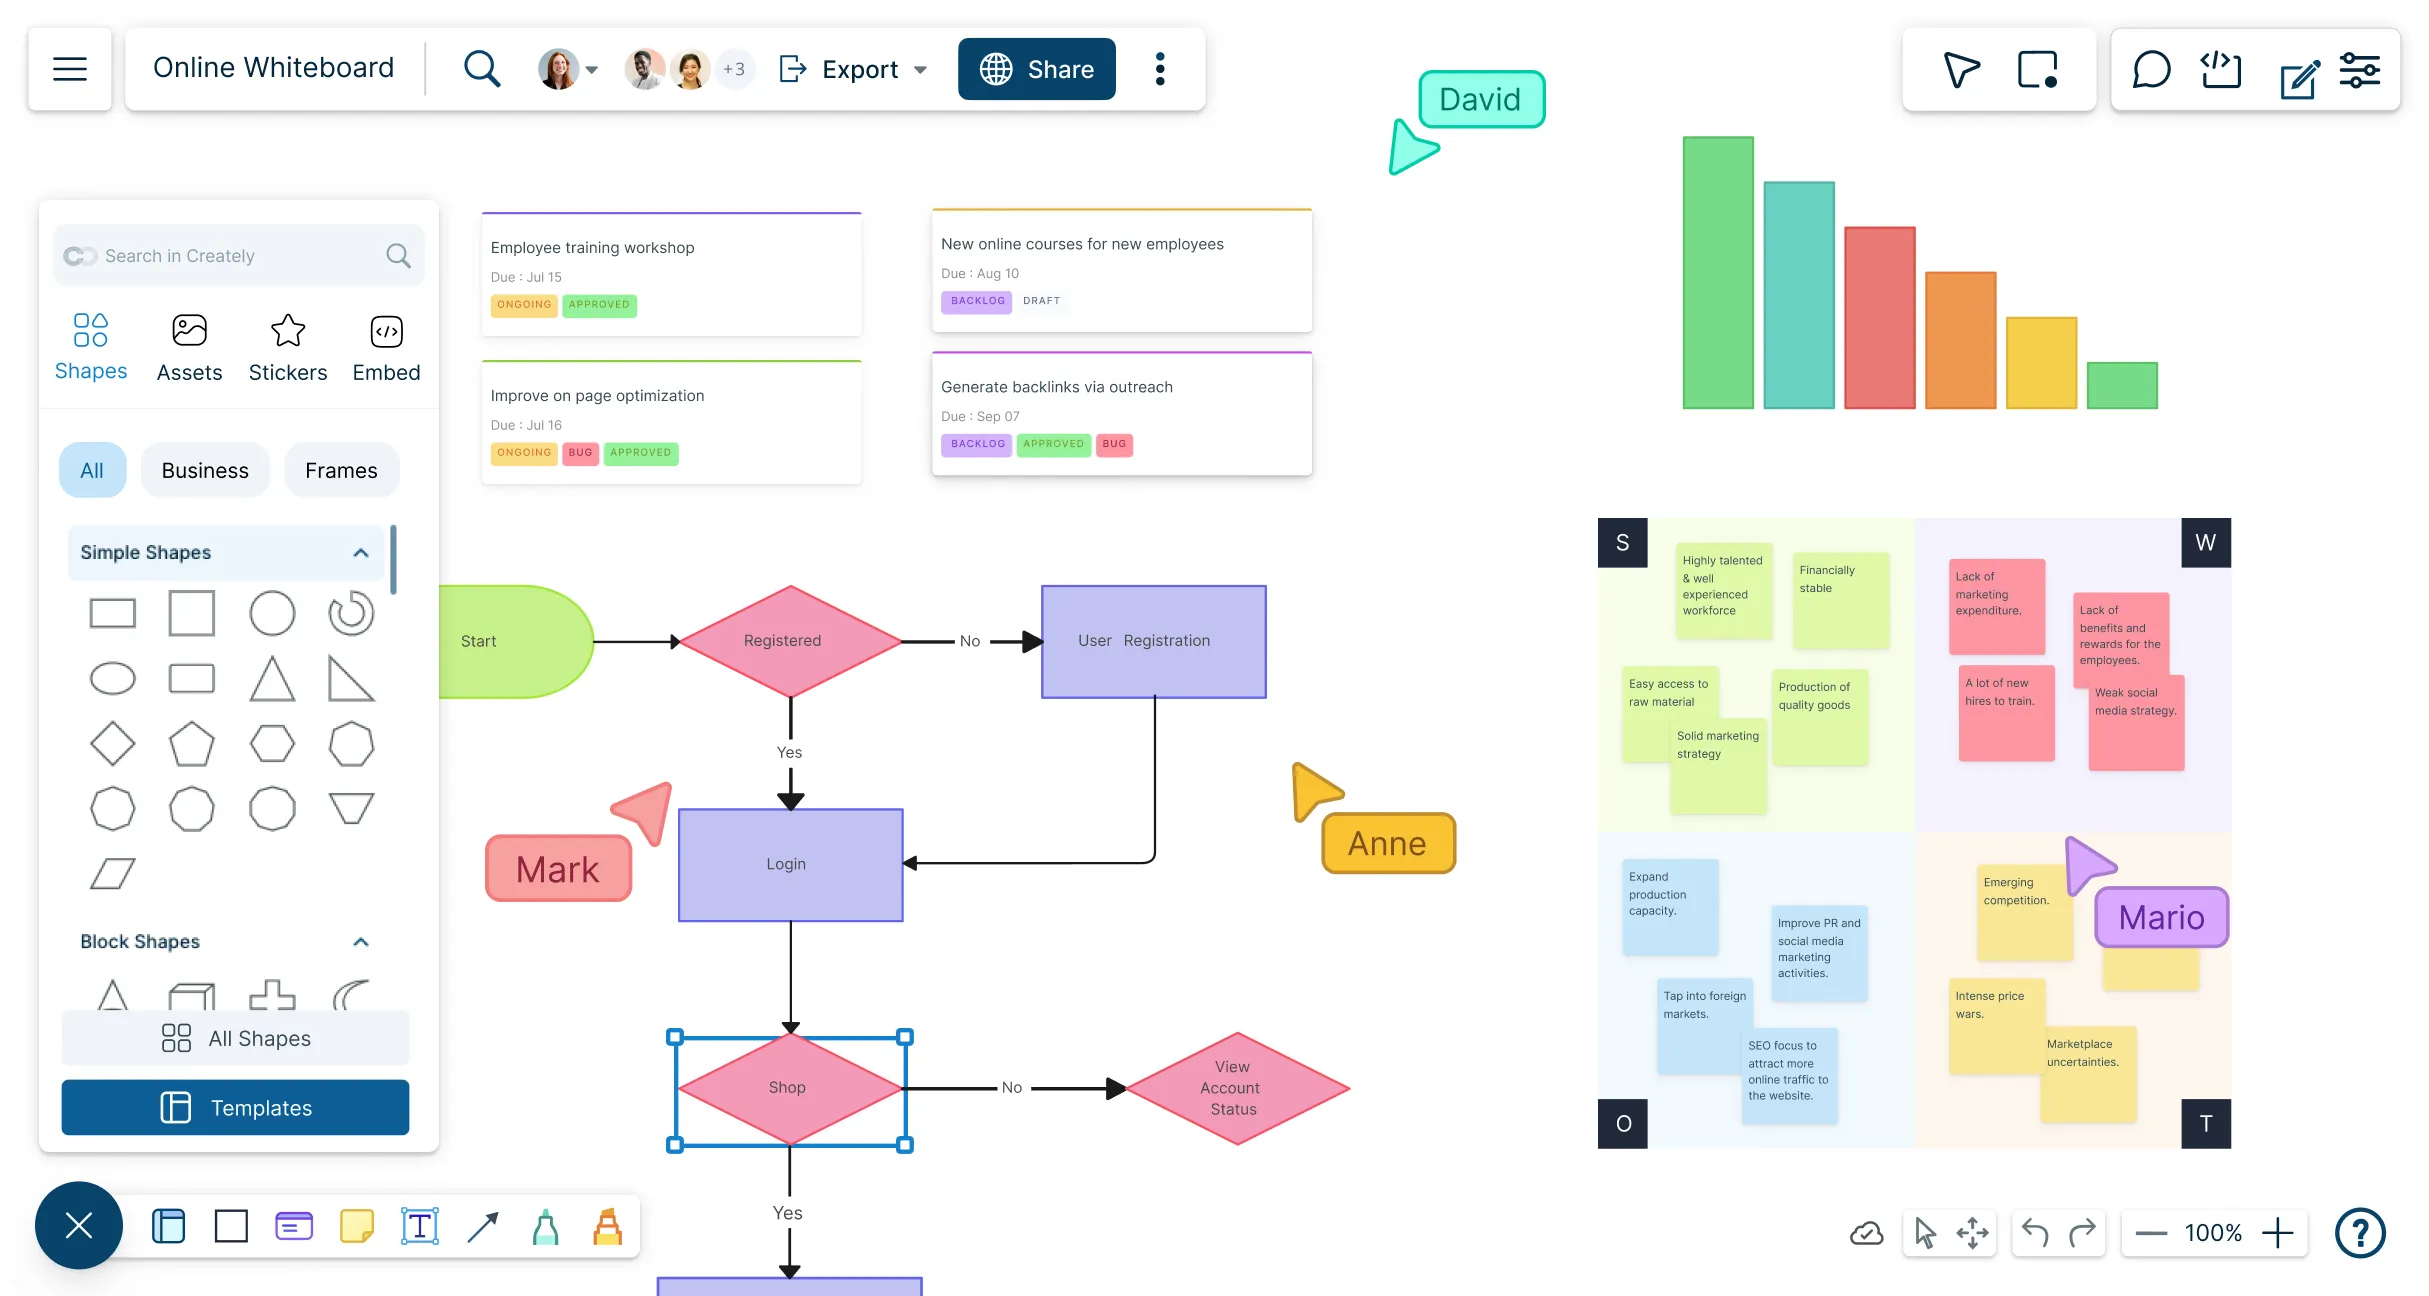
Brainstorm, plan, and visualize ideas together—whether in class, at work, or remotely—with our intuitive, unlimited-space virtual whiteboard.
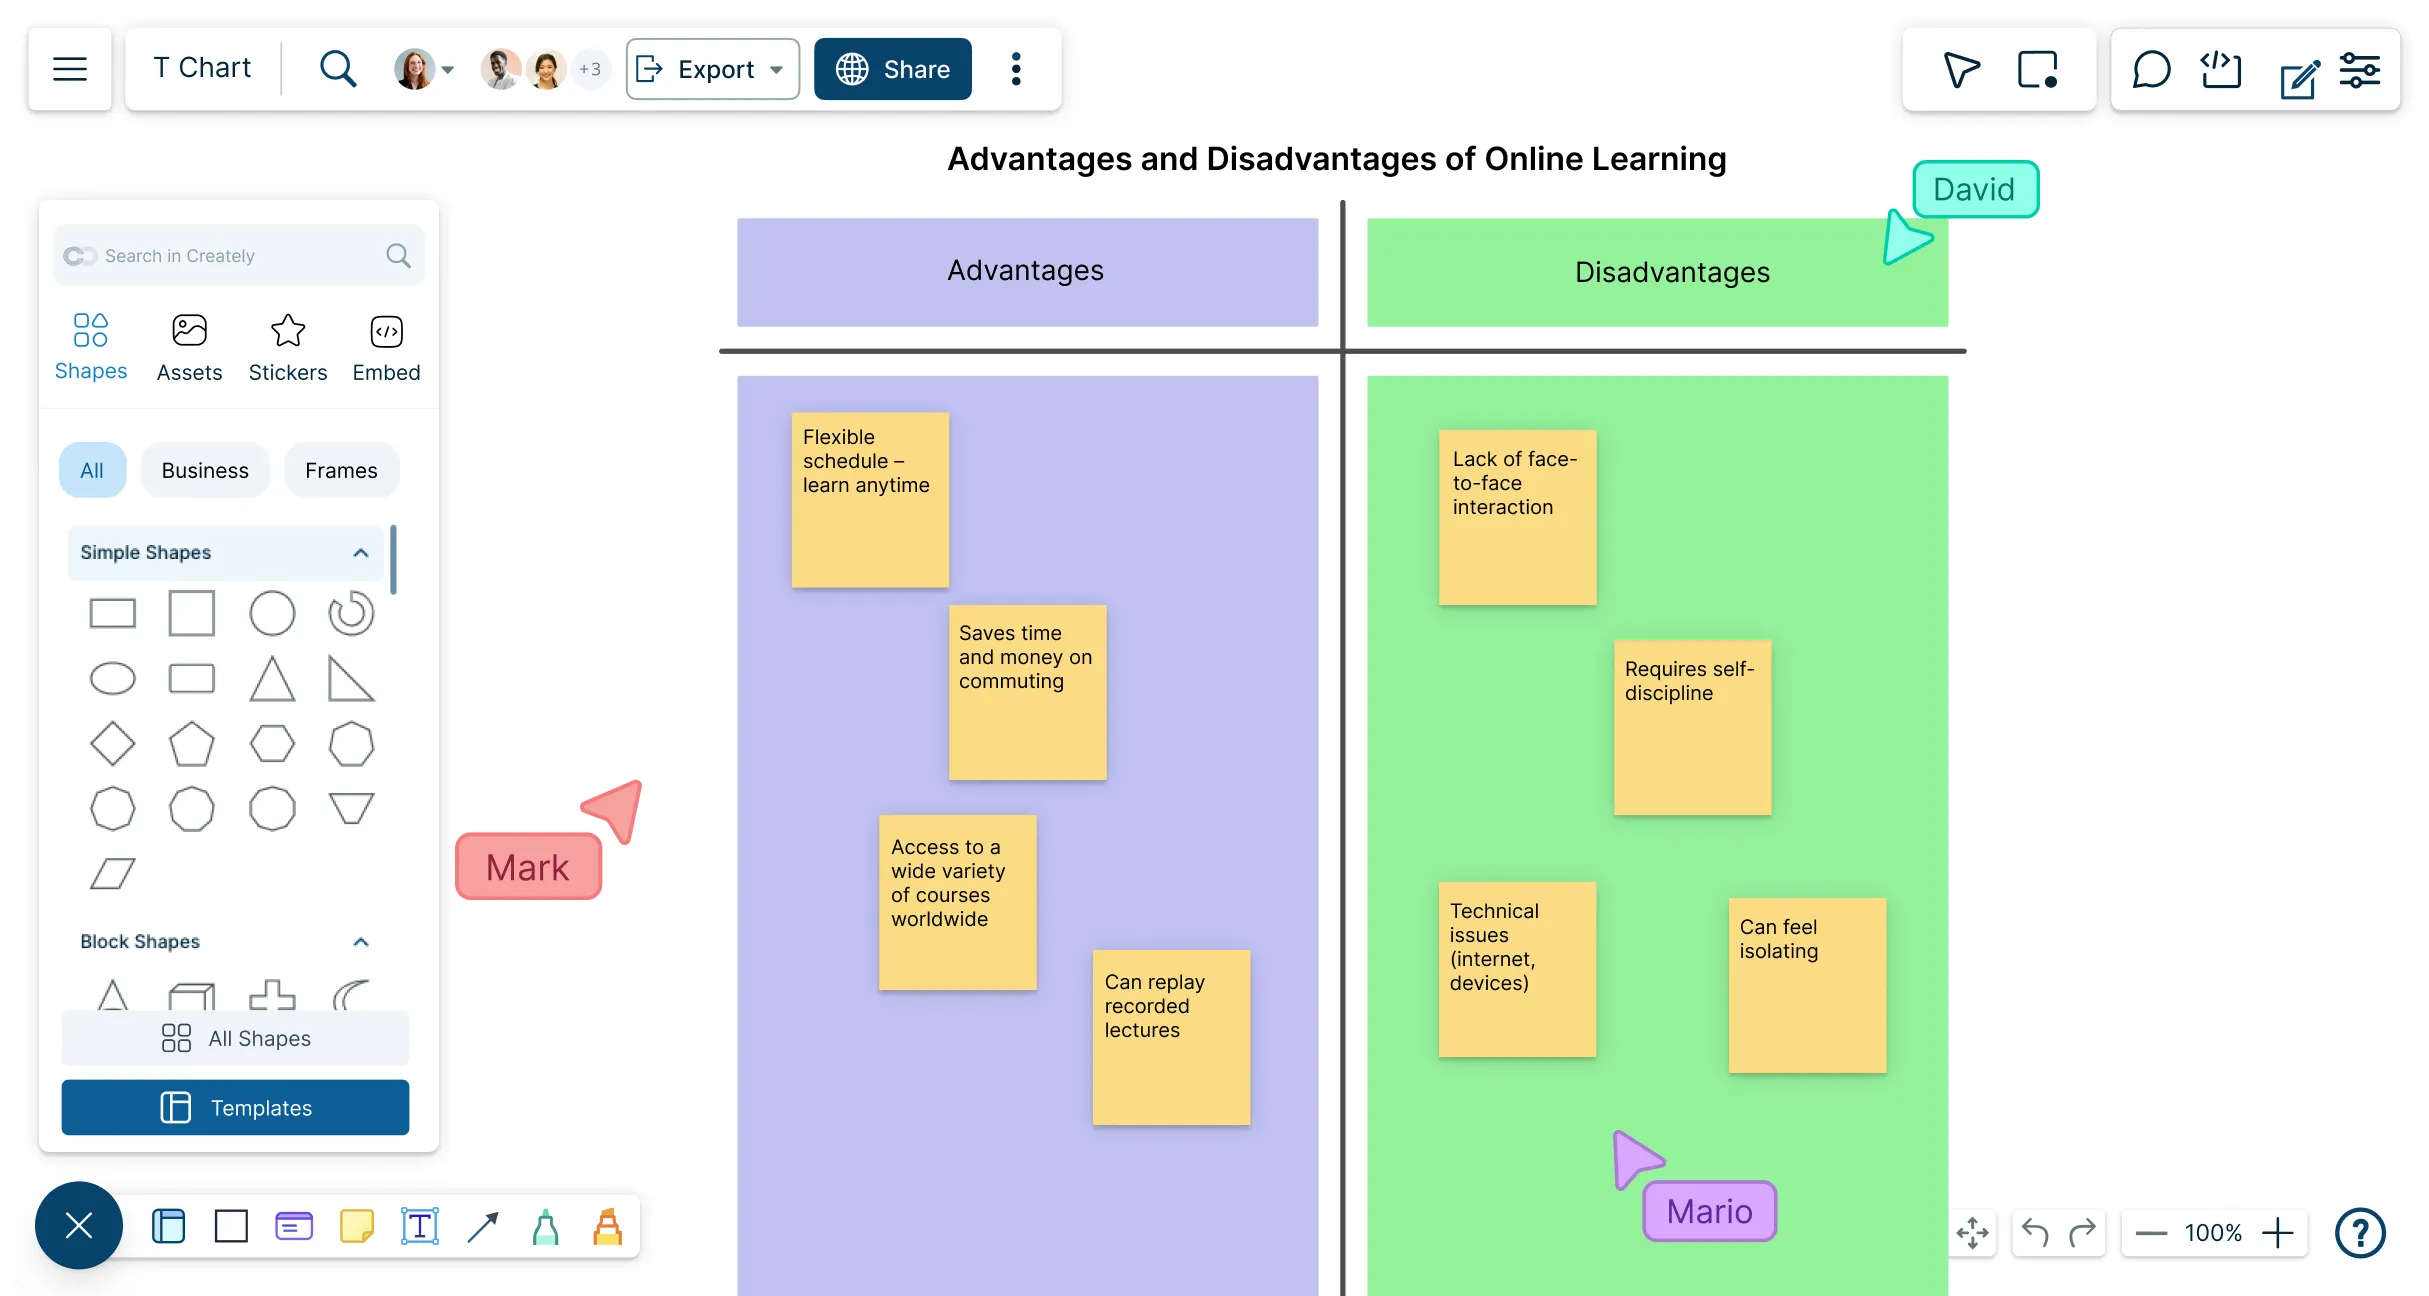
Compare and contrast opposing views, including facts vs. opinions, advantages vs. disadvantages or strengths vs. weaknesses, with our free intuitive T chart creator.
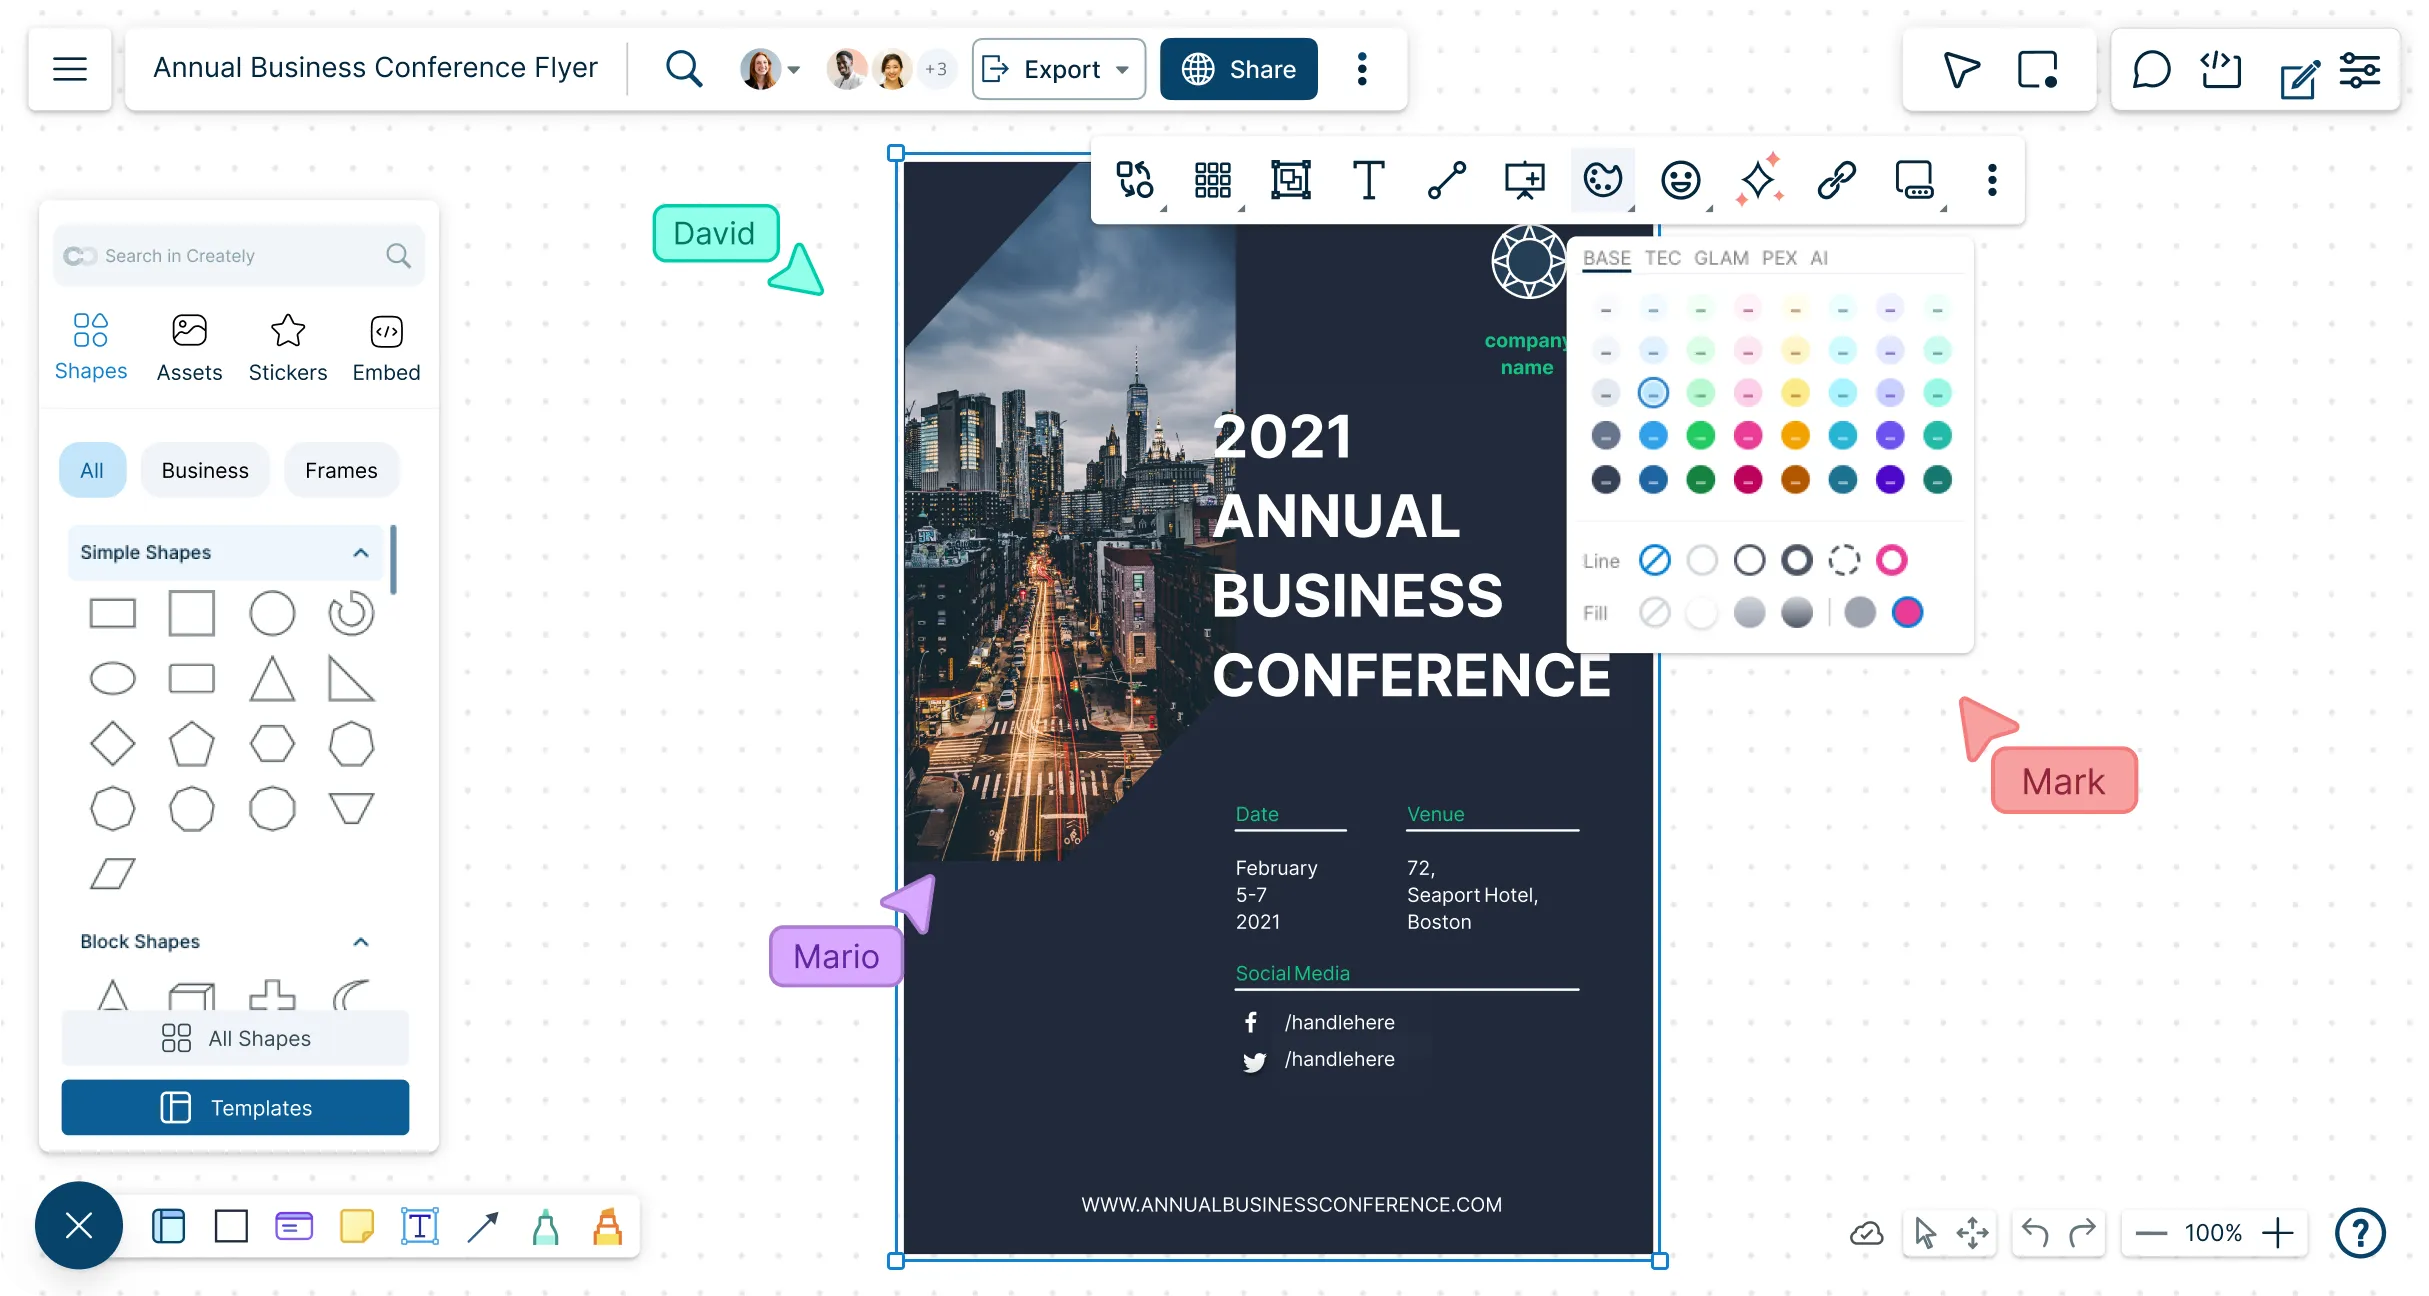
Create eye-catching flyers in minutes with Creately’s intuitive flyer creator—no design skills needed.
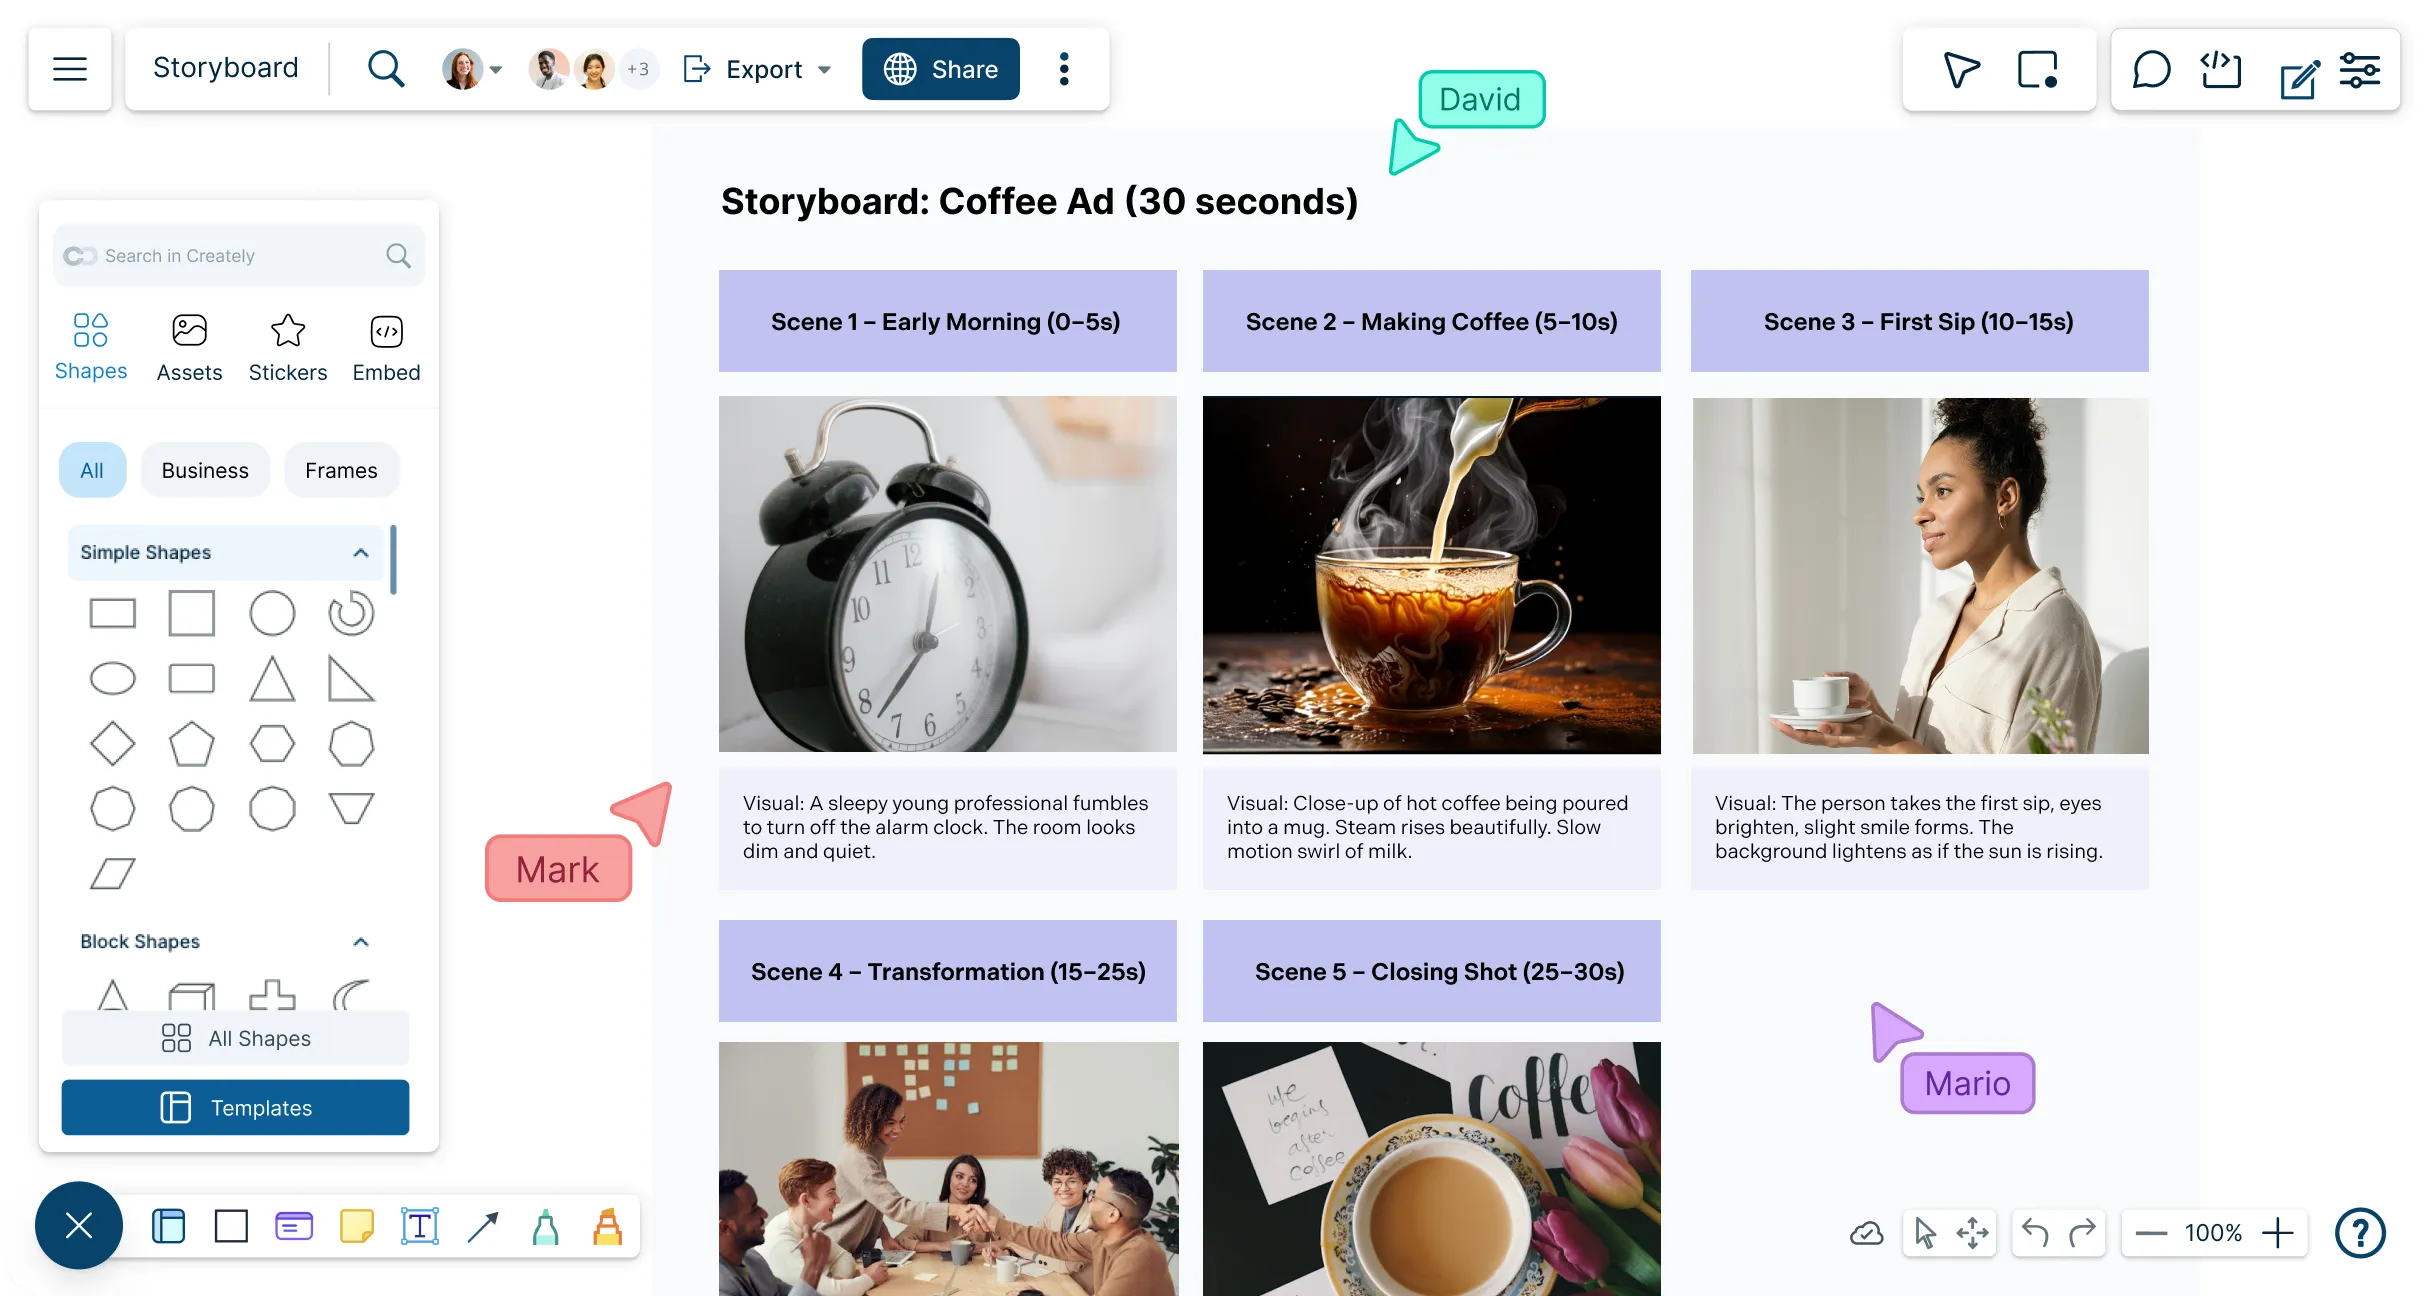
Plan, design, and bring your video ideas to life with Creately’s intuitive storyboard maker. Collaborate in real time to create storyboards that clearly communicate your vision.
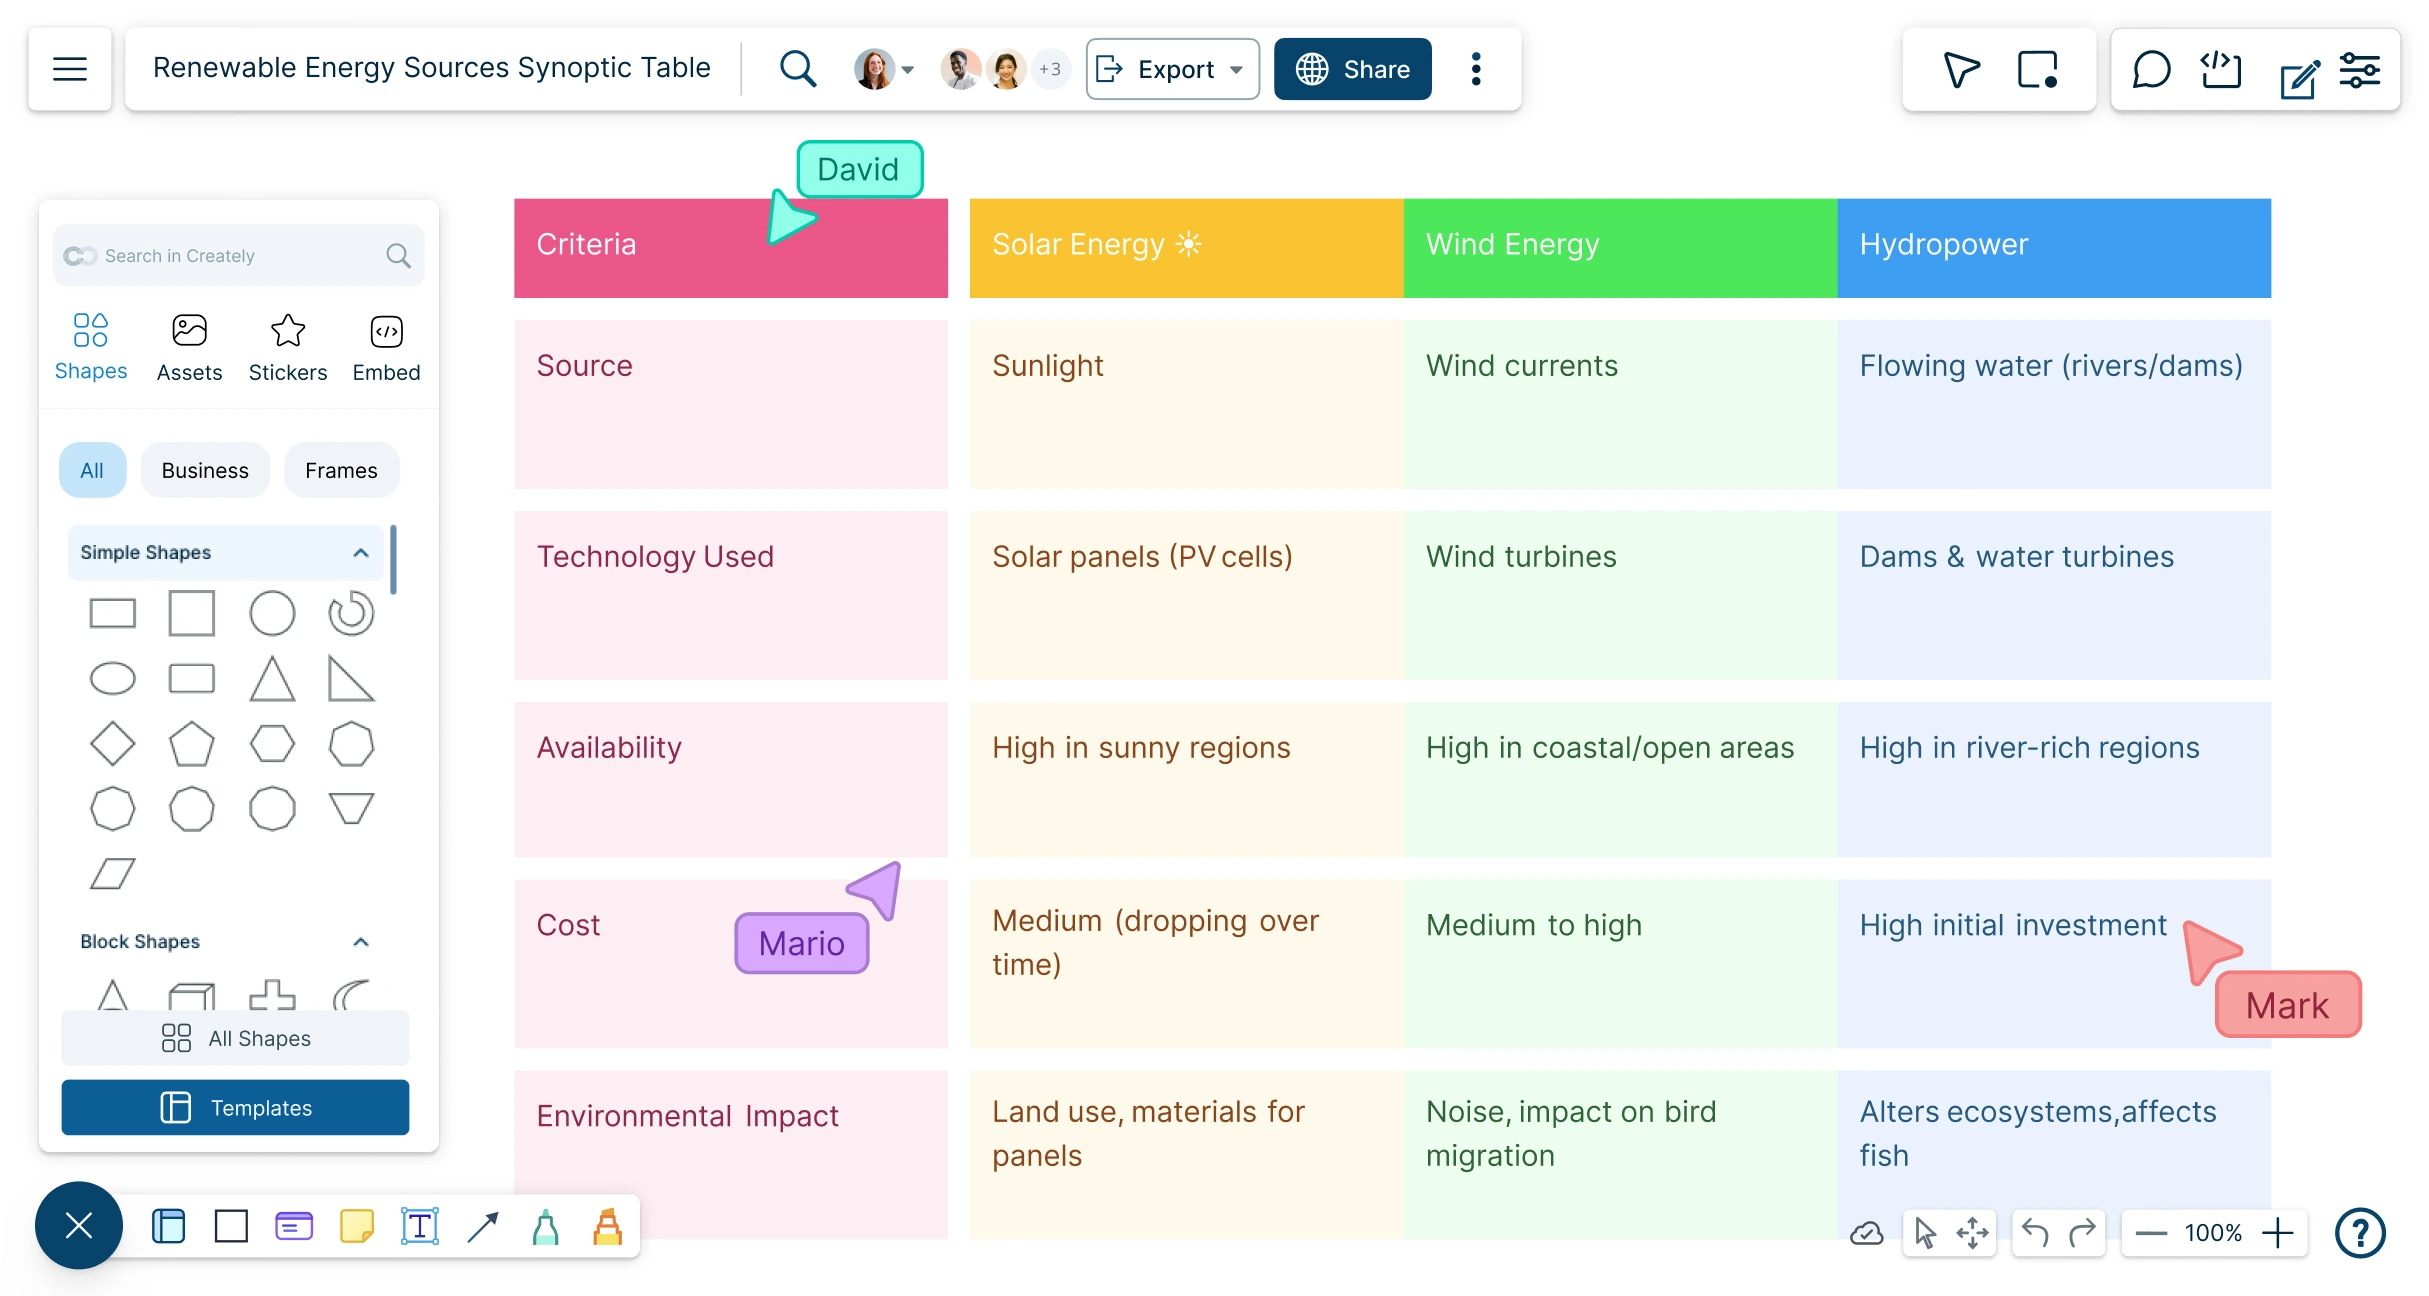
Creately’s Synoptic Table Maker lets you organize information side by side, highlight key similarities and differences, and uncover patterns and trends to help you make faster, more informed decisions.
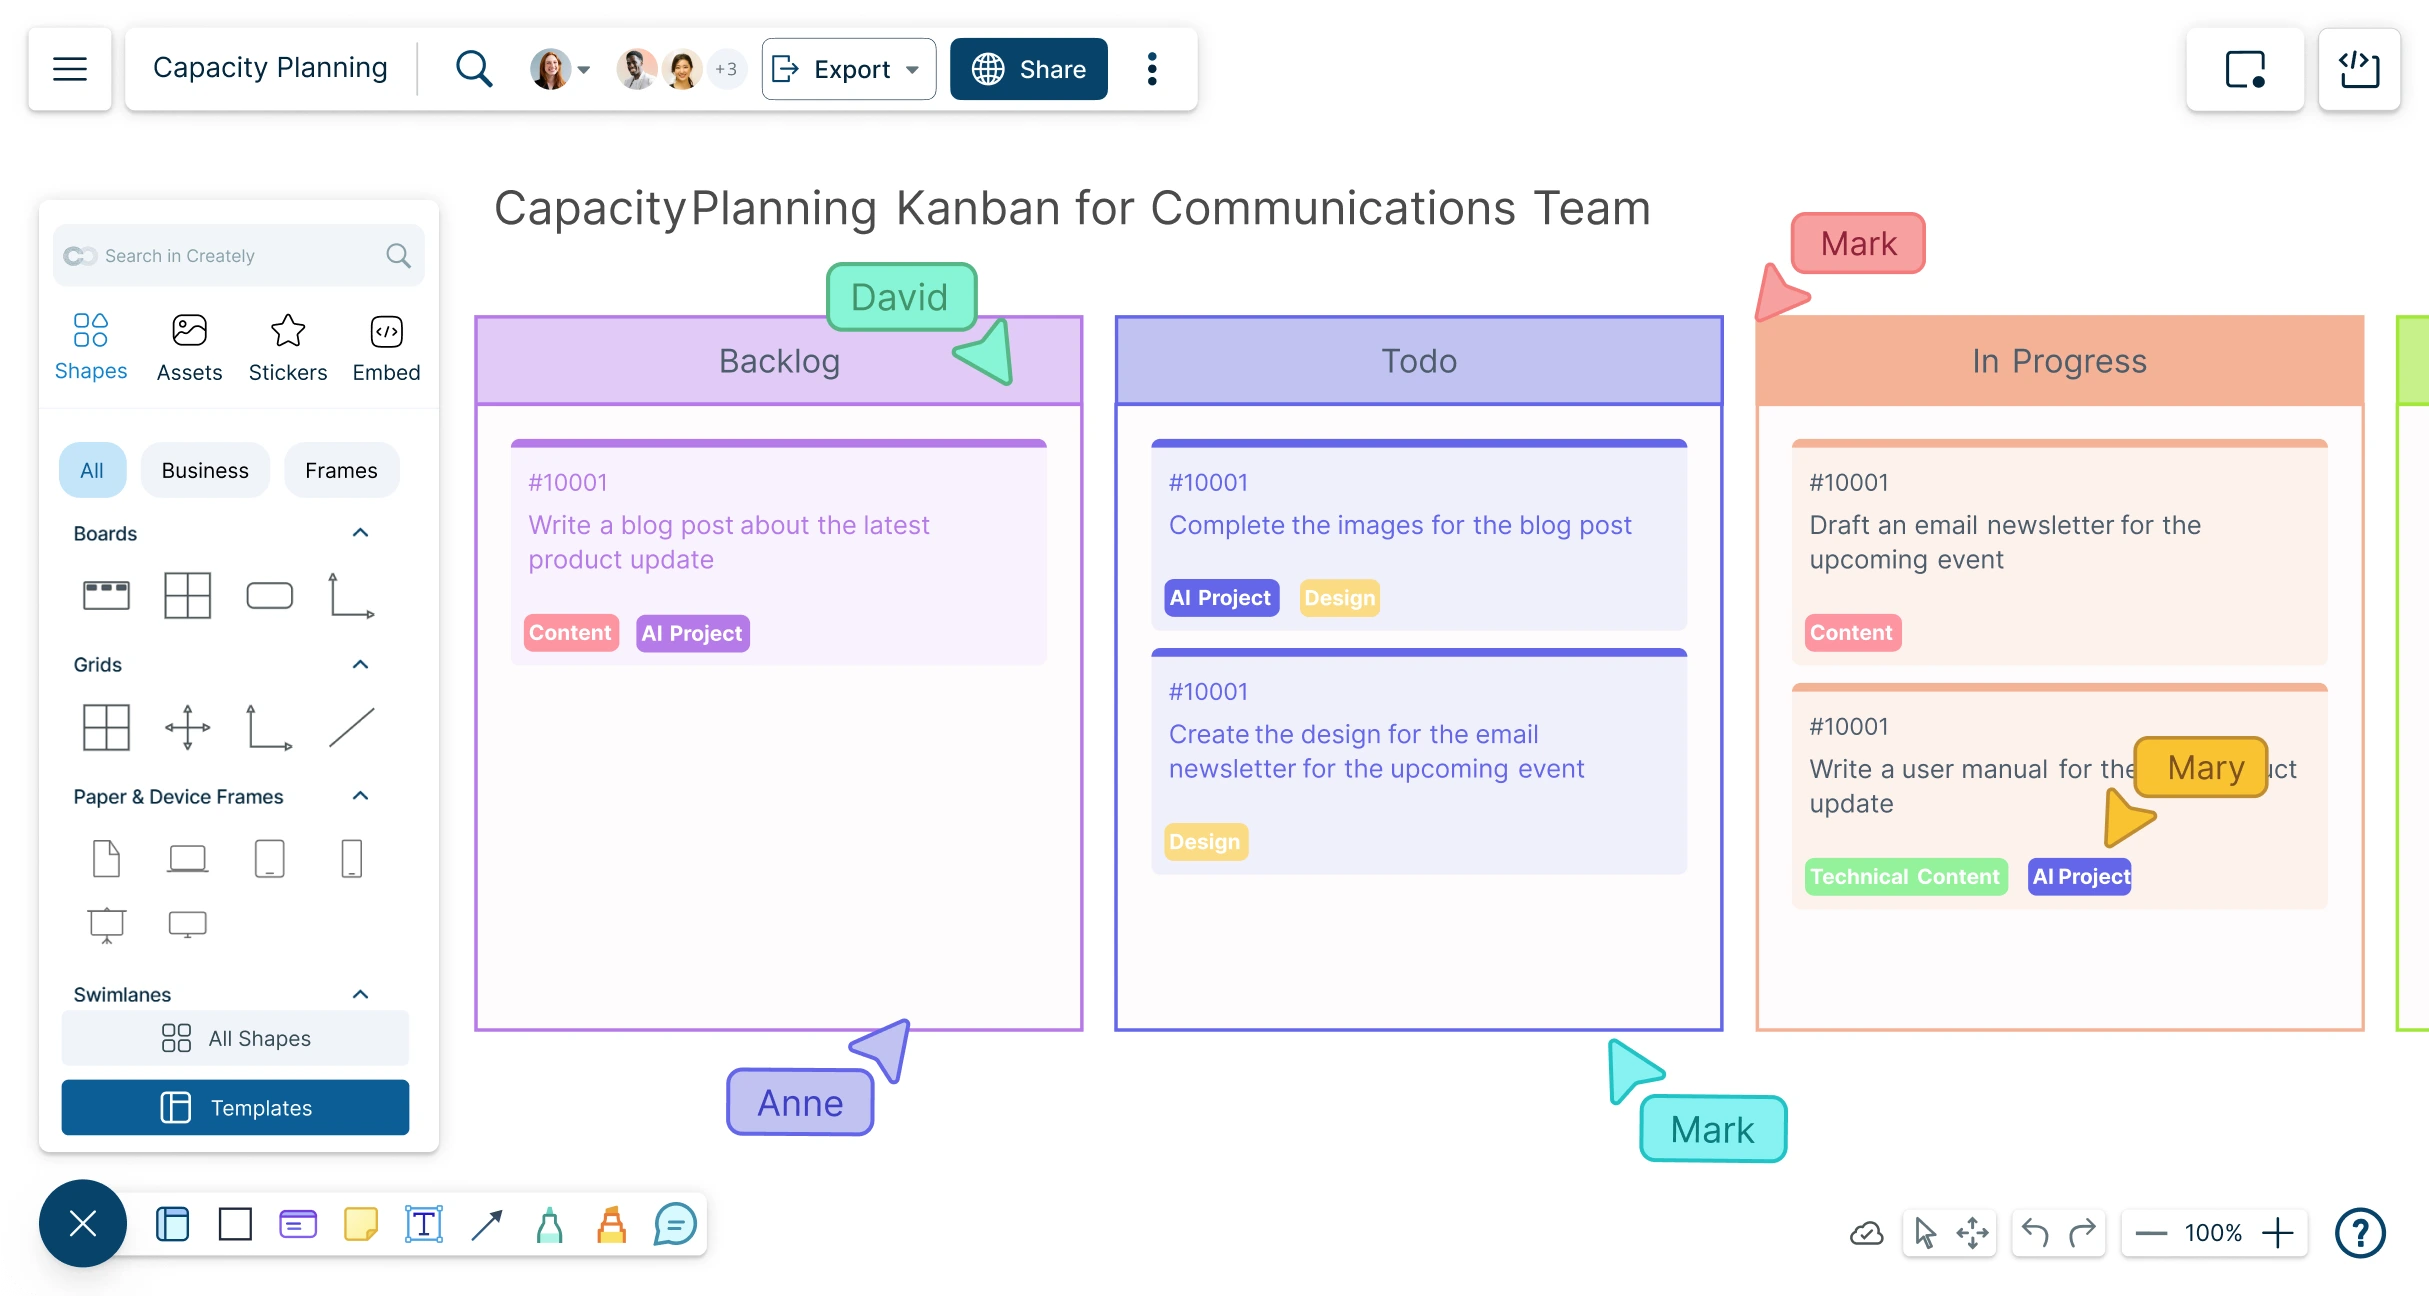
An online Kanban board to streamline projects, track task progress, and collaborate in real-time. Plan, prioritize, and get work done, visually and efficiently.
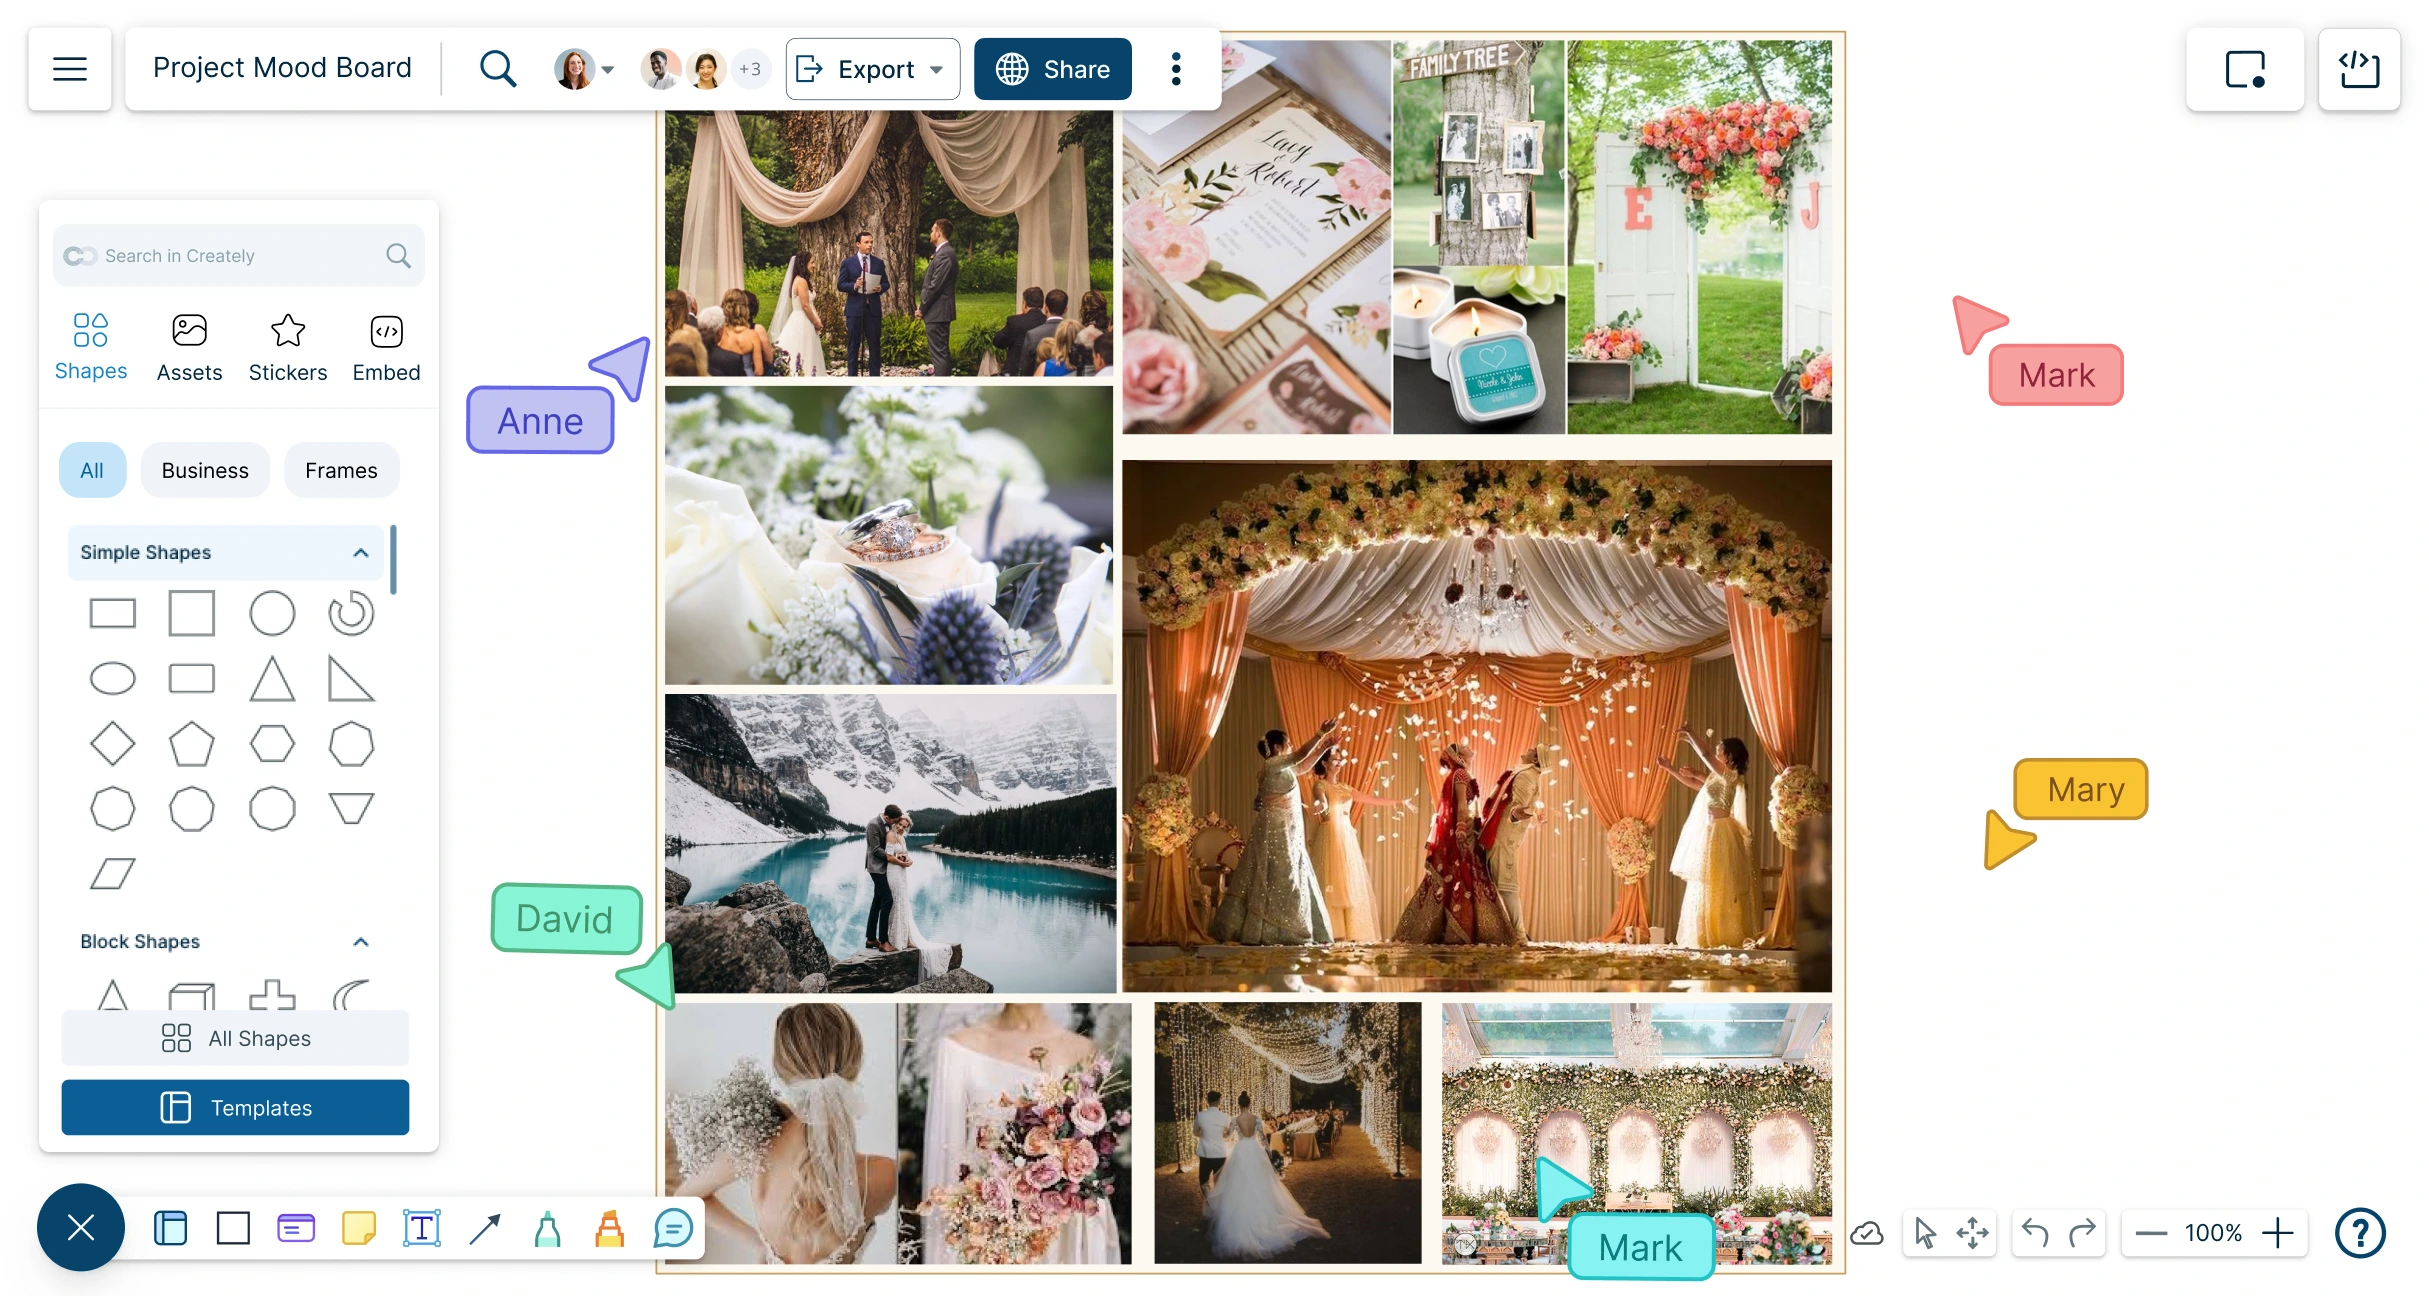
Effortlessly craft inspiring mood boards online and turn your creative ideas into stunning visual stories.
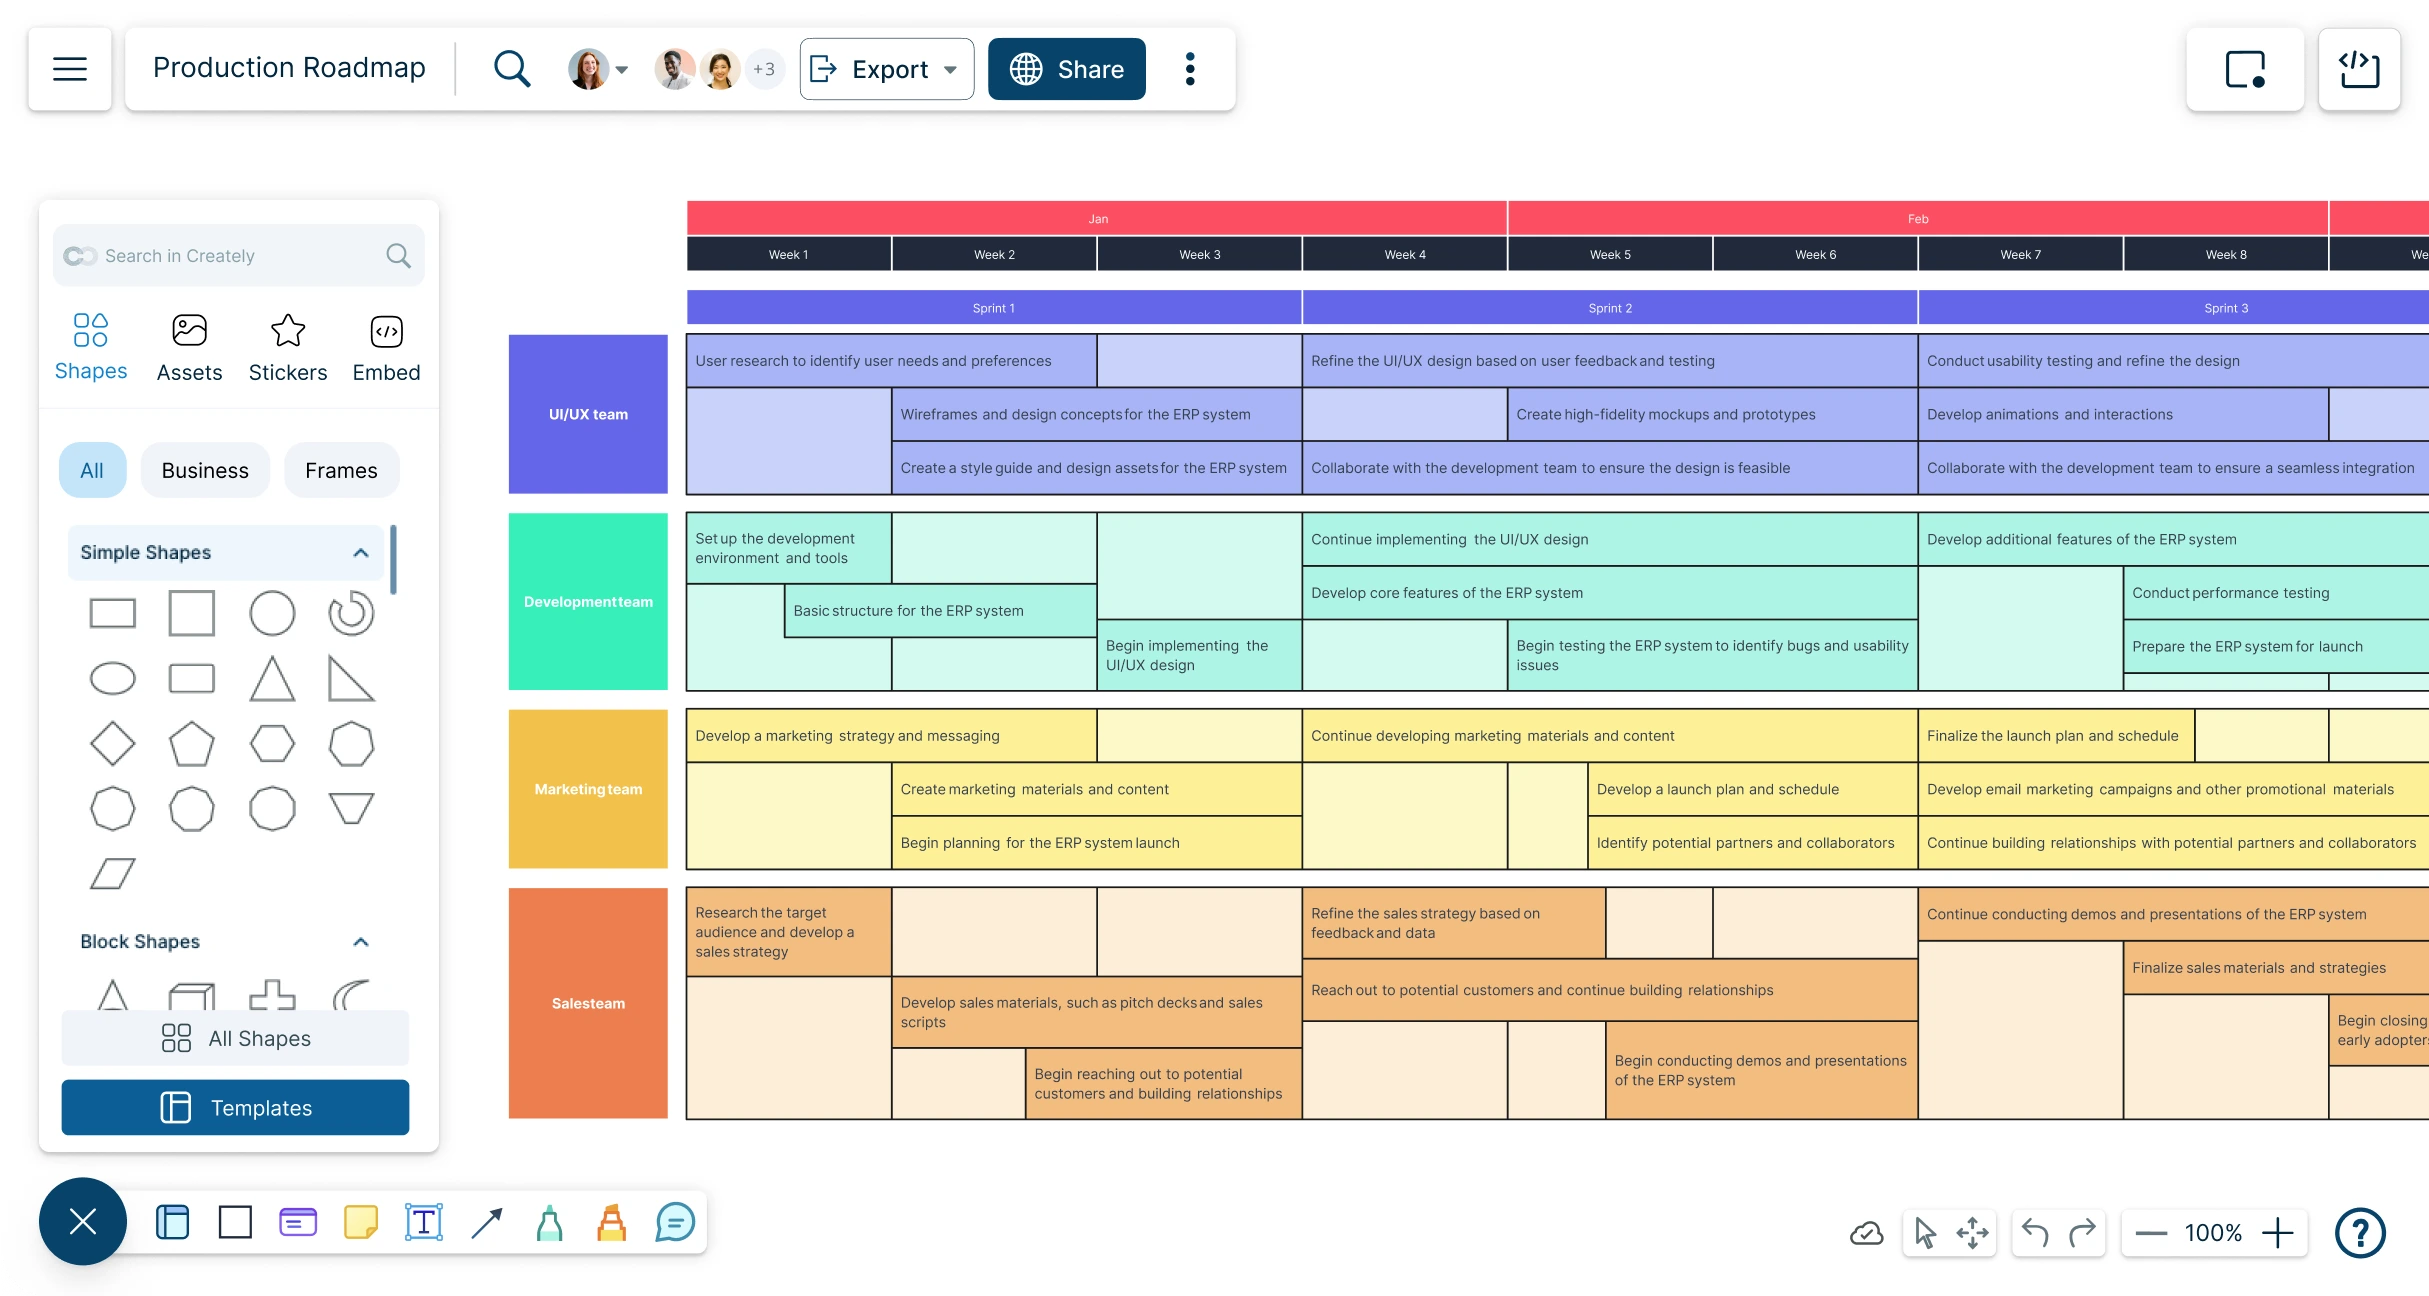
Make clear, goal-driven roadmaps that align vision, enhance communication, and improve execution for your business with Creately’s Roadmap Maker.
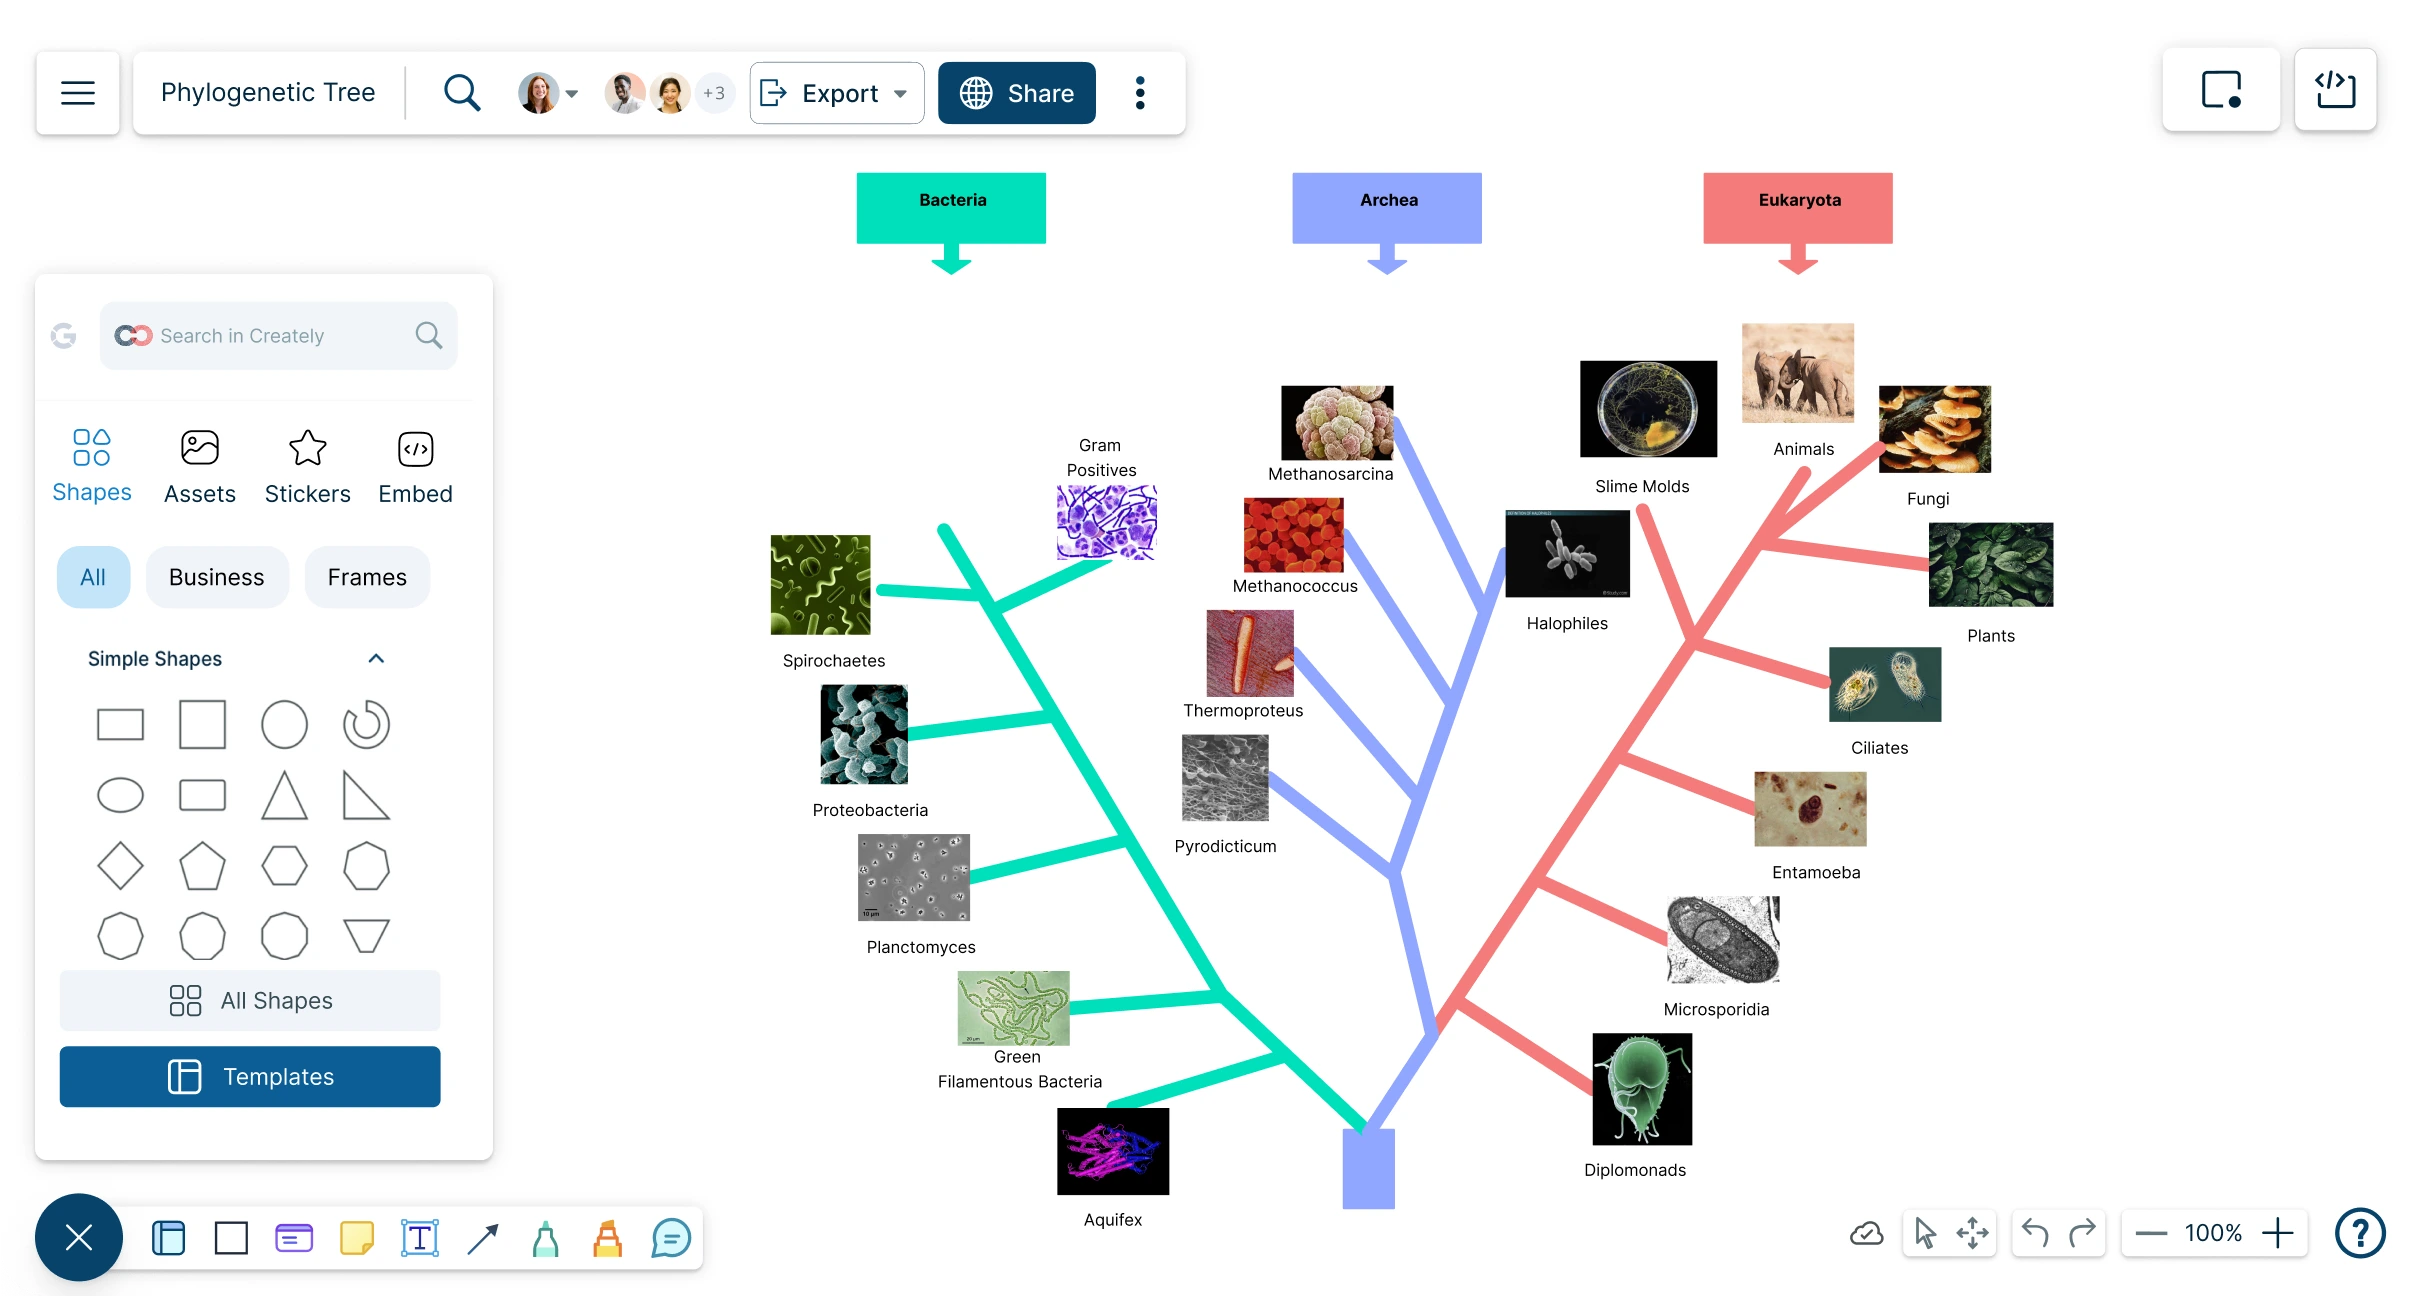
Create easy-to-follow phylogenetic trees that help students, teachers, and researchers explain evolutionary relationships clearly, compare organisms, and organize supporting context in one visual workspace.
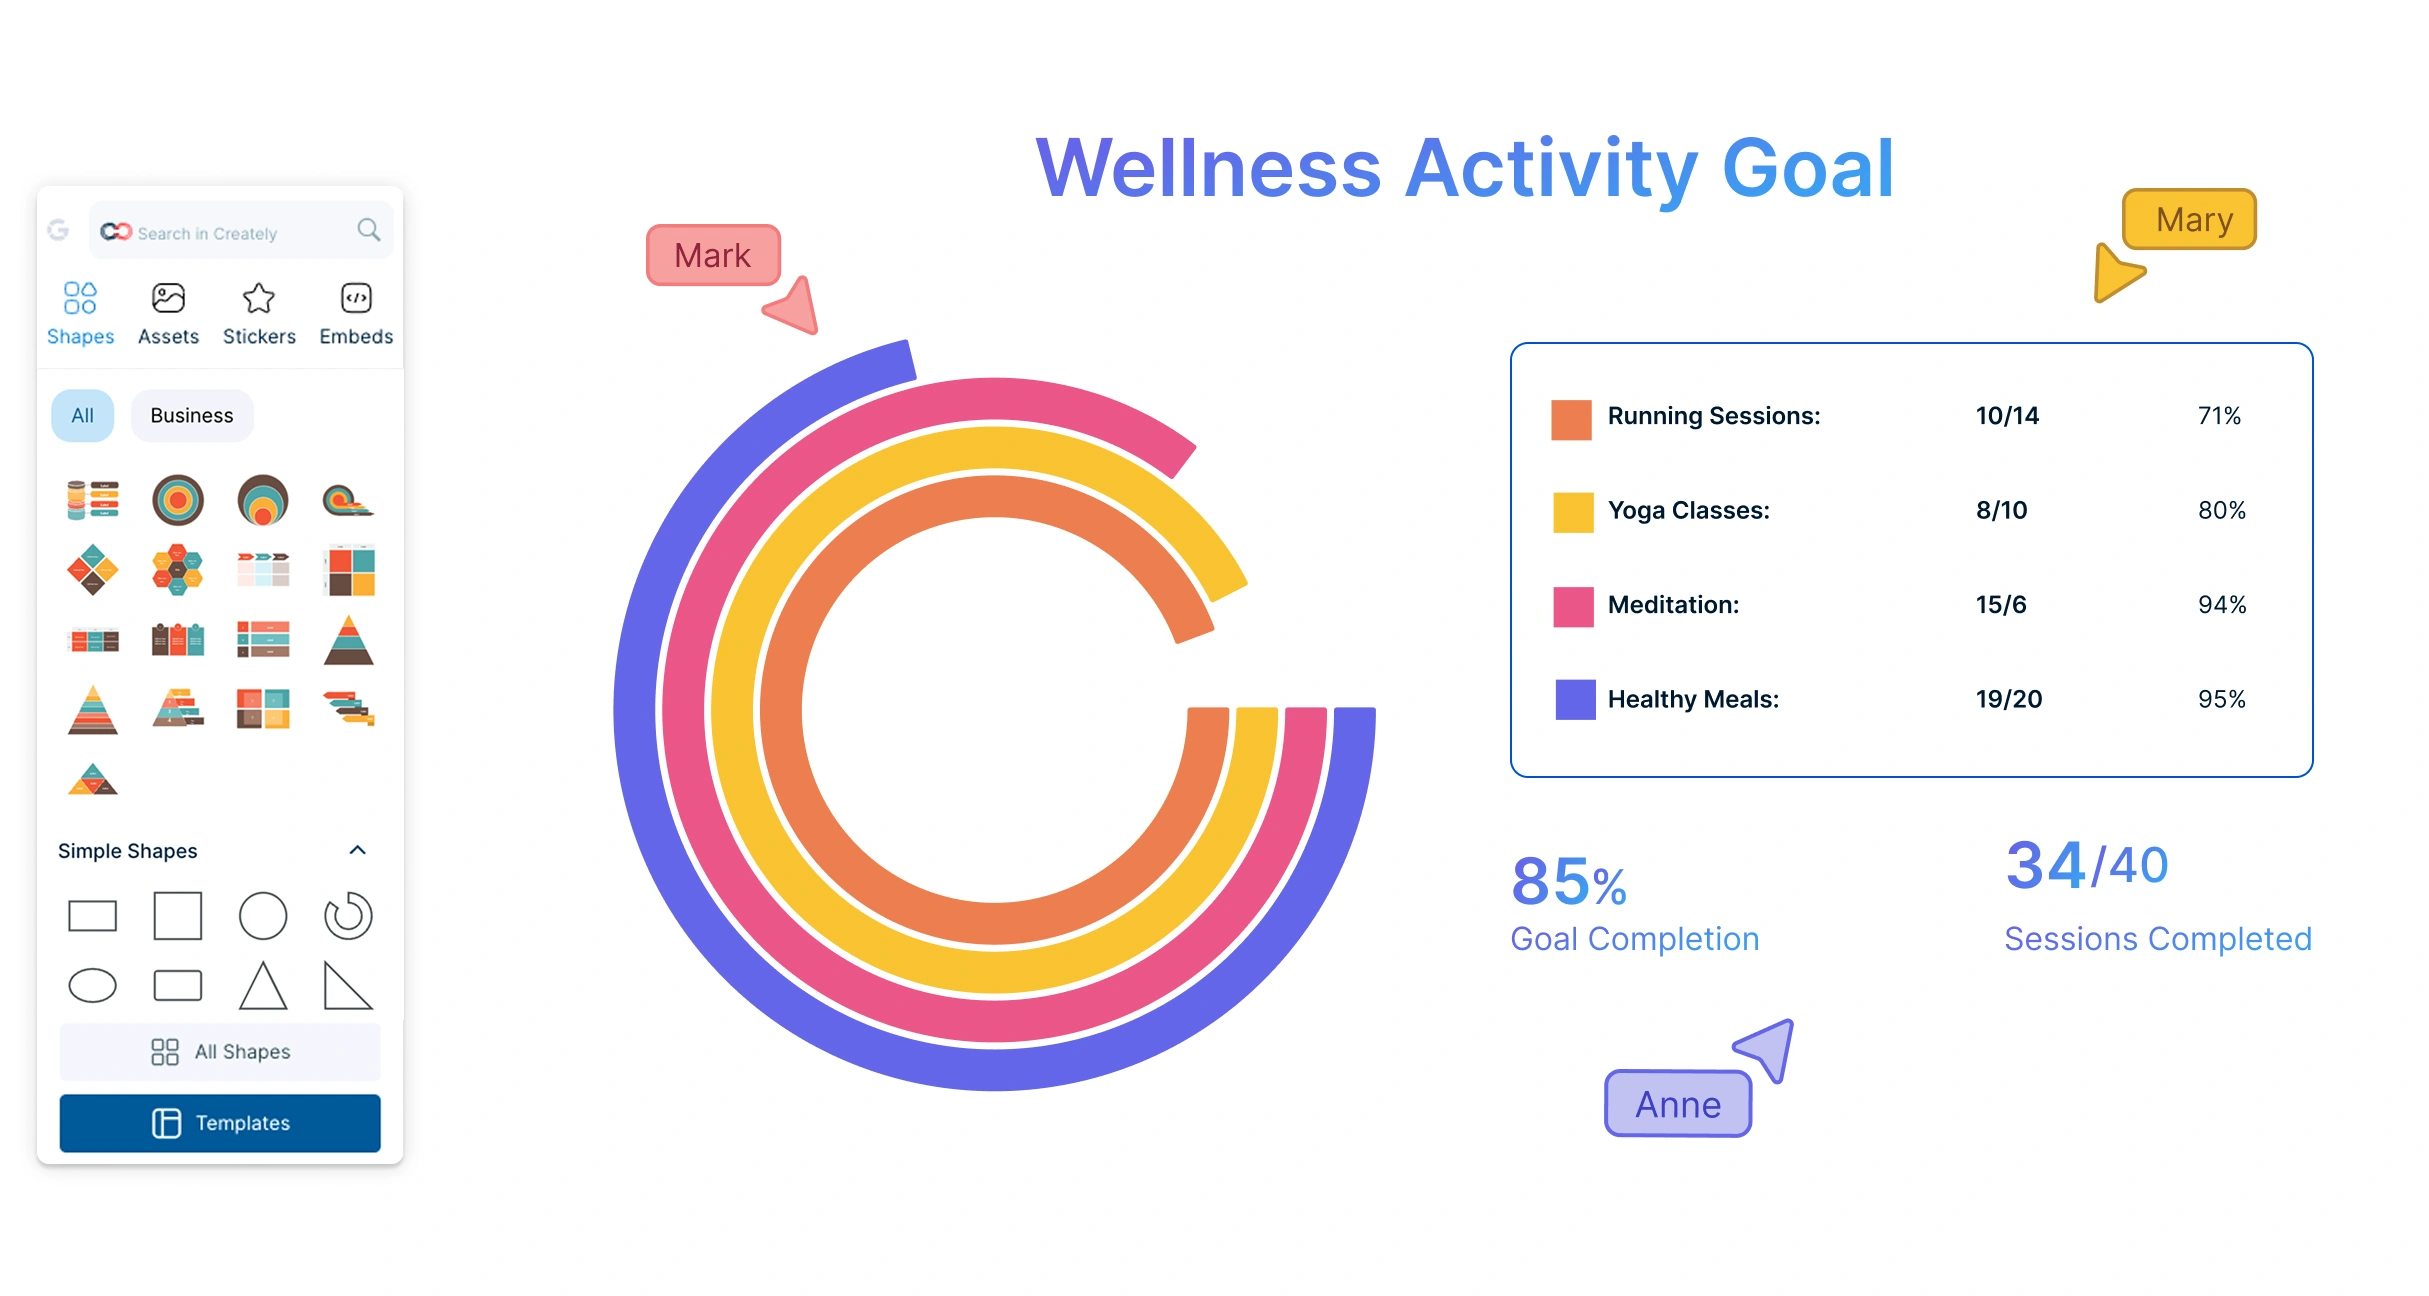
Effortlessly transform your data into visually engaging donut charts. Visualize sales data, project progress, or survey insights with clarity.
A visual tool to strengthen vocabulary, linguistic skills, and word associations
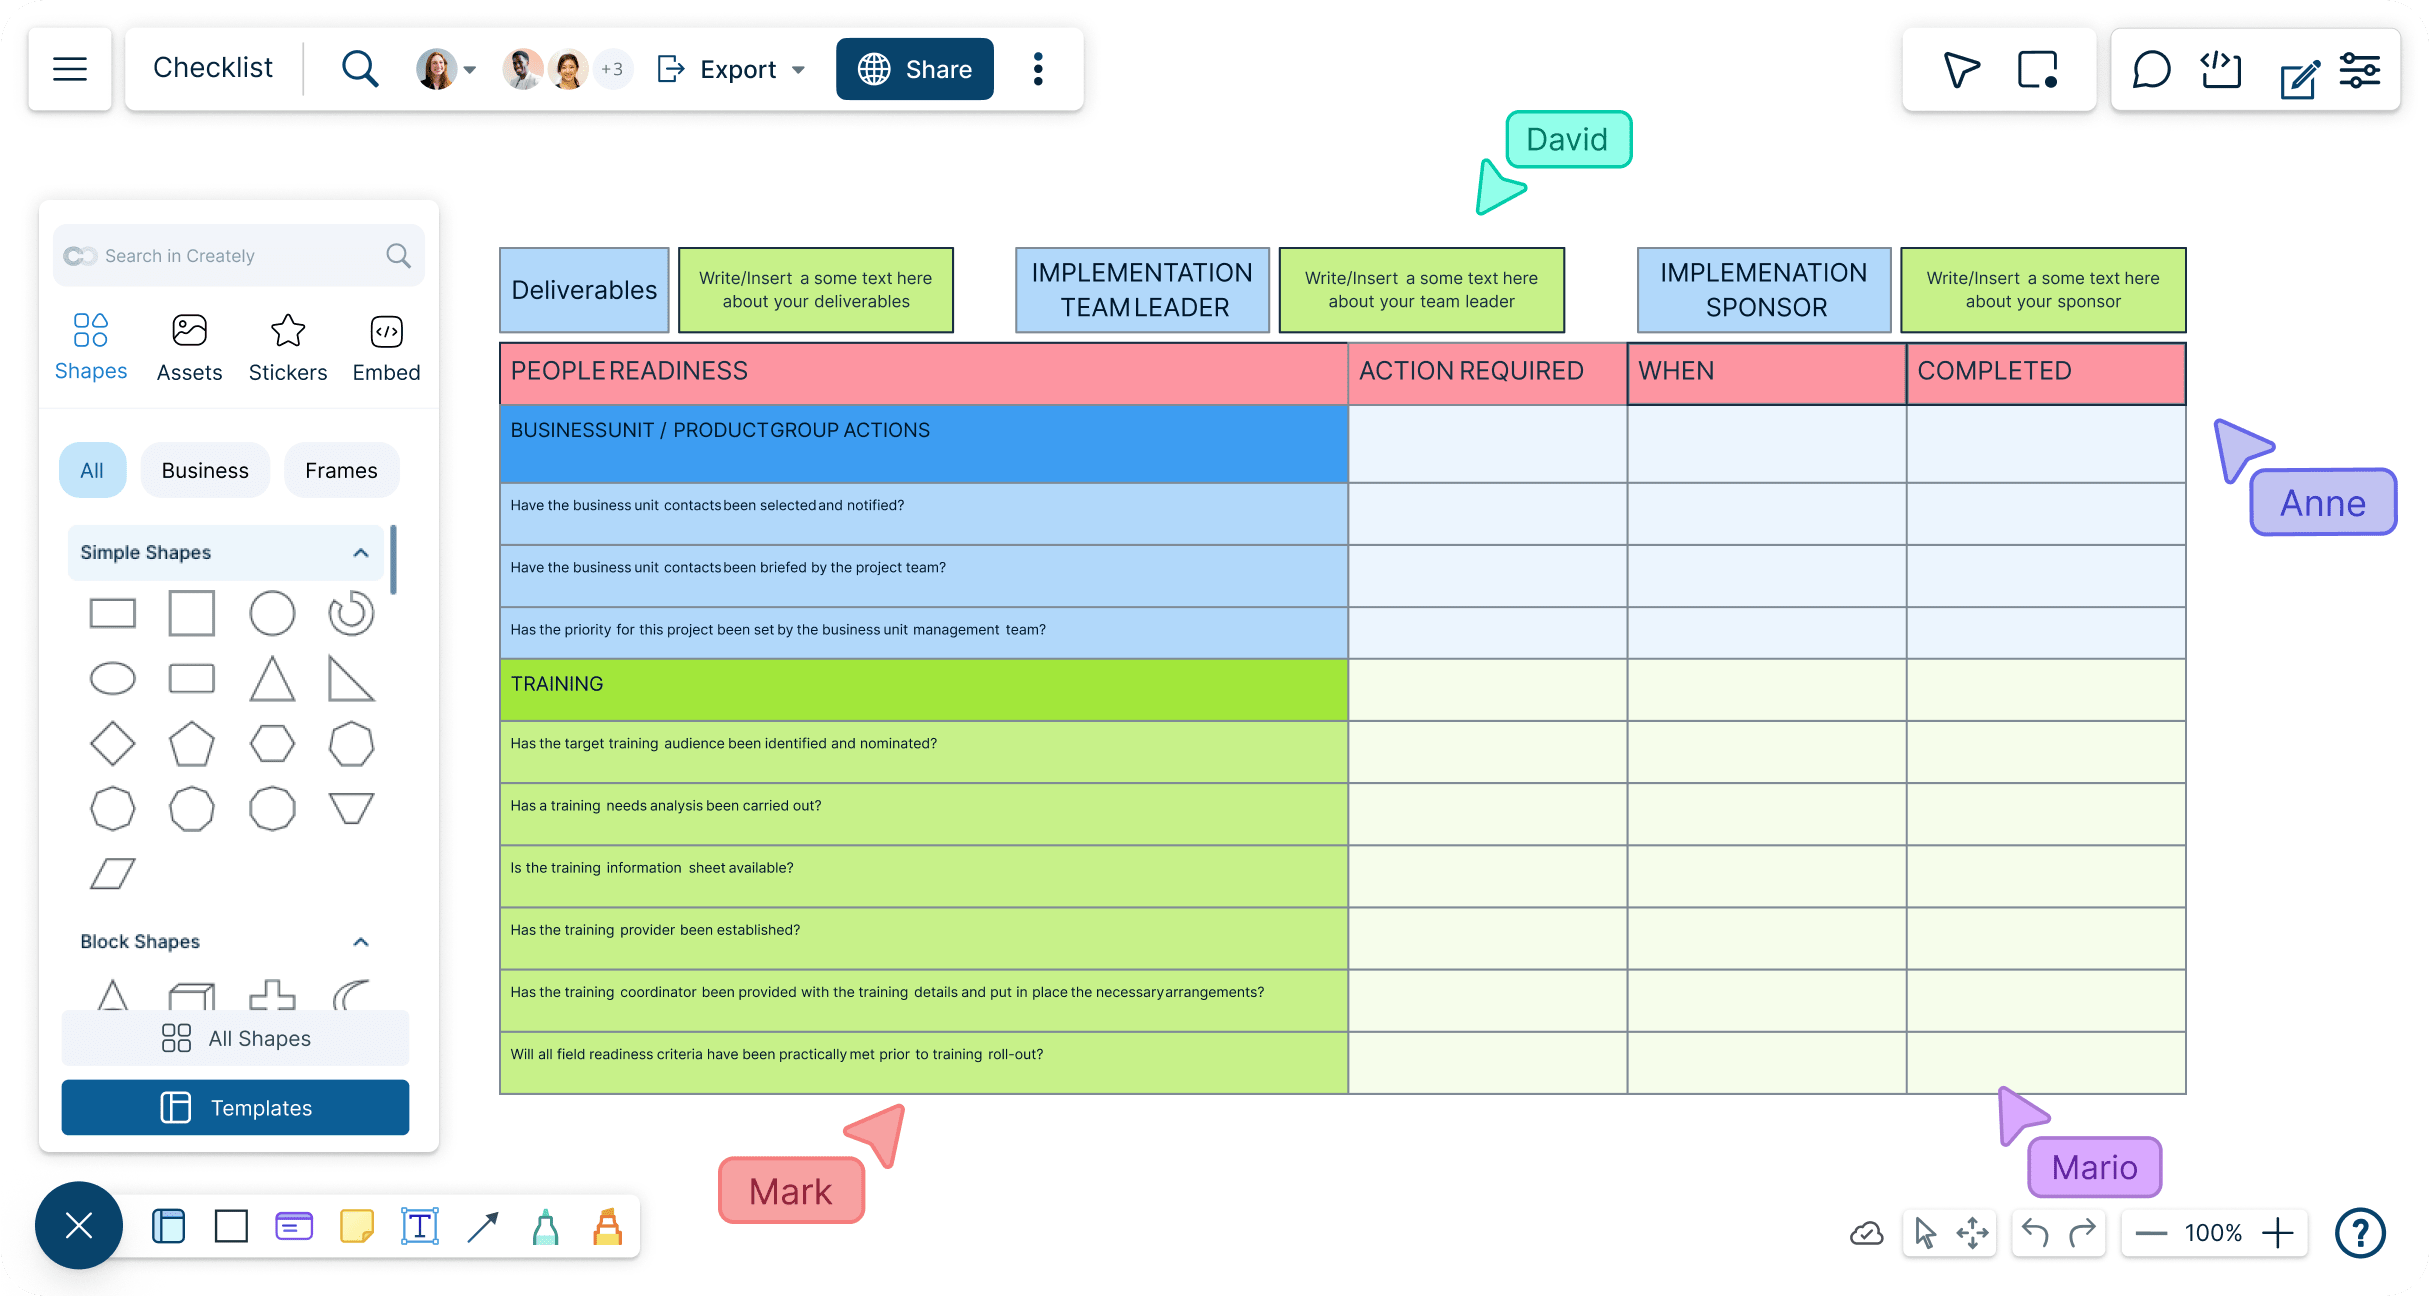
Turn scattered tasks, deadlines, owners, and updates into one organized checklist. Plan repeatable work, track progress, collaborate with others, and keep every step easy to review and complete.
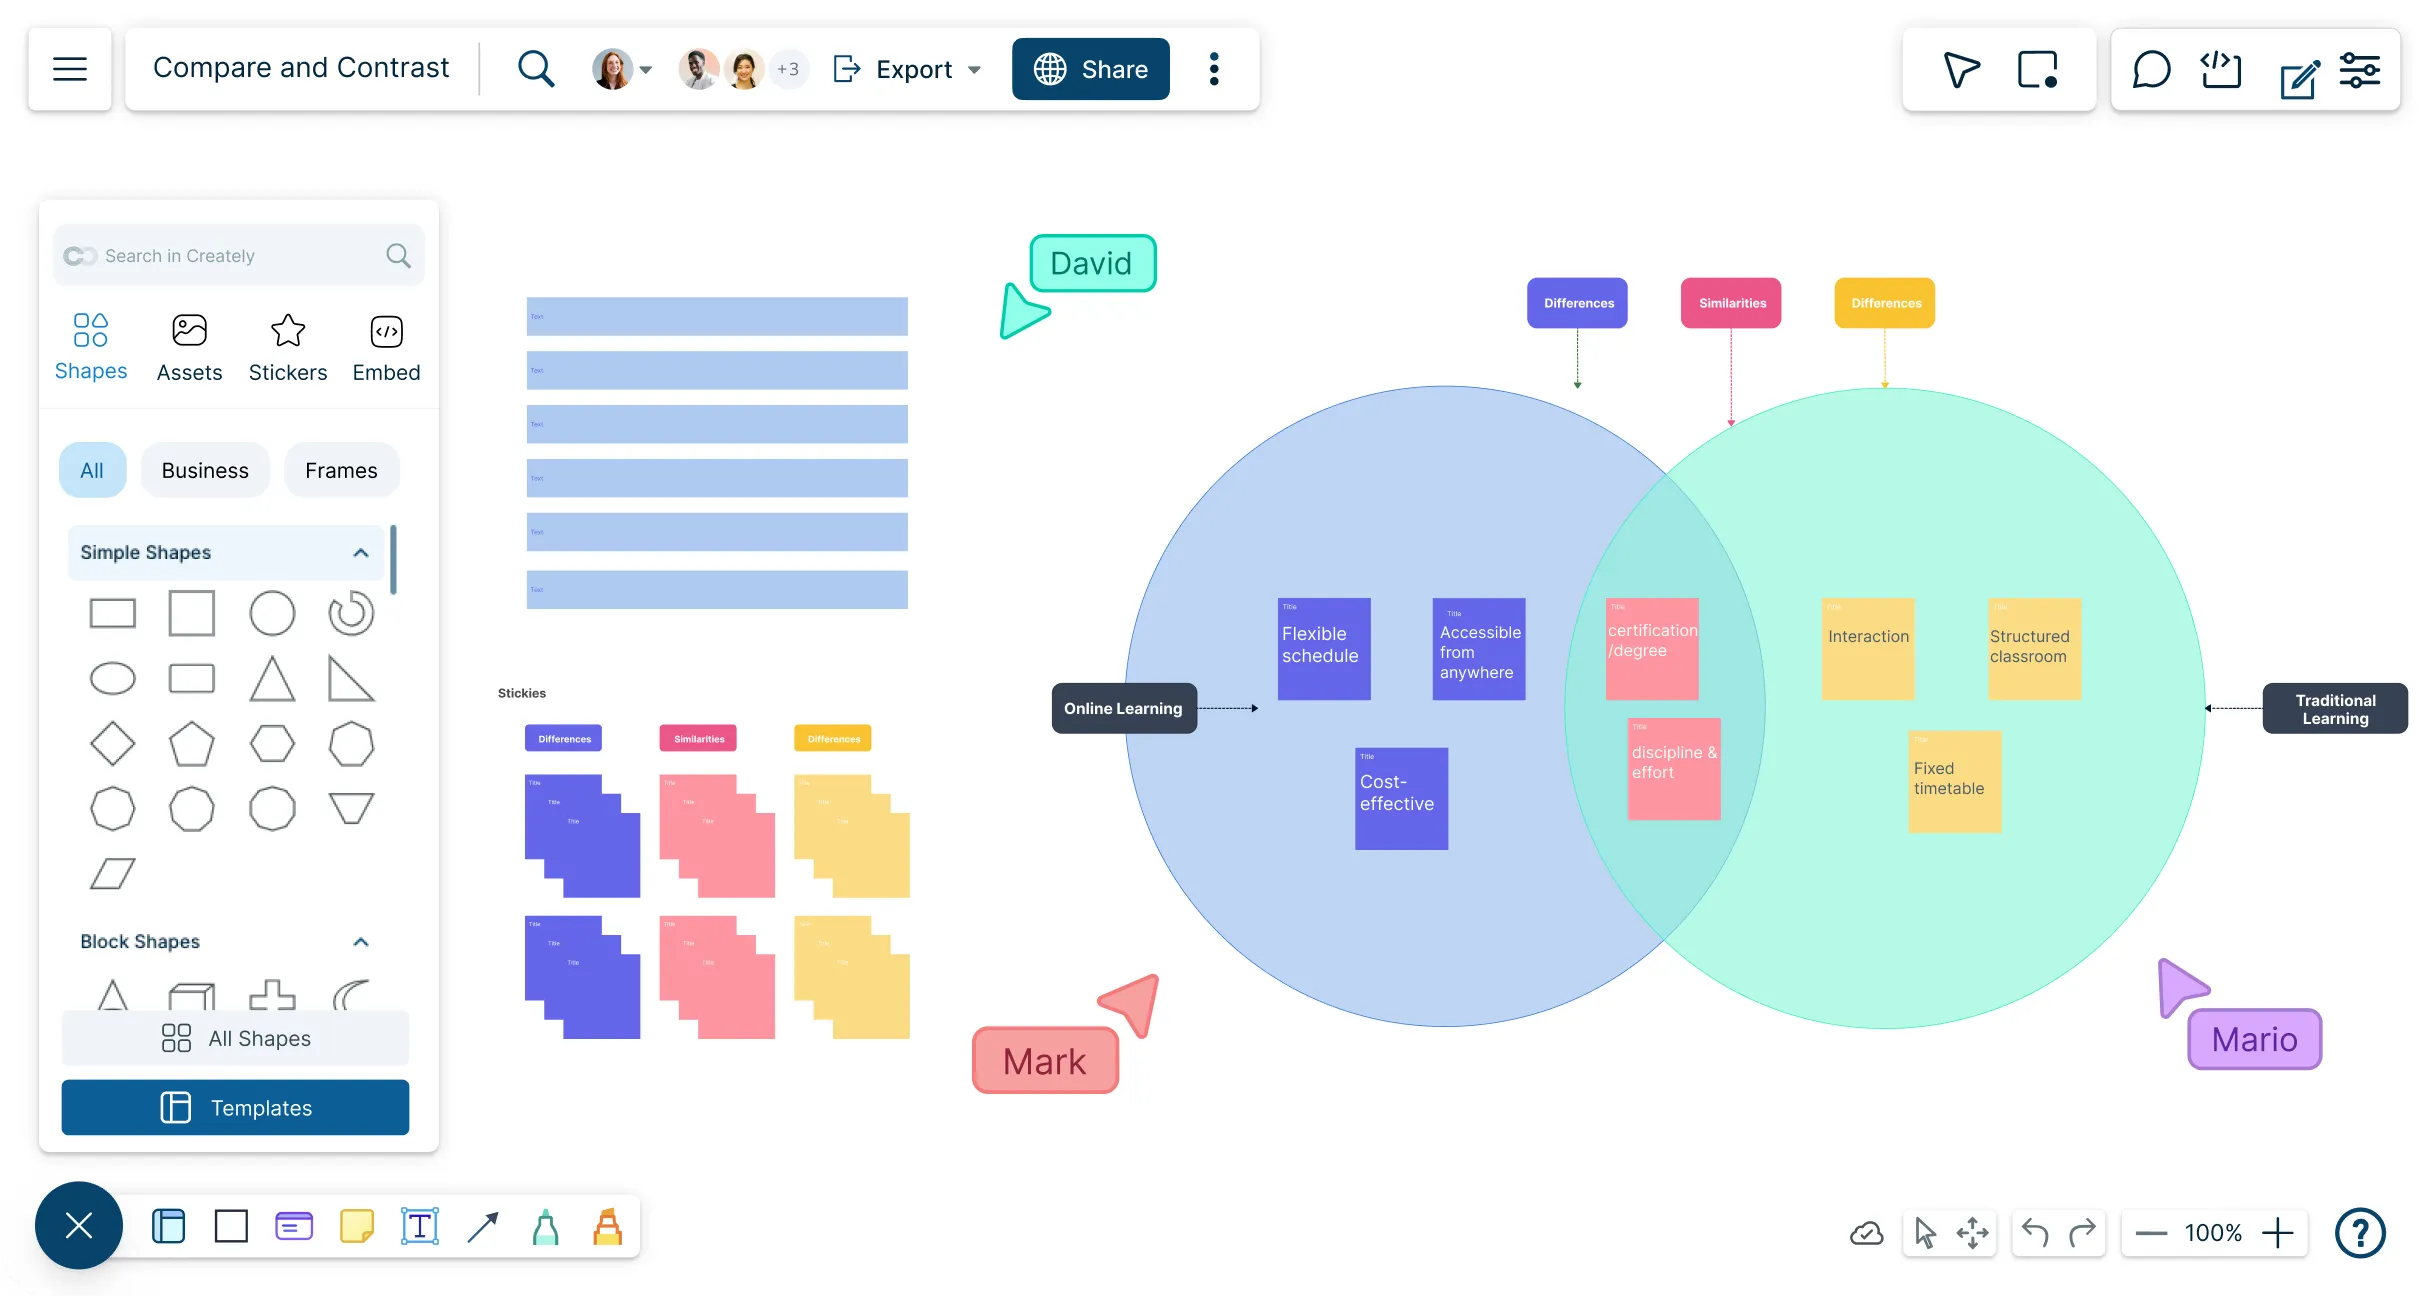
Visualize similarities and differences in one workspace with Creately’s Compare and Contrast Chart Maker to map ideas, brainstorm, and present clearly.
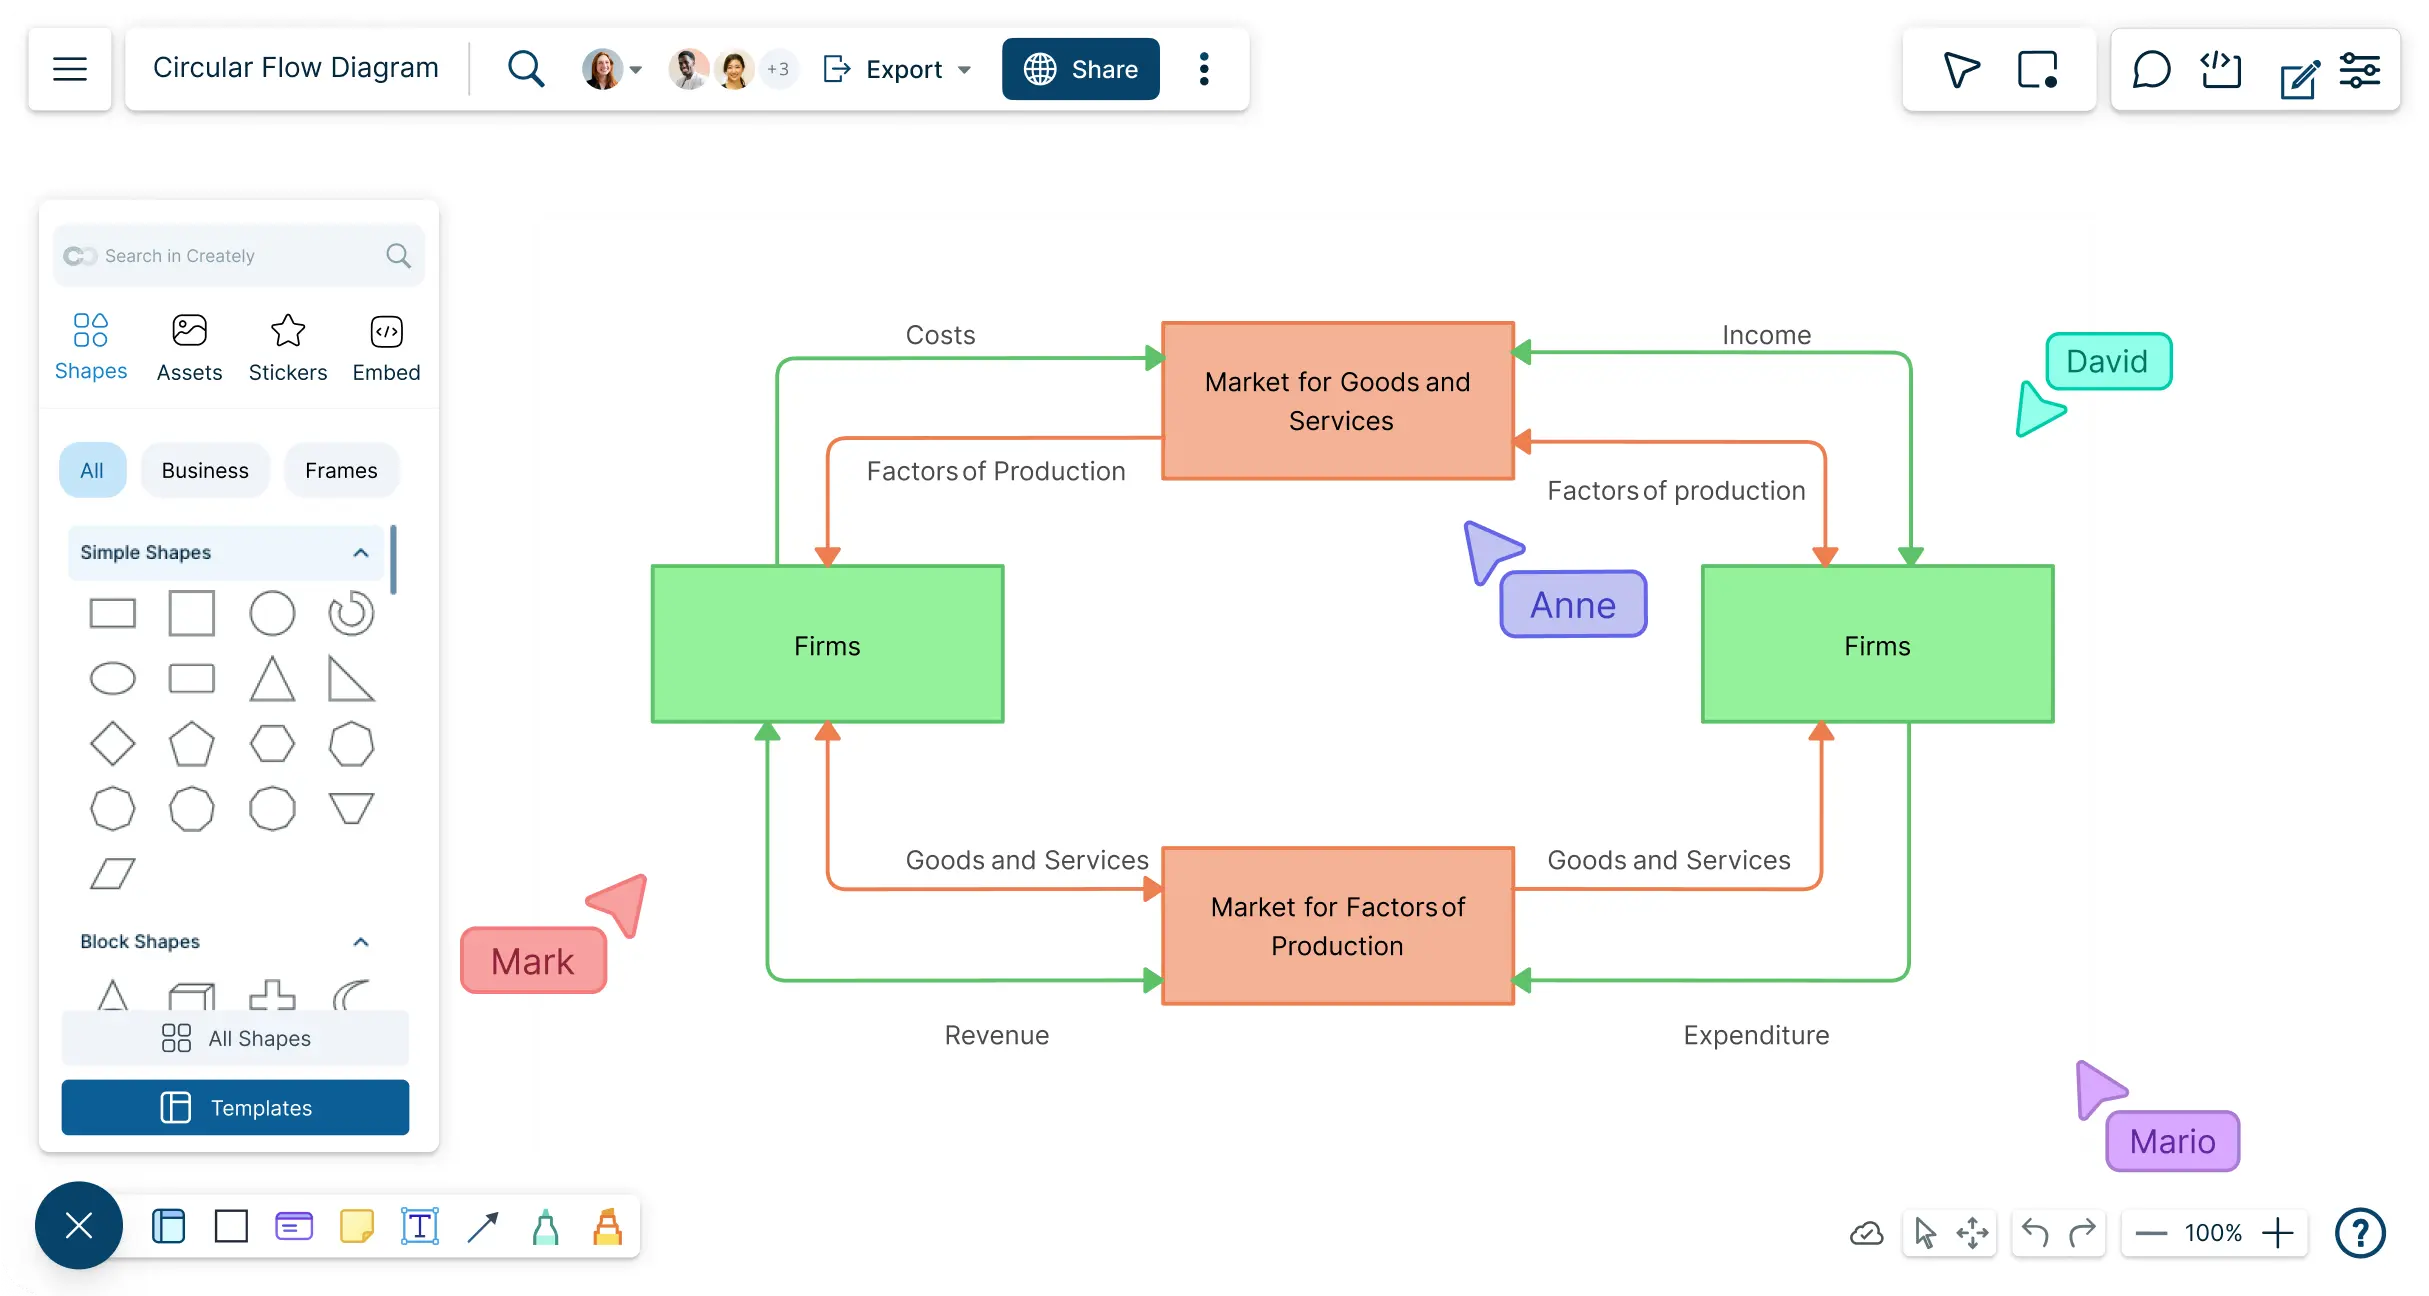
Bring in data from any source to create a circular flow diagram to trace interconnections between various elements of an economy.
Effectively visualize and represent any type of data using Pictogram maker app. Discover useful insights for better decision making using colourful pictogram.
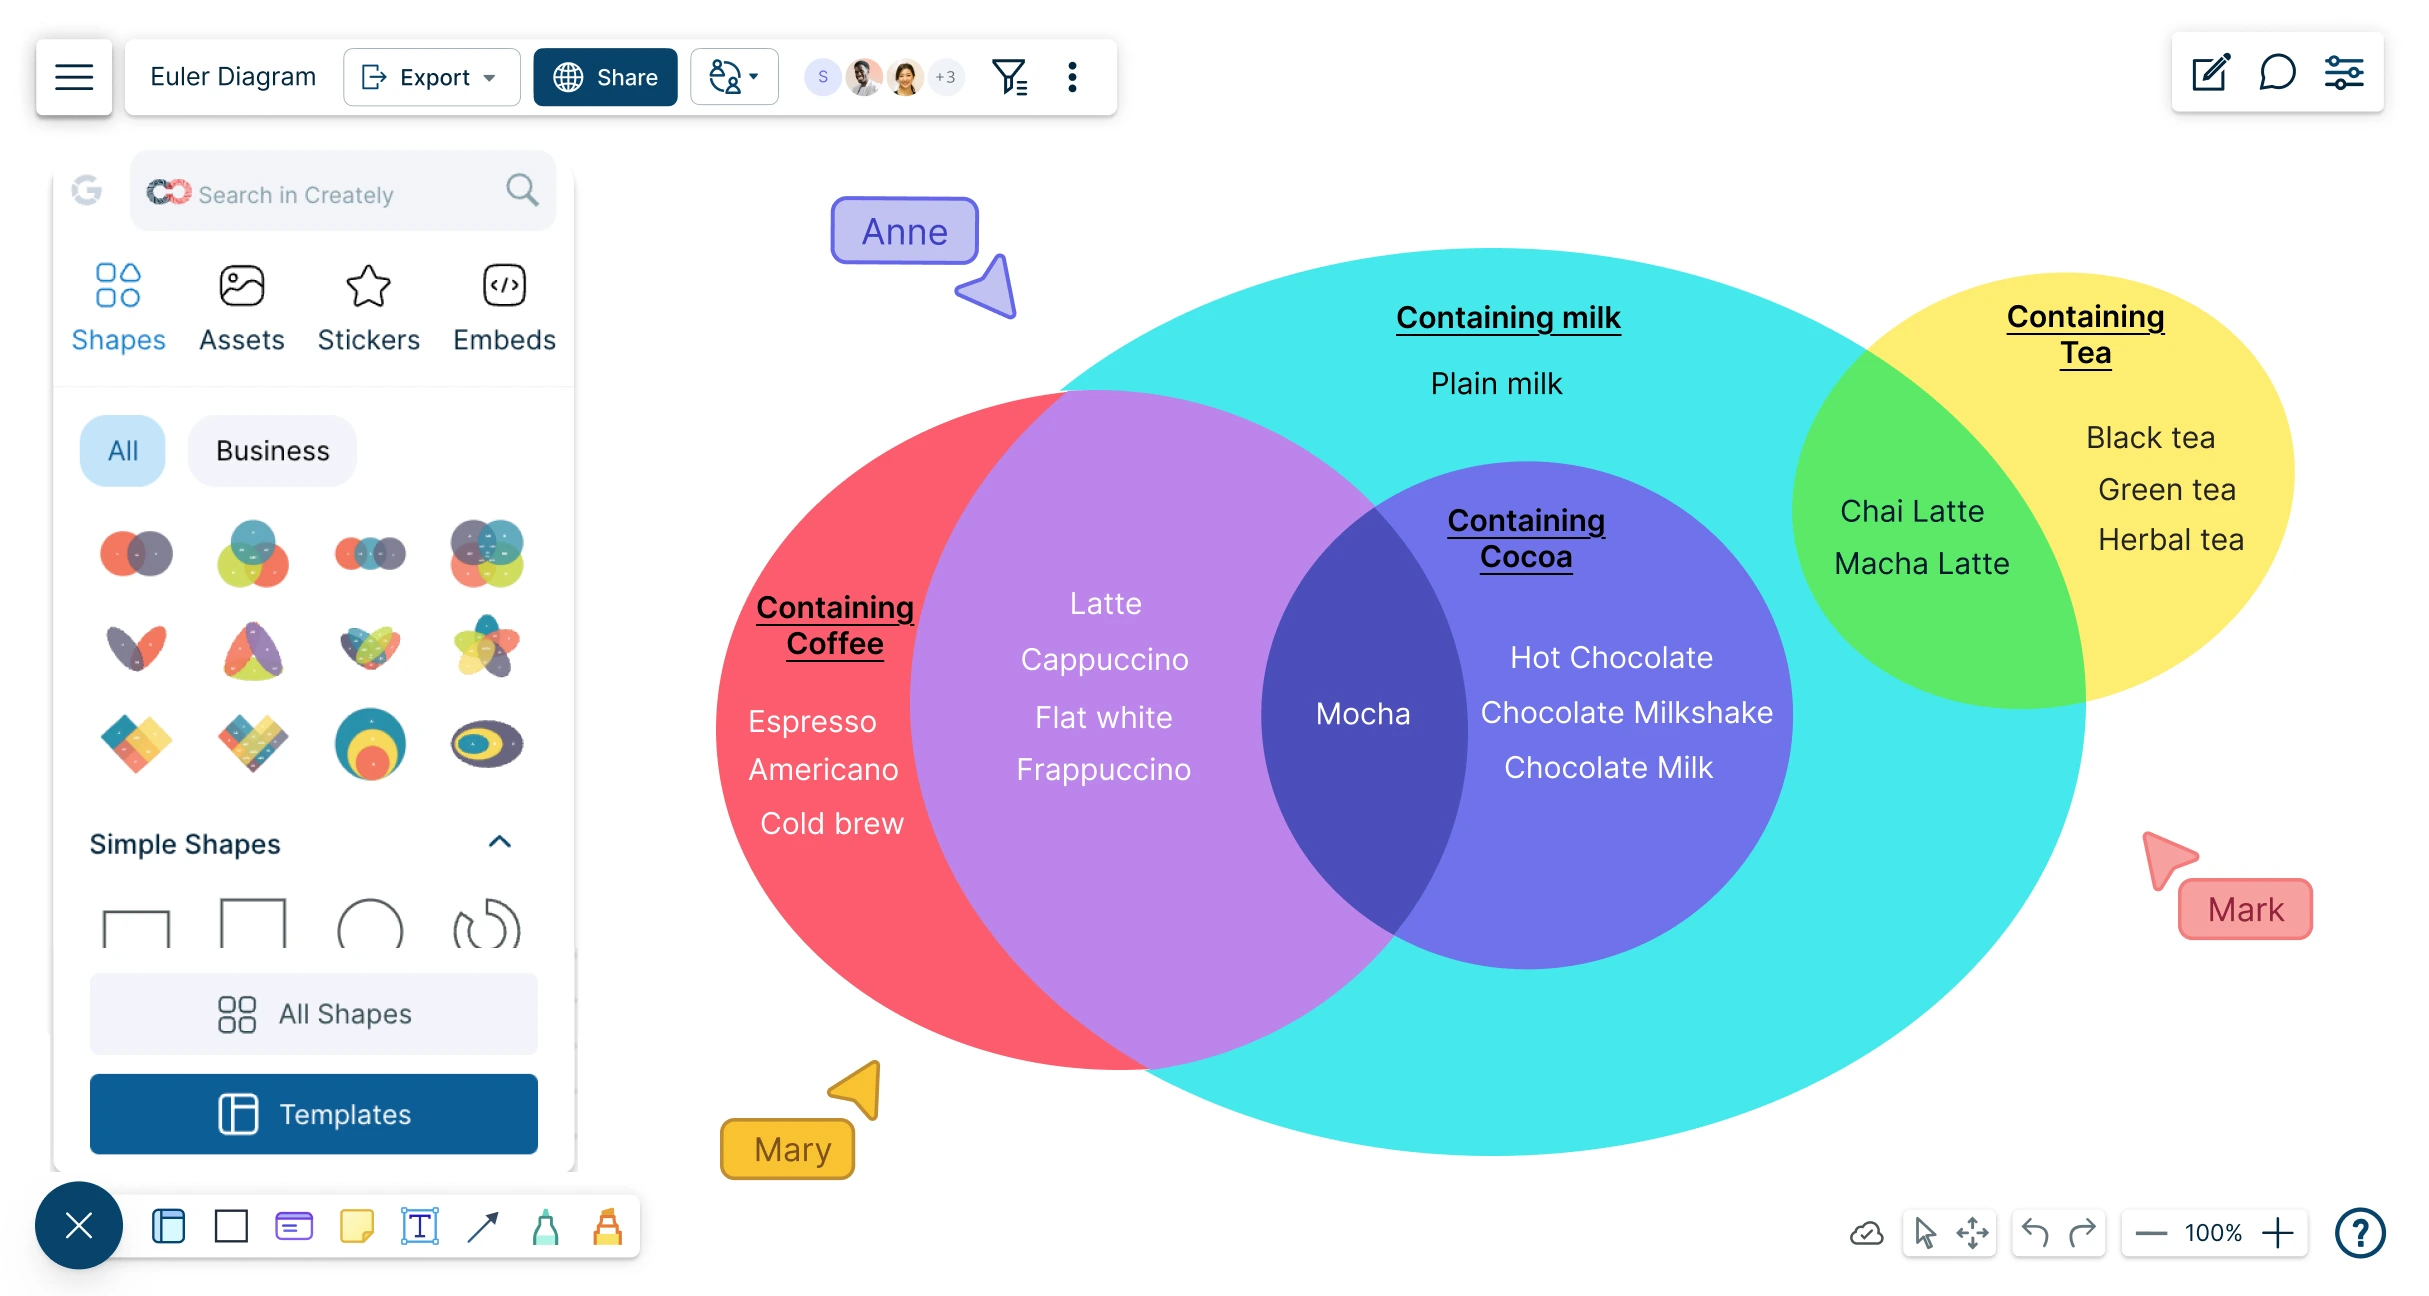
Easily design Euler diagrams to identify relationships between groups and sets. Our powerful online Euler diagram generator lets you visualize overlaps, concepts, and connections with accuracy and ease.
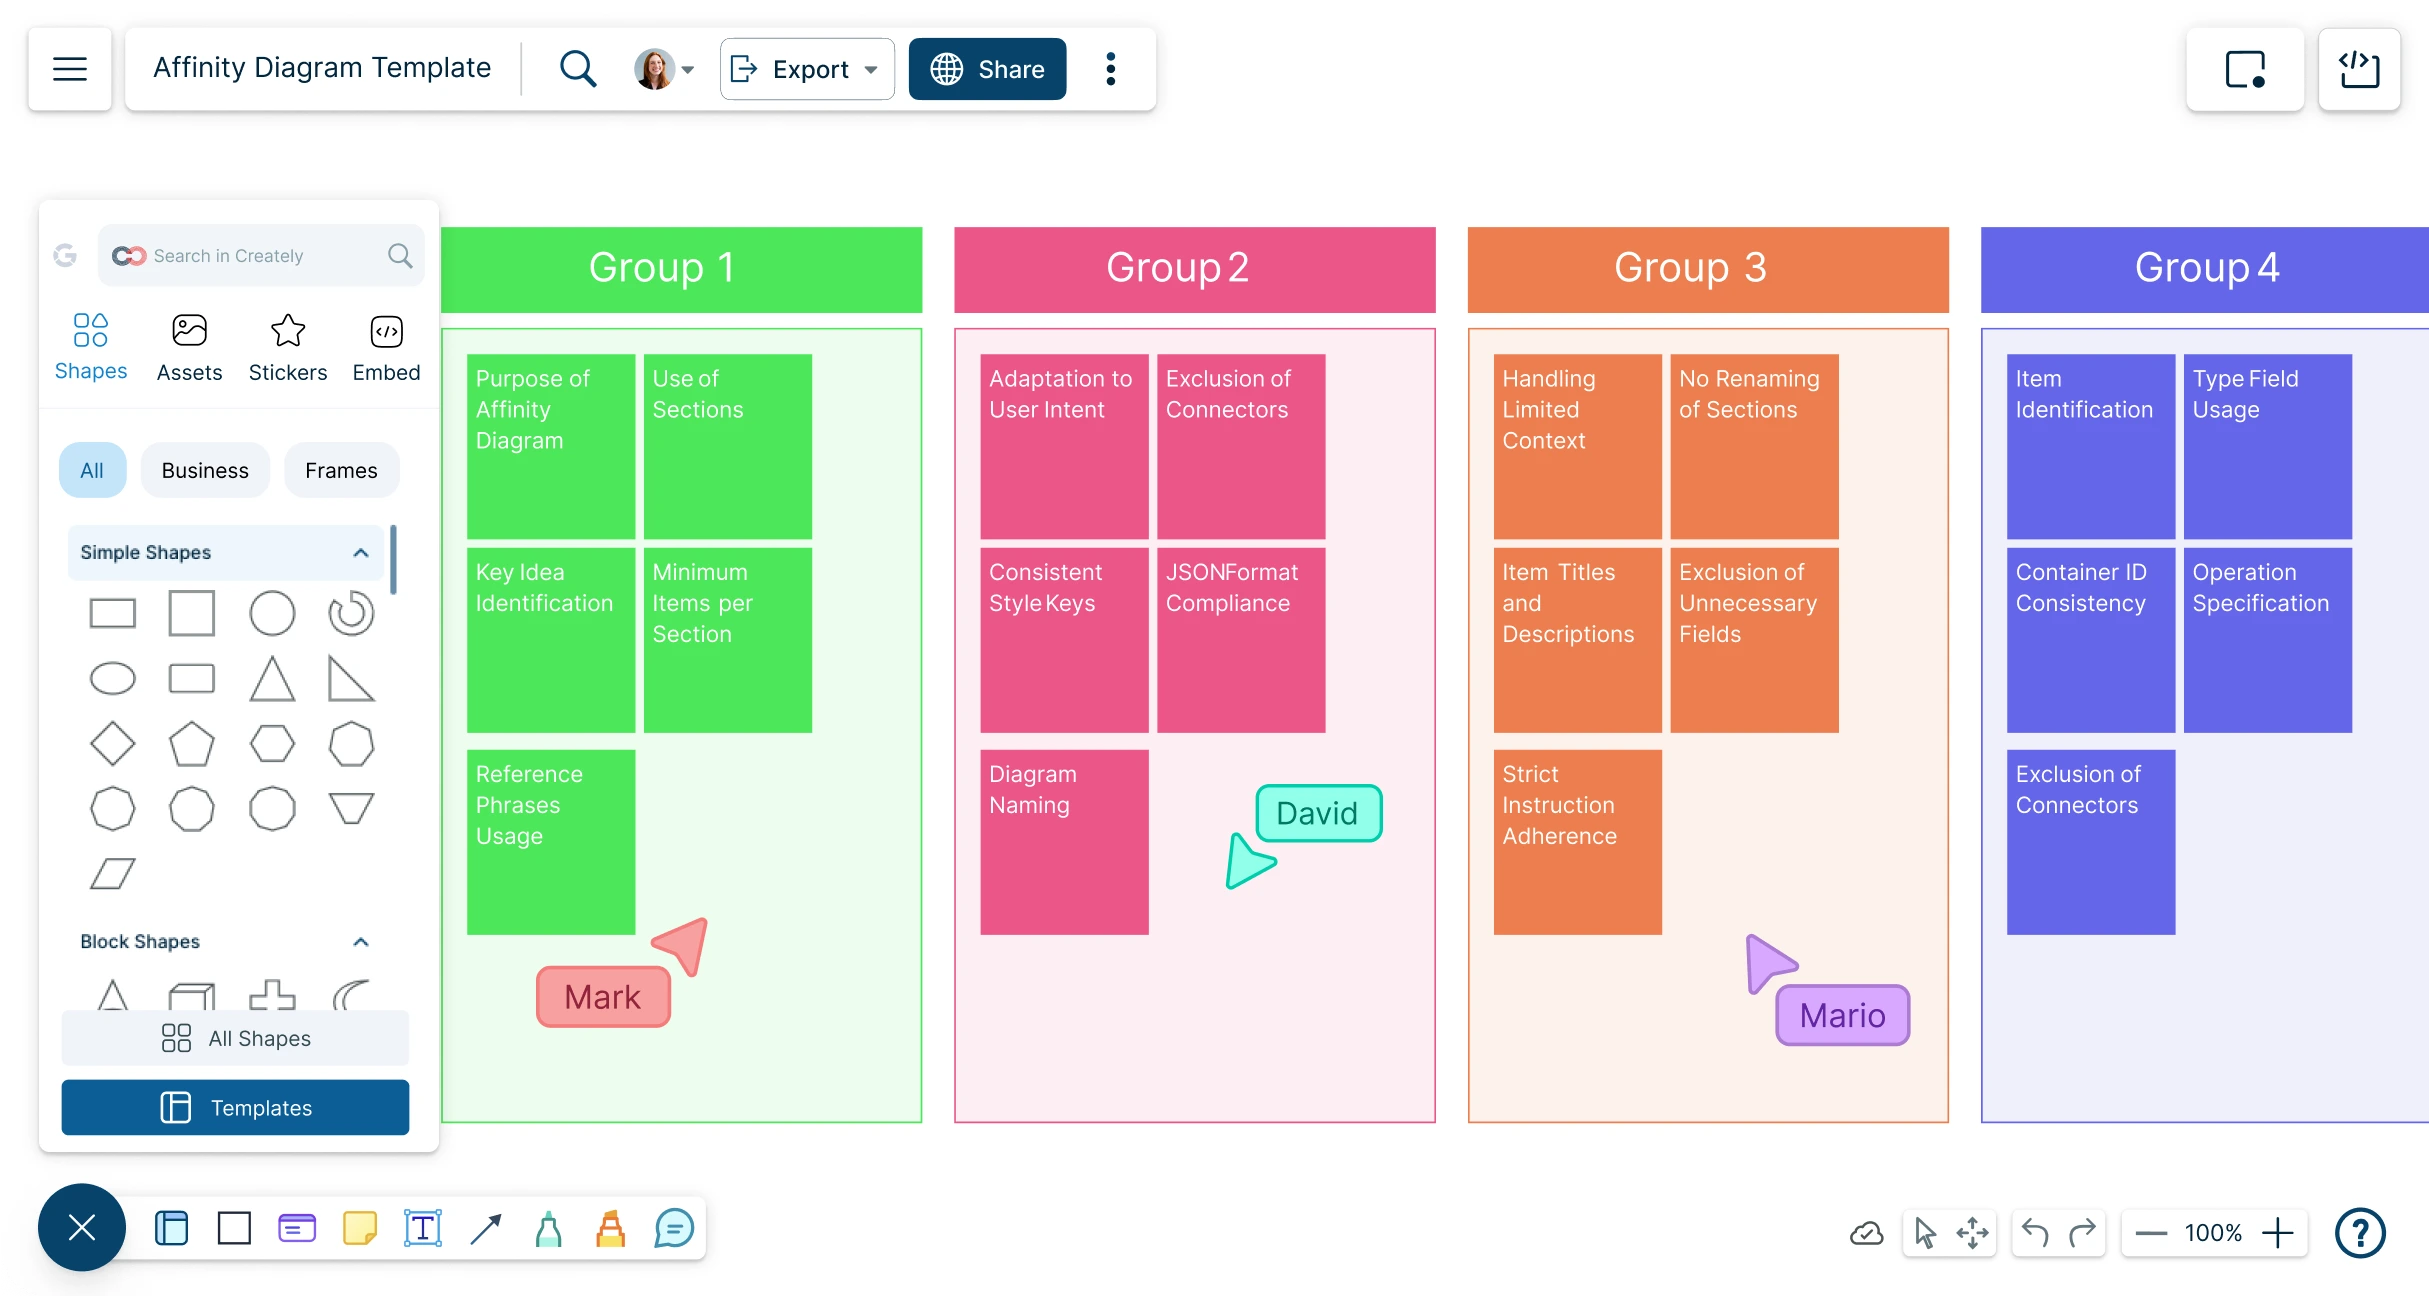
Intuitive affinity diagram tool to visually organize & group large volumes of data, streamline idea clustering, and analysis to support powerful decision-making.
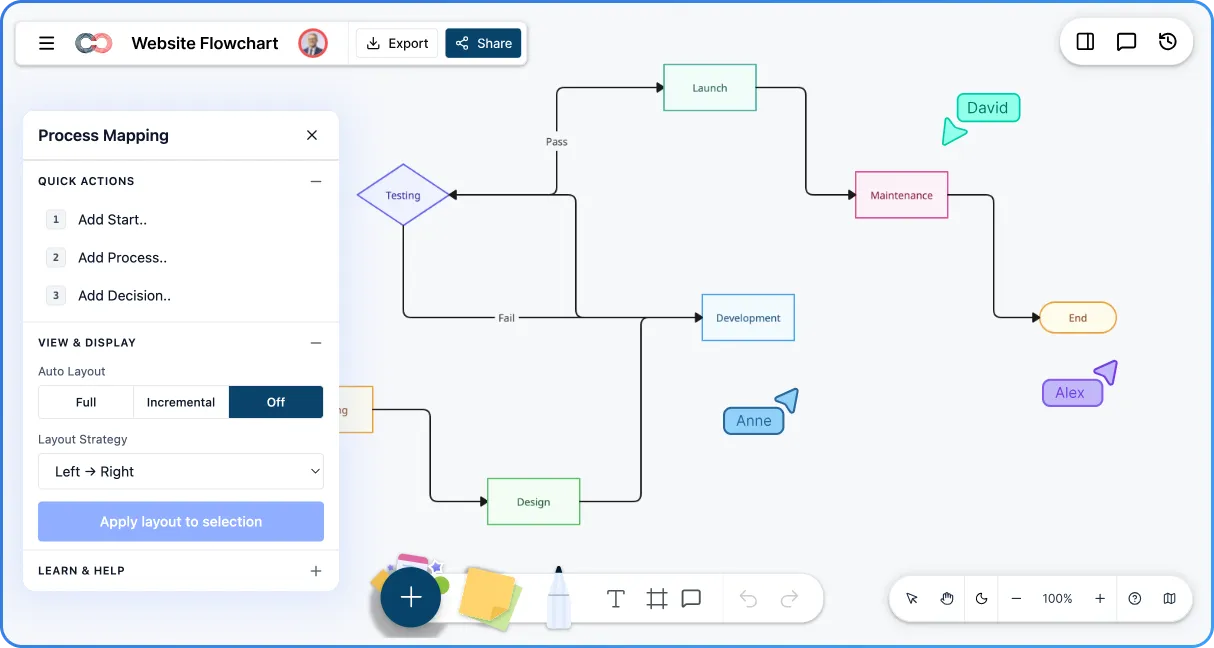
Plan and visualize every page and interaction with Creately’s Website Flowchart Creator. Streamline your website design, keep your team aligned, and bring your web projects to life effortlessly.
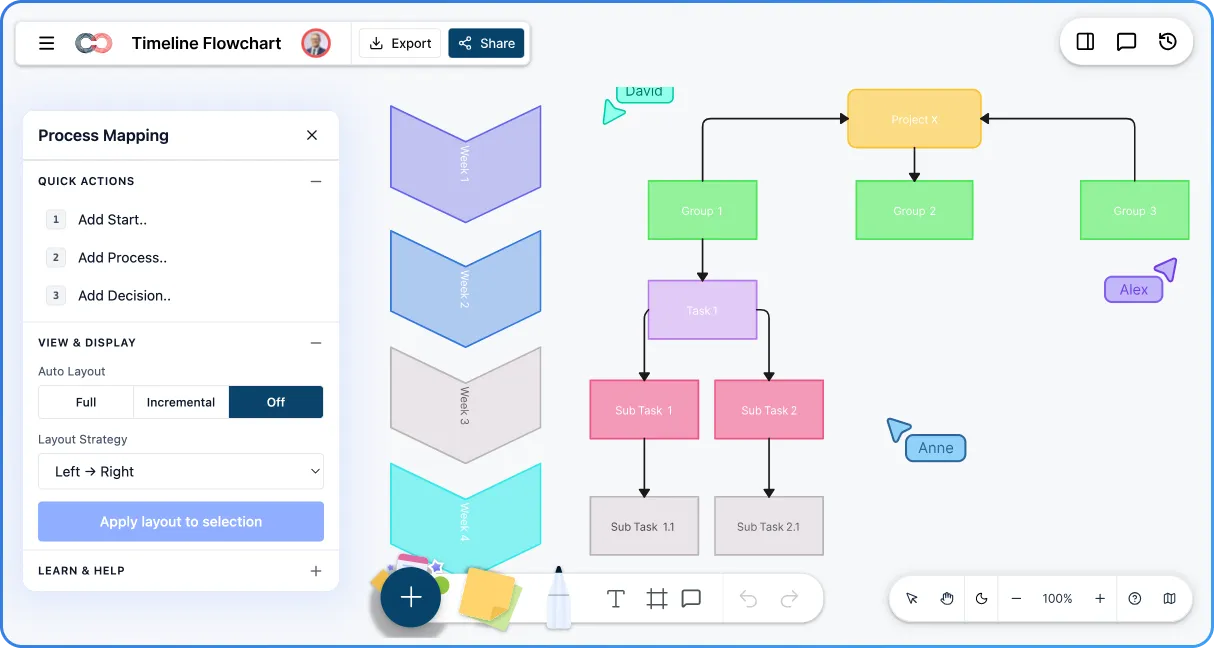
Create clear, visual timelines with Creately’s Timeline Flowchart Creator. Track milestones, stay aligned, and plan projects effortlessly with professional, easy-to-follow visuals.
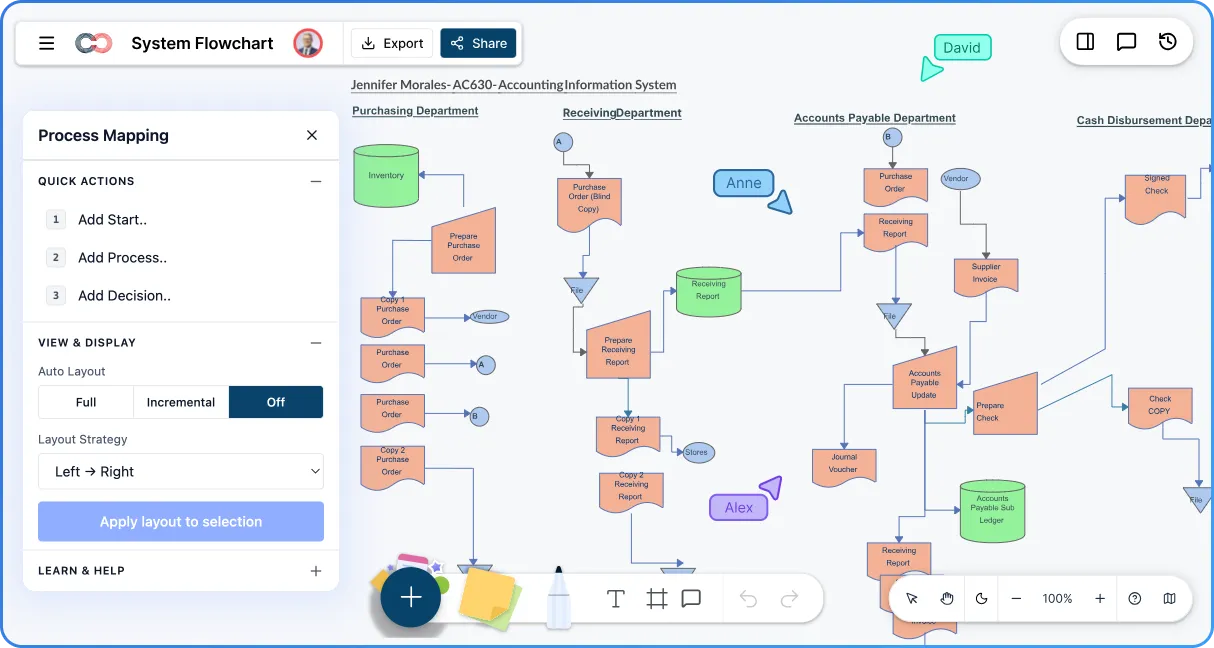
Visualize and organize every system process effortlessly with Creately’s system flowchart creator. Collaborate online, map workflows, and ensure accuracy at every step—making your systems more transparent, efficient, and easy to manage.
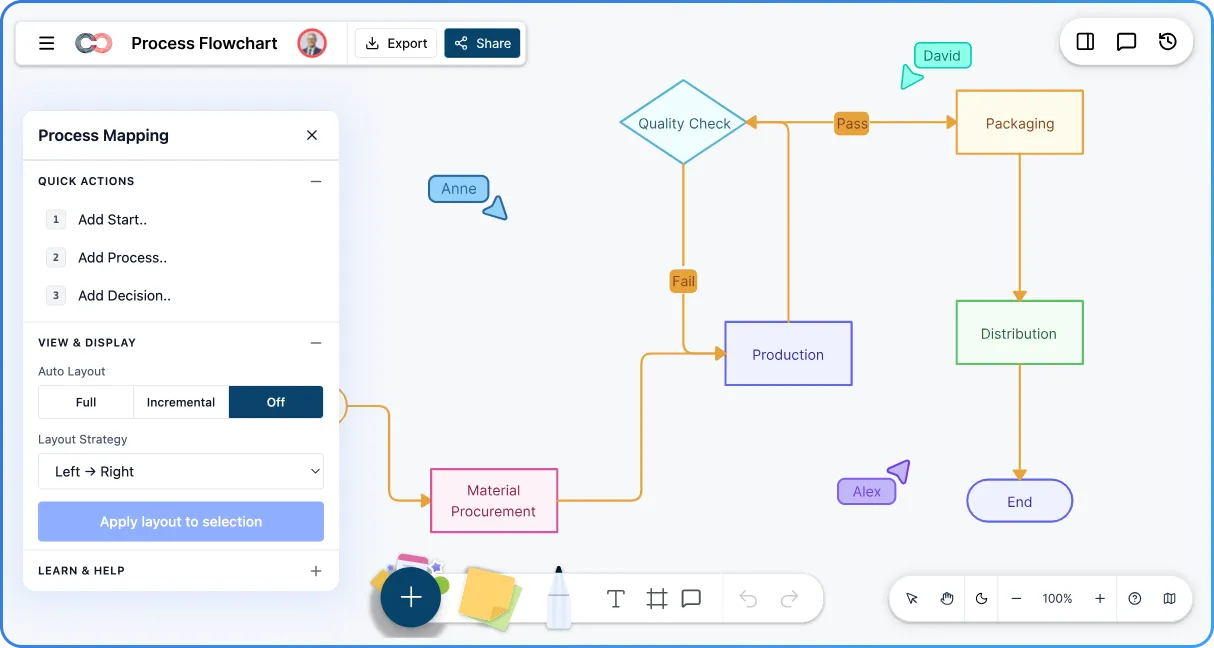
Plan, organize, and execute every task with ease using Creately’s process flowchart tool. Collaborate online in real time, simplify complex workflows, and ensure accuracy and efficiency across your team’s processes.
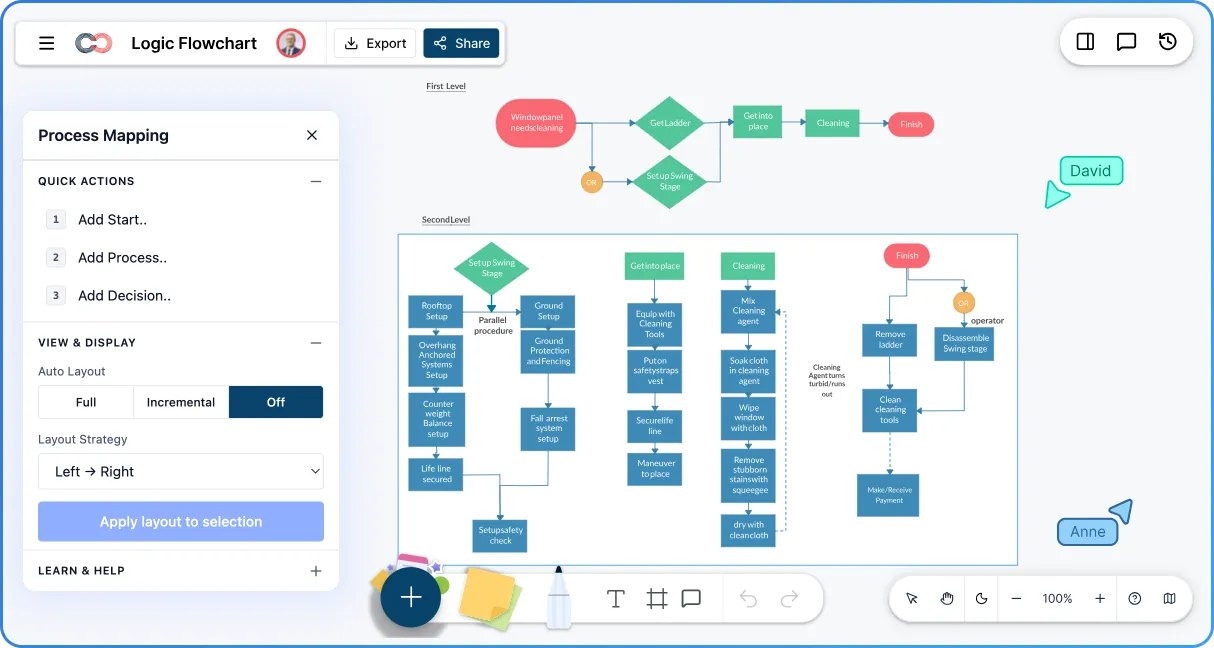
Streamline your decision-making and improve efficiency with Creately’s Logic Flowchart software. Plan, organize, and refine processes with ease, collaborate in real time, and ensure accuracy before execution—making your workflow smarter, faster, and more reliable.
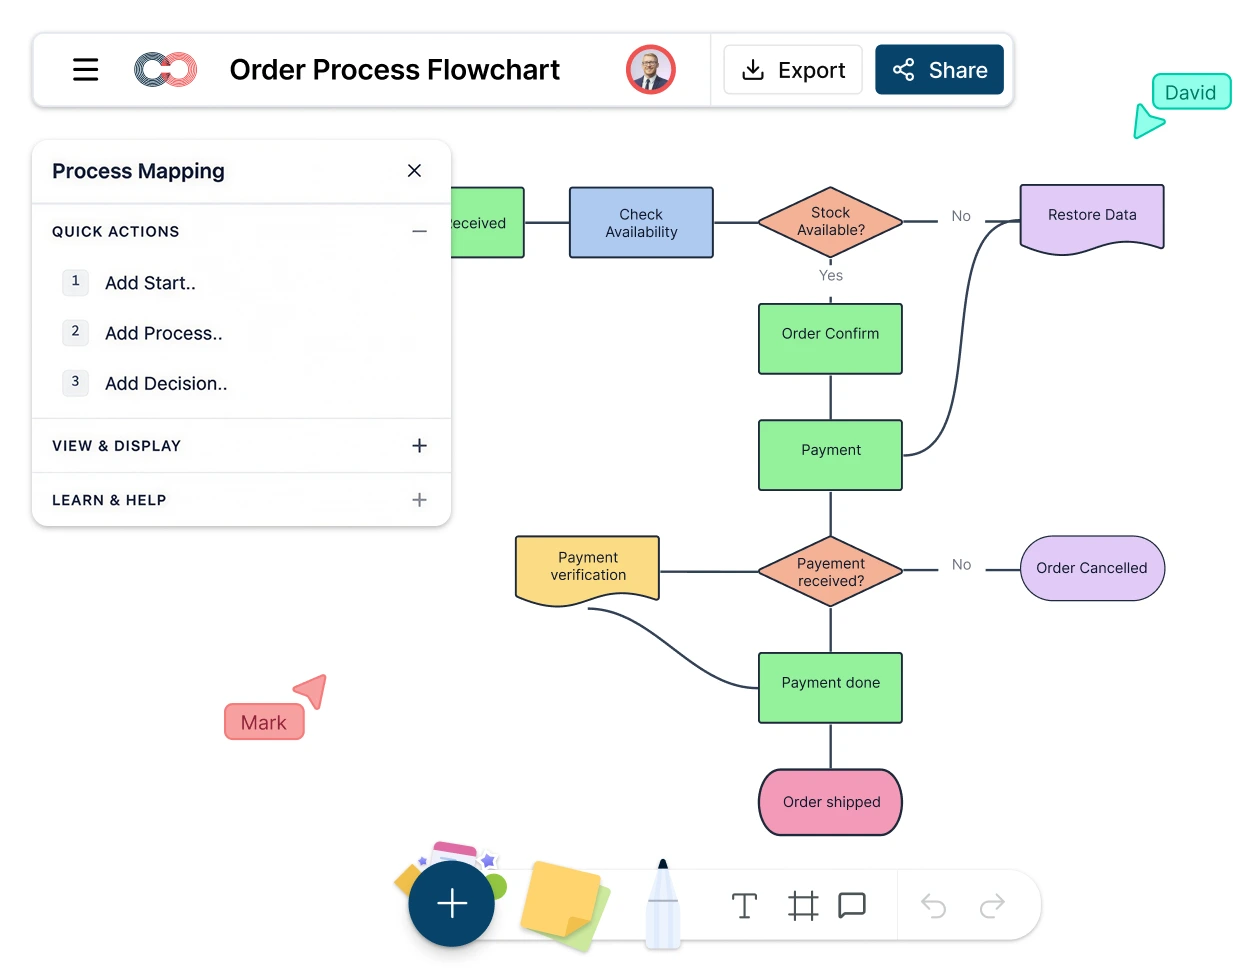
Create process flows, SOPs, decision trees, user flows, and swimlane diagrams from a template, a blank canvas, or an AI prompt. Creately combines Quick-Create, standard flowchart symbols, smart connectors, automatic layouts, and real-time collaboration in one online flowchart workspace.
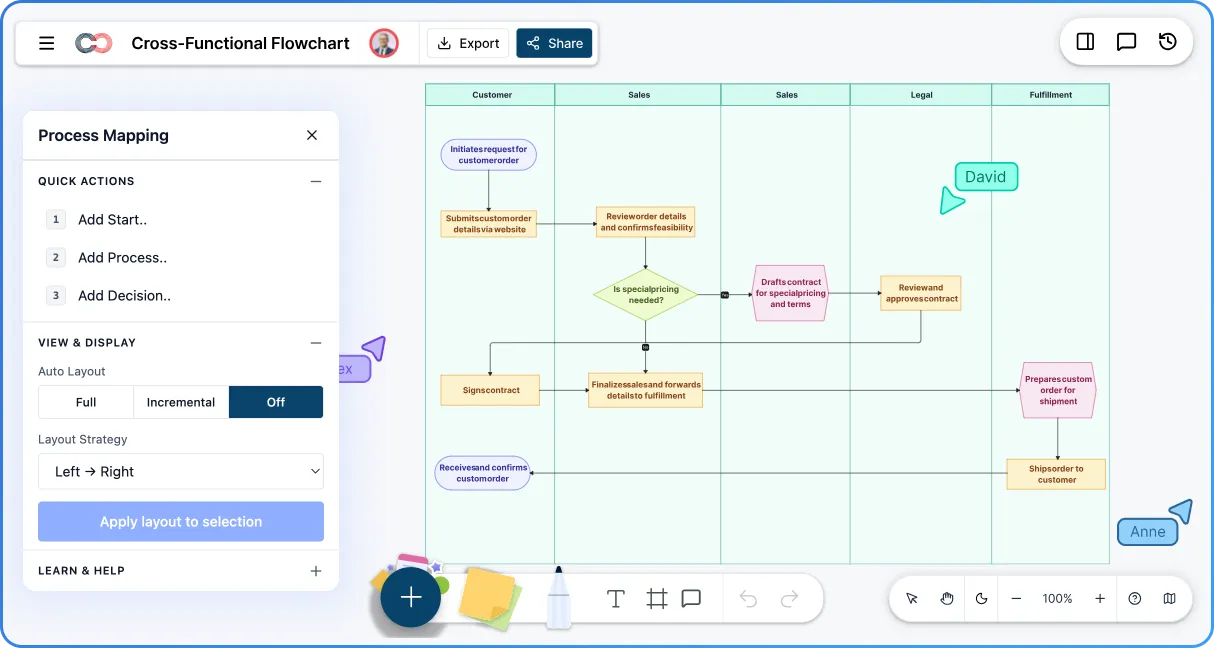
Map ownership, handoffs, and dependencies across teams with Creately's Cross Functional Flowchart Creator to improve coordination and process clarity.
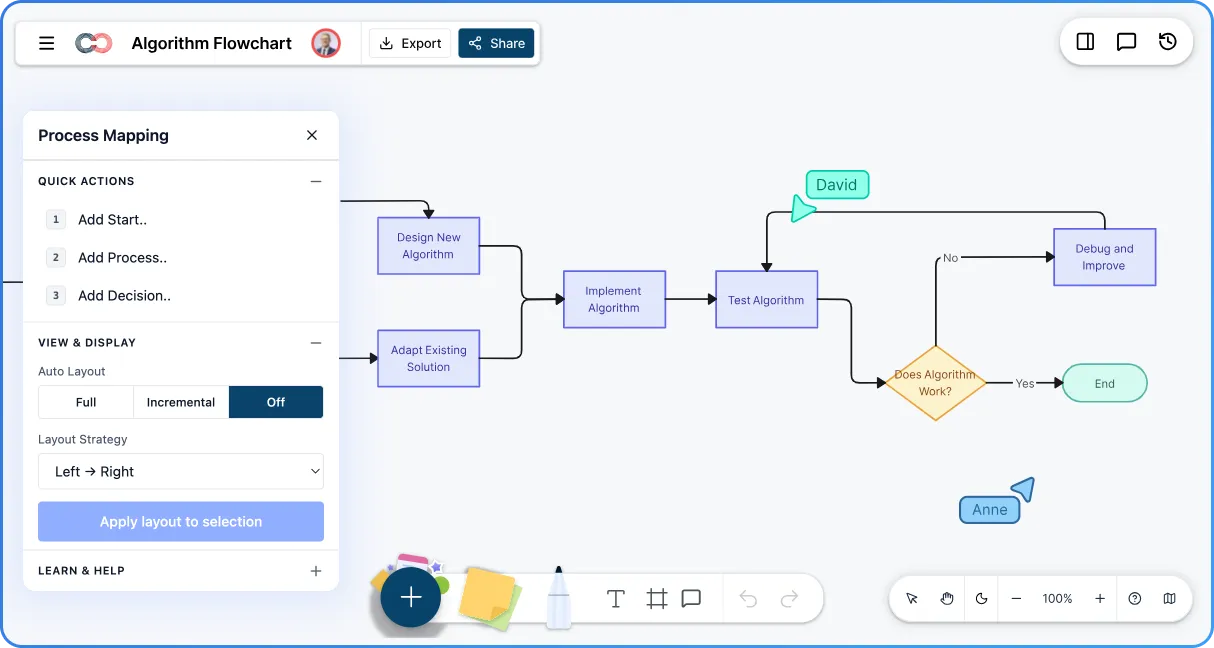
Visualize algorithms clearly with Creately’s Algorithm Flowchart Creator. Turn complex processes into easy-to-follow diagrams using drag-and-drop shapes, smart connectors, and ready-made templates.
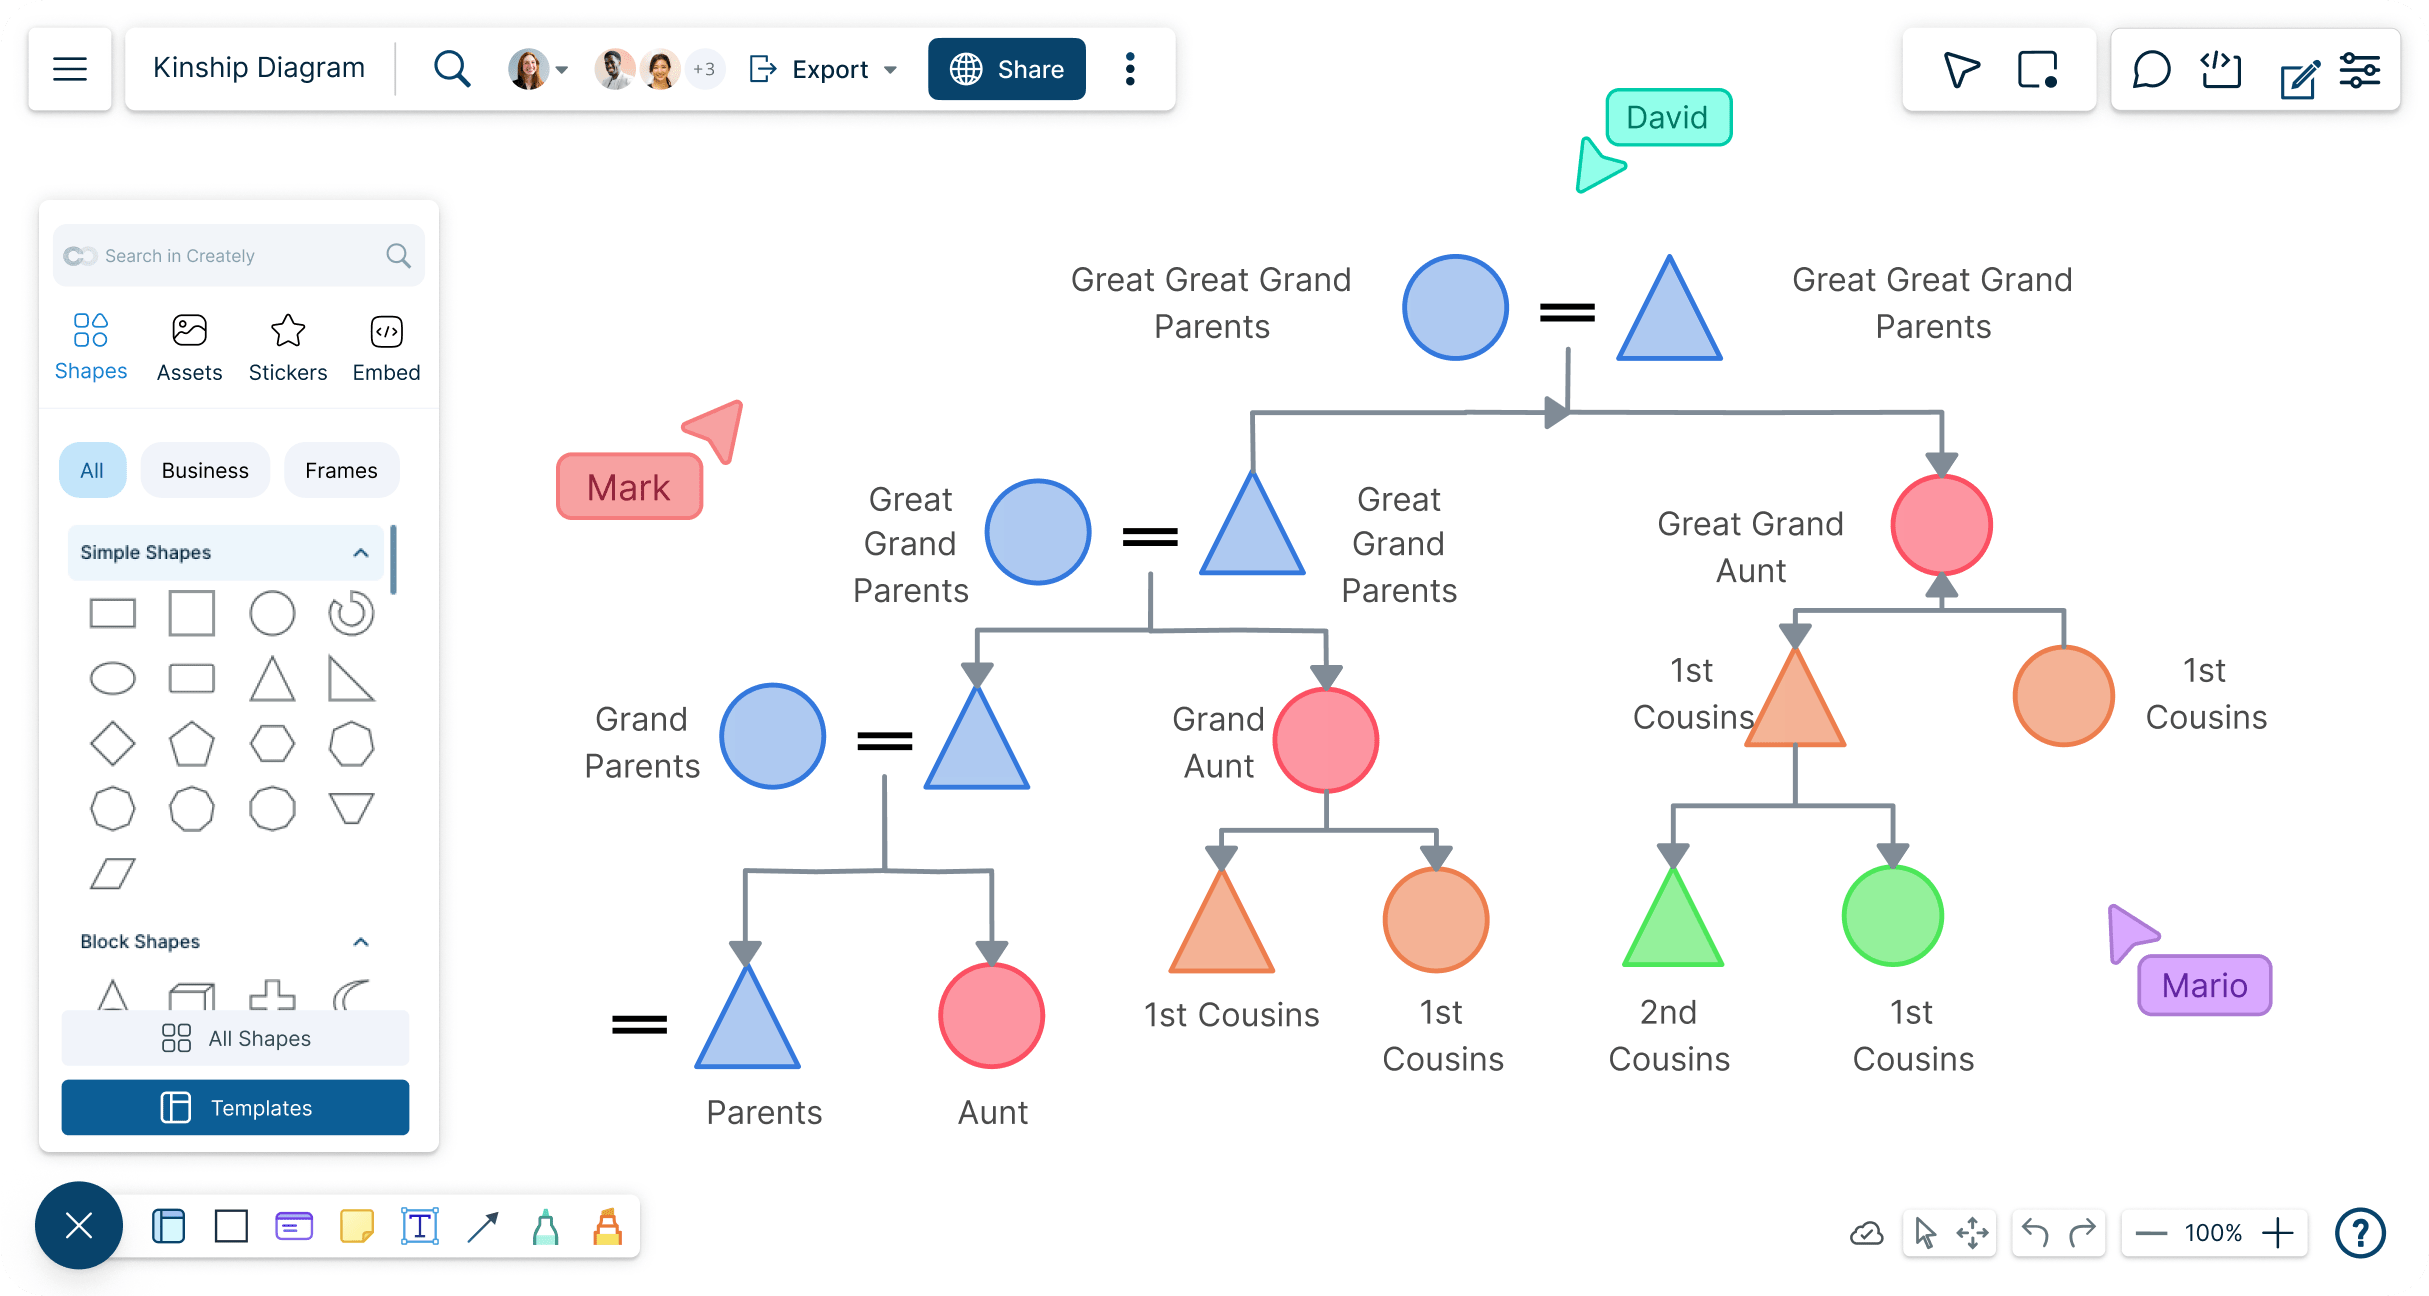
Visualize biological relationships and understand how they translate into social and cultural realities with Creately’s Kinship diagram maker.
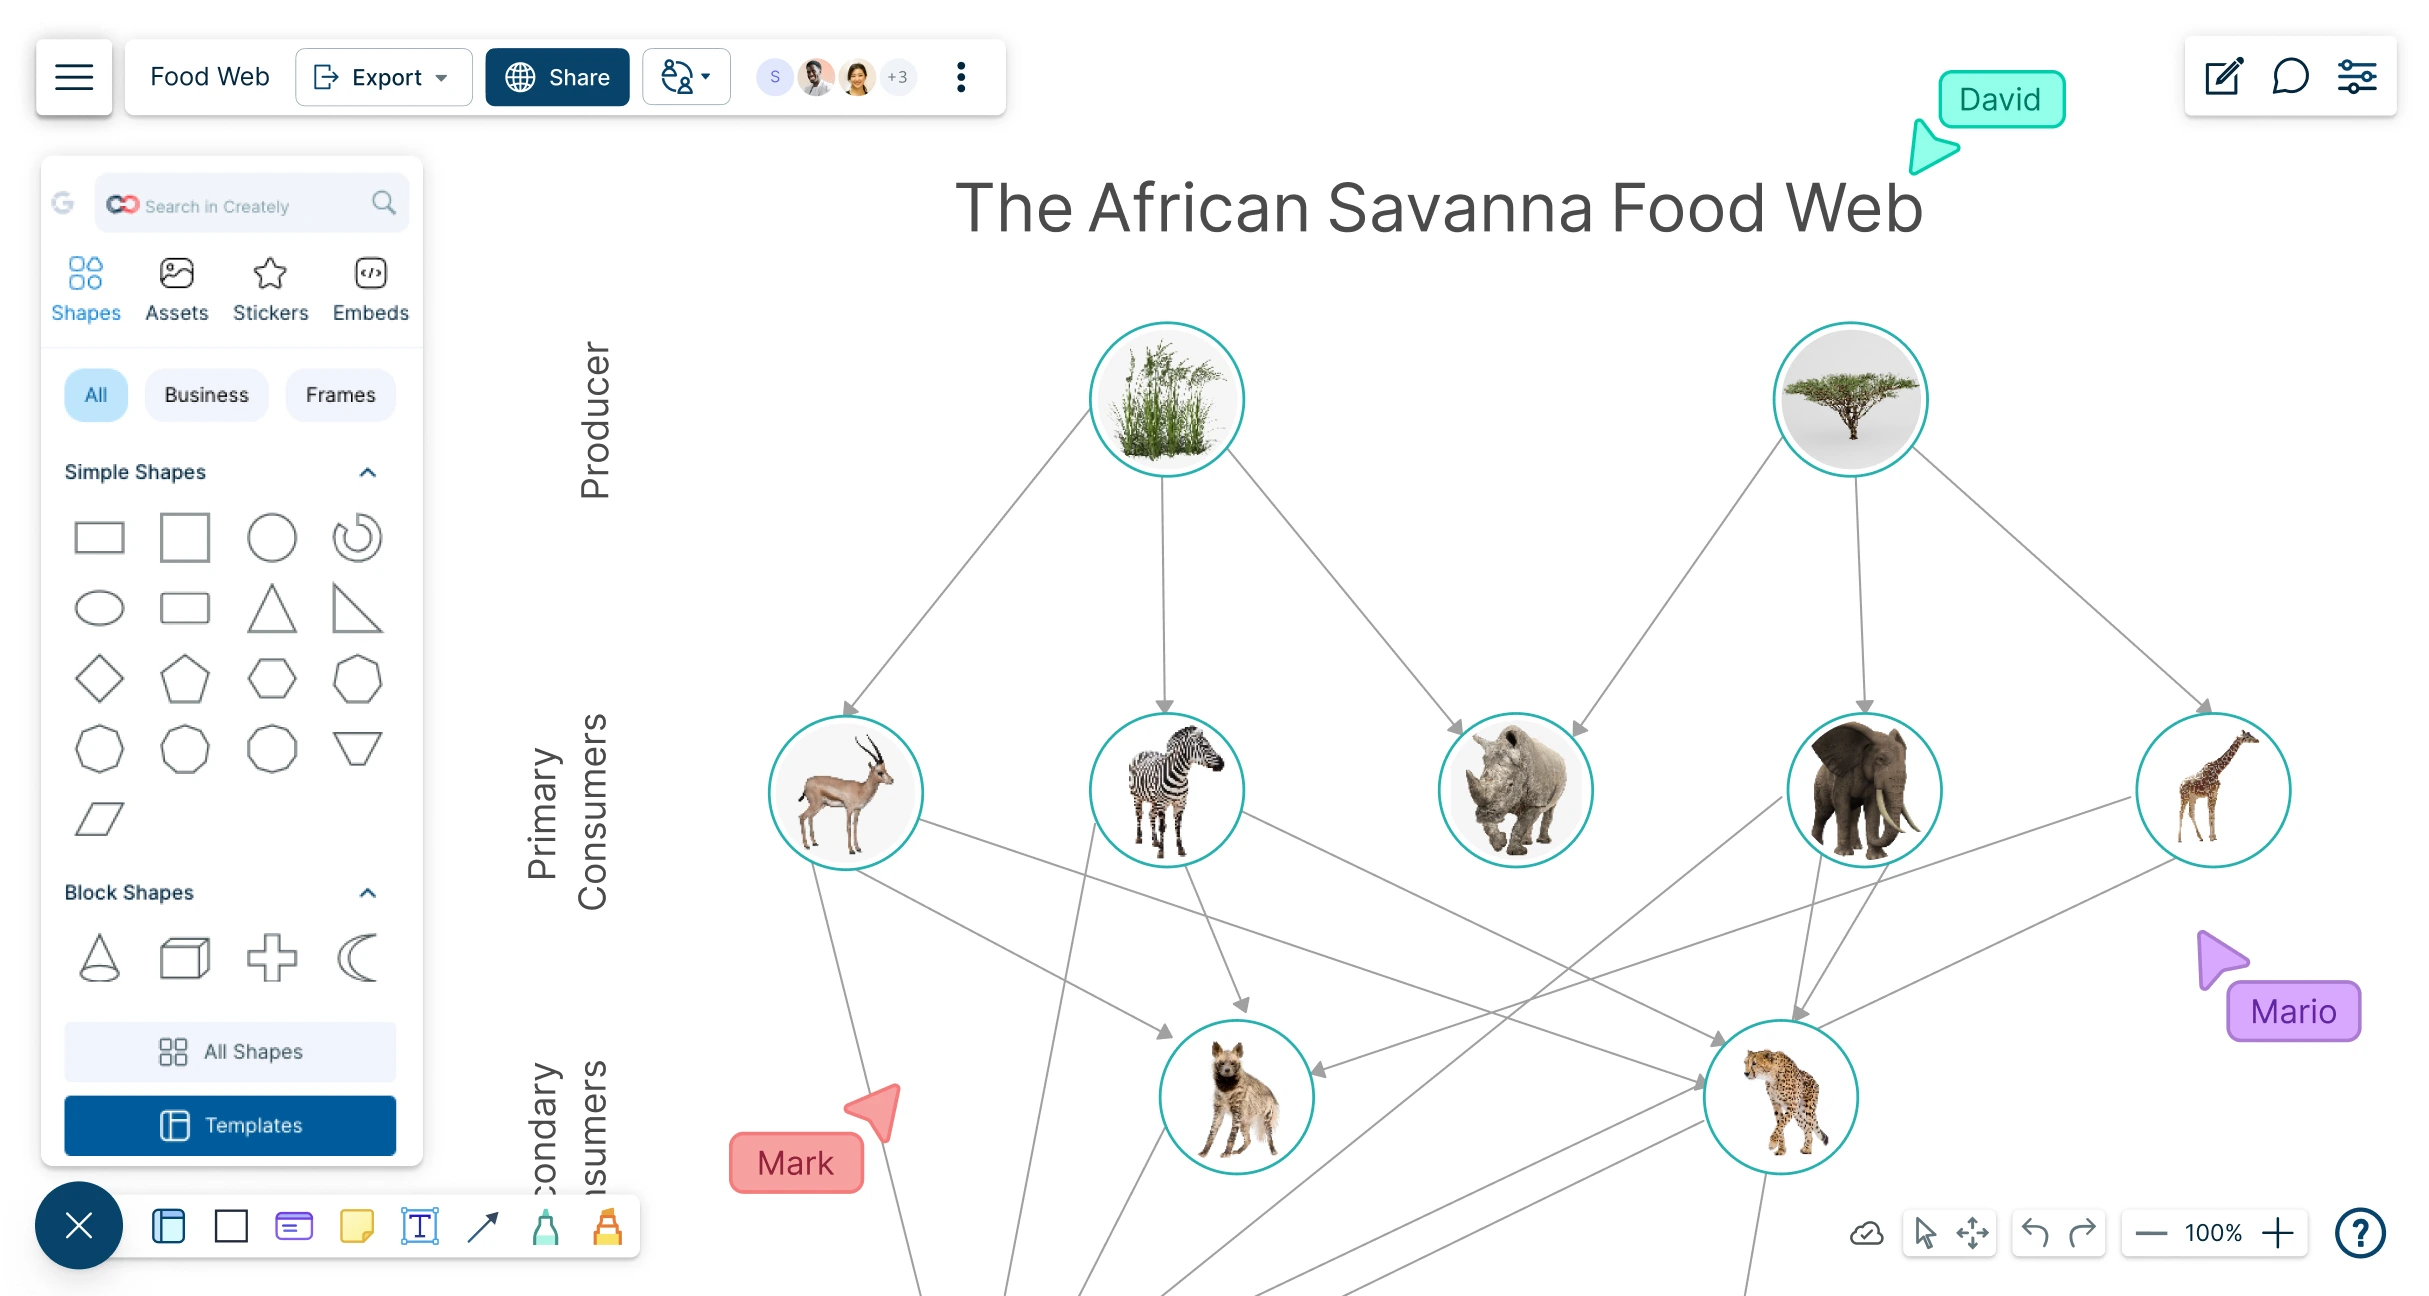
Build visual food webs that make organisms, feeding relationships, and energy flow easy to follow. Map producers, consumers, predators, prey, and decomposers, then customize, review, and share your diagram for assignments or presentations.
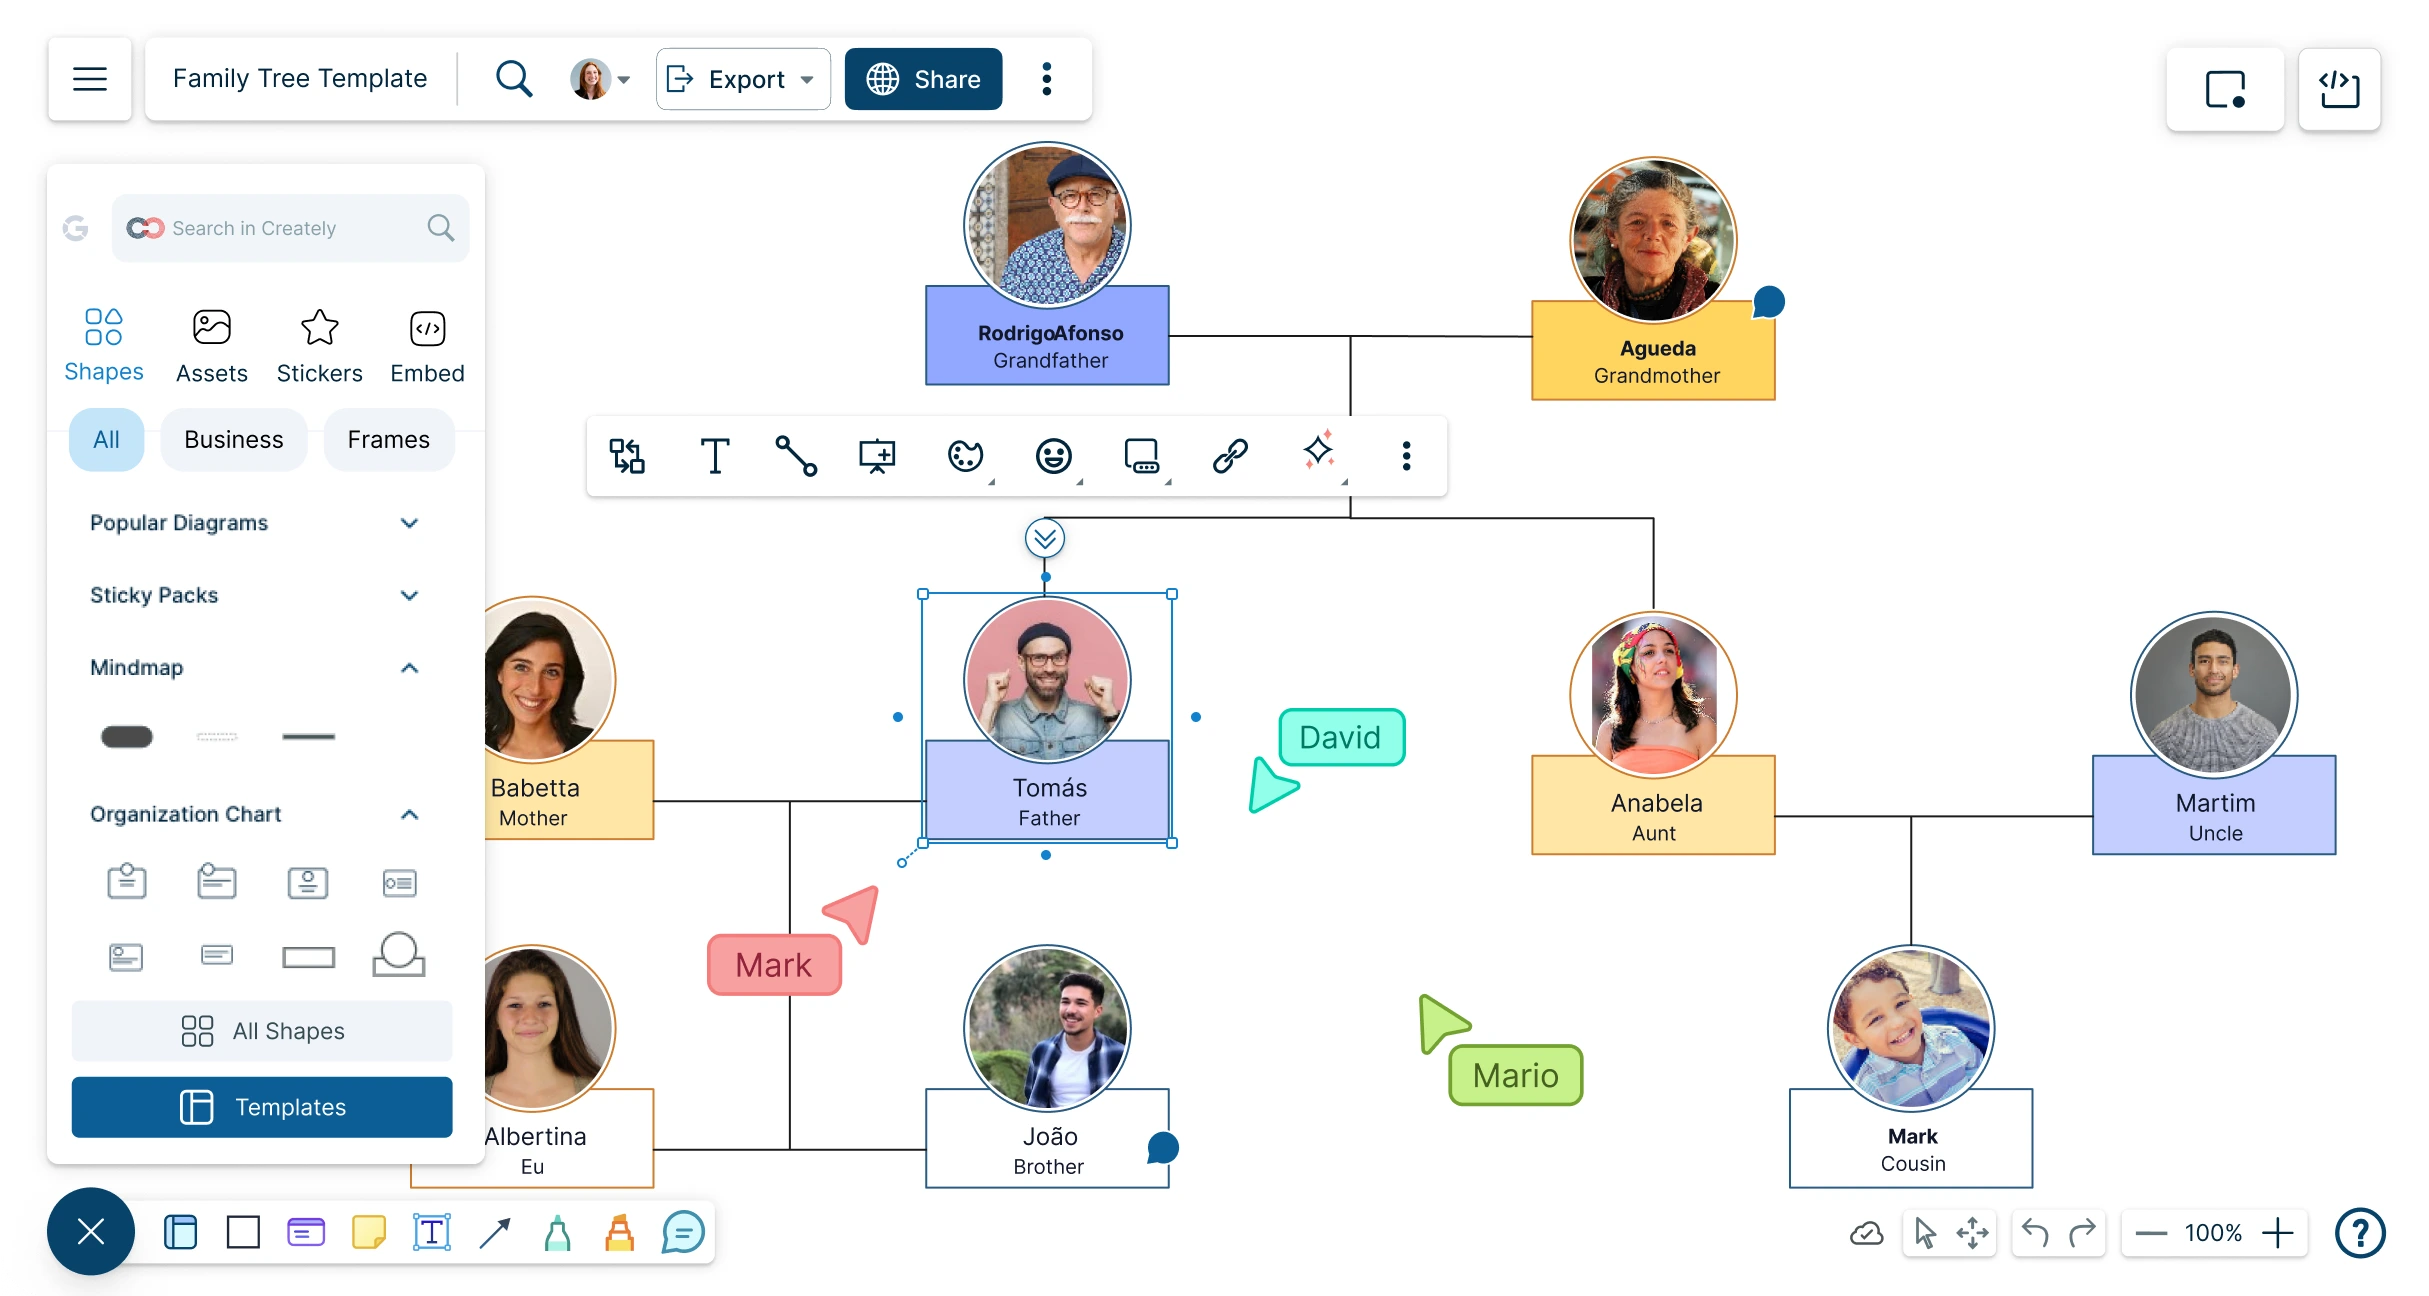
Create a family tree without getting stuck on layout or design. Start with what you know, build each branch as you go, and create a family tree that’s ready to share, print, or present. 100% free - no download or account needed to start.
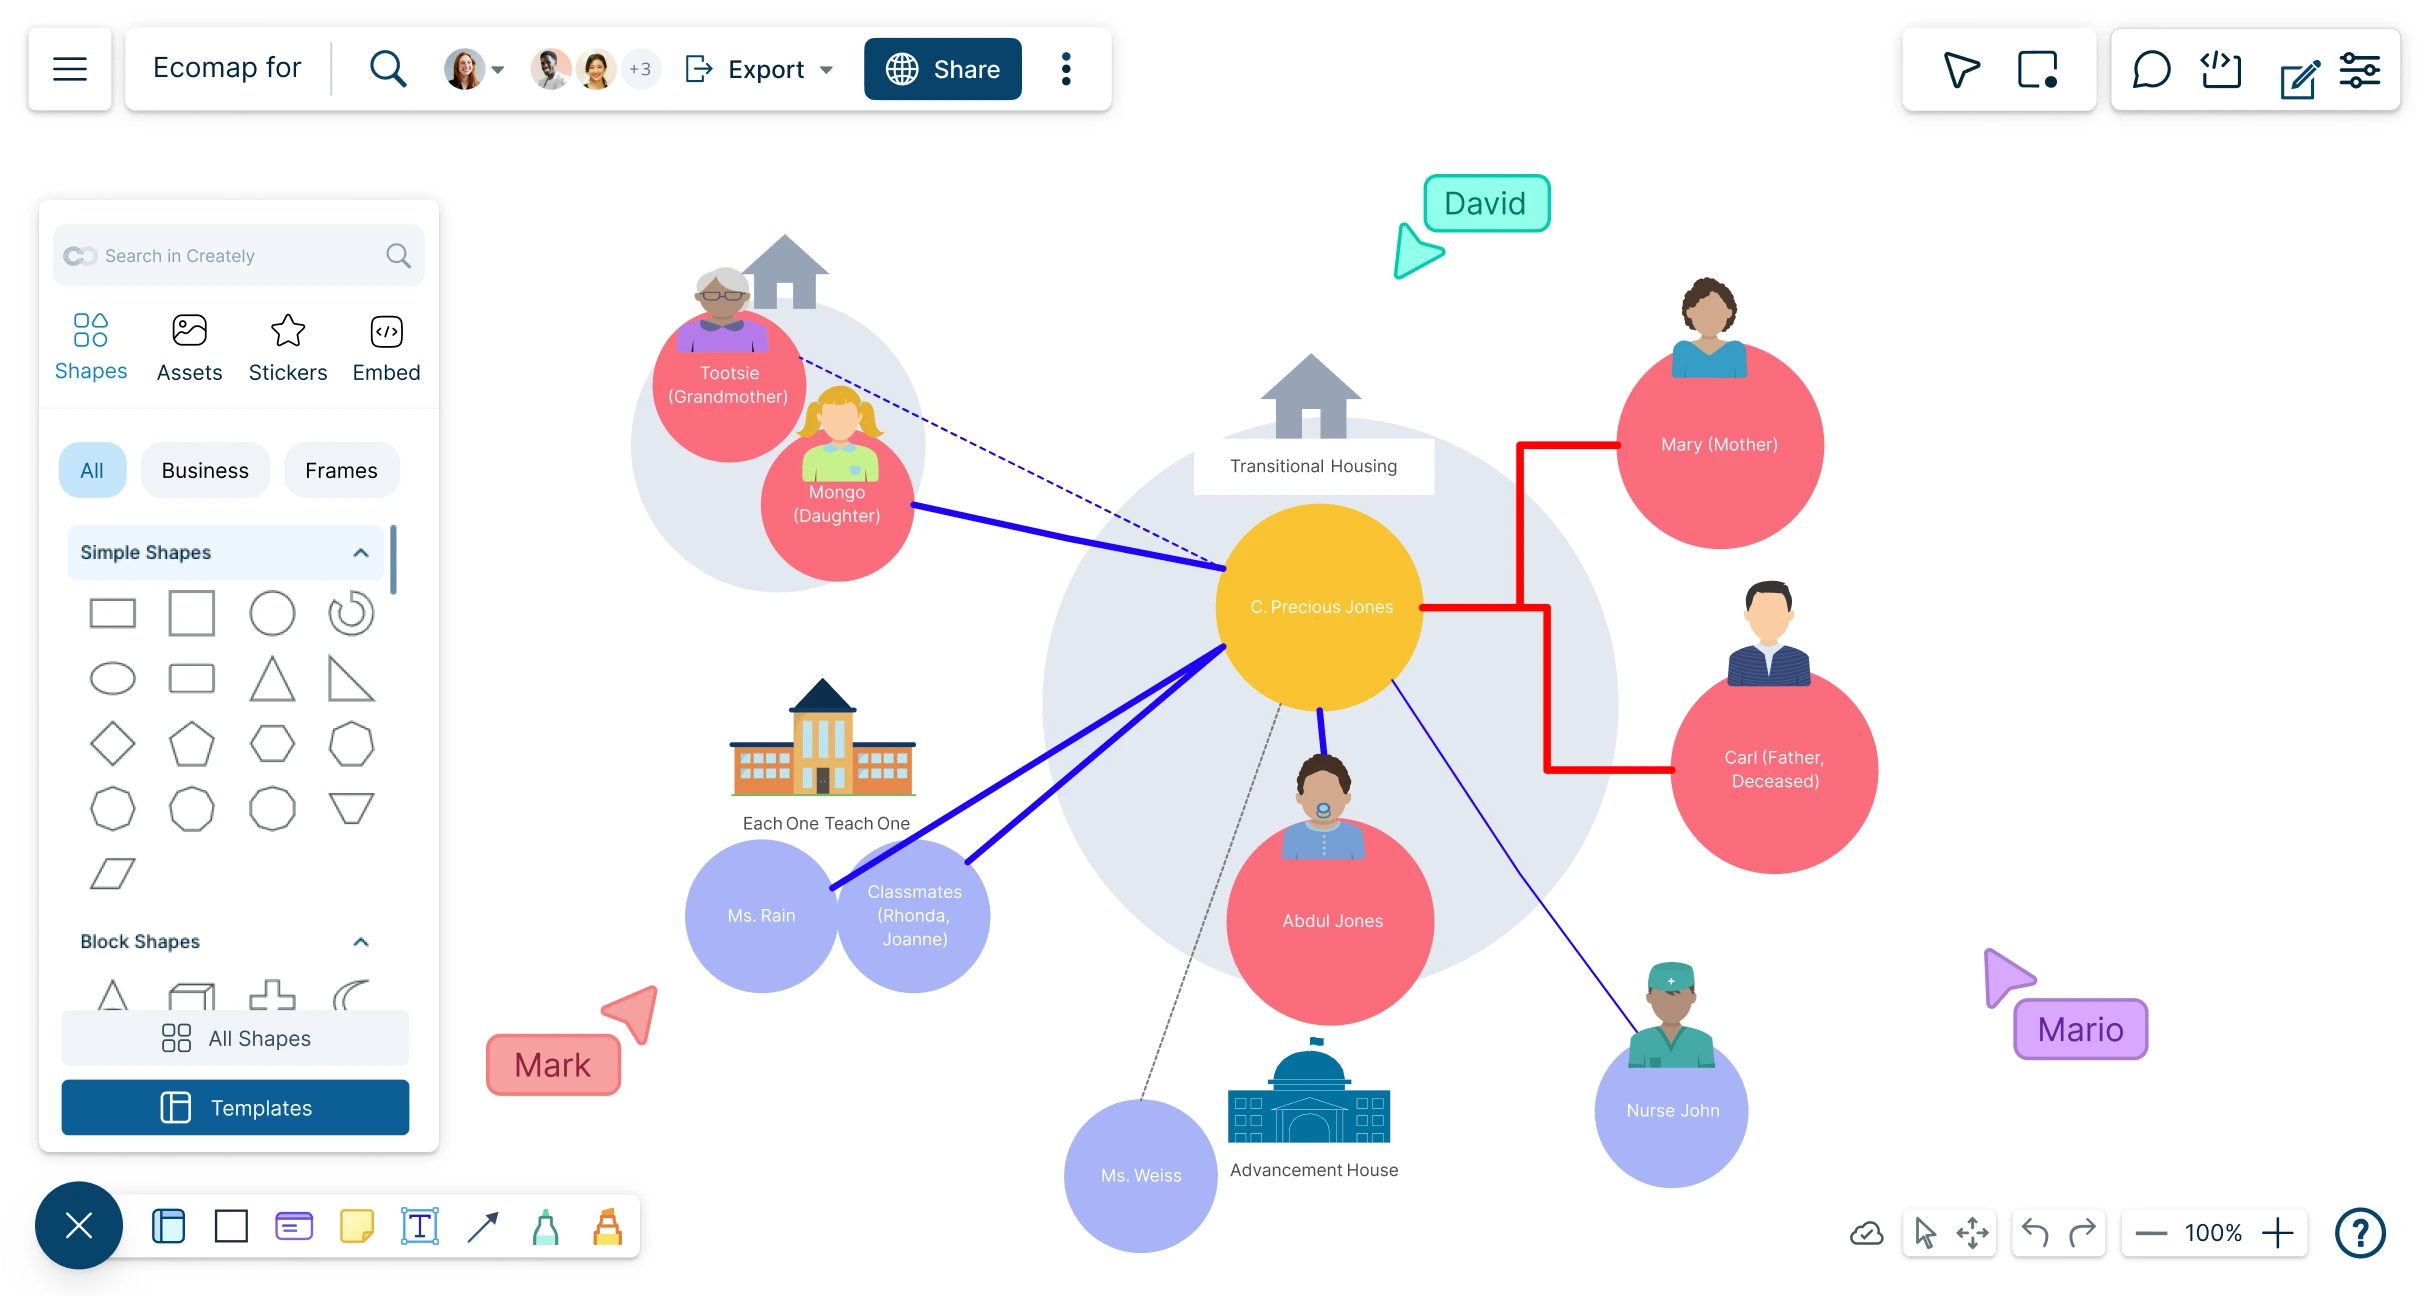
Visualize and analyze relationships in play in an individual’s life. Streamline counseling and social work assessment with intuitive visual tools.
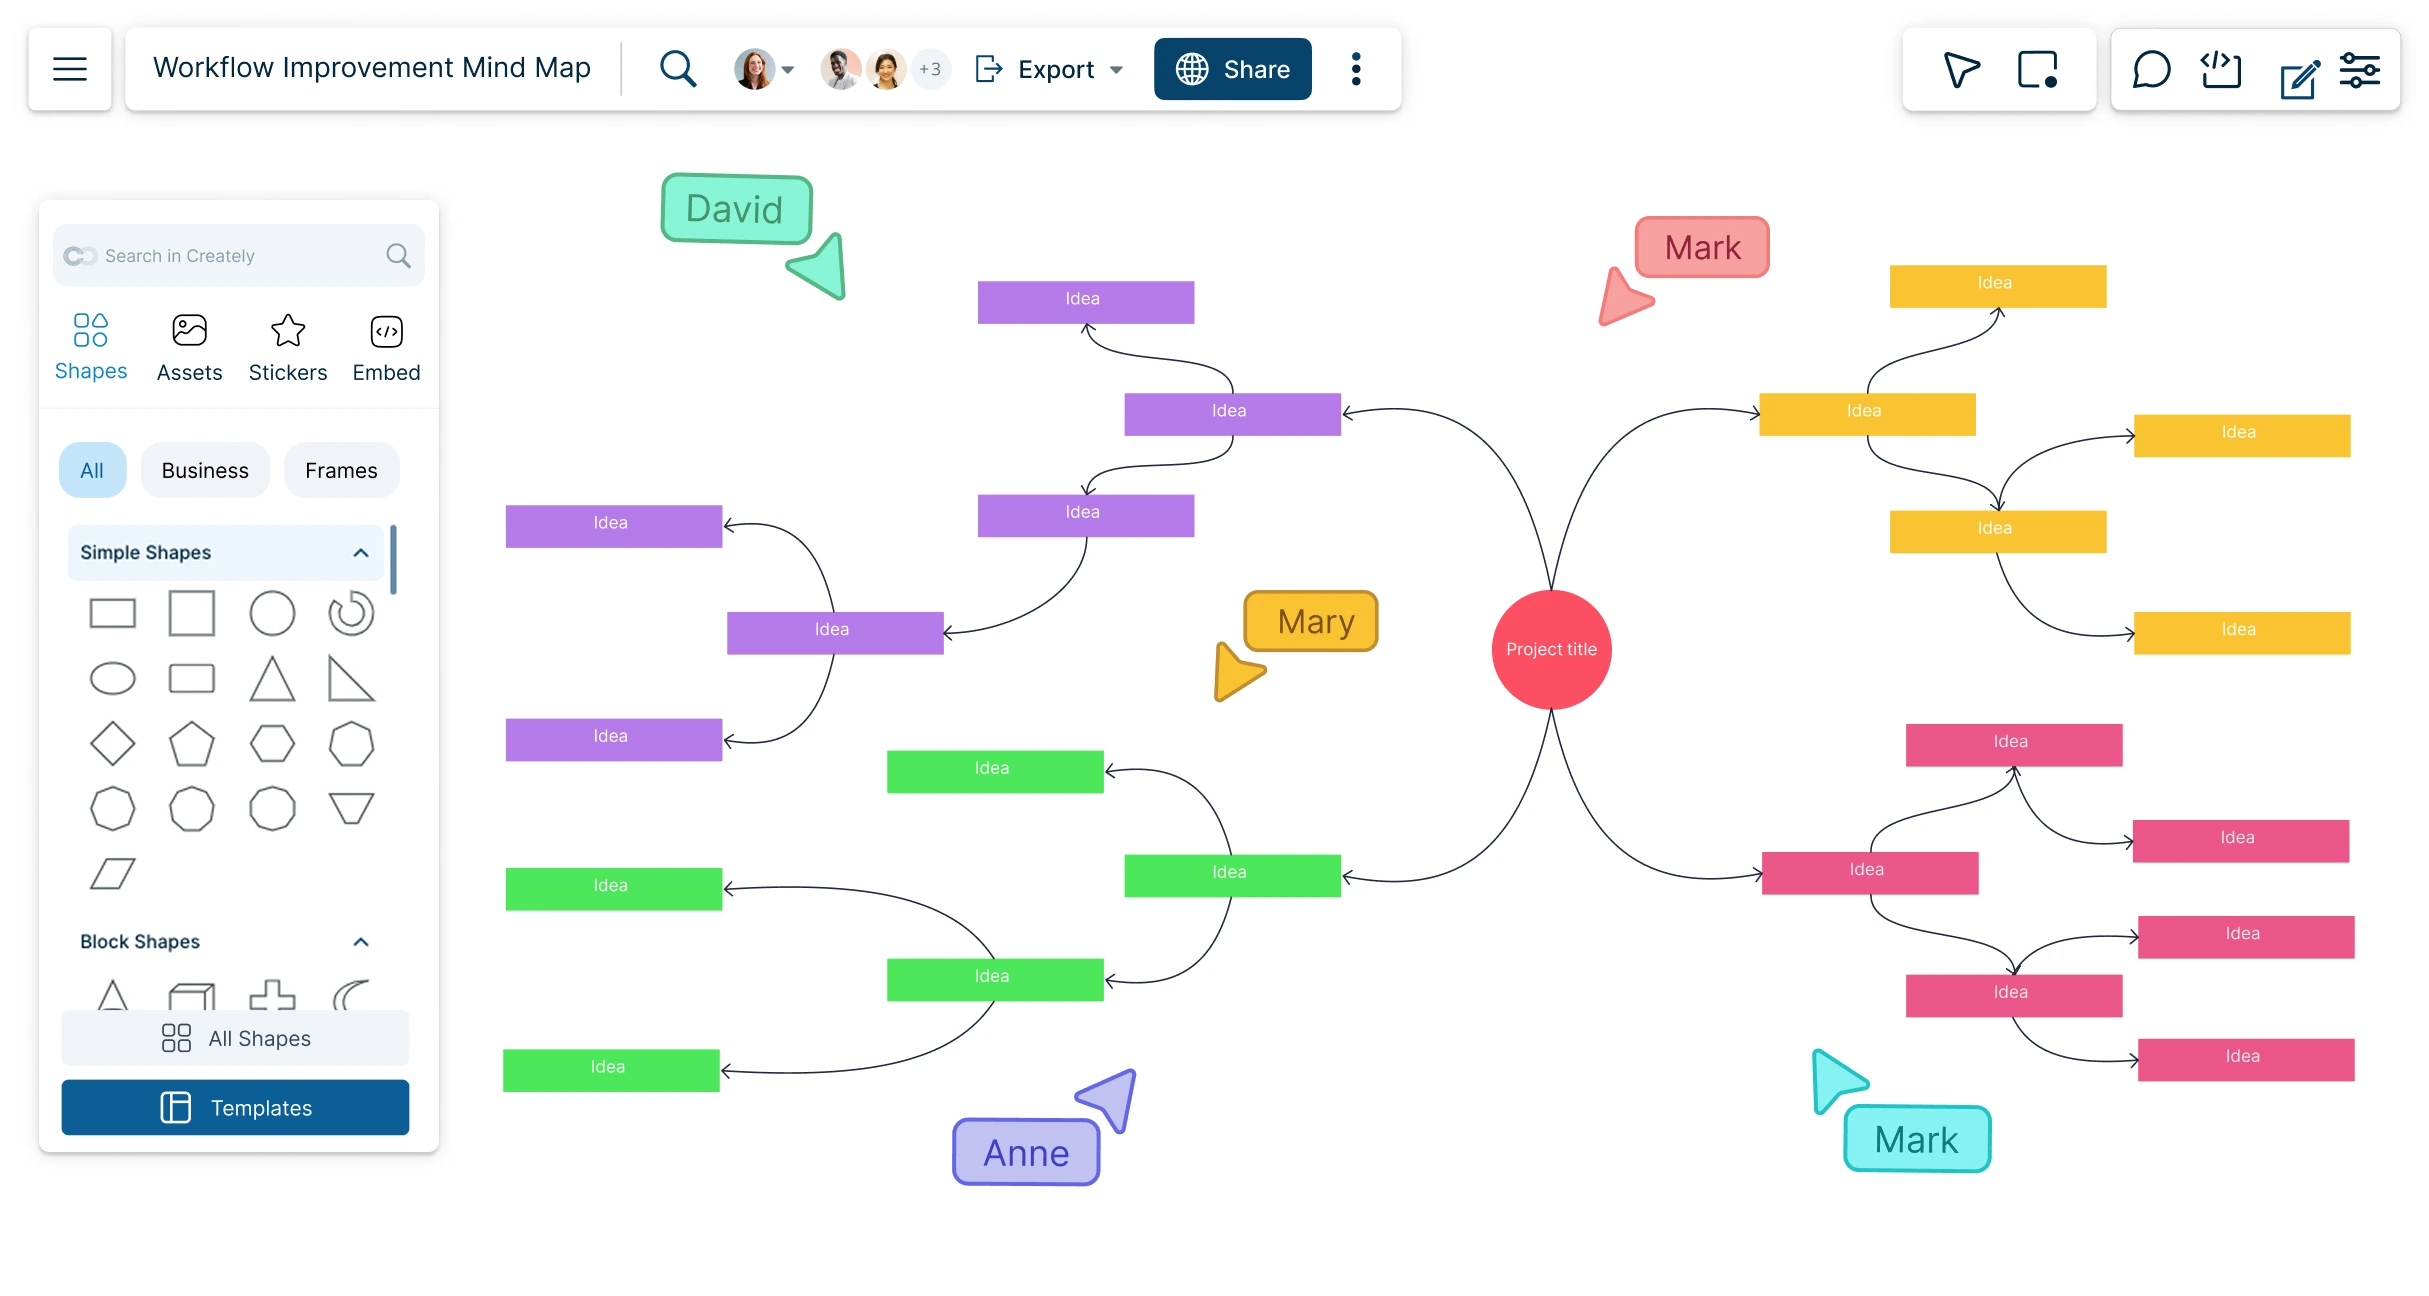
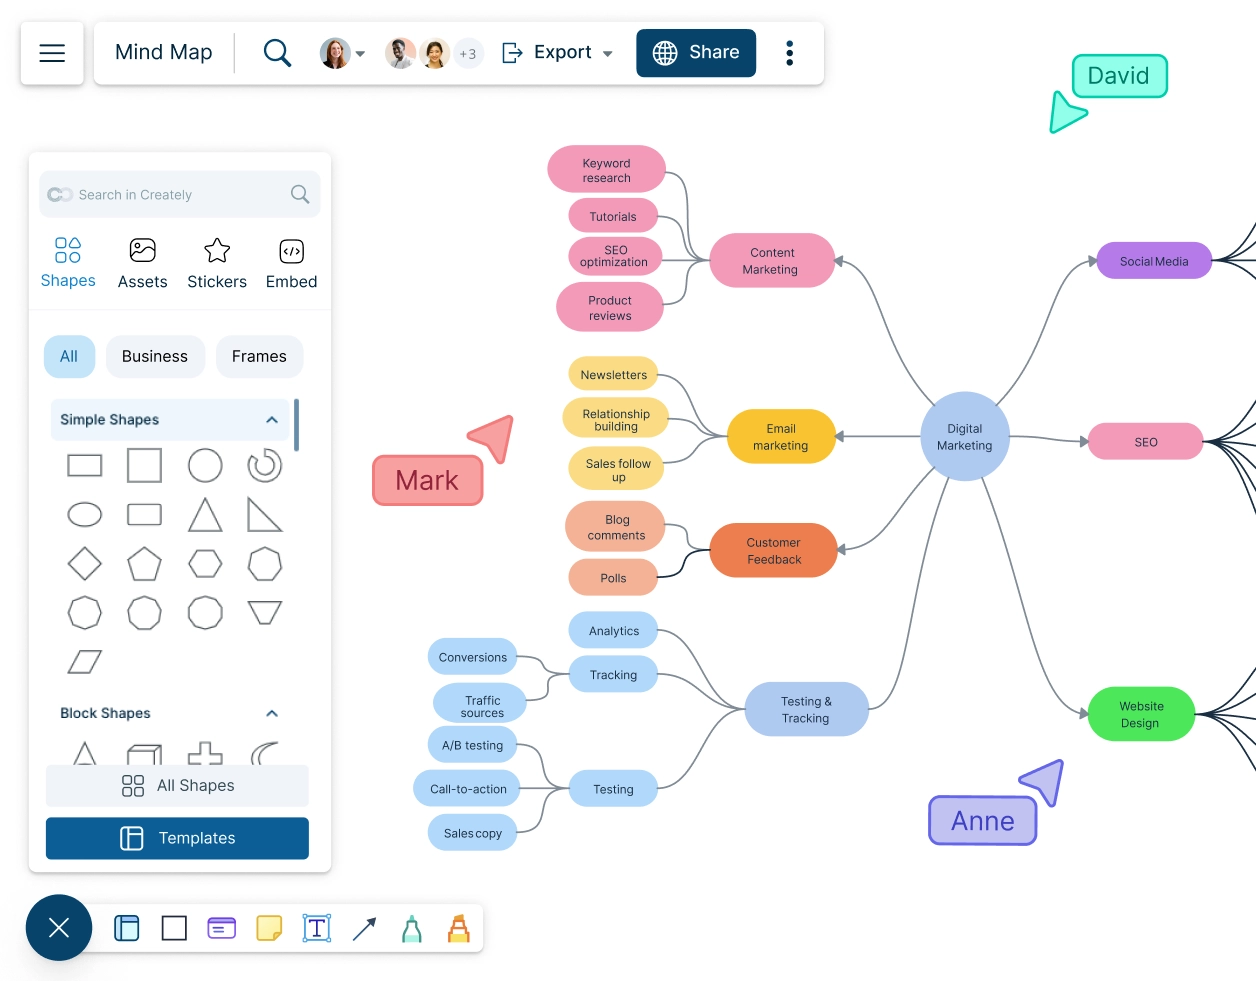
Use the mind map online tool to visualize ideas and concepts for collaborative brainstorming, creative thinking, problem-solving, and so much more.
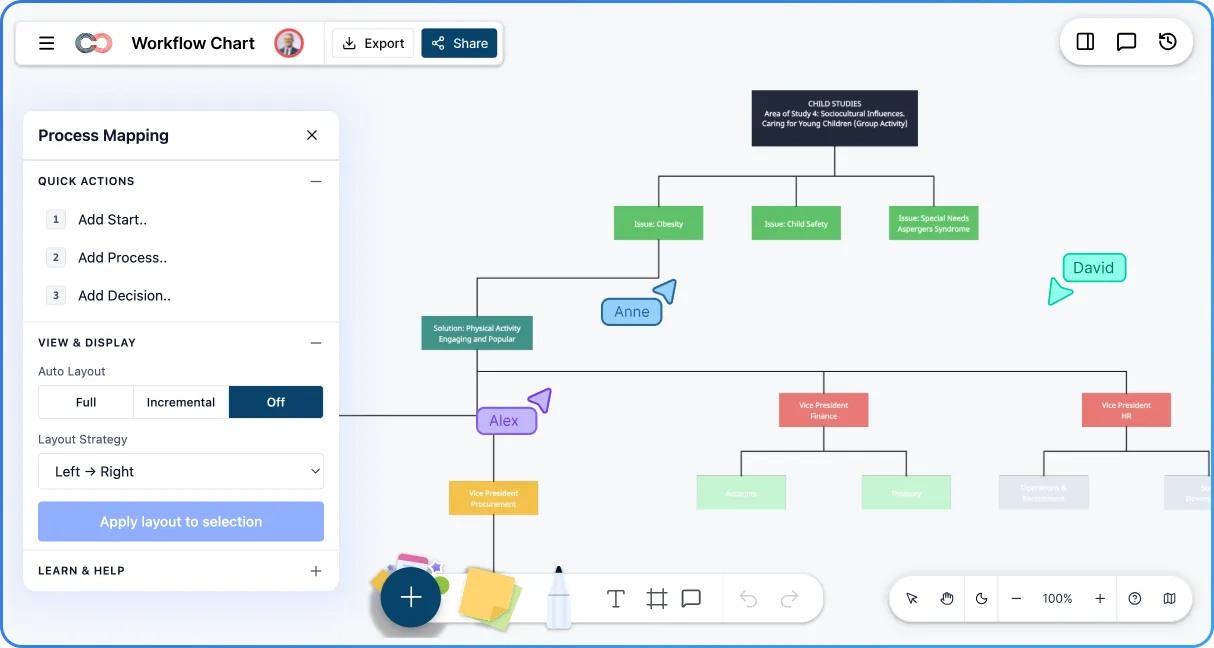
Visualize tasks, decisions, and handoffs clearly with Creately’s Workflow Chart Creator. Build professional workflow charts faster, improve team clarity, and keep every process running smoothly from start to finish.
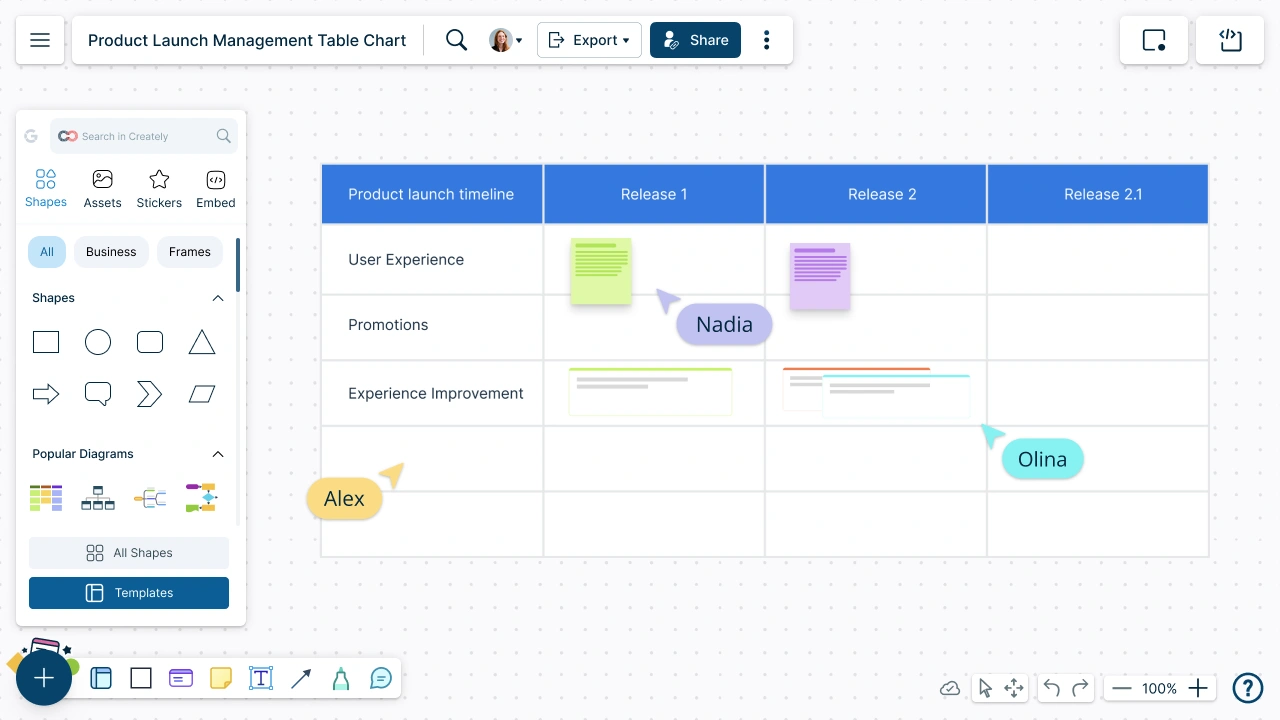
Create visually stunning table charts to organize your information and data with Creately’s table creator. Arrange your data in meaningful ways and interact with them to make effective data-driven decisions.
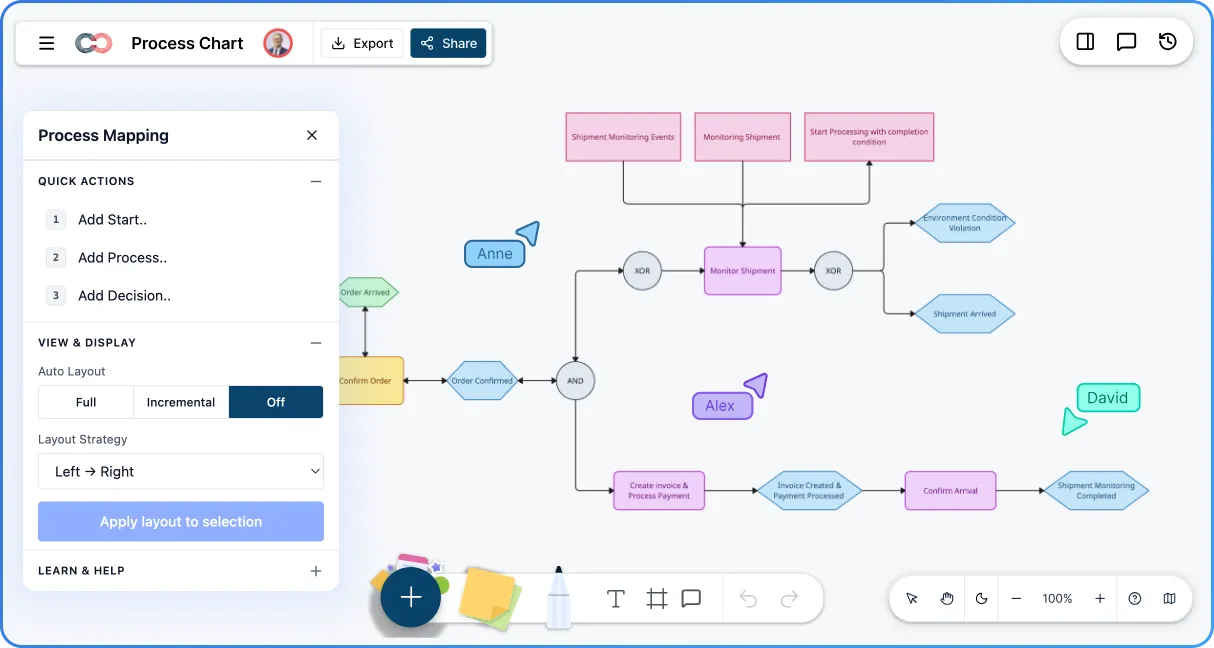
Map workflows online with clarity and precision. Creately’s process chart creator helps teams plan, refine, and execute processes efficiently—boosting collaboration and ensuring reliable results.
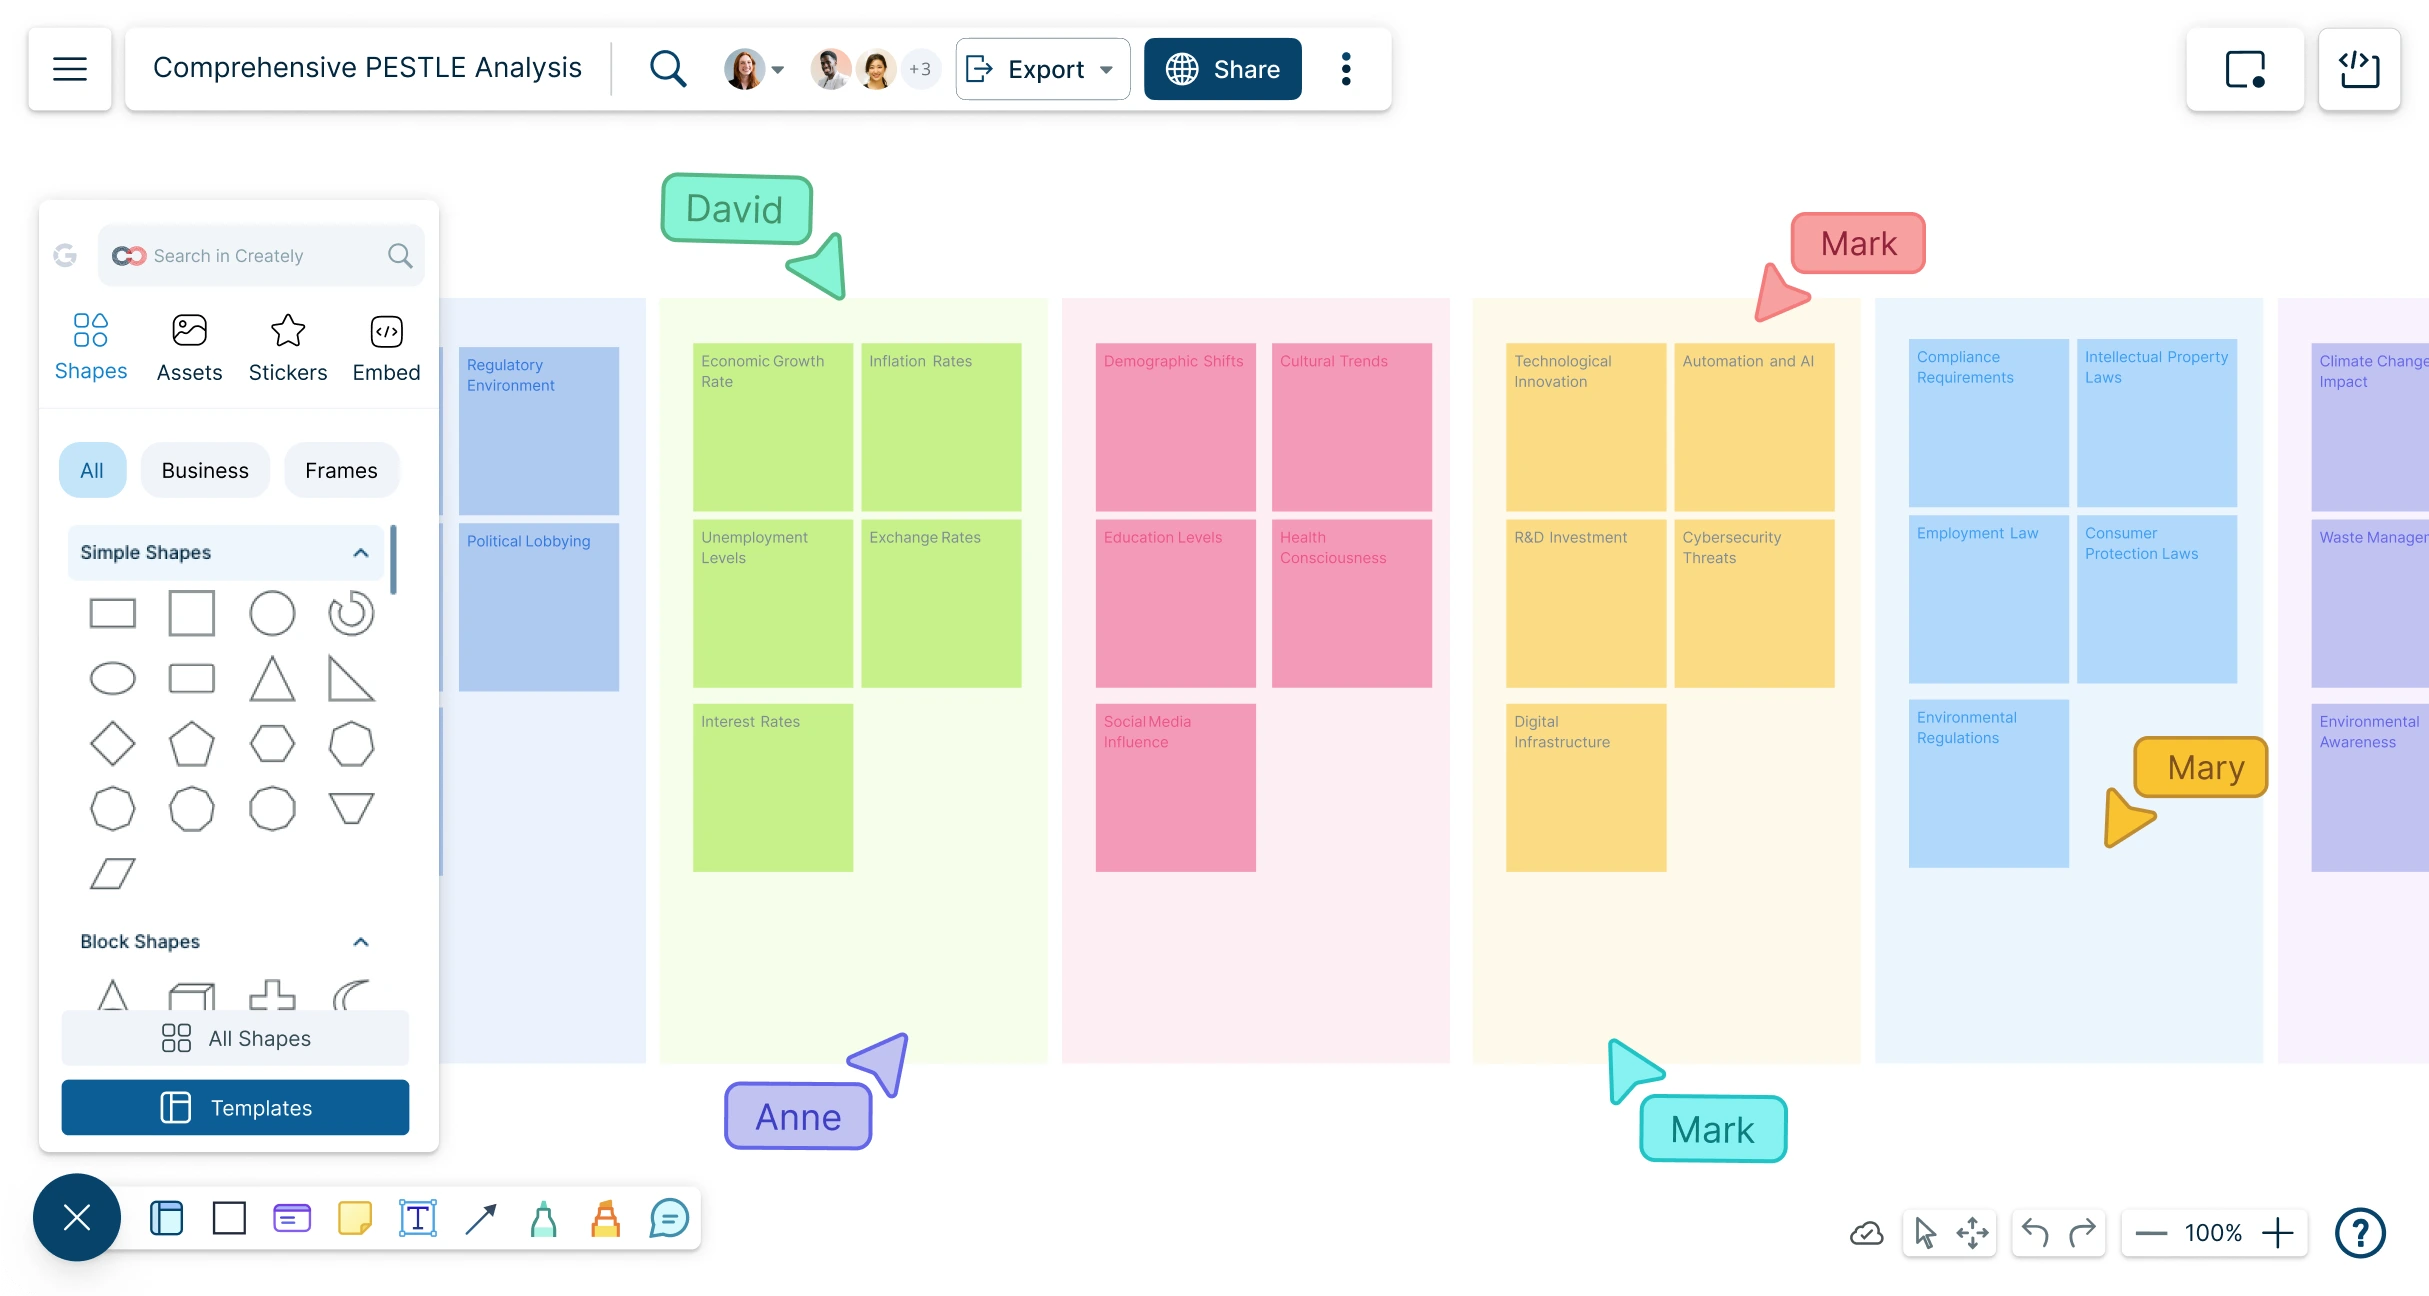
Analyze political, economic, social, technological, environmental, and legal factors in one collaborative workspace to understand market conditions, evaluate risks, and align your team on strategic decisions.
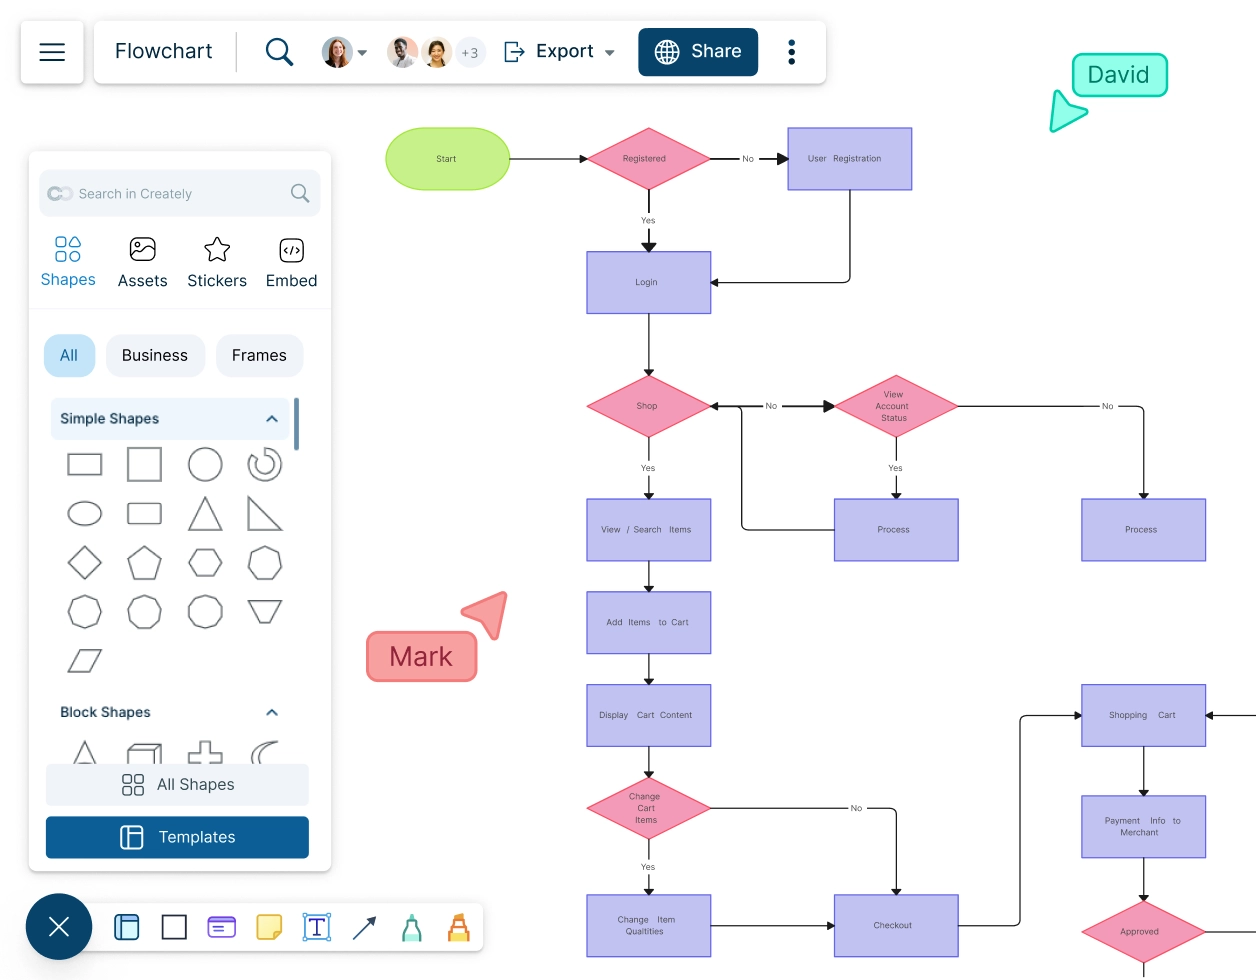
Visualize your workflows and processes to identify operational bottlenecks and areas for improvement with Creately’s Flowchart Creator.
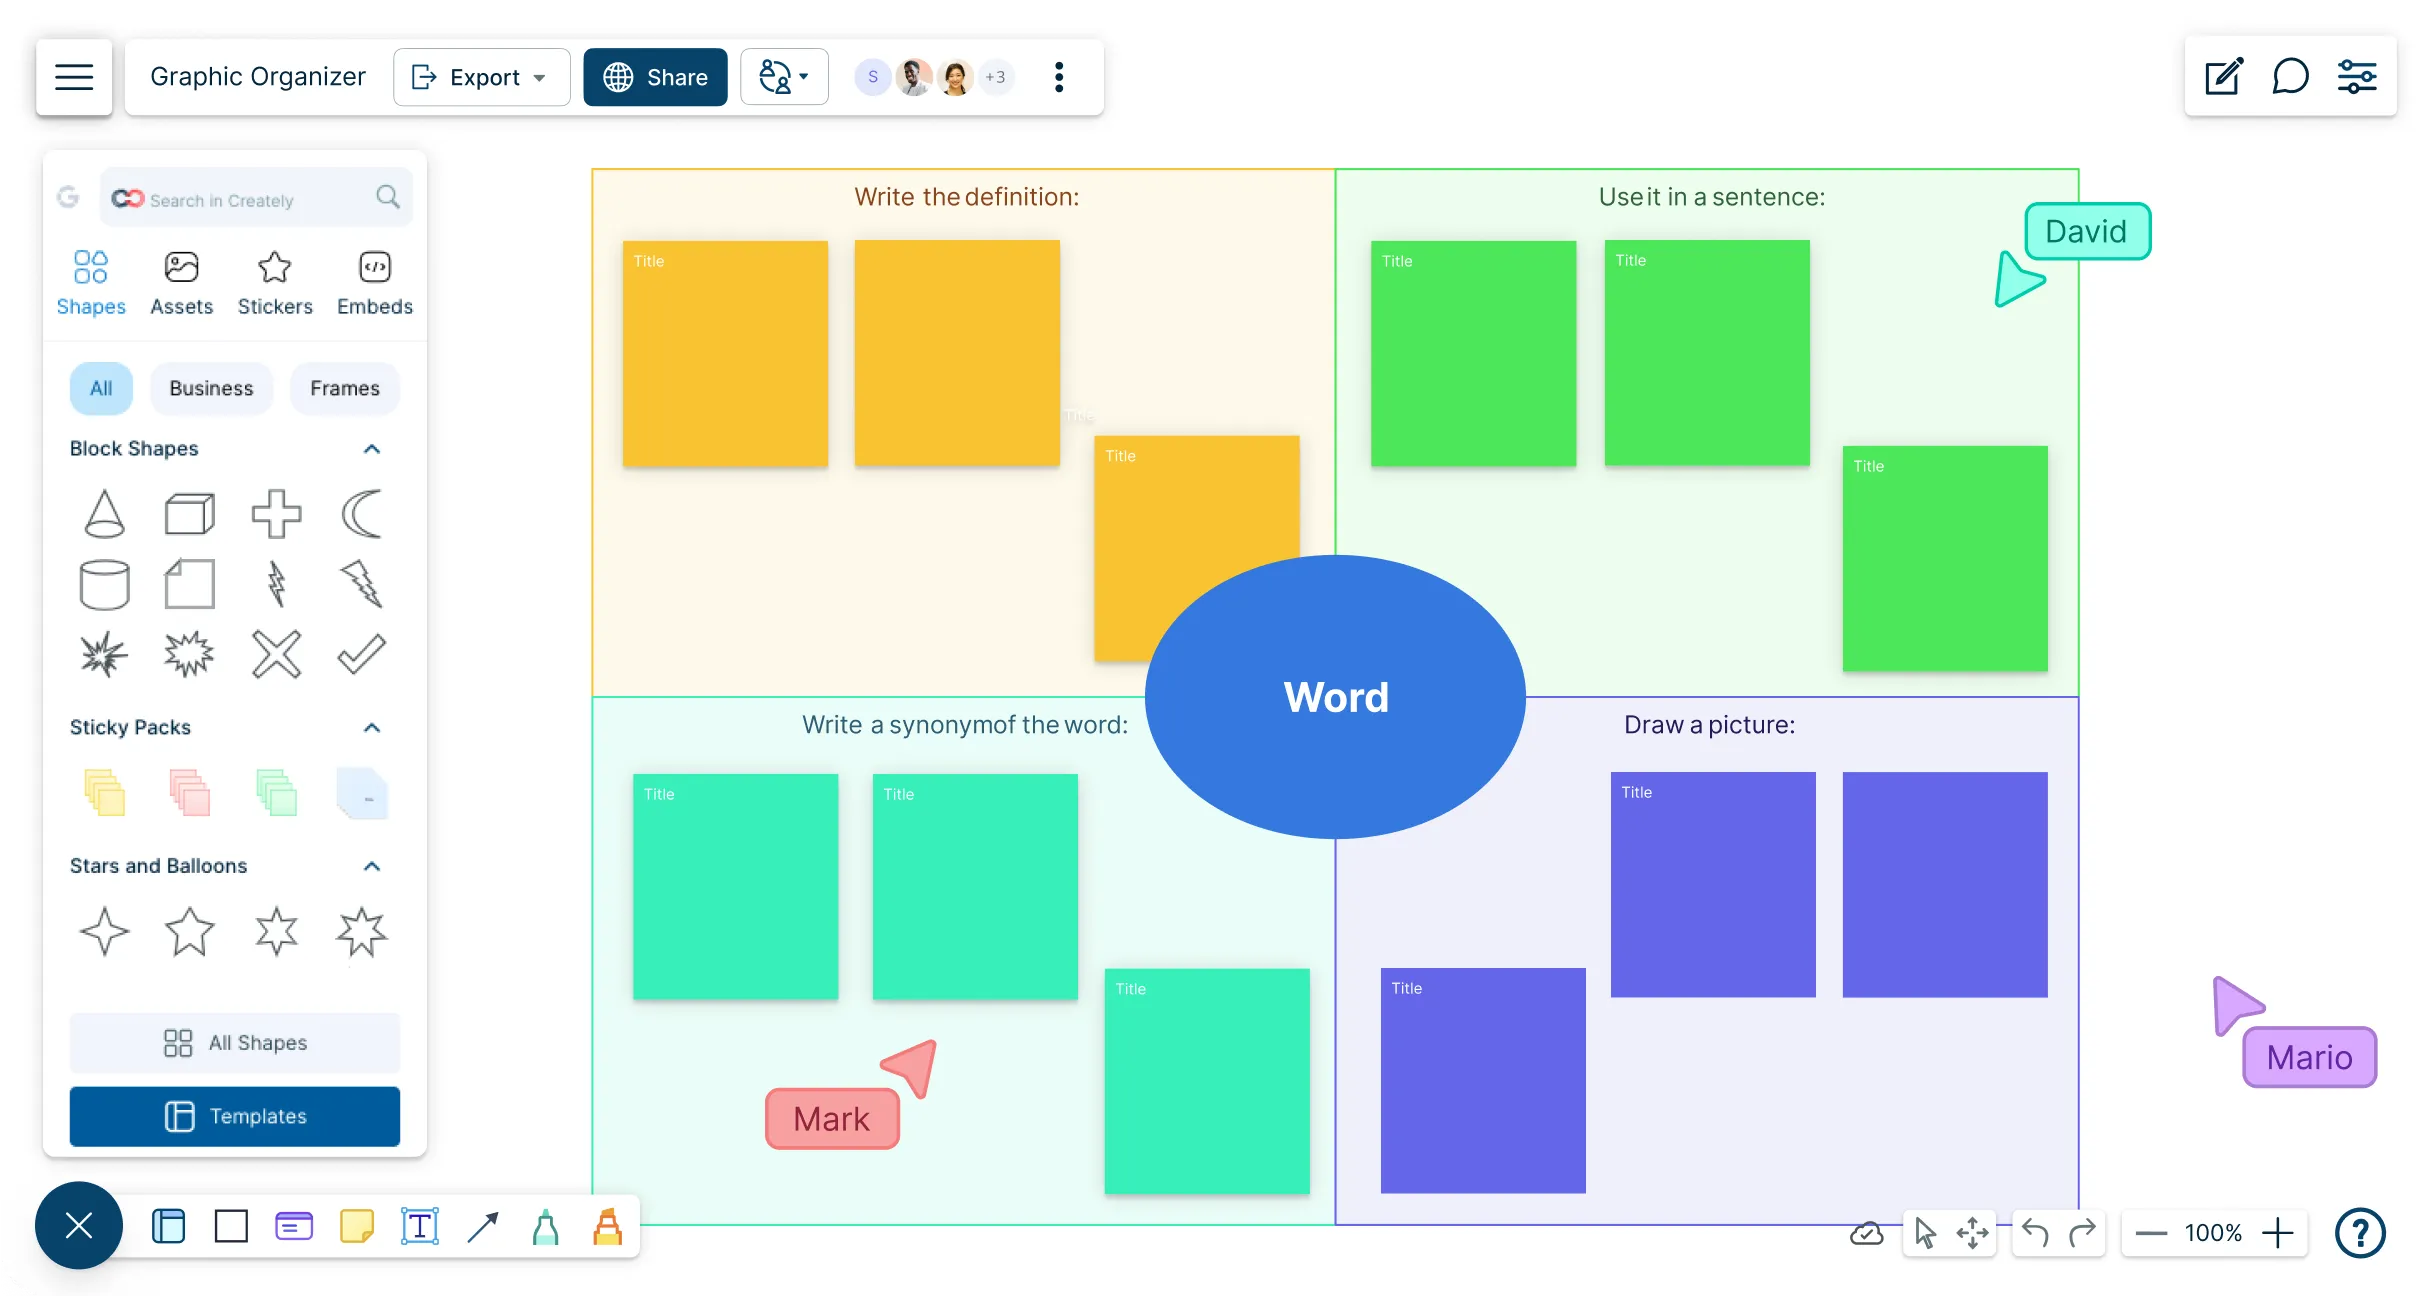
Build, customize, and share visual organizers for lessons, reading activities, writing tasks, projects, and group work using editable templates and easy classroom collaboration tools.
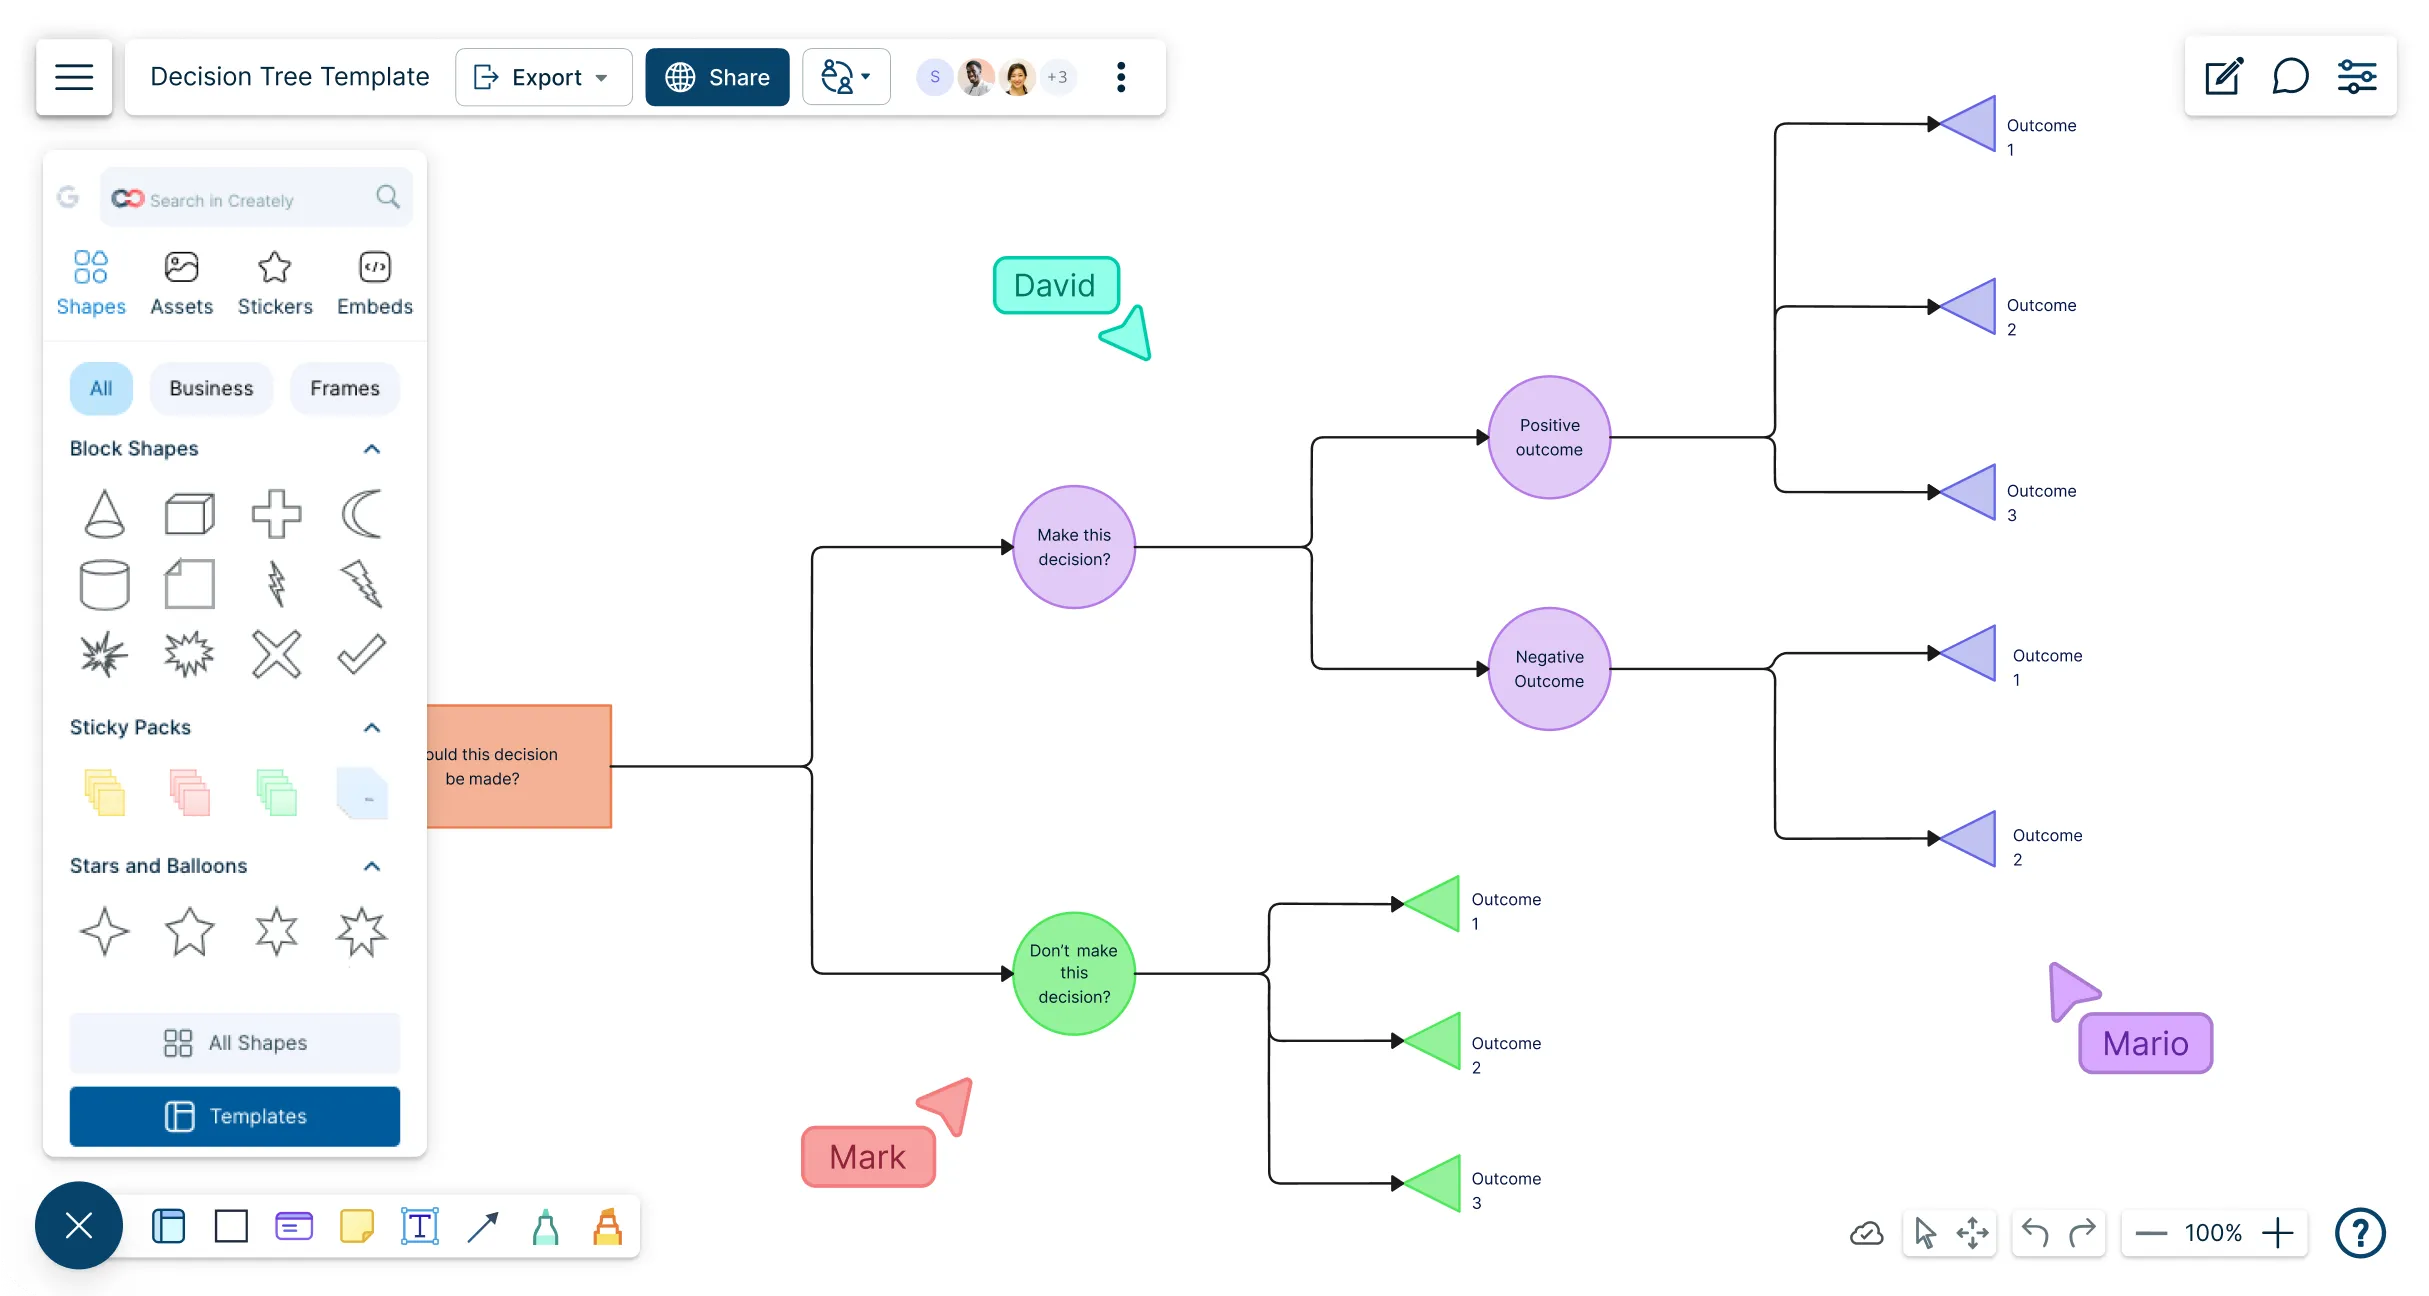
Visualize your decisions from anywhere using Creately’s decision tree diagram maker.
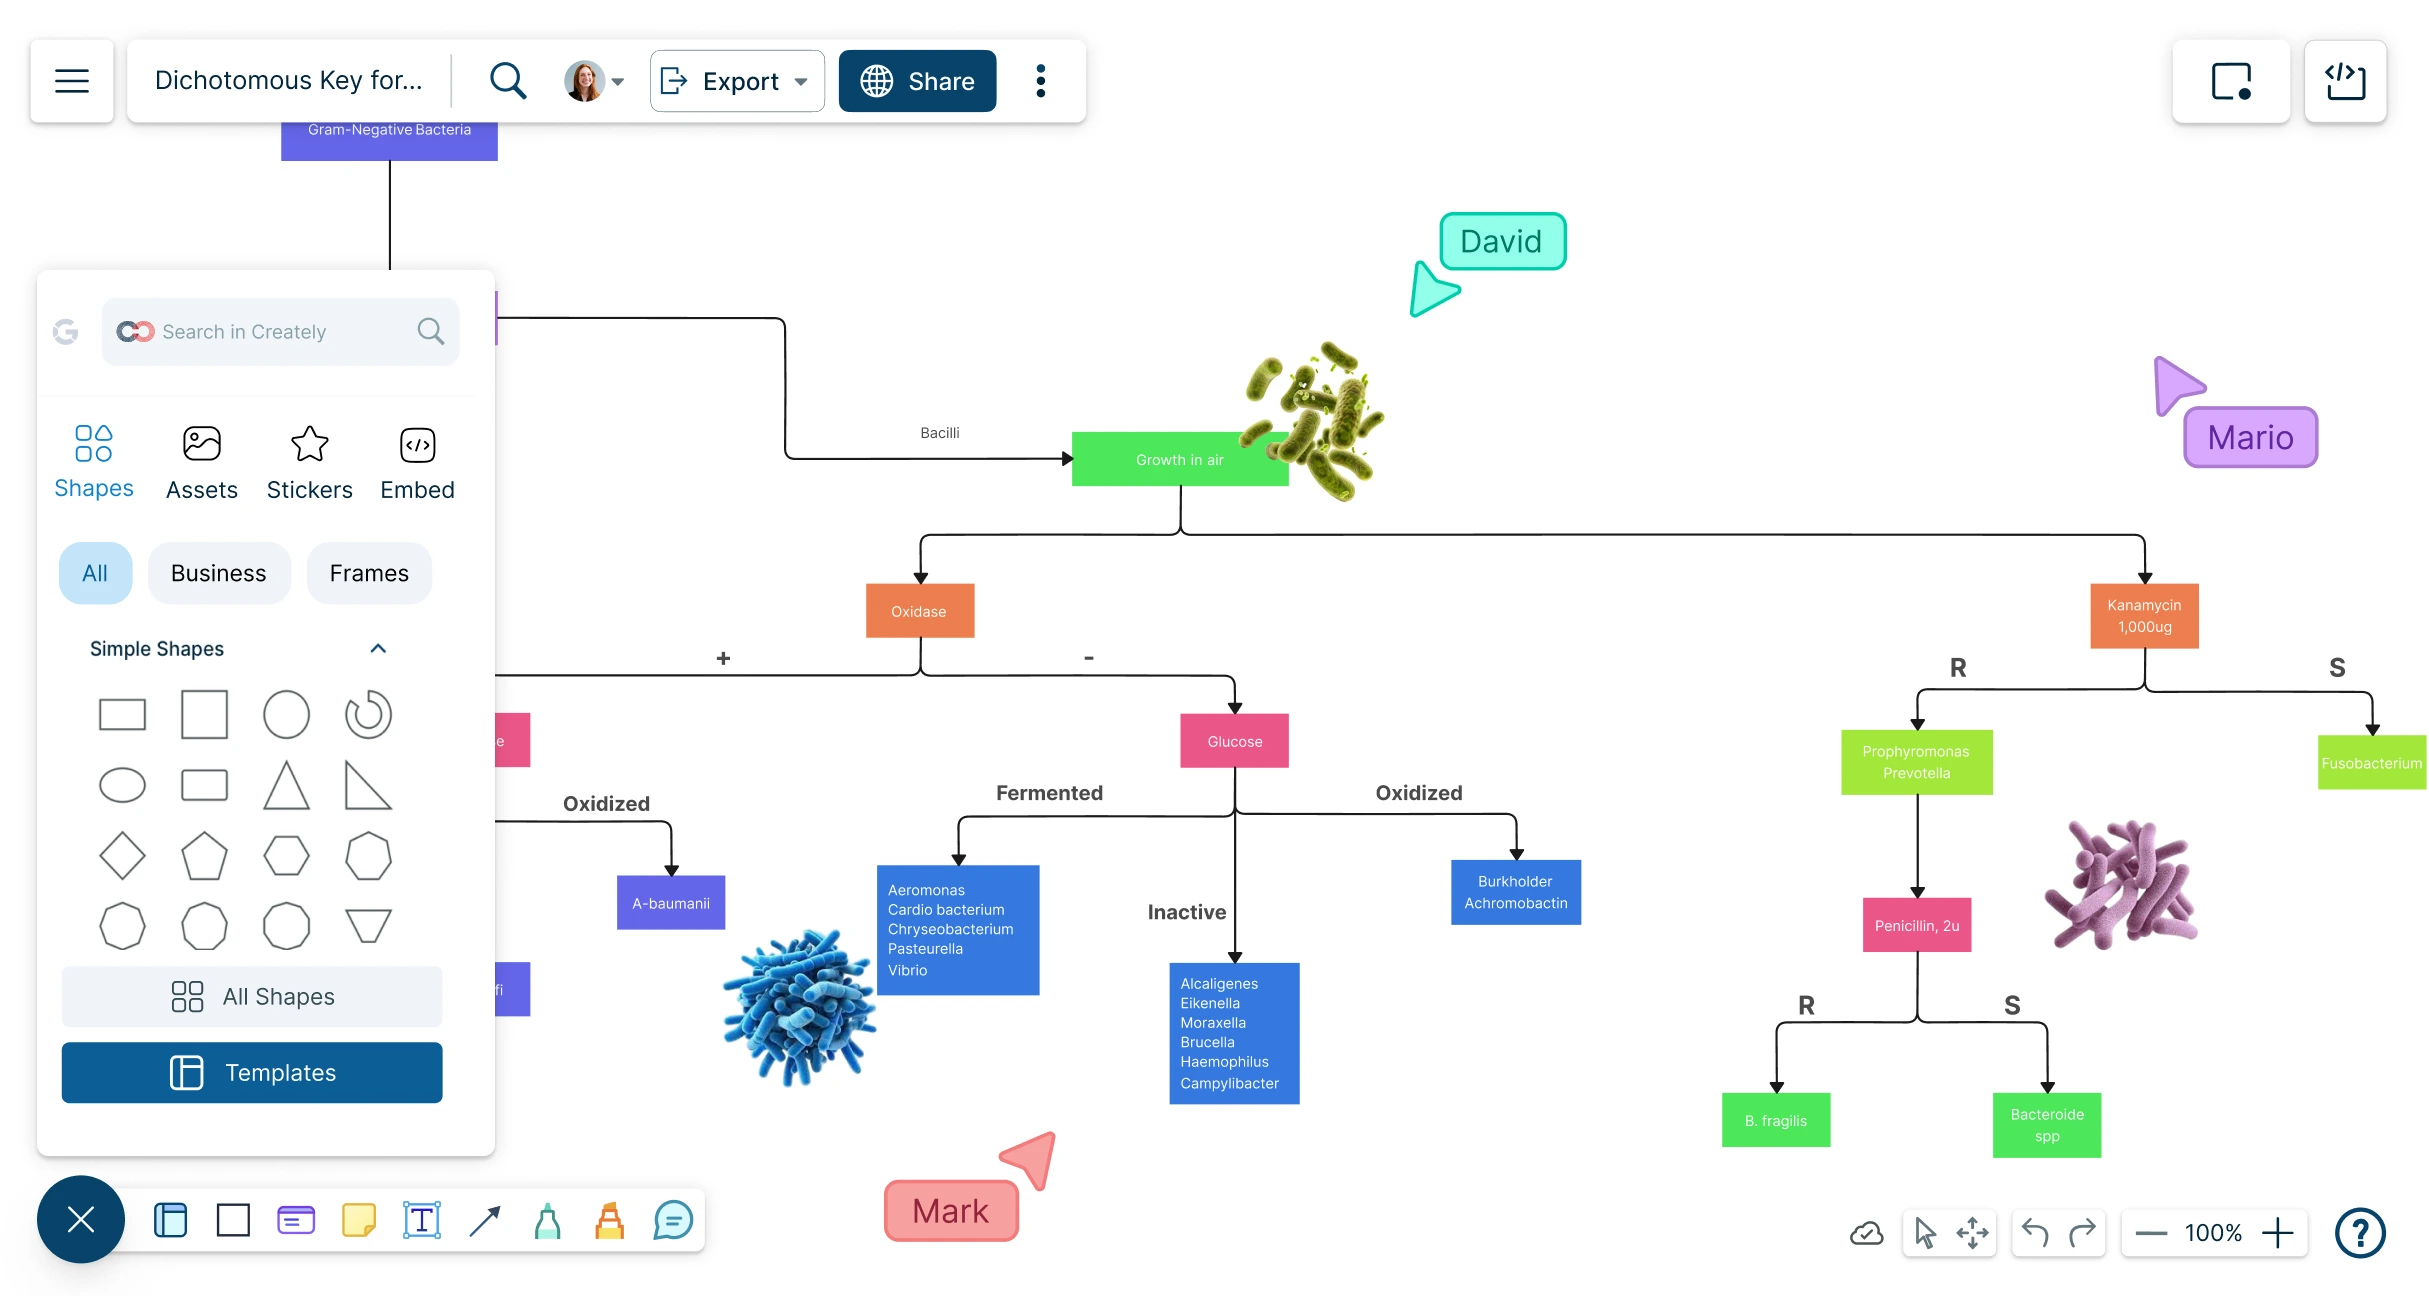
Visually organize large amounts of information to quickly identify, categorize, and analyze organisms.
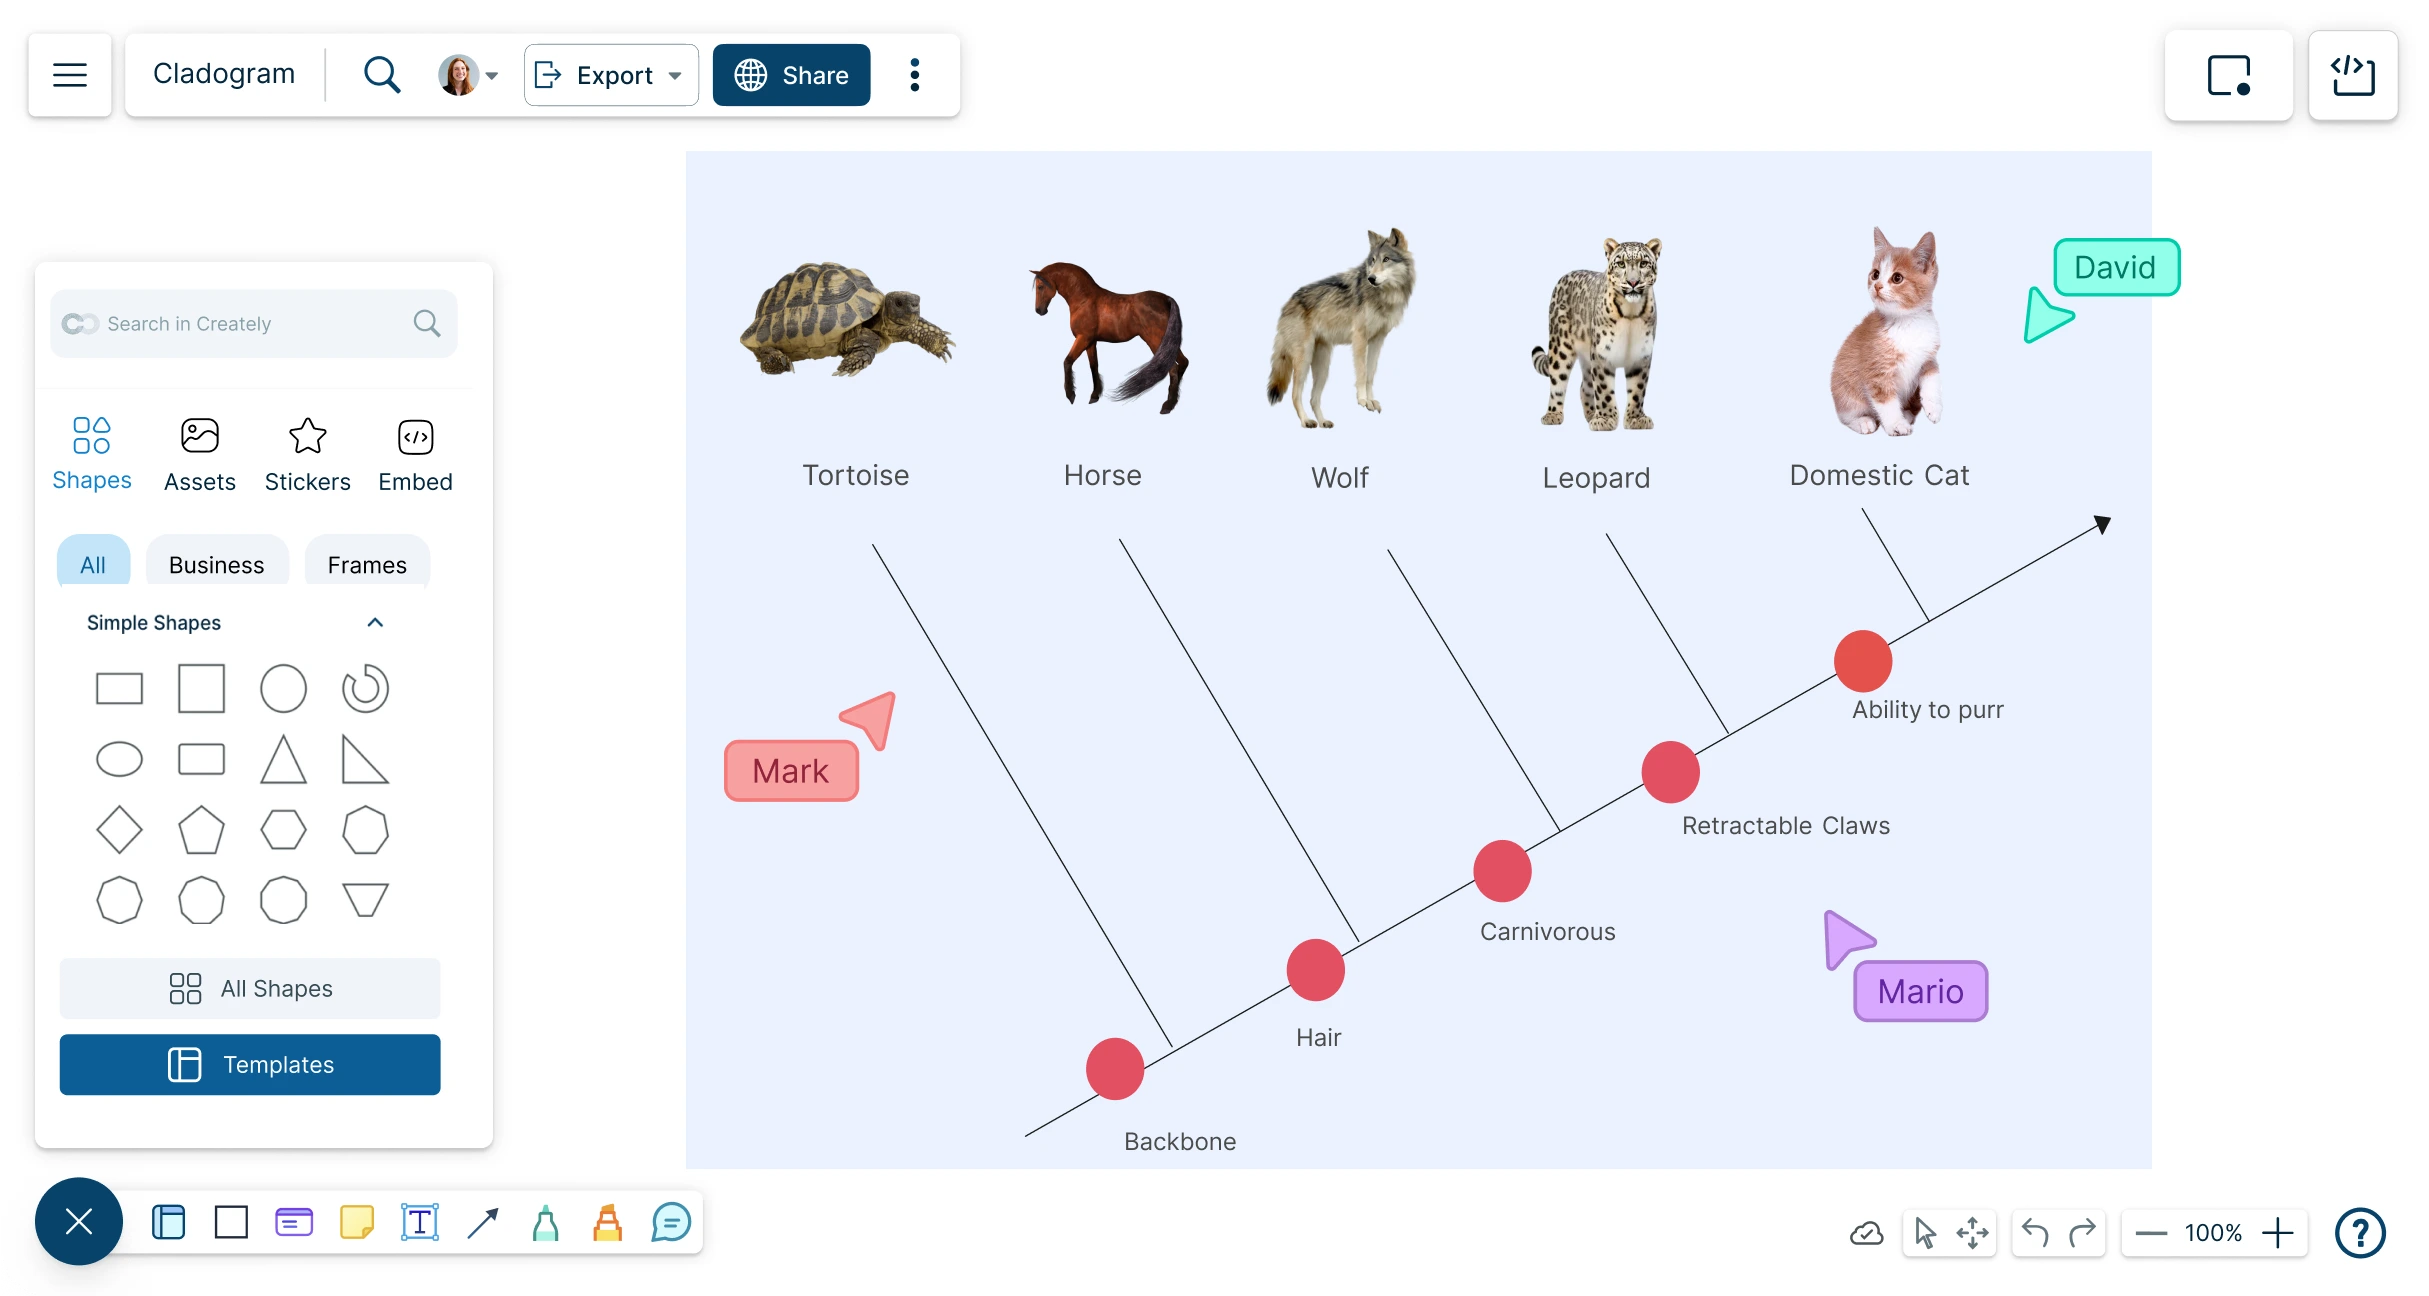
Make evolutionary relationships easier to explain by turning species, traits, and shared characteristics into a clean branching diagram. Ideal for biology assignments, classroom lessons, study materials, and research discussions.
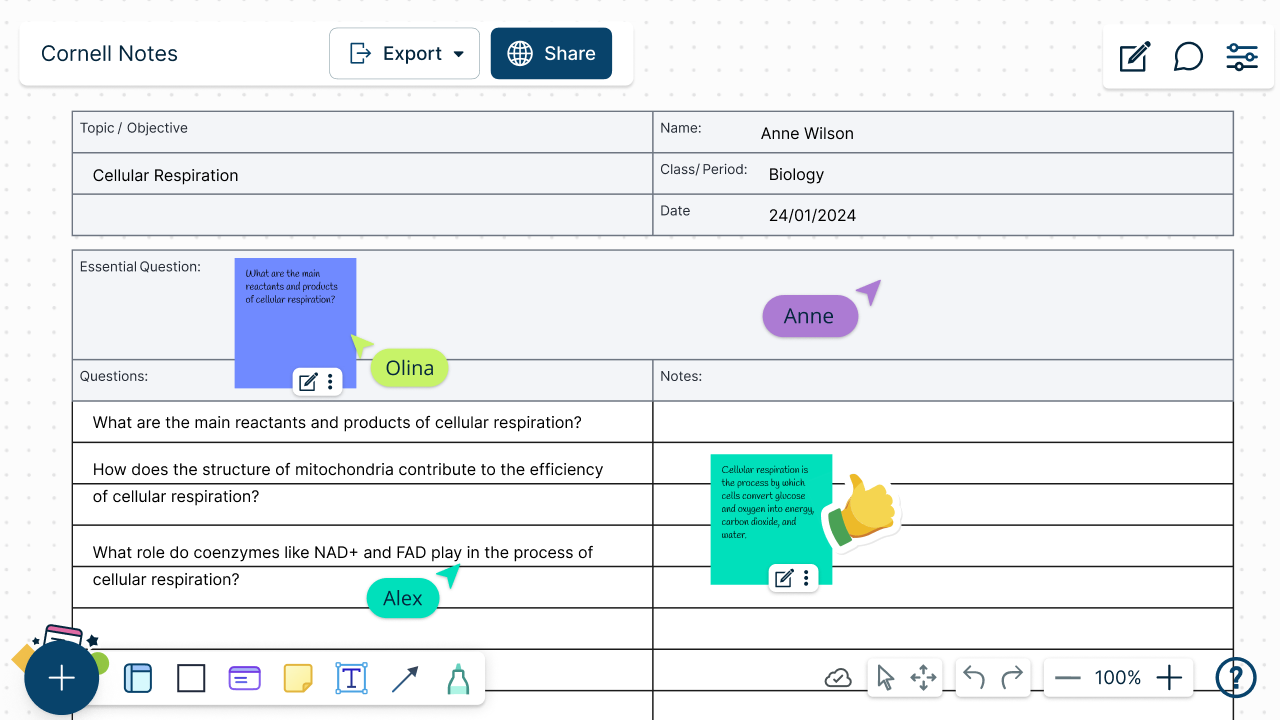
Use the Cornell notes template to supercharge your study routine. Organize your notes systematically, ensuring a more effective and streamlined learning experience.
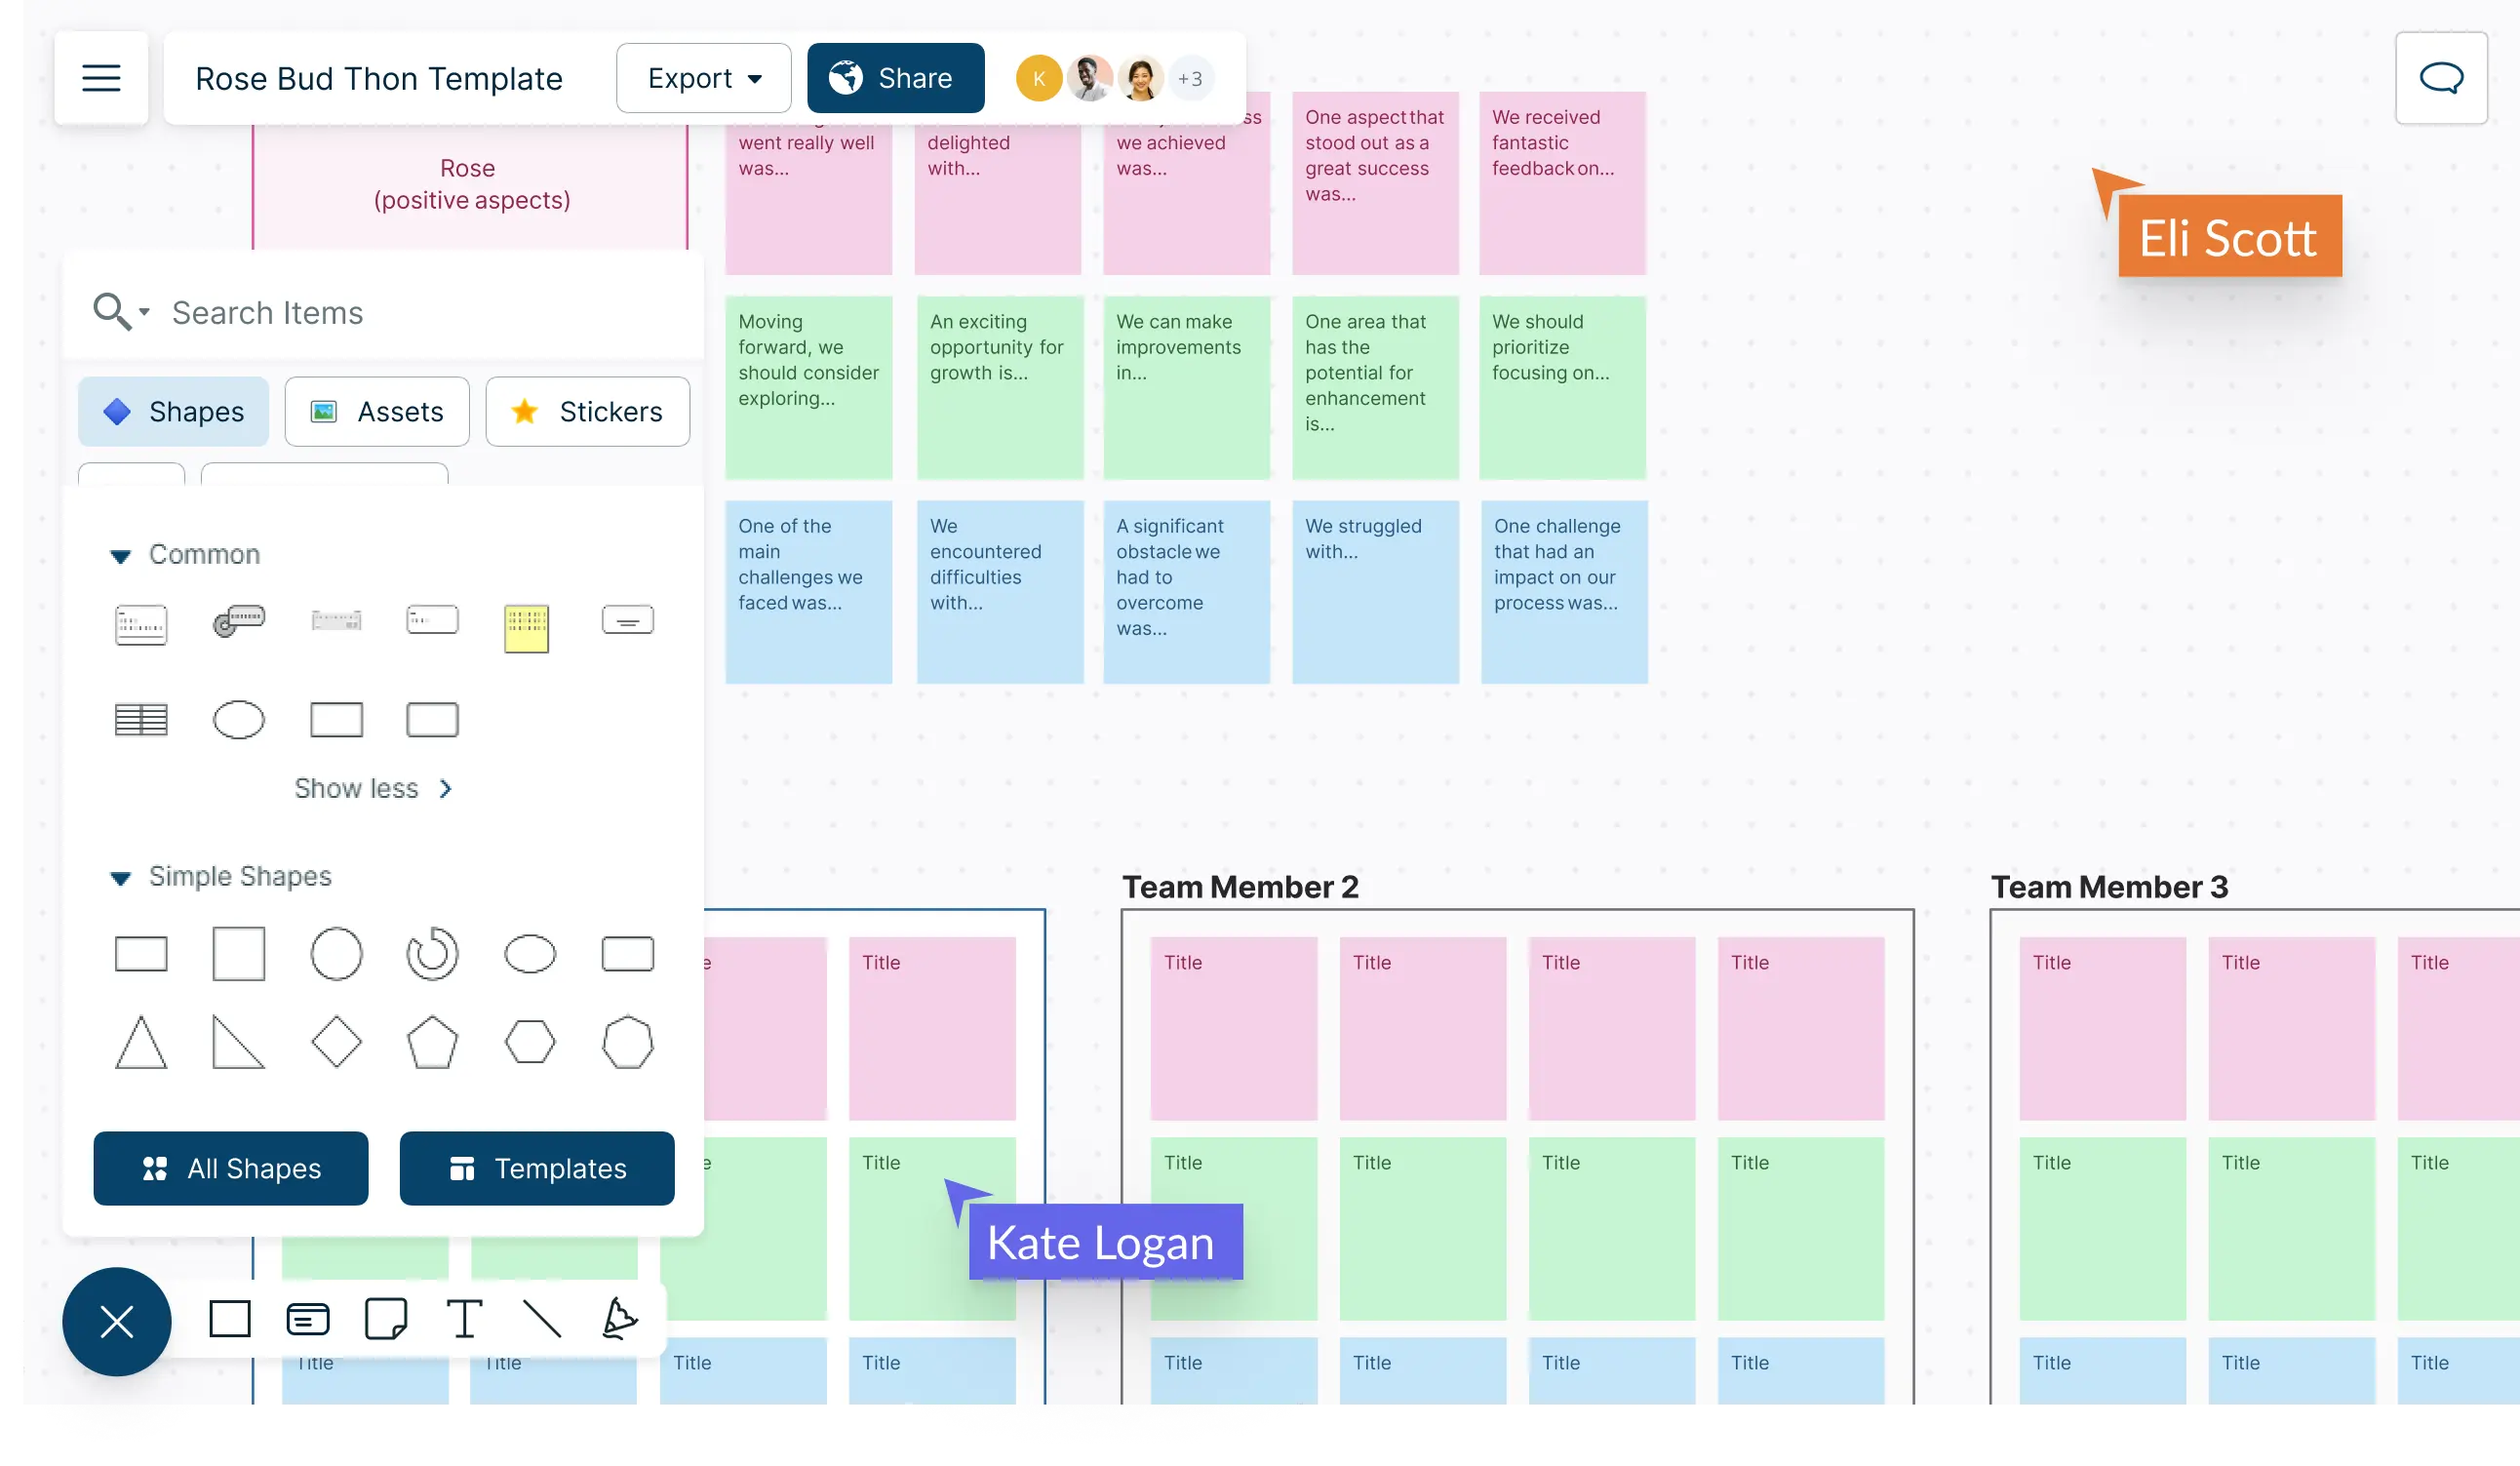
Collaborate visually with your team to understand the positives, negatives, and potentials of a specific project, problem or topic.
Visually map out ideas and collaborate with team members to organize and structure information, innovations and processes.
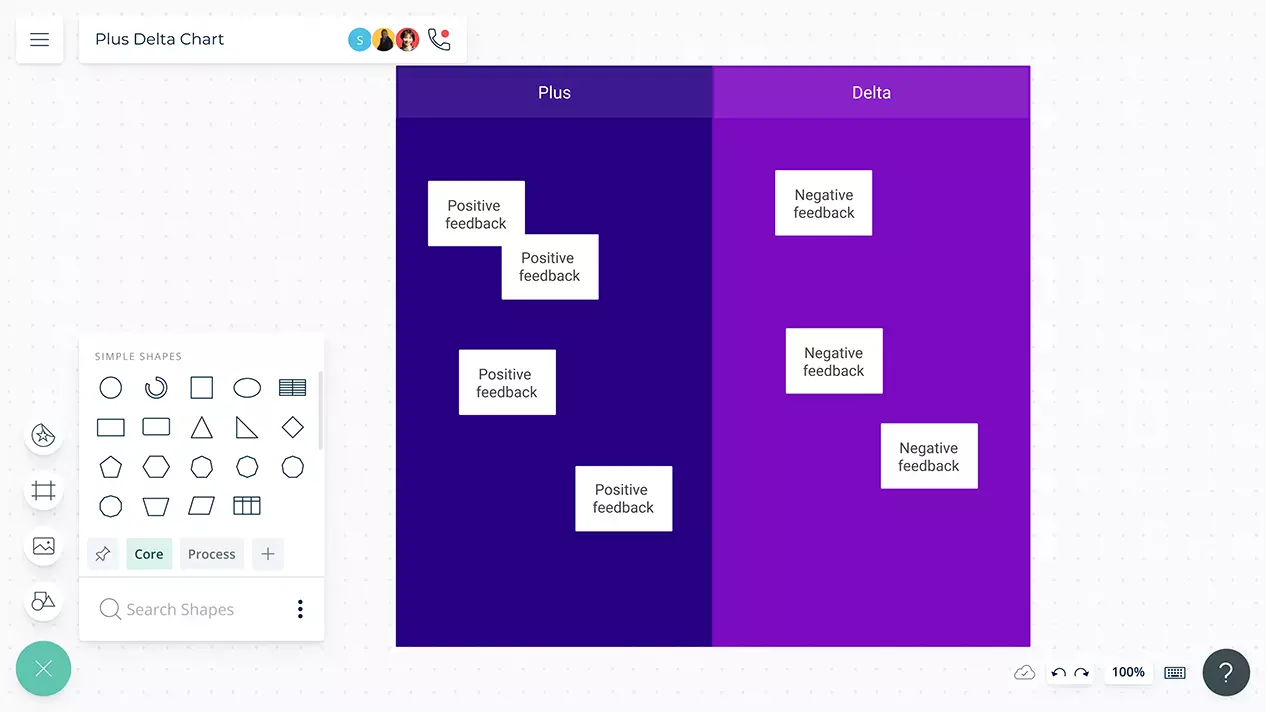
Enhance constructive criticism while continuously improving meetings and activities with your teams to boost organizational productivity.
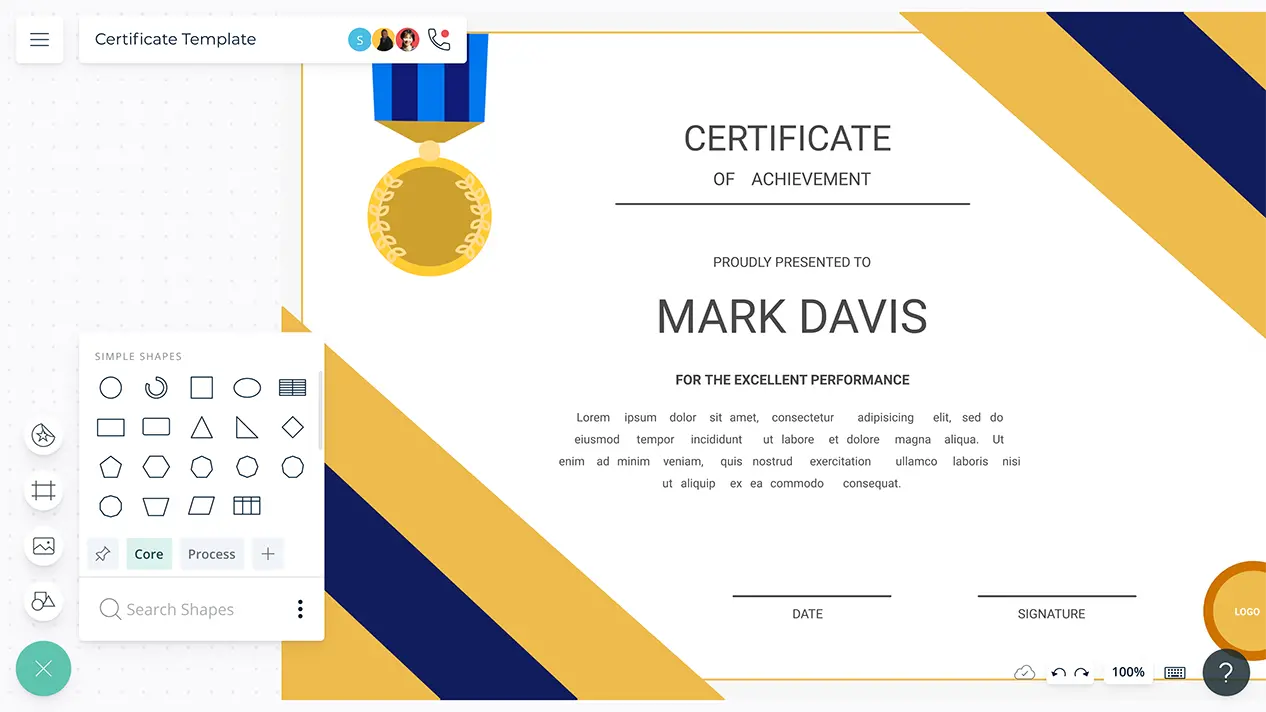
Create and edit certificates online for all your education and business purposes.
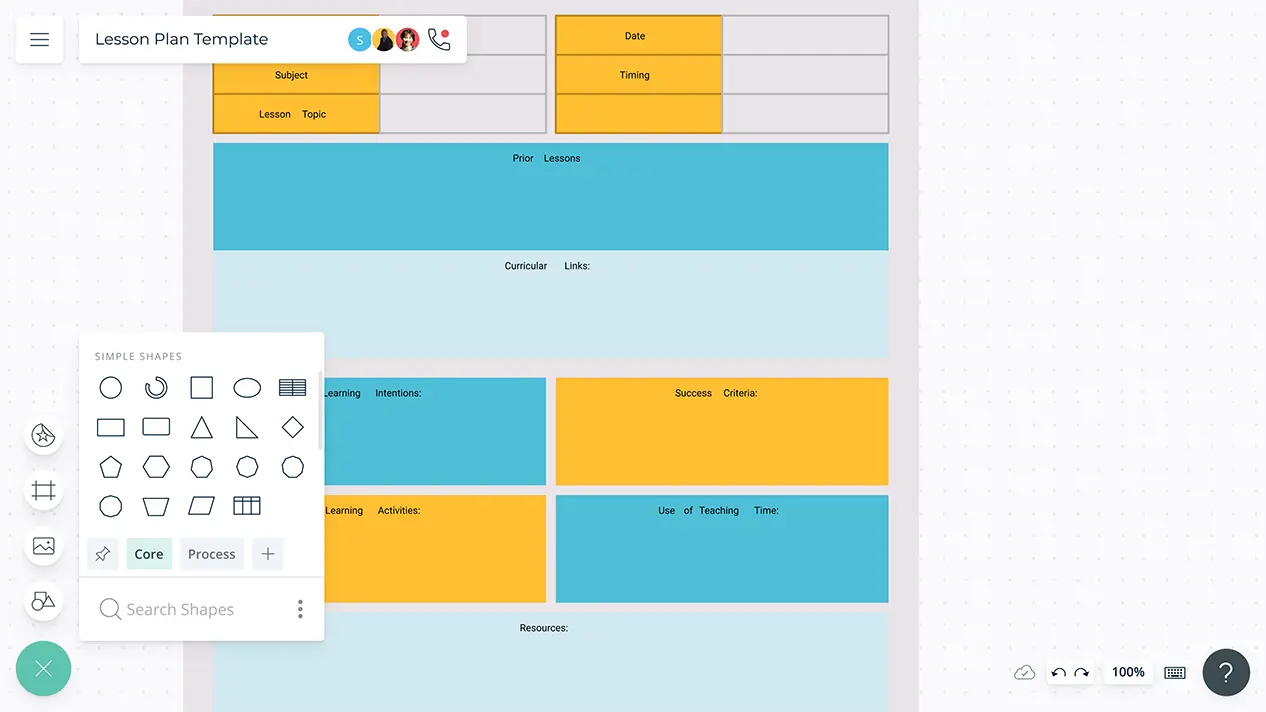
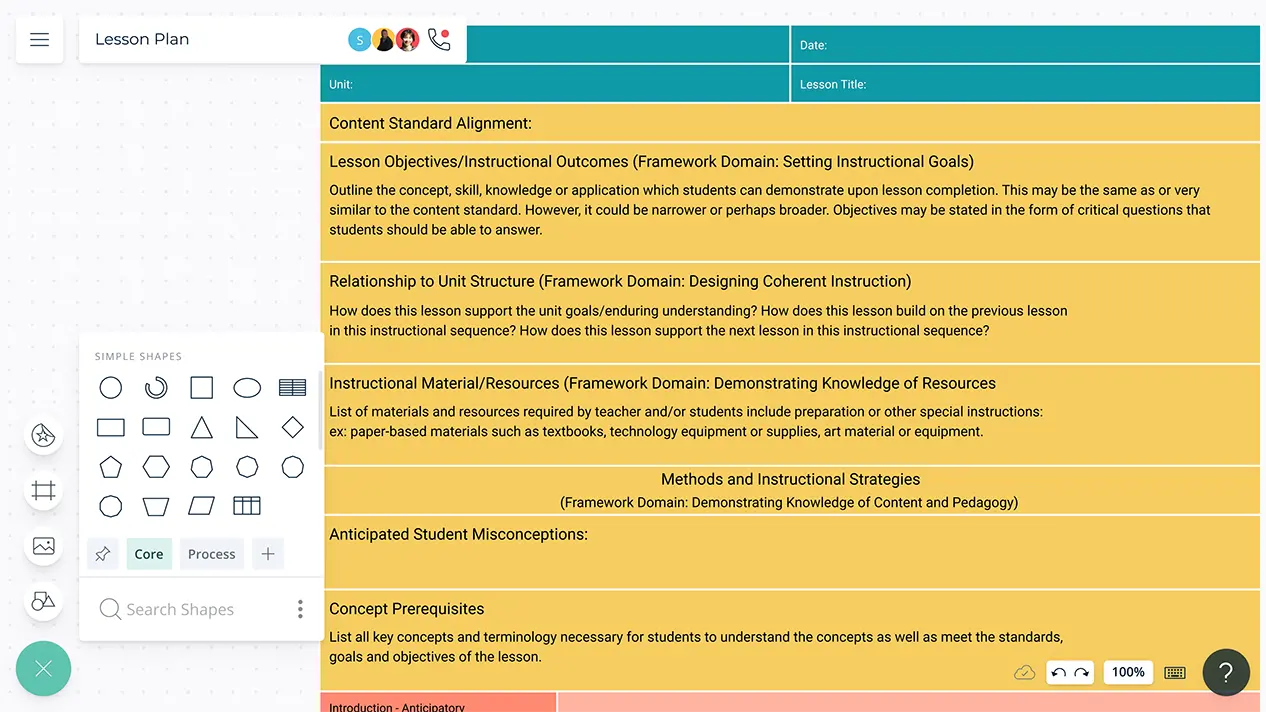
Easily clarify and simplify complex ideas, concepts, and lessons. Collaborate with colleagues and plan your lessons beforehand.
Work with students on improving their comprehension of complex information.
Effectively analyze the learning needs of students and systematically develop impactful learning experiences.
Simplify complex mathematical problems and describe concepts graphically in an easily consumable manner.
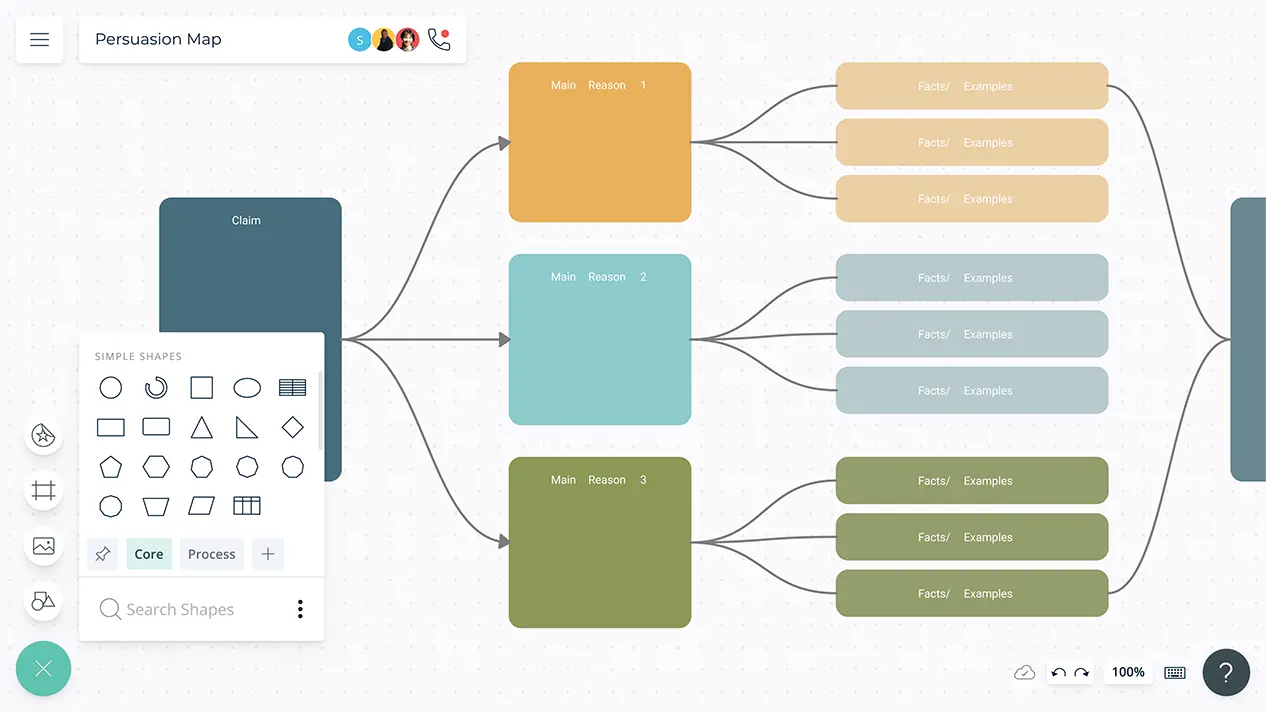
Visually map out your arguments for persuasive essays, debates or speeches.
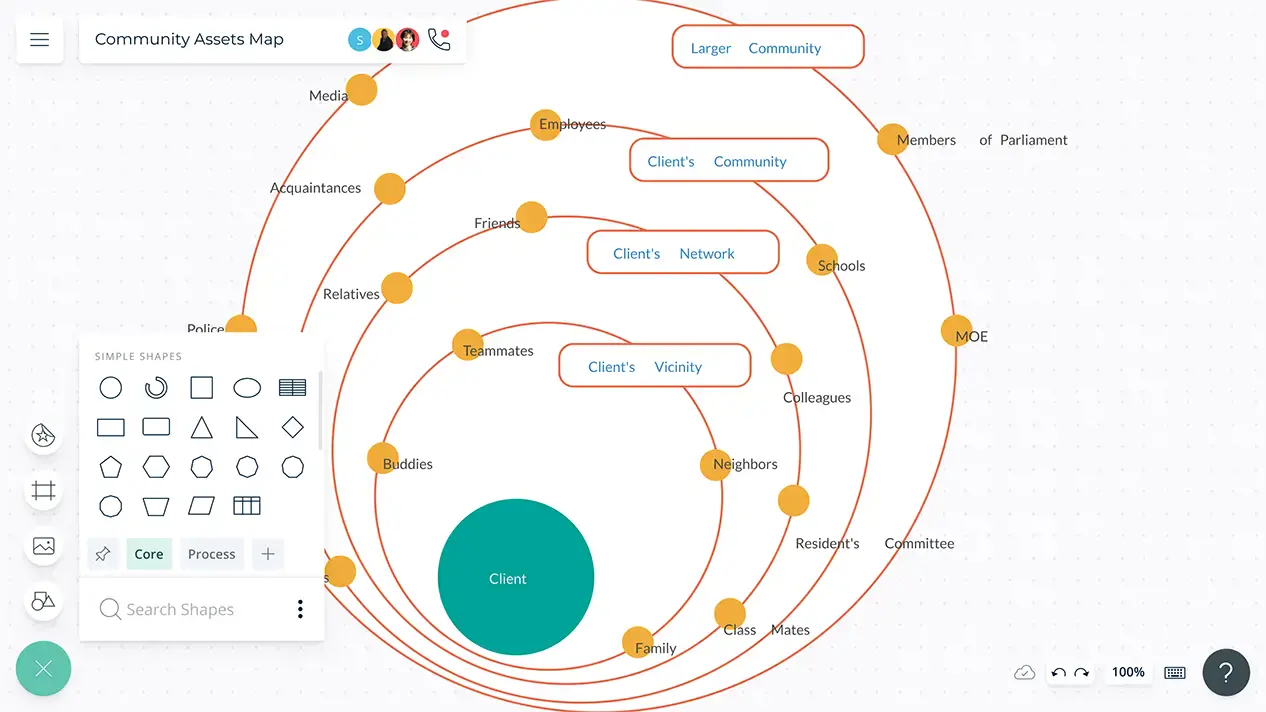
Visually depict the shared resources of a community and conduct a detailed analysis of how they are utilized.
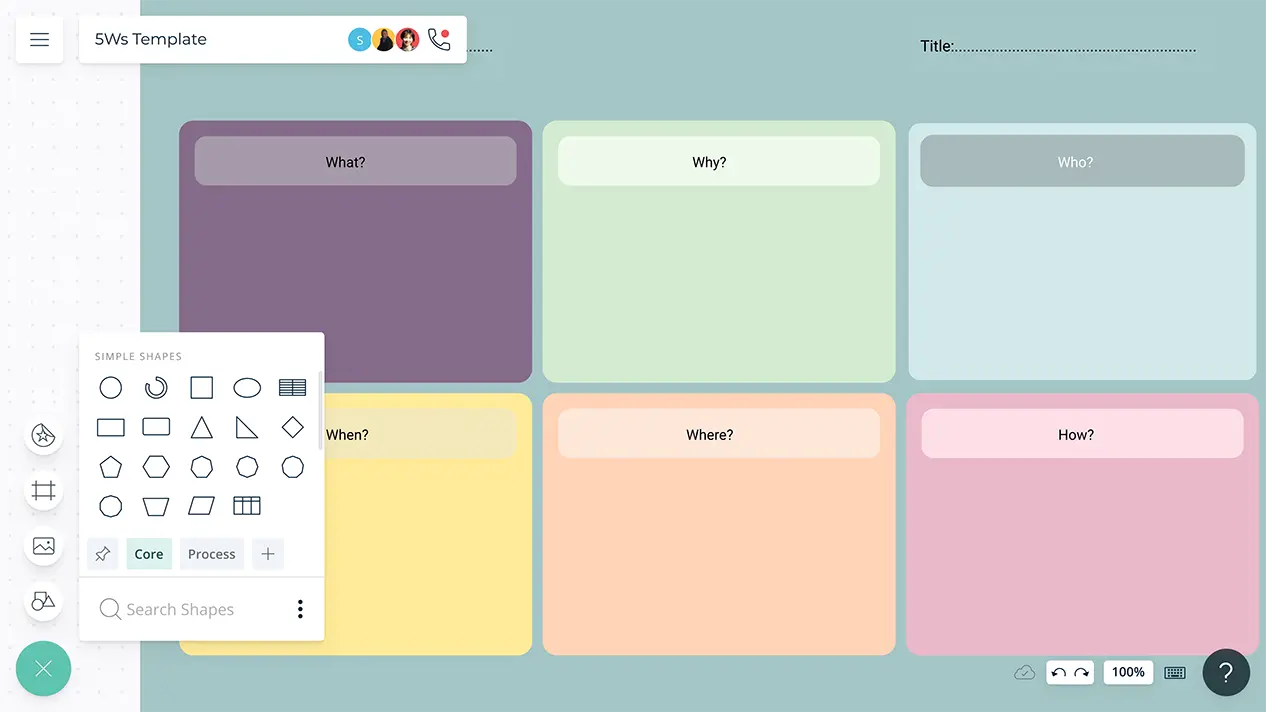
Fully understand your subject matter and write compelling narratives.
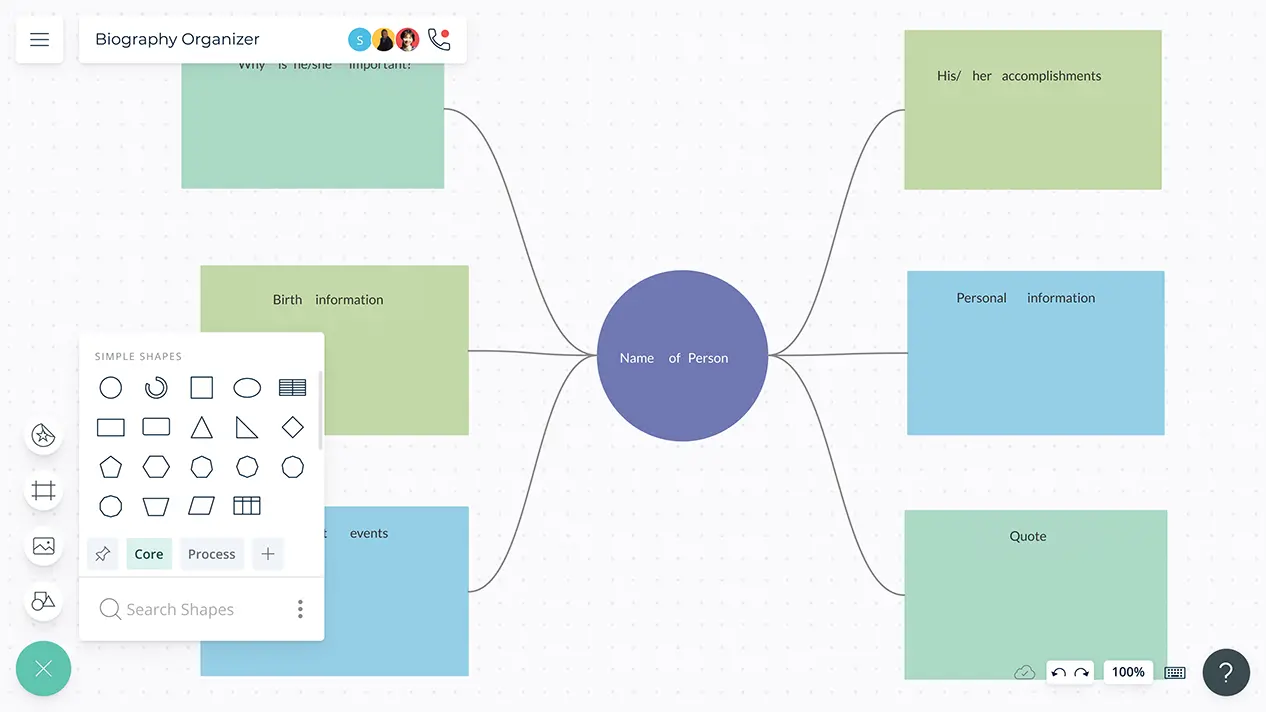
Visualize the biography of a person with information on their early life, adult life, interesting facts, family life and major accomplishments.
Design appropriate learning activities and develop teaching strategies to engage your students during lessons.
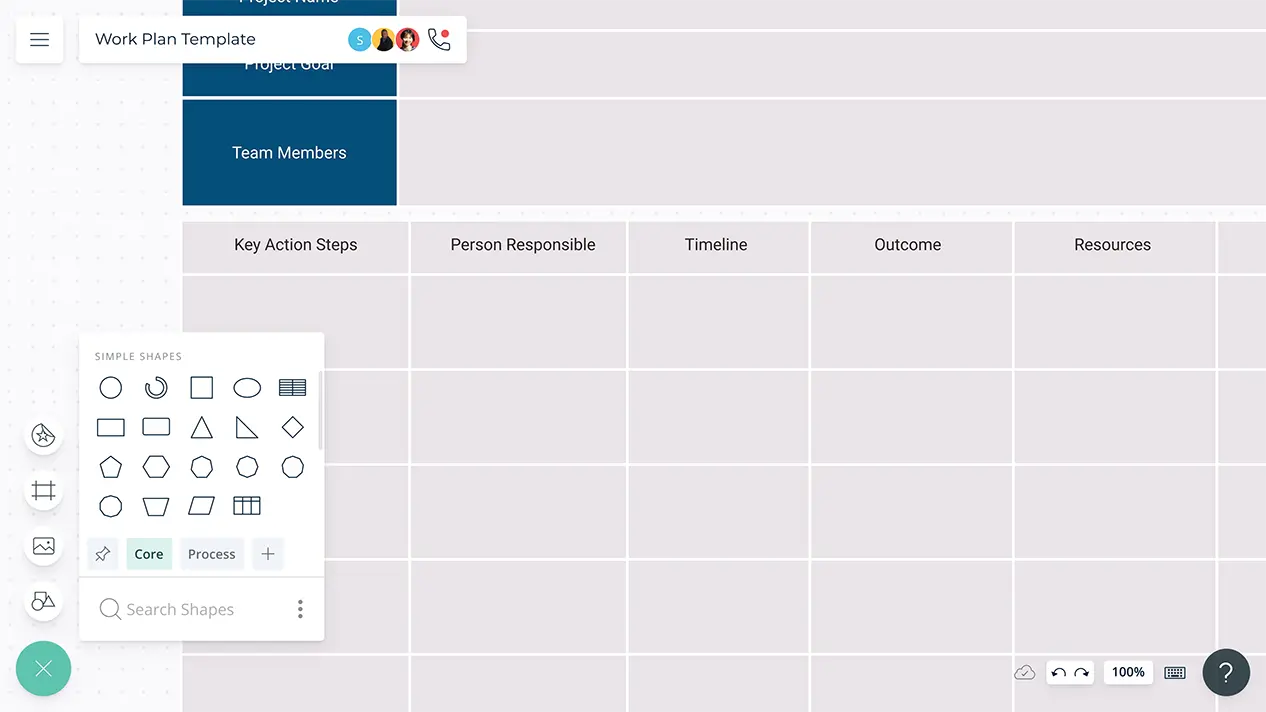
Visualize, organize, and manage your project goals, teams, tasks, and workflows in an easy-to-use visual platform designed for true team collaboration.
Create innovative & well-crafted course designs to generate positive outcomes on students’ learning experiences.