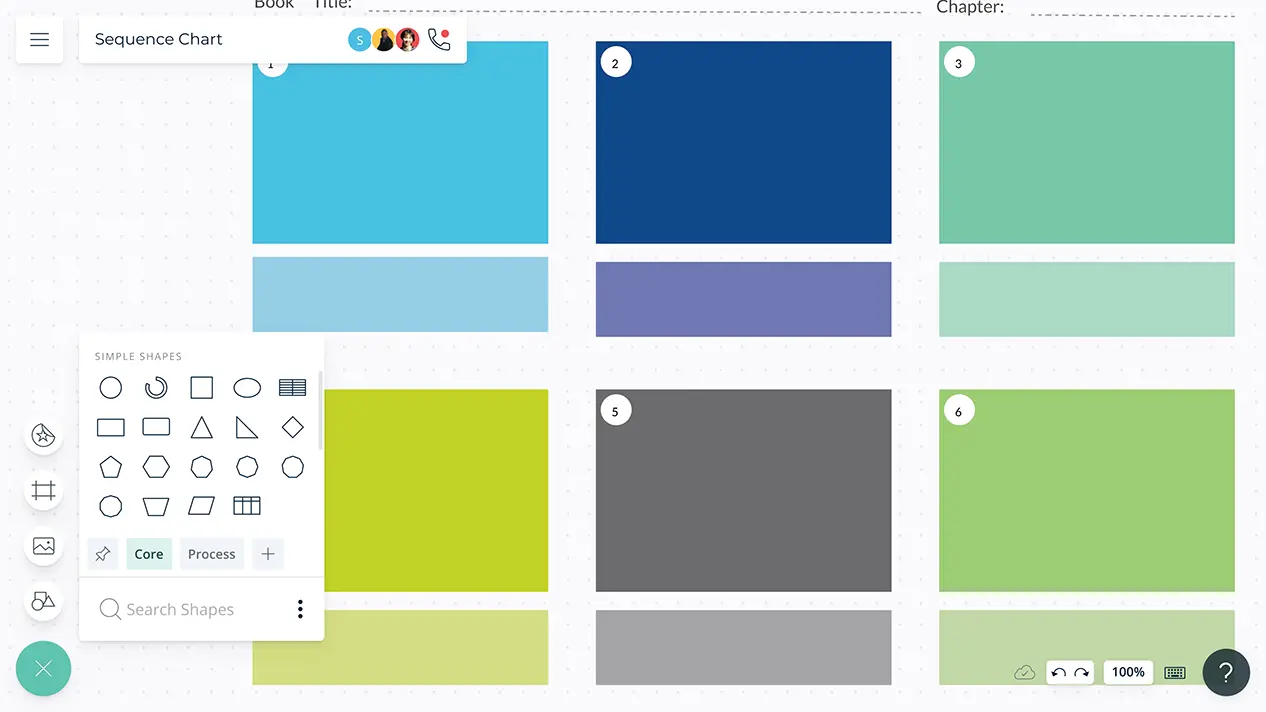
Sequence Charts
Easily Visualize the Sequence of Events
Work with students on improving their comprehension of complex information.
- 100s of premade graphic organizer templates to get a headstart
- Virtual whiteboard with freehand drawing to facilitate online teaching
- Real-time collaboration to work with students remotely

Easy Tools for Visualization
Multiple ready-made graphic organizer templates for reading comprehension and writing.
Simple to use drag and drop tools and Plus Create to quickly map out ideas, organize information, and visualize relationships during lessons.
Configurable color themes, advanced text formatting, and freehand drawing to customize your sequence chart according to any preferred theme.
Over 50 types of diagrams to visualize, analyze, classify, and organize information; T charts, dichotomous trees, Venn diagrams, KWL charts, concept maps, storyboards, & more.
Import or drag and drop images and icons to the canvas or use built-in Google image search to browse the internet for graphics to create dynamic sequence charts.
Collaborate with Students Remotely

Interactive online whiteboard with freehand drawing to conduct collaborative brainstorming sessions and facilitate classroom discussions.
Video conferencing baked into the platform to feel like you are in the same classroom while engaging with students.
Real-time cursors for any number of participants. Collaborate with students on a shared canvas during lessons.
Comment with context. Full comment threads and discussions for async collaboration to streamline giving students feedback or obtaining feedback from them.
Multiple access and role levels to streamline sharing, reviewing, and editing graphic organizers with students or colleagues.

Create Effective Learning Material
Built-in presentation tools to instantly arrange visuals and information on the canvas and create interactive presentations and graphic organizers.
Insert documents and assets with in-app previews to provide more context to the graphic organizers and create resourceful instructional material.
Embed your sequence chart in any site, or in Google docs, sheets, or slides, and Powerpoint presentations.
Export your sequence graphic organizers as SVGs, PDFs, and PNGs to publish, present, print, and share.
Infinite canvas that scales up to 1000s of items in a single view to create a central repository of resources, learning material, instructions, and assignments.
What Is a Sequence Chart?
Sequence chart or sequence graphic organizer is a tool that helps graphically represent the order of steps in a process, a timeline of events, etc. It can also be used to plan lessons or to take down notes during a lesson.
How to Create a Sequence Chart?
- Identify the steps of the process or event. Brainstorm all the steps that could possibly be involved. Include your students in the session.
- Examine the steps and arrange them in a sequential order. You can use a Creately sequence chart or graphic organizer to quickly organize them in a visually appealing way.
- Using an Edit link, you can allow students to participate in the activity as well. Any change they make will be applied to the diagram in real-time.
- Or you can add comments on certain shapes to share your view or opinion right on the diagram as well.
- As you prefer, you can add images to your sequence chart to make it more visually appealing using the image import option or built-in Google image search.
- If you want to take a print out, export the sequence chart as a PDF or as an image to include it in PowerPoint presentations or Word documents.