Math Diagram Maker
Visualize Complex Math, Simplify Understanding
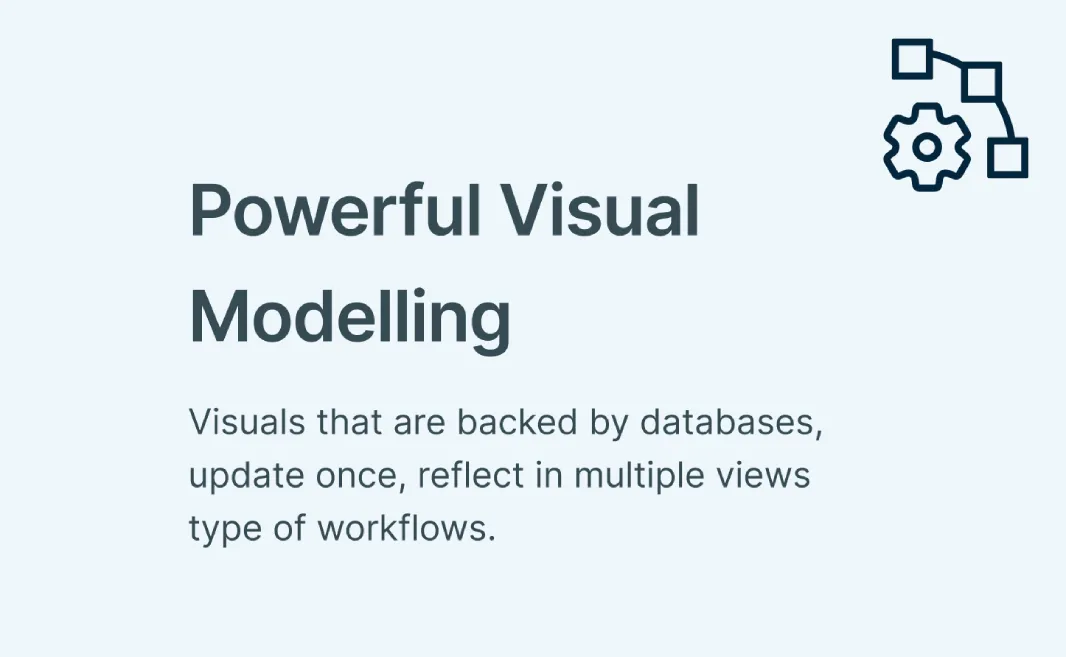
Bring math concepts to life with intuitive, interactive diagrams. From algebra and geometry to vectors and formulas, Creately’s math diagram creator helps you turn abstract ideas into clear, visual presentations that are easy to analyze, share, and solve together.
- Drag-and-drop math diagram tools with over 1,000 shapes and templates
- Real-time collaboration with in-line comments, and multi-cursor editing
- Presentation mode, notes, and export options to share insights seamlessly
Over 10 Million people and 1000s of teams already use Creately

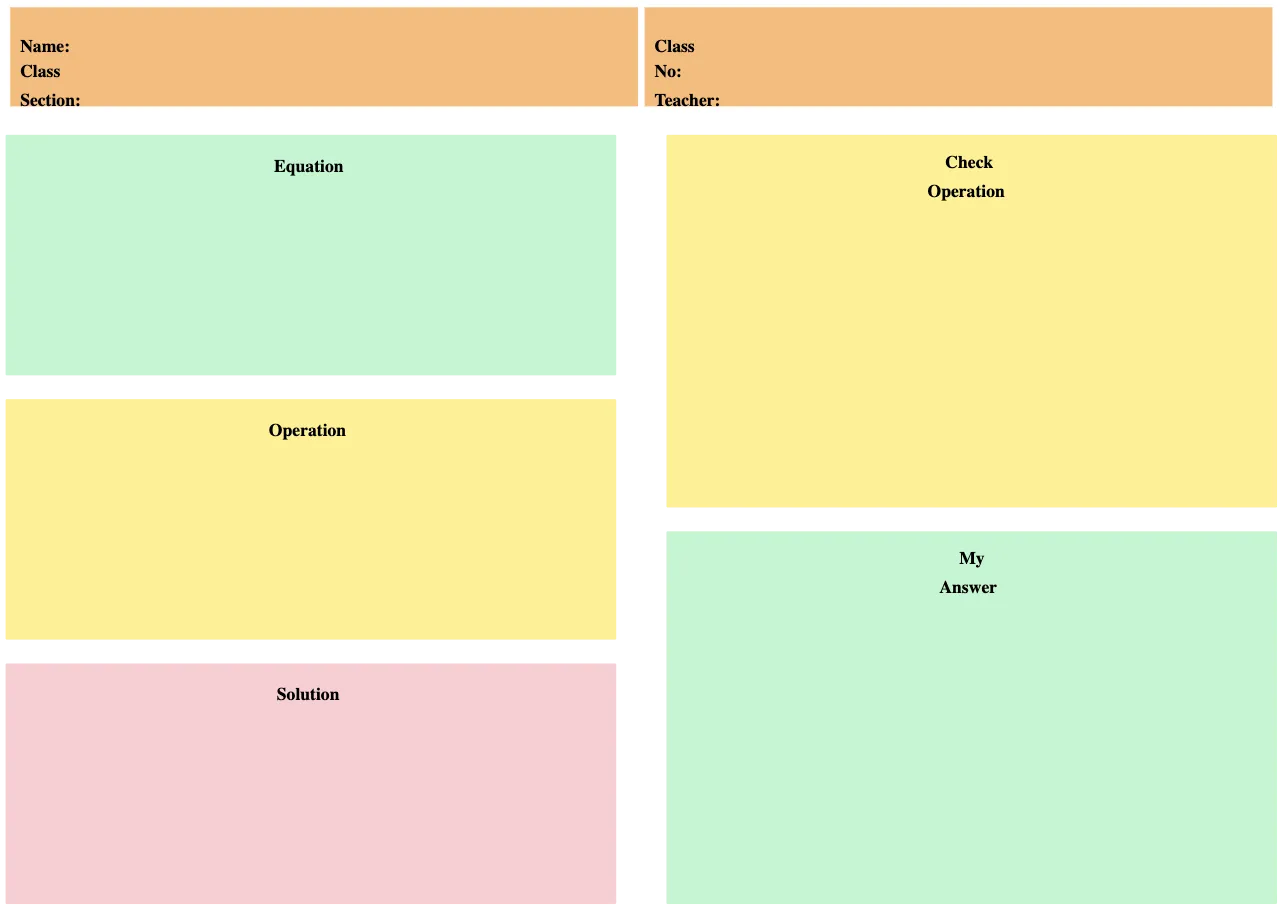
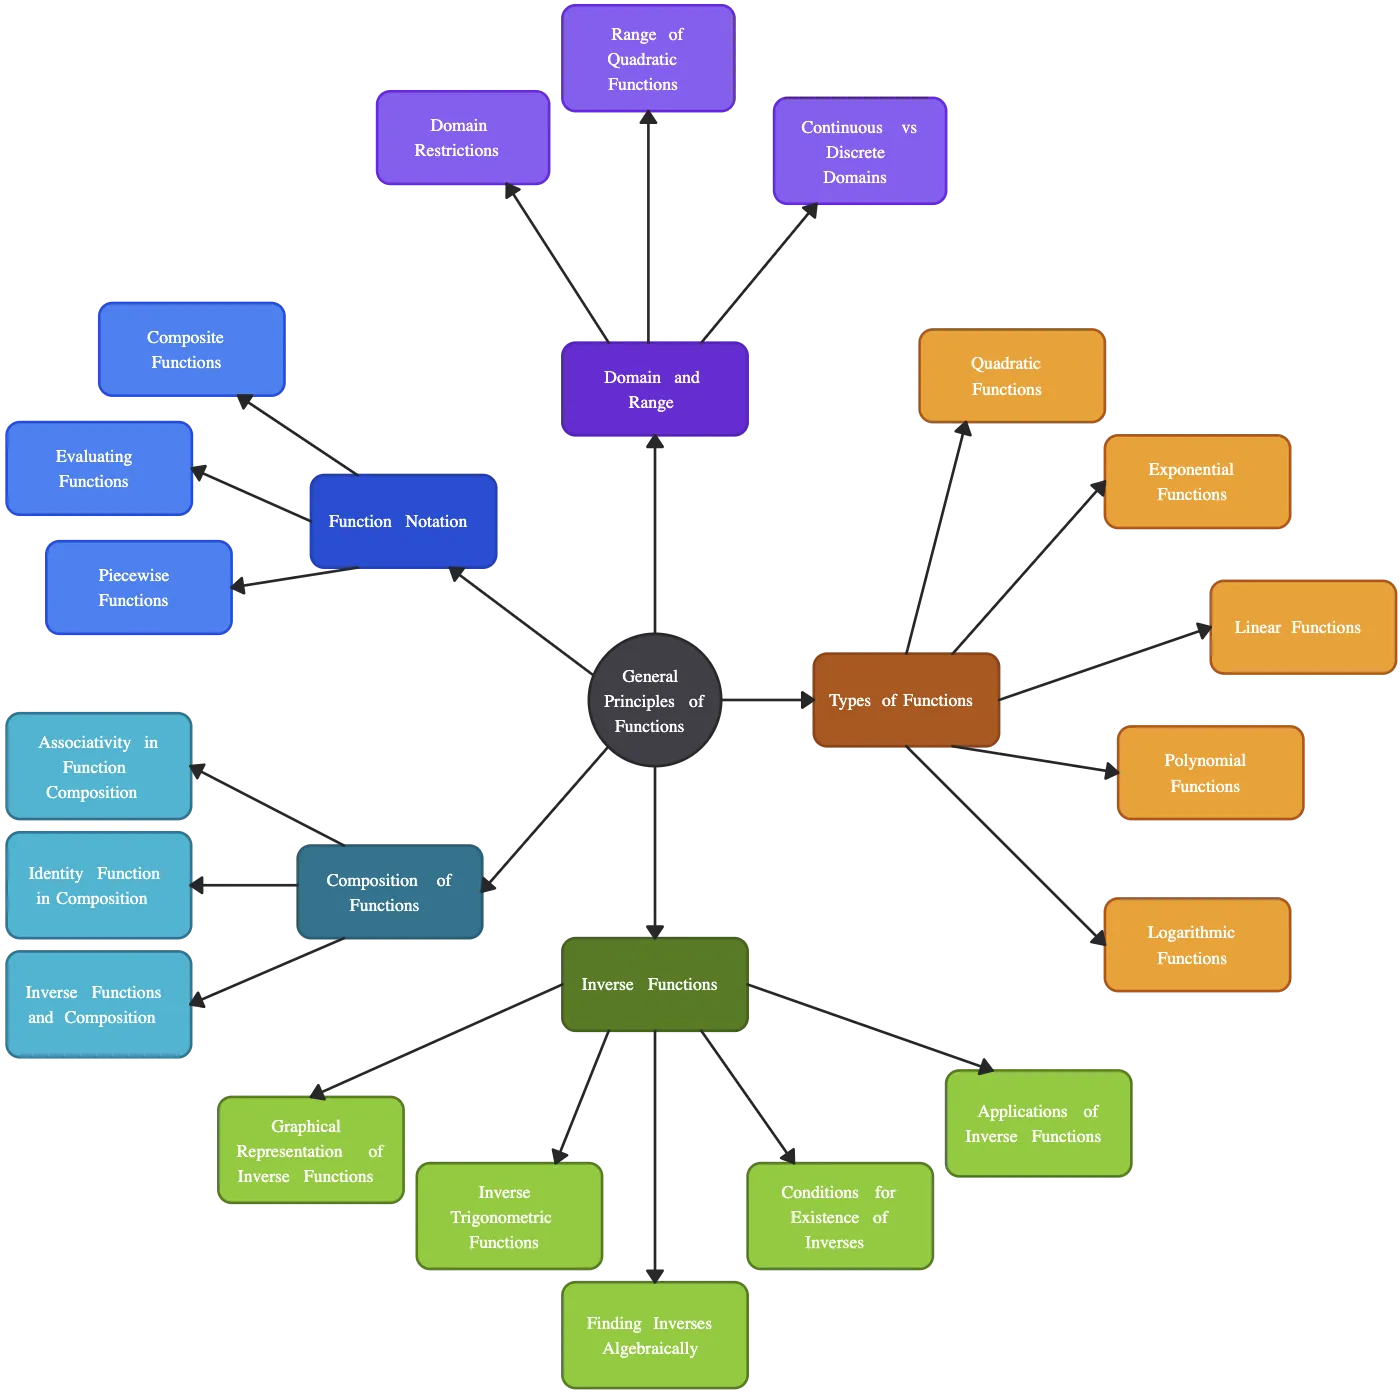
Free Math Diagram Templates to Get Started

Expand Your Analytical Thinking and Reasoning

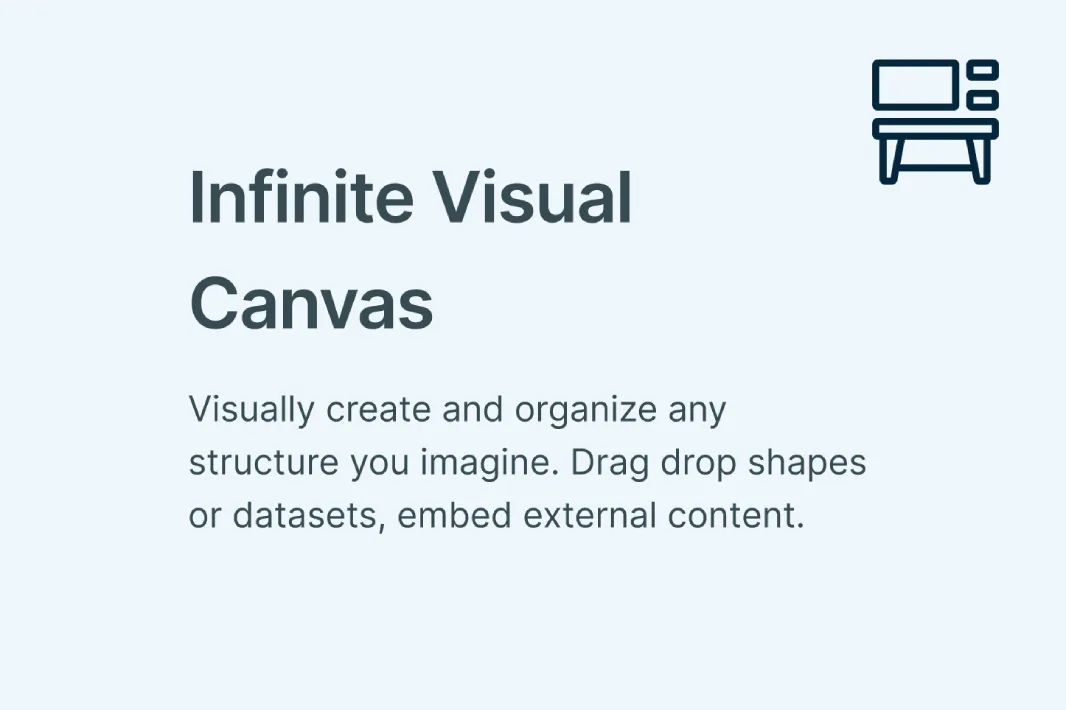
Brainstorm, outline, and connect ideas in a single infinite canvas. Creately gives you whiteboarding tools to freely illustrate and solve problems, whether you’re sketching equations, formulas, or geometric relationships. Import data from CSV, Excel, or Google Sheets to map out and analyze information effortlessly.

Turn Complex Math into Clear, Understandable Visuals
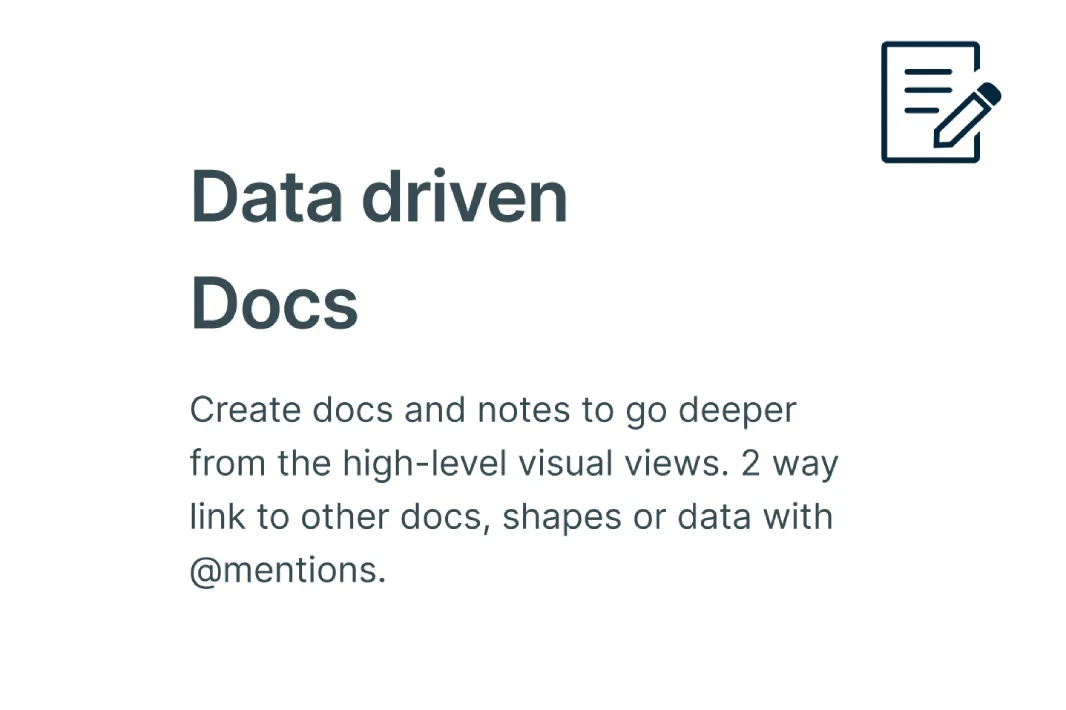
With smart formatting, preset color themes, and over 50 diagram types, you can create everything from basic charts to advanced logic or geometric diagrams. Use purpose-built controls to highlight relationships, interpret data, and structure your reasoning in ways that make sense at a glance. Notes and annotations help capture your thought process for later reference.
Work Together in Real-Time, Wherever You Are

Invite peers to brainstorm, solve, and refine maths diagrams together. Multi-cursor editing and multiplayer features let everyone contribute simultaneously, while inline comments and Creately’s Microsoft Teams plugin help keep communication seamless. Share your math diagrams instantly or export as PNG, JPEG, PDF, or SVG for presentations or printing.

Present, Share, and Take Your Ideas Further
Bring your diagrams to life in presentation mode and guide your audience through complex concepts with confidence. Use freehand tools to illustrate unique solutions, extend your diagrams as problems evolve, and integrate them into lessons, reports, or research effortlessly. Creately makes turning ideas into actionable insights simple and visually compelling.
What Is a Math Diagram?

How to Create a Math Diagram?
Start with a Template or Blank Canvas:
Open Creately and choose from hundreds of math diagram templates or start with a blank canvas. Templates save time for common diagrams like vectors, functions, or geometric shapes, while a blank canvas gives you full flexibility to design from scratch.Add Shapes, Symbols, and Diagrams:
Drag and drop shapes, lines, and math symbols from the extensive library. Use purpose-built math tools to represent numbers, formulas, vectors, graphs, or geometric constructions with precision.Organize and Connect Your Ideas:
Use smart formatting, color themes, and connectors to structure your diagram. Group related elements, label them clearly, and highlight relationships to make complex concepts easier to understand. Notes and annotations can capture extra explanations alongside your visuals.Collaborate in Real-Time:
Invite teammates, classmates, or teachers to work together. Multi-cursor editing, in-line comments, and in-app video chat let everyone contribute, ask questions, and refine the diagram instantly.Present, Export, or Share Your Diagram:
Switch to presentation mode to guide viewers through your math concepts. Or export your diagram as PNG, JPEG, PDF, or SVG for reports, assignments, or sharing online. You can also keep updating the diagram as your problem-solving or analysis evolves.
Ready-to-Use Math Diagram Examples

FAQs About the Math Diagram Drawer
What are Creately’s math diagram maker pricing plans?
- Free Plan — $0/month for basic math diagram creation and collaboration
- Starter & Team Plans — $8/month or $5/month billed annually
- Business Plan — $149/month or $89/month billed annually
Annual billing helps you save more while unlocking advanced collaboration, workspace management, and enhanced math diagram features. You can compare all available plans and features on the Creately Pricing Page.
How can you create math diagrams faster?
Are there templates for different math diagram use cases?
Can teams collaborate on math diagrams?
Can I add notes, data, and files?
Can I share, present, or export math diagrams?