Decision Tree Diagram Maker
Empower Smart Decision-Making
Creately is a powerful diagramming tool that transforms the way you create decision tree diagrams. With its user-friendly interface, customizable shapes, and seamless data import capabilities, designing decision tree diagrams have never been easier. Collaborate in real-time, integrate with popular apps, and visualize your decisions from anywhere using decision tree diagram maker.
- Customizable decision tree diagram templates
- Real-time visual collaboration, bring your team onboard
- Extensive graphic asset libraries for decision tree diagrams
How to make a Decision Tree Diagram?
Easily Evaluate the Pros and Cons of Every Choice
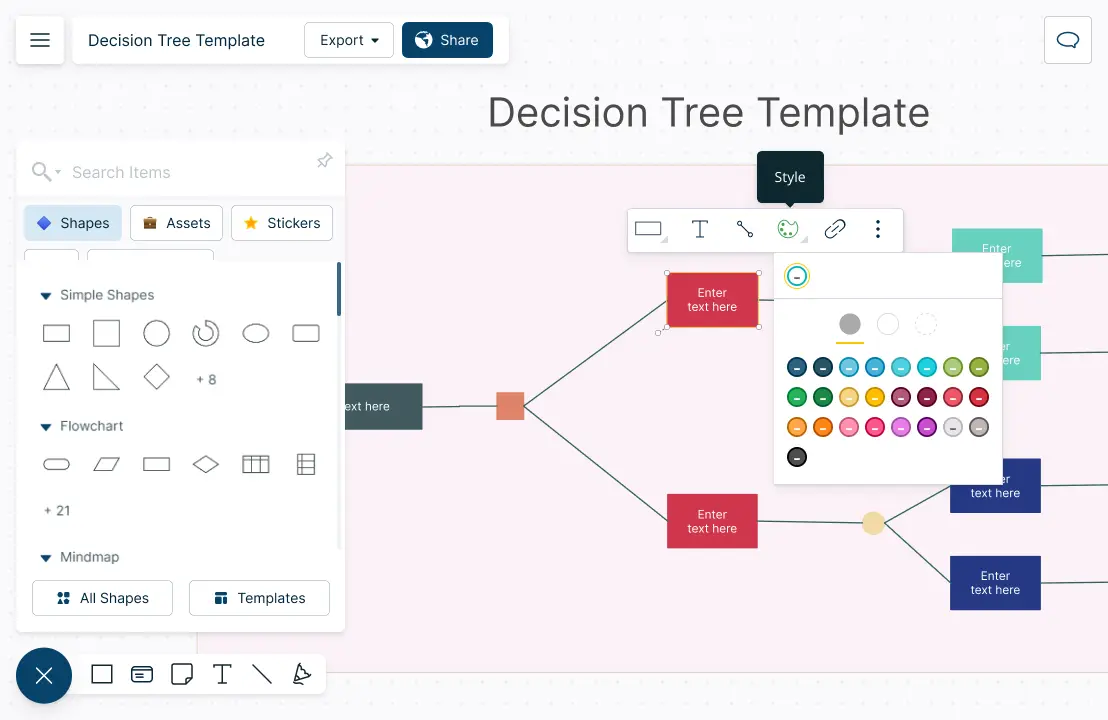
Customizable decision tree diagram templates to evaluate pros and cons of a decision.
Simple to use drag and drop tools to support intelligent drawing diagram and quick editing.
Purpose designed diagram tools to enable super smooth process creation.
10,000+ professional shape library and customizable color palettes to organize data.


Make Smart Decisions Together

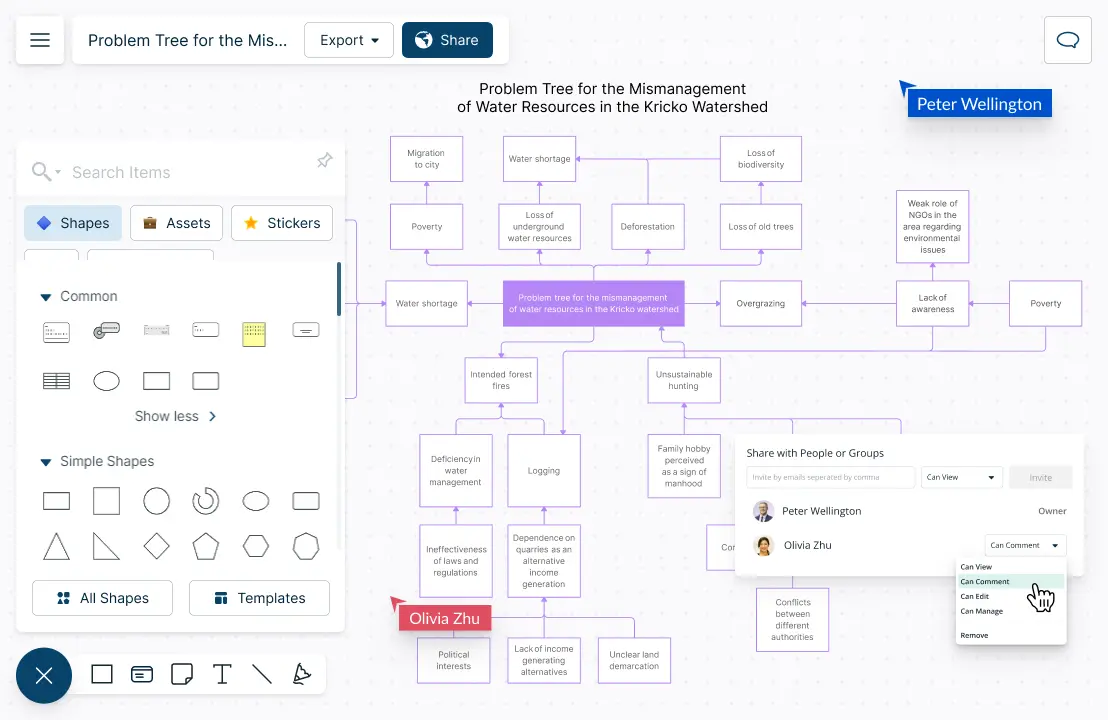
Real-time cursors for any number of participants to collaborate on a shared canvas.
Comment with context, have discussions and follow-ups on the same canvas. Async!
Embed the decision tree diagram in any site or intranet or share via an email or link invite.
Version history to save and revert back to each iteration to review and revise.
Integrate Different Data Sources to Your Decision Tree Diagram
Import data from Excel, spreadsheet or CSV to centralize all your information.
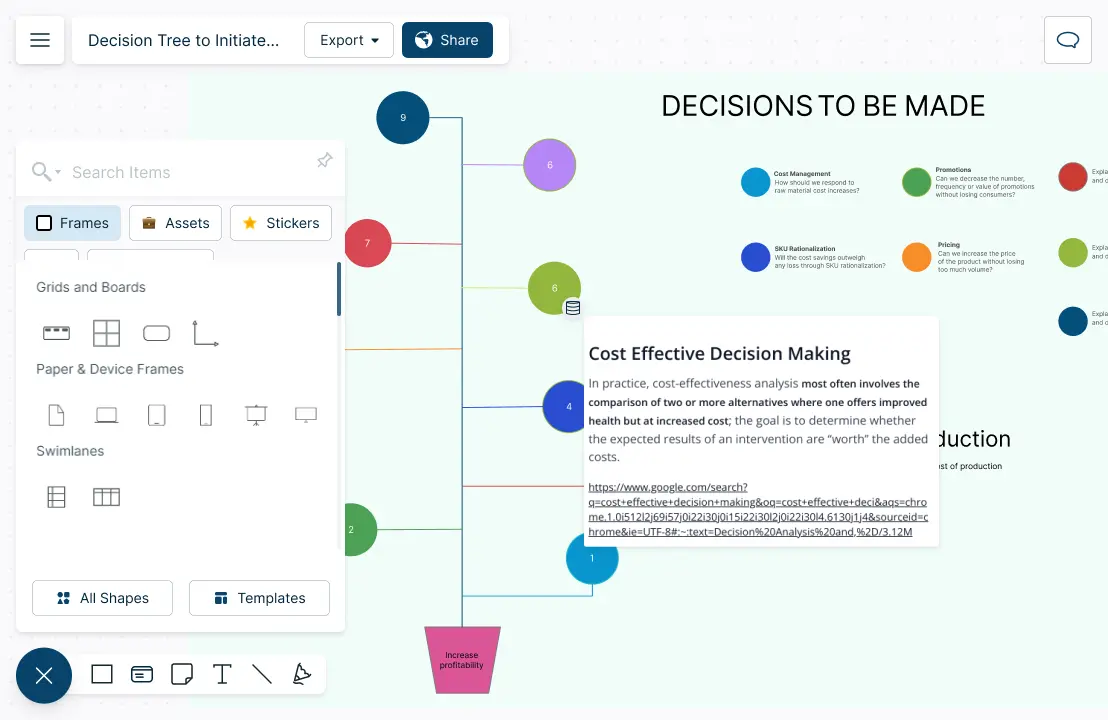
Embed documents and assets with in-app previews to provide in depth context.
Add detailed notes to each element on the canvas to plan and capture decisions.
Multiple access and role levels to share, review and edit with clients and stakeholders.

Analyze, Decide and Reimagine

Use multi-perspectives of the same data models to analyze different scenarios.
Import custom data sets to create multiple decision trees on the same canvas.
Audit logs of all actions within users to ensure compliance and data security.
Auto save to ensure you don’t lose your work, and to ensure accessibility anytime.

What is a Decision Tree Diagram?
How to Make a Decision Tree Together with Your Team?
Decision tree diagrams can be used as a visual tool that teams can collaborate around to identify and analyze different options and their potential outcomes. With decision trees teams can make informed decisions, identify potential issues, and weight pros and cons of different options.
- Define the problem and gather data
Define the problem and the objectives. Gather team members and stakeholders to discuss the issue. Collect the data relevant to the problem from all participants. Share ideas and ensure everyone is on the same page regarding what the decision tree is trying to achieve.
Make use of Creately integrations such as Microsoft Teams to hold dynamic meetings. Use the whiteboard and sticky notes to jot down ideas and elaborate on the problem.
- Start creating the decision tree
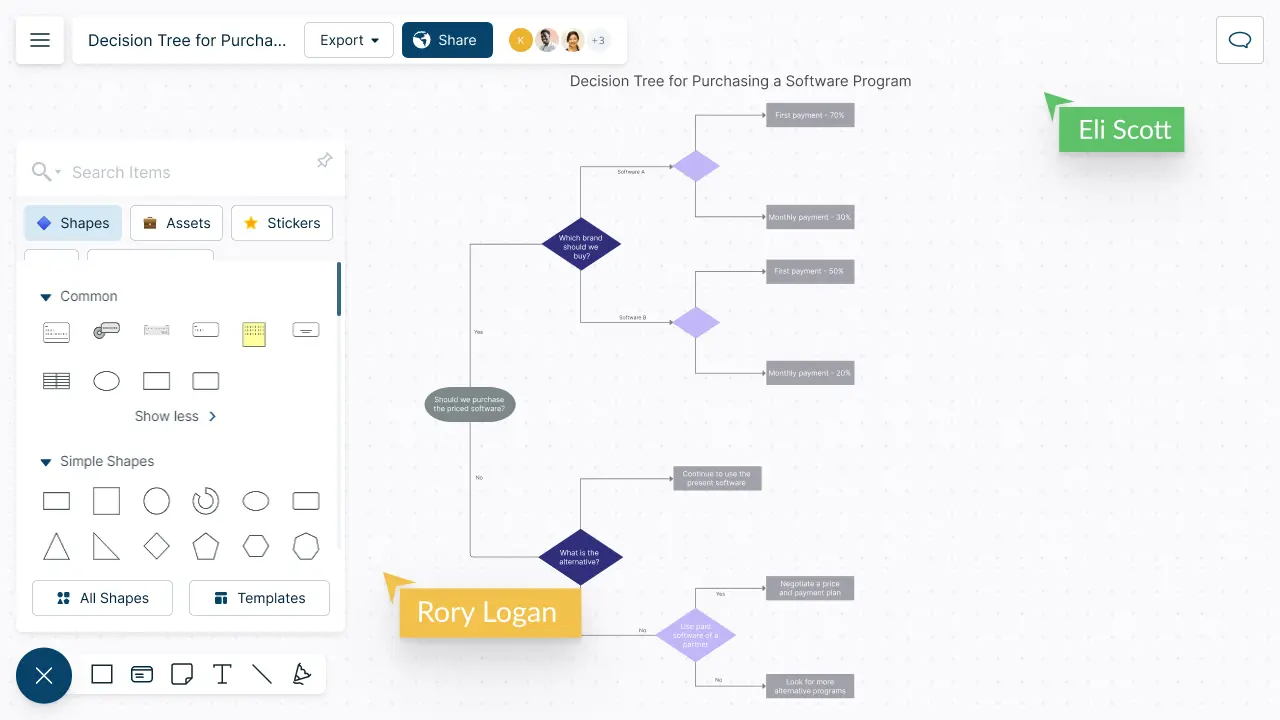
Drag and drop a rectangle onto the canvas to type the root node or the main problem in the decision tree. You can also opt to use a readily available template.
- Brainstorm decision points
Brainstorm the decision points of the tree with your teammates. Consider all ideas and perspectives and identify potential blind spots.
- Assign branches
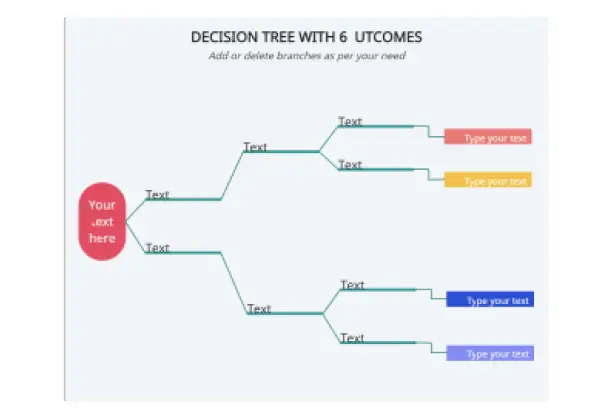
Assign branches for each decision point. Use circles to denote nodes that contain possible outcomes. Each node may be connected to multiple circles depending on the number of outcomes.
As the decision tree branches out, use lines to indicate each decision’s impact (or cost) and its possible outcomes. Creately features intelligent formatting capabilities that allow you to connect shapes easily.
- Assign probability or likelihood
Assign the probability or likelihood of each branch being chosen. Use dot voting to gather the input of each team member. Select a shape and access the notes panel on the right to store additional information on possible outcomes. All questions or points on the decision tree should be connected to a chance event. Use triangles at the end of change events to indicate an outcome.
- Share and fine-tune
Once the decision tree is complete, calculate the cost of each outcome and determine the final value. Export the decision tree diagram in JPEG, SVG, PNG, or PDF formats or share it with colleagues for real-time feedback collection.
Create Your Decision Tree Diagram Online with Editable Templates
FAQs About Decision Tree in Creately
There are three main parts.
- Decision node (choice)
- Chance node (probability)
- End node (outcomes)
Ability to
- use built-in integrations geared towards working together
- assign roles to team members
- allow team members to work together simultaneously in real-time
- use version control to track changes
- involve stakeholders and clients when necessary via special permission options
- provide feedback on the same canvas
Creately is a collaborative platform complete with all the above features. So join Creately today to easily collaborate on decision trees and make smart and informed decisions.


