Easily visualize your processes and workflows with smart automation.
Create visual organizational structures with images and detailed profiles.
Visualize concepts and their relationships on an infinite visual canvas.
Map family history and understand the relationships with detailed genograms.
Visualize relationships between entities using Crows Foot or Chen notation.
Visualize your network infrastructure. Support AWS, CISCO, Azure and more.
Visualize and expand your ideas using our powerful mind mapping tool.
Easily create family trees with our professionally designed templates.
Infinite canvas to add diagrams, images, sticky notes and more.
Run collaborative meetings, workshops or brainstorming sessions.
Collaborative diagramming for educators and students at discounted rates.
Log In
Sign Up Free
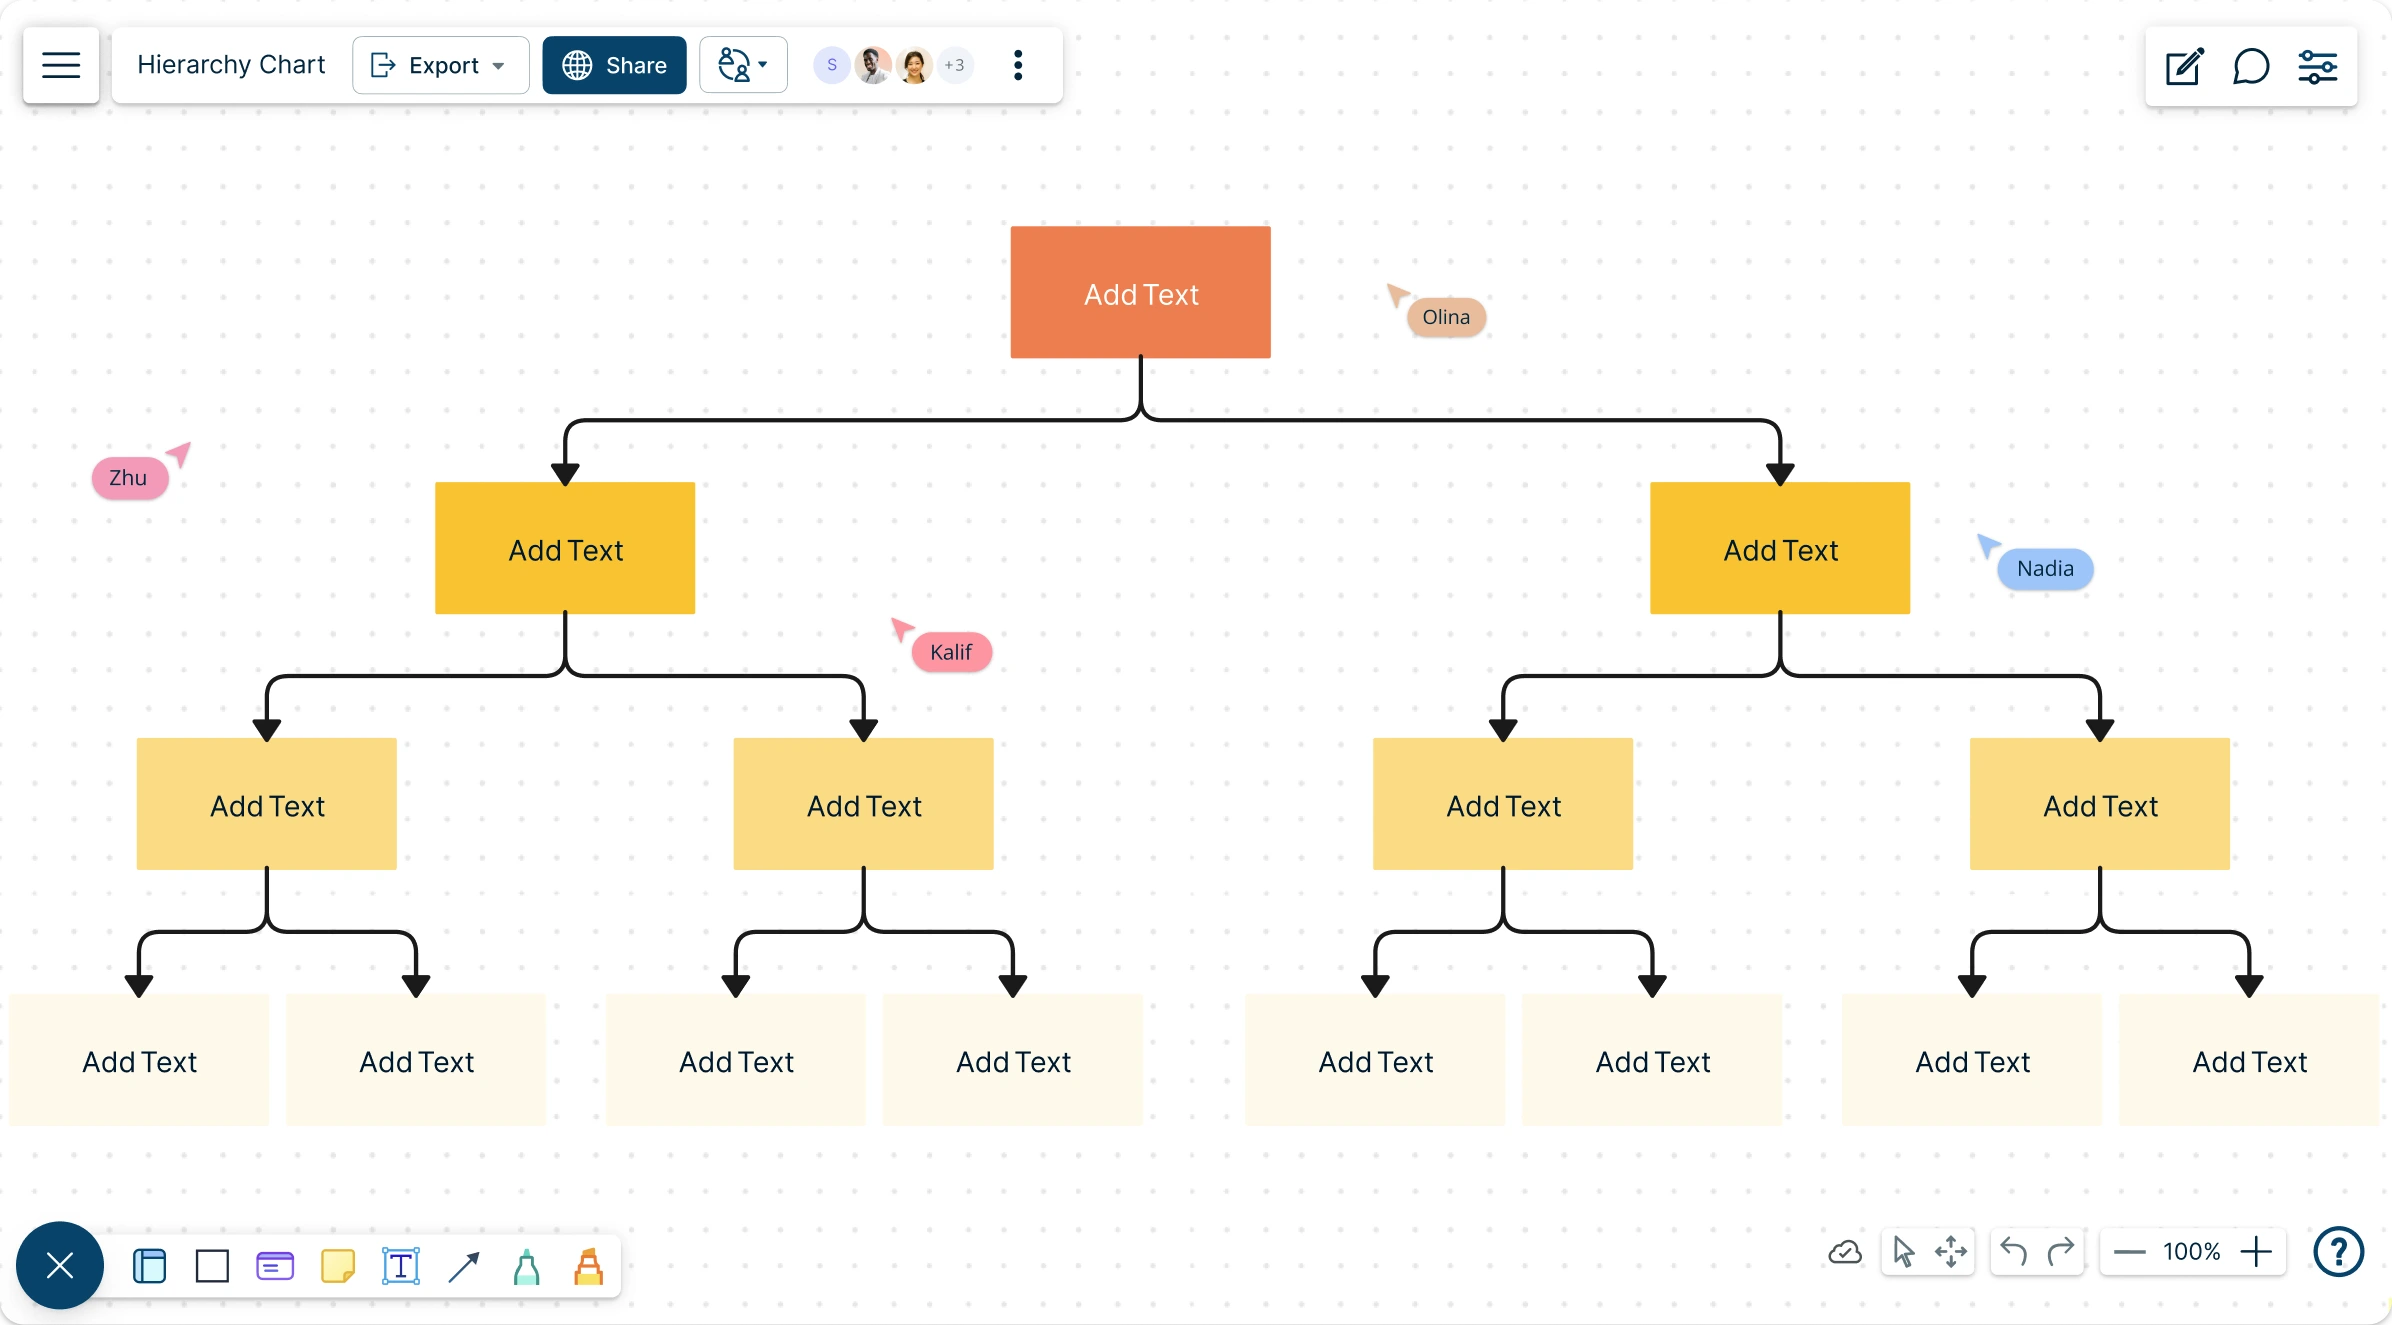
Quickly build and visualize your hierarchies with Creately hierarchy chart maker. Get clear, actionable insights into your team's structure in no time.
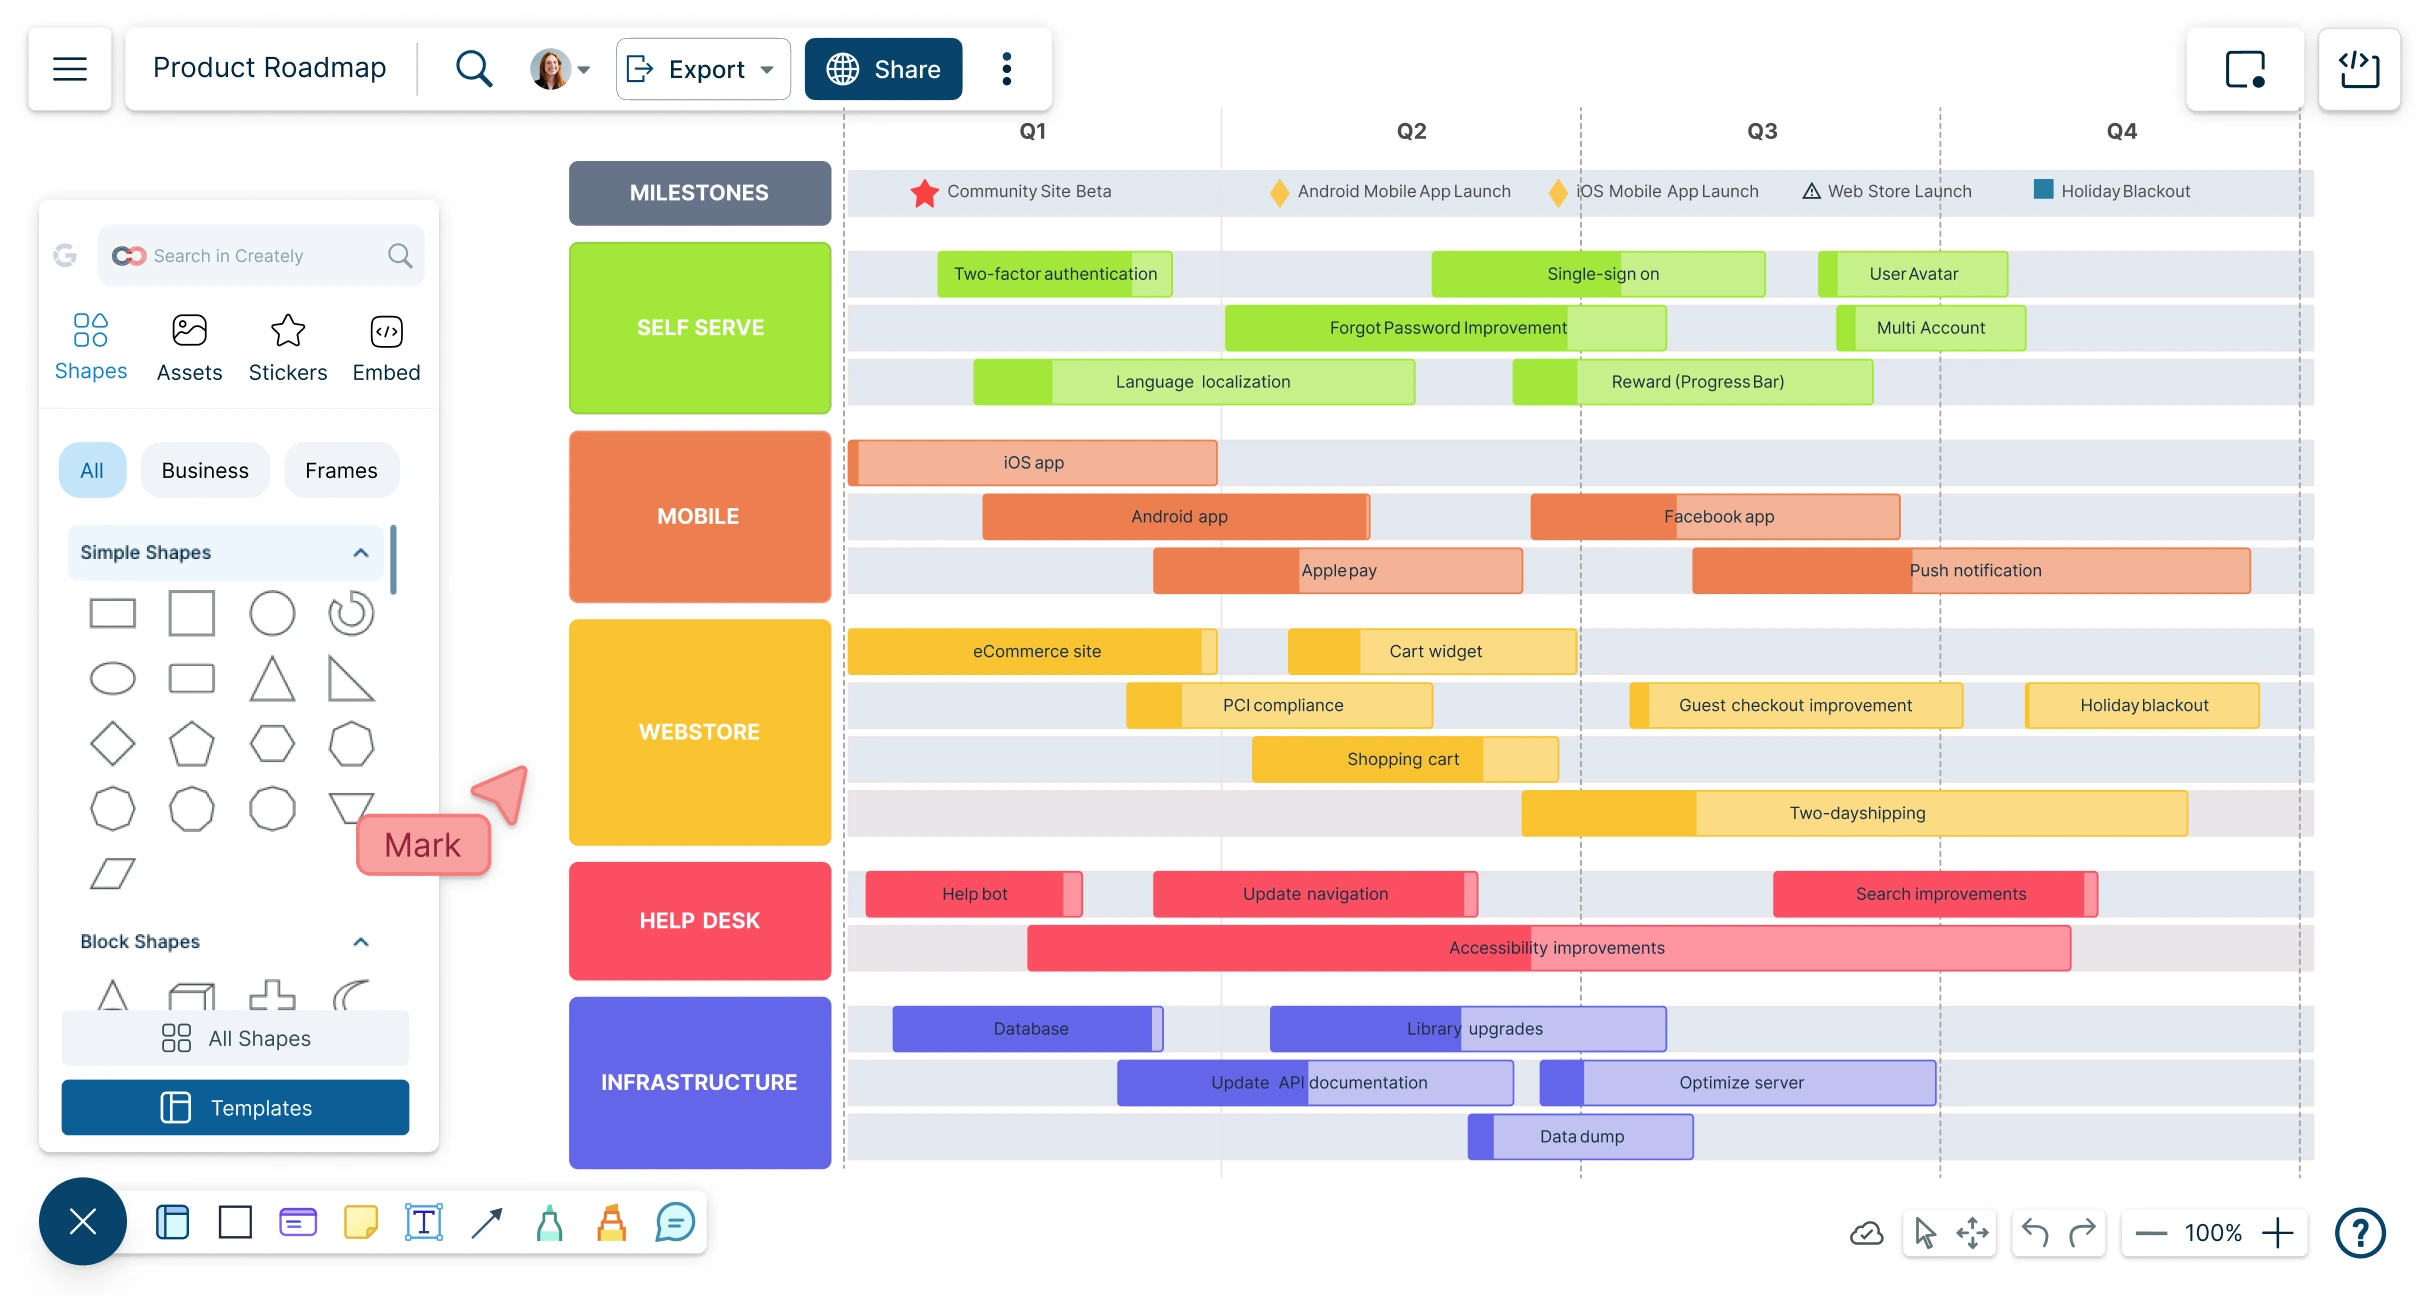
Align team efforts from product ideation to launch, synchronize efforts and communicate vision and progress with Creately’s product roadmap software.
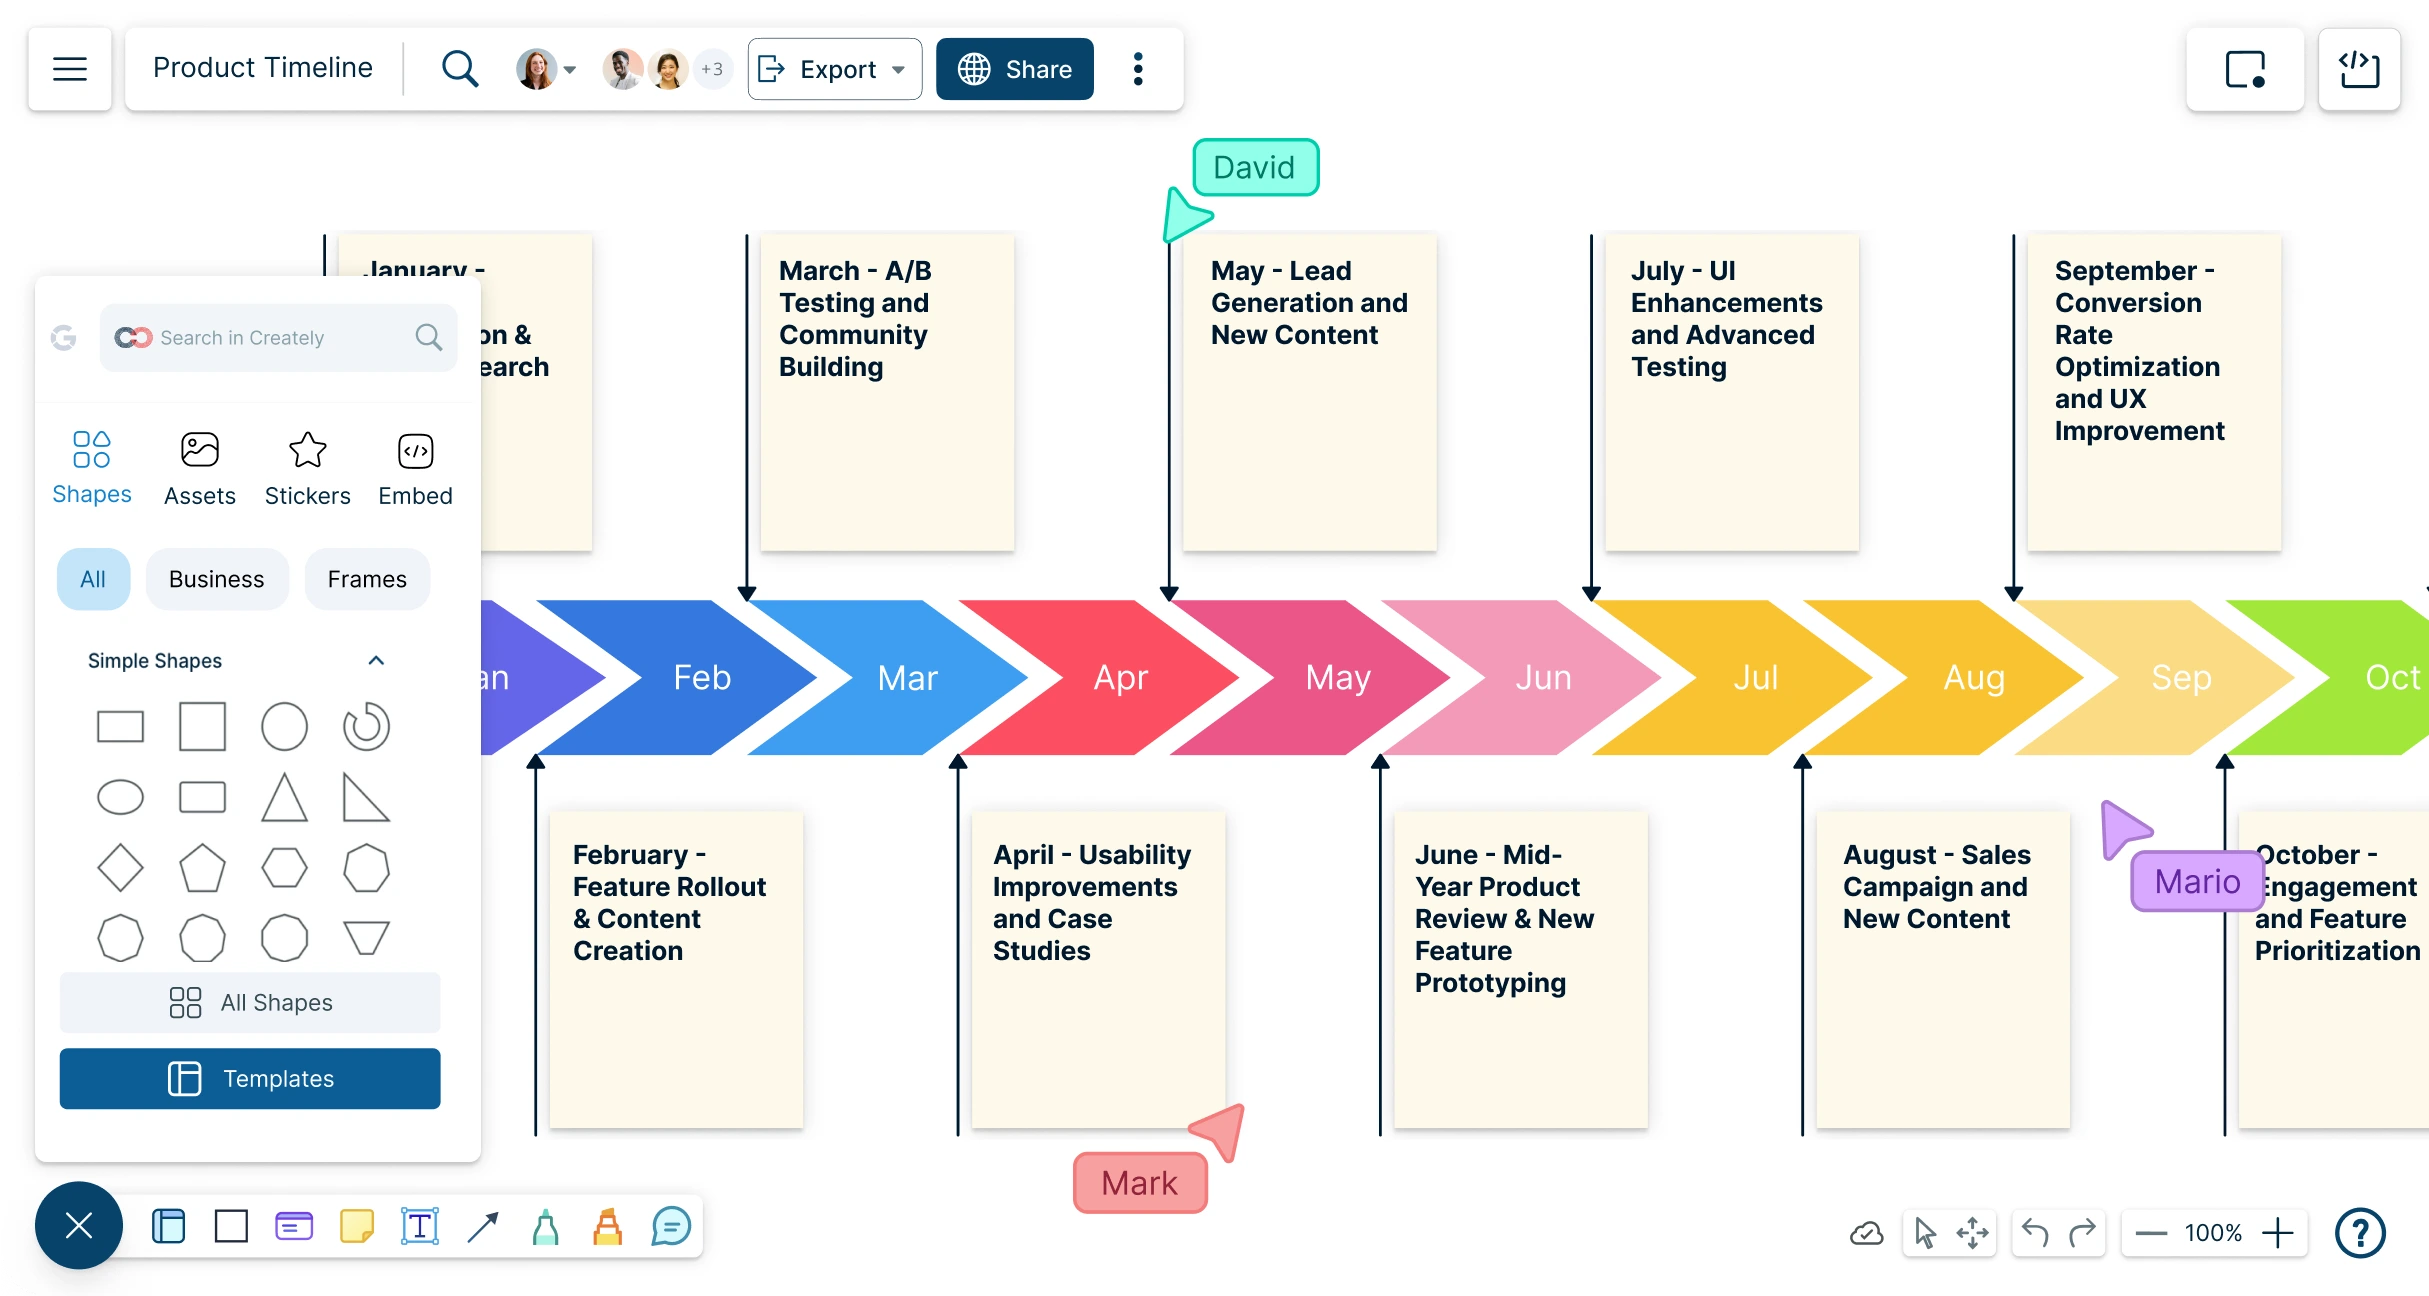
Create powerful timeline infographics with Creately’s intuitive drag-and-drop timeline maker. Easily design simple, engaging visuals for projects, presentations, and education.
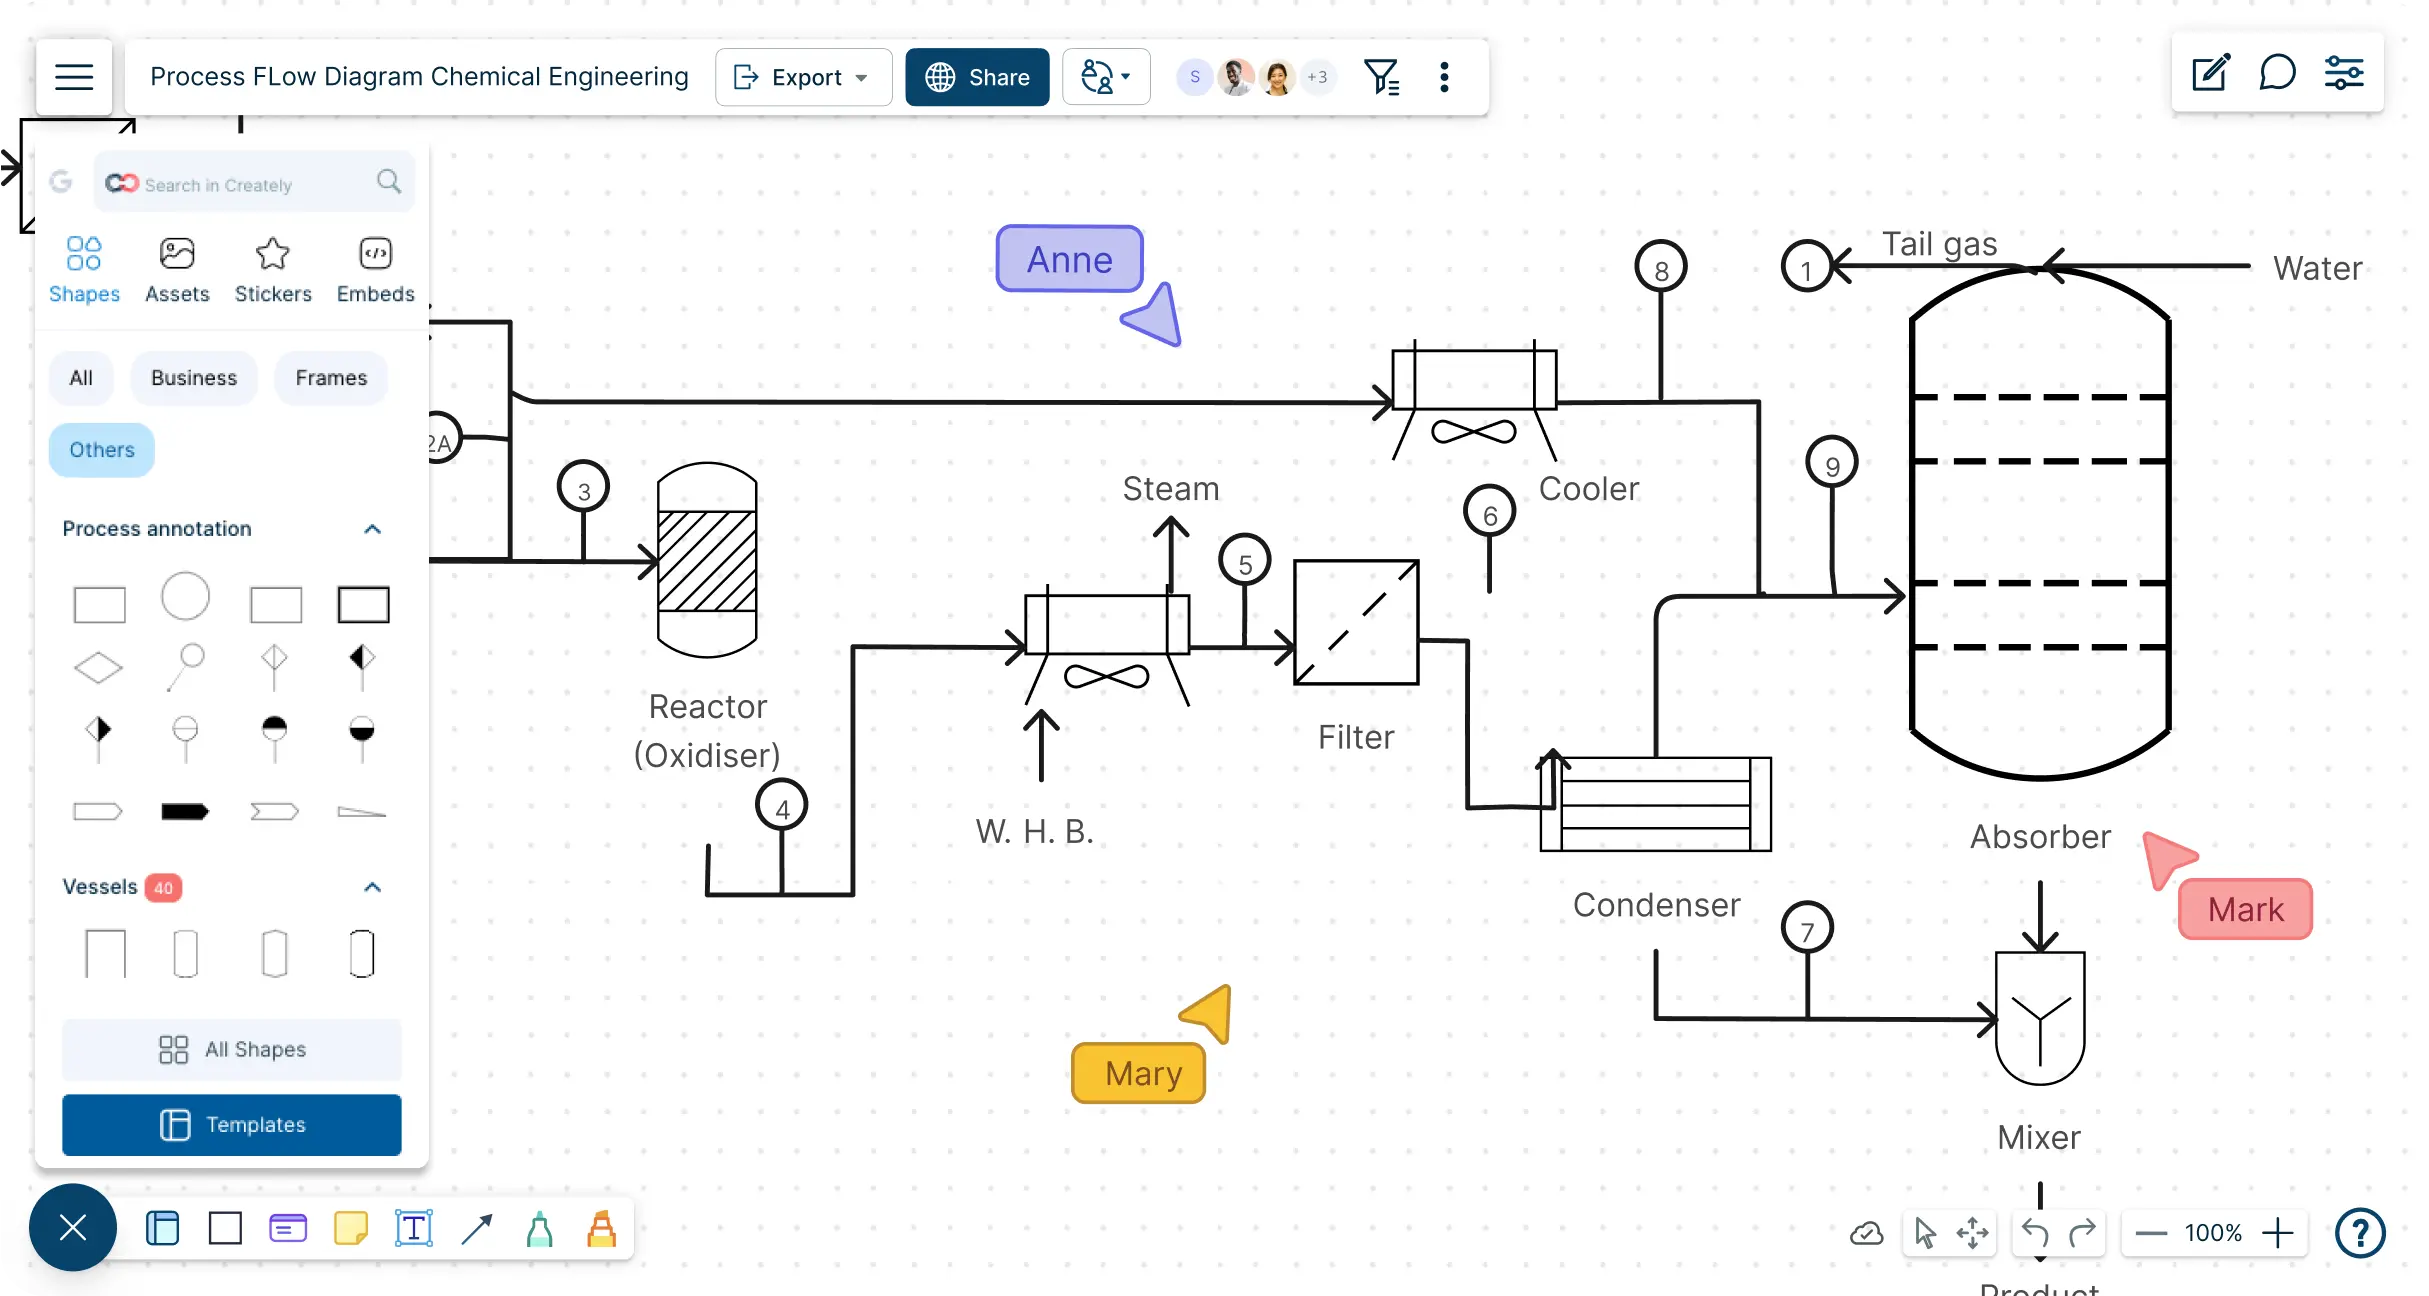
Easily visualize and streamline complex processes with Creately’s process flow diagram software. Design professional workflows, identify inefficiencies, and improve decision-making with customizable, collaborative diagrams.
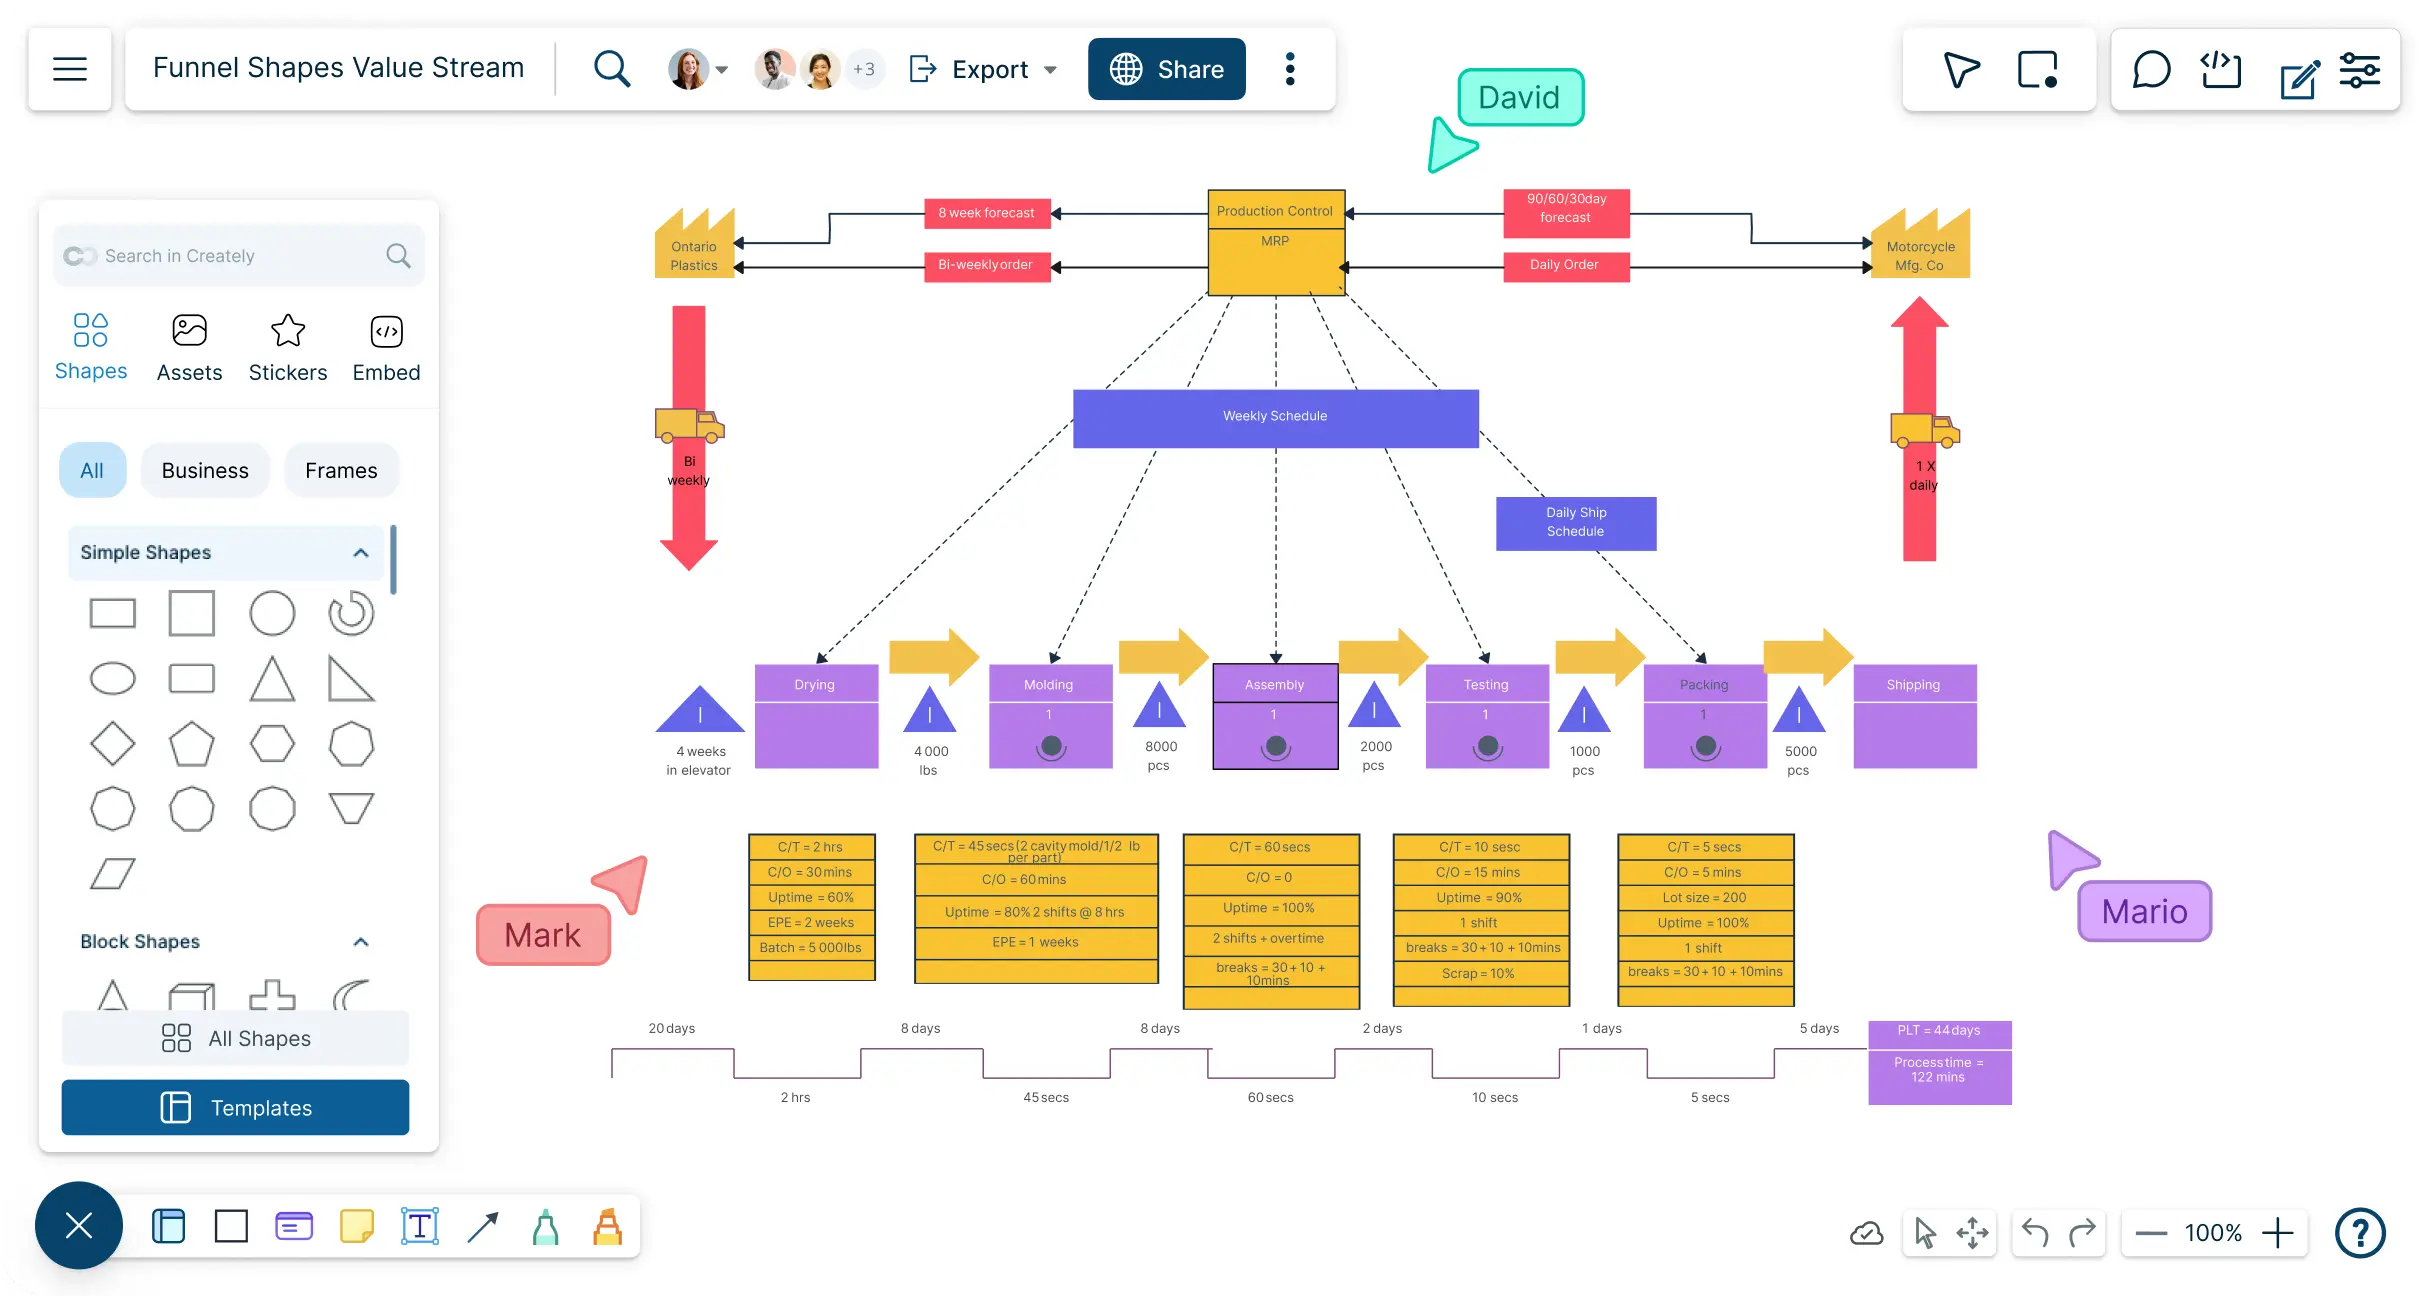
Identify waste and inefficiencies in your existing processes and collaborate to develop solutions for improvement using our advanced value stream mapping online.
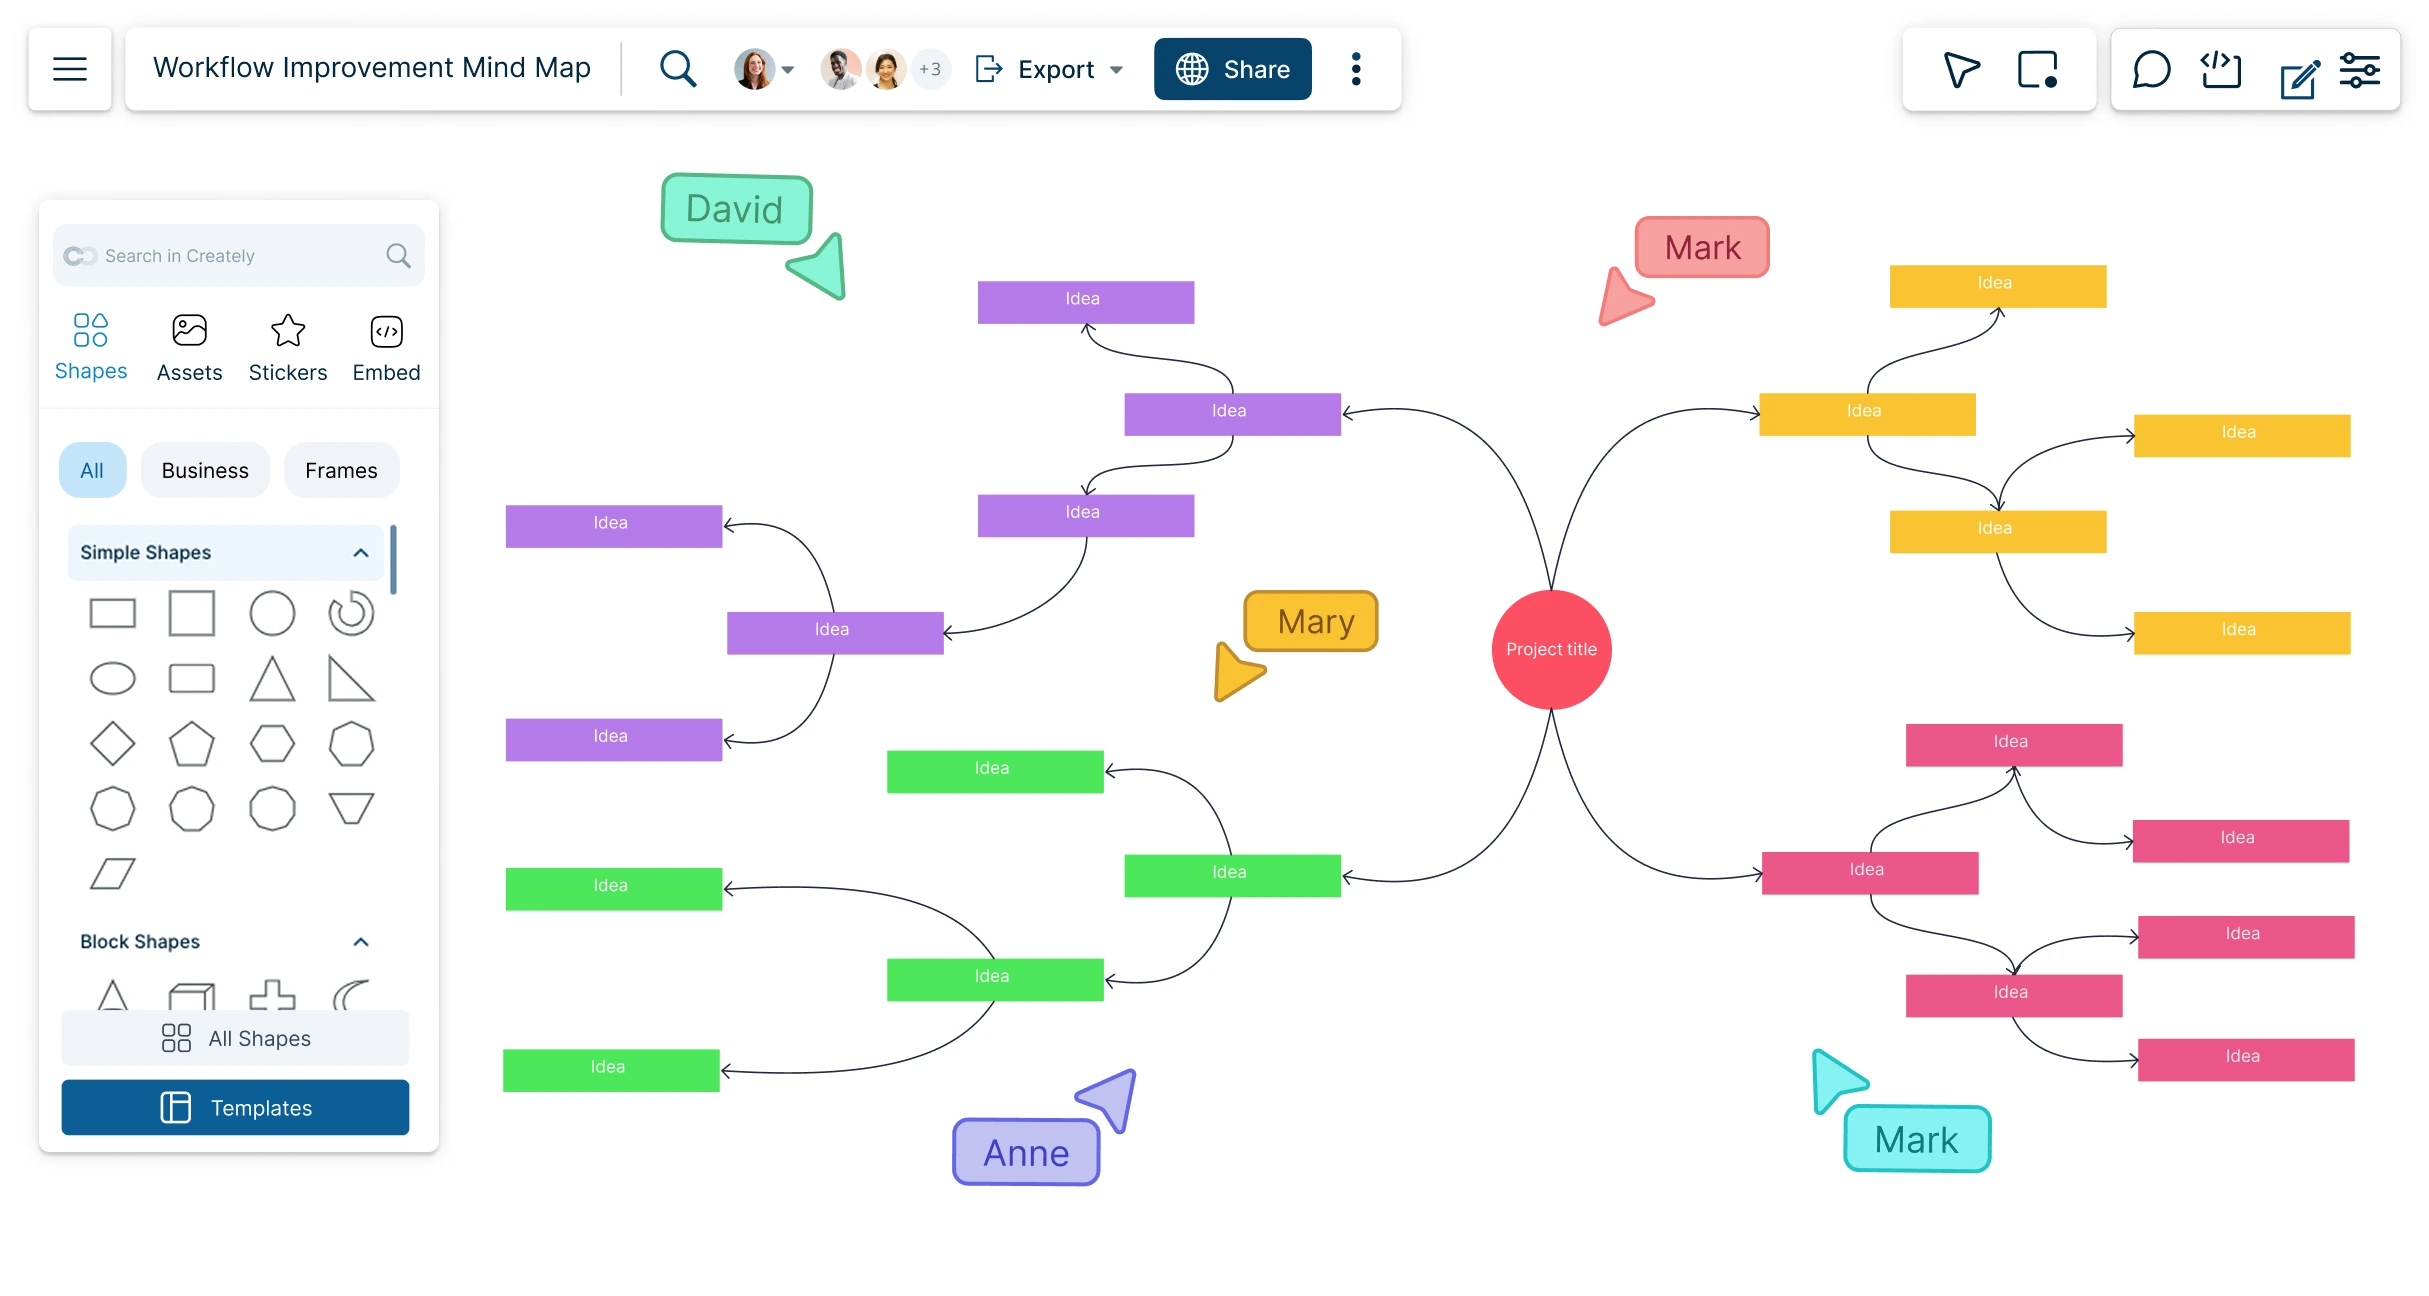
Use the mind map online tool to visualize ideas and concepts for collaborative brainstorming, creative thinking, problem-solving, and so much more.
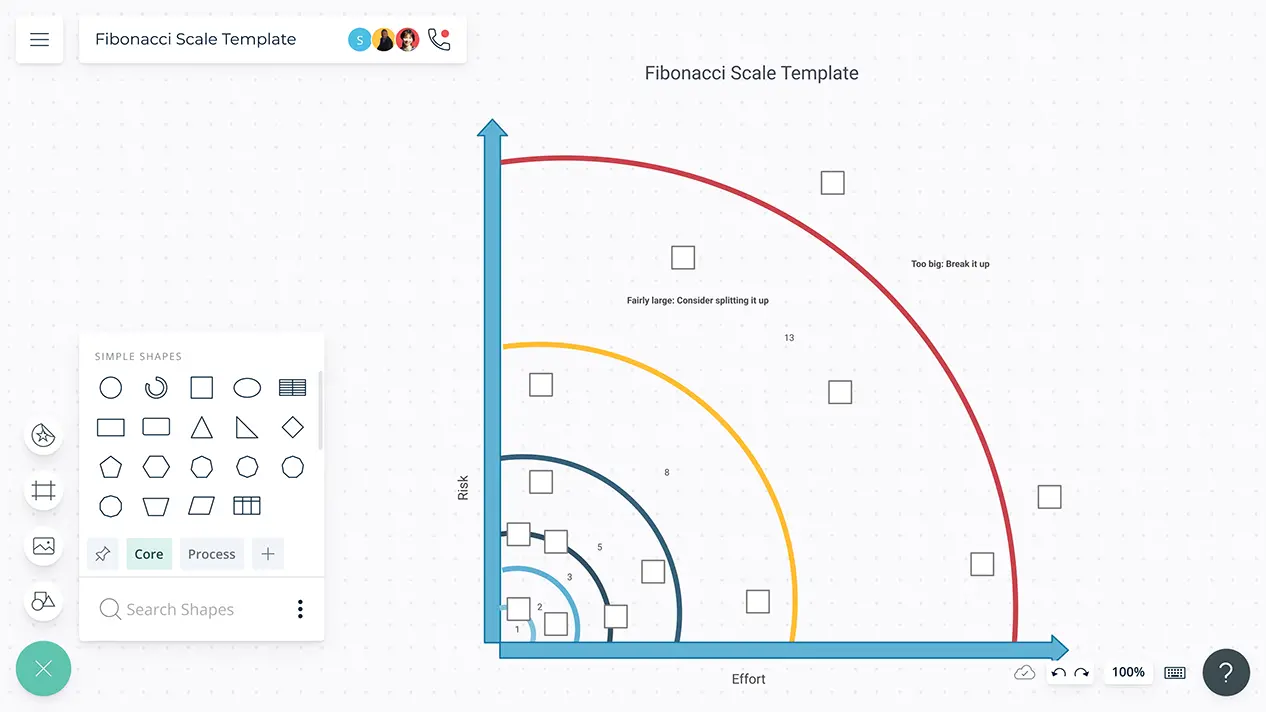
Visual tools to score tasks based on effort. Prioritize work and better manage builds.
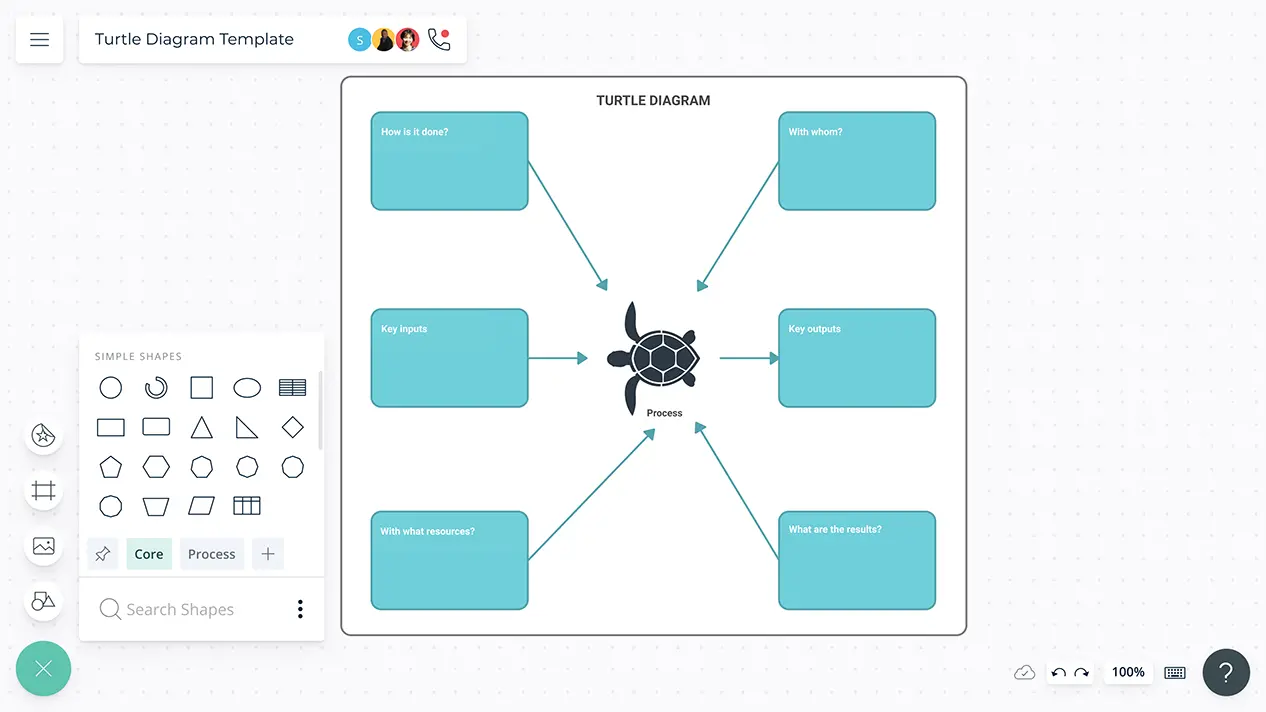
Better understand the interrelationships between various components in a process.