Turtle Diagram Template
Understand Business Processes Better
Better understand the interrelationships between various components in a process.
- Multiple templates to streamline business process documentation
- Extensive shape libraries for BPMN, flowcharts, process maps, & more
- Real-time collaboration to align cross-functional team workflows

Easy Tools for Process Visualization
Multiple pre-made templates to visualize organizational processes, team workflows, swimlanes, and more.
Extensive shape libraries & professional diagramming tools to create flowcharts, value stream maps, BPMN, process maps, activity maps & more.
Simple to use drag drop tools with Plus Create to effortlessly visualize complex processes in minutes.
Freehand drawing and highlights to quickly create rough outlines of processes during planning and brainstorming sessions.
Scale and centralize all information on an infinite canvas. Hassle-free arrangement and organization for process analysis and auditing.
Discover Insights Faster

Import images, multimedia content, and links to external sources of information to provide more context to your turtle diagrams for easier decision-making.
Built-in tools to create dynamic and interactive presentations, reports, and dashboards to easily present to the relevant stakeholders.
Add documents and assets with in-app previews to create a central access point for all process-related information.
Extend your turtle diagram to include additional information on suppliers, customers, inputs, outputs & processes with data fields and custom properties.
Embed your turtle diagram securely in any site or intranet, or export them as PDFs, PNGs, JPEGs, or SVGs to share or publish them.

Get Everyone on the Same Page
Online whiteboard with brainstorming tools like mind maps and post-it note walls to easily conduct collaborative process analysis sessions.
Real-time cursors for any number of participants to collaborate with team members on a shared canvas.
Video conferencing baked into the platform to feel like you are in the same room even when you are working remotely.
Comment with context, have discussions and follow ups on the same canvas. Async!
Full version history to keep track of key points during each iteration of your process mapping. Branch out from an earlier version if needed at any time.
Multiple access levels and roles to streamline managing, sharing, editing, and reviewing your process documents.
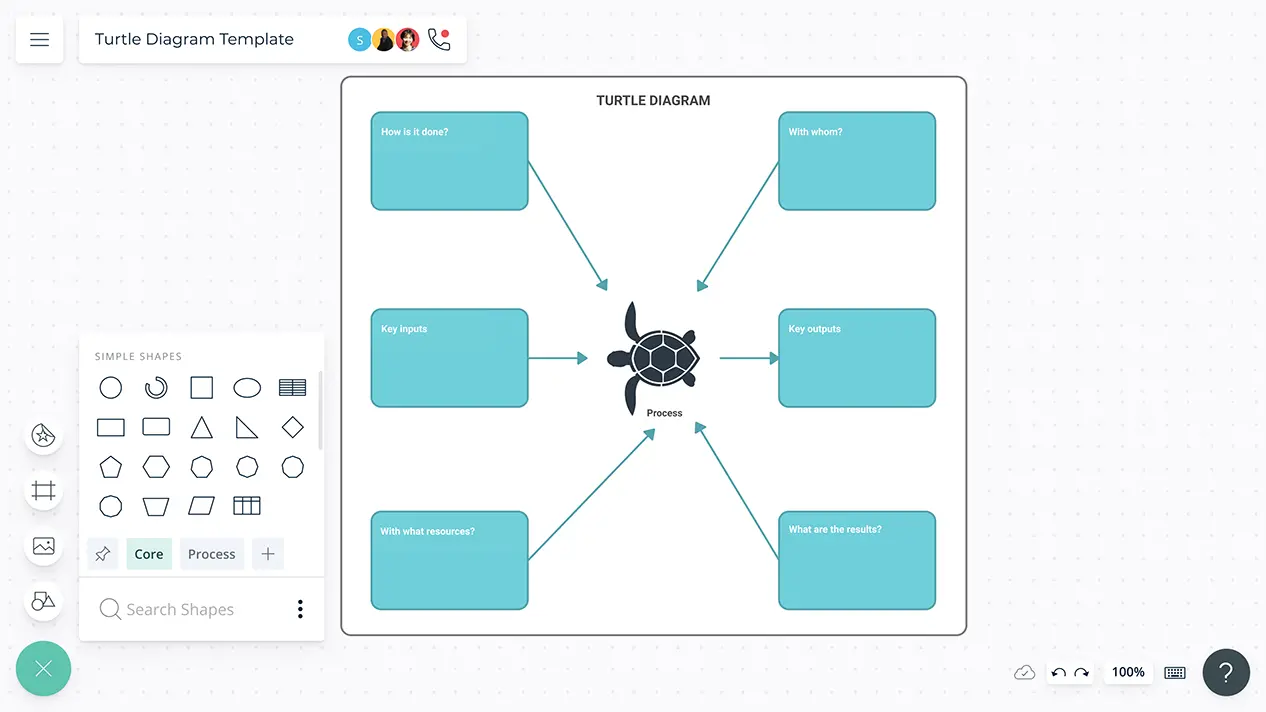
What Is a Turtle Diagram?
A turtle diagram is a visual tool that displays and describes all related elements of a process in an organization. This diagram that resembles a turtle, details the process, making it easier for the organization to efficiently analyze and understand it, and make effective decisions or improvements. The turtle diagram is especially useful to measure the effects of processes. It will display process owners, input, output, resources, methods, procedures, and related documentation. It is used at any organization that applies ISO standards.
How to Create a Turtle Diagram?
- You can get started almost immediately by selecting an editable turtle diagram template from Creately’s template library. Alternatively, you can get creative on Creately’s infinite workspace by using shapes, color palettes, and styling formats to create your own turtle diagram.
- The first step is to identify what the process is. What does the process under audit do? Start by providing a brief description of the process and its functionality.
- Input/Output: The ‘Input’ section is where you will identify supporting tools, equipment or resources that will be used in the process. The ‘Output’ section will identify the results or products.
- Suppliers and Customers: Identify the suppliers of materials or resources for the process, and the consumers of the output.
- How Much?: Identify what methods, procedures, equipment etc. to understand the process of how the inputs contribute toward the output.
- Who: This refers to the process owner and other individuals involved in the process.