Working with Tables
Creately’s Tables can help you organize your data clearly and format cells for a more appealing presentation. You can easily draw a table and customize using an array of options in Creately.
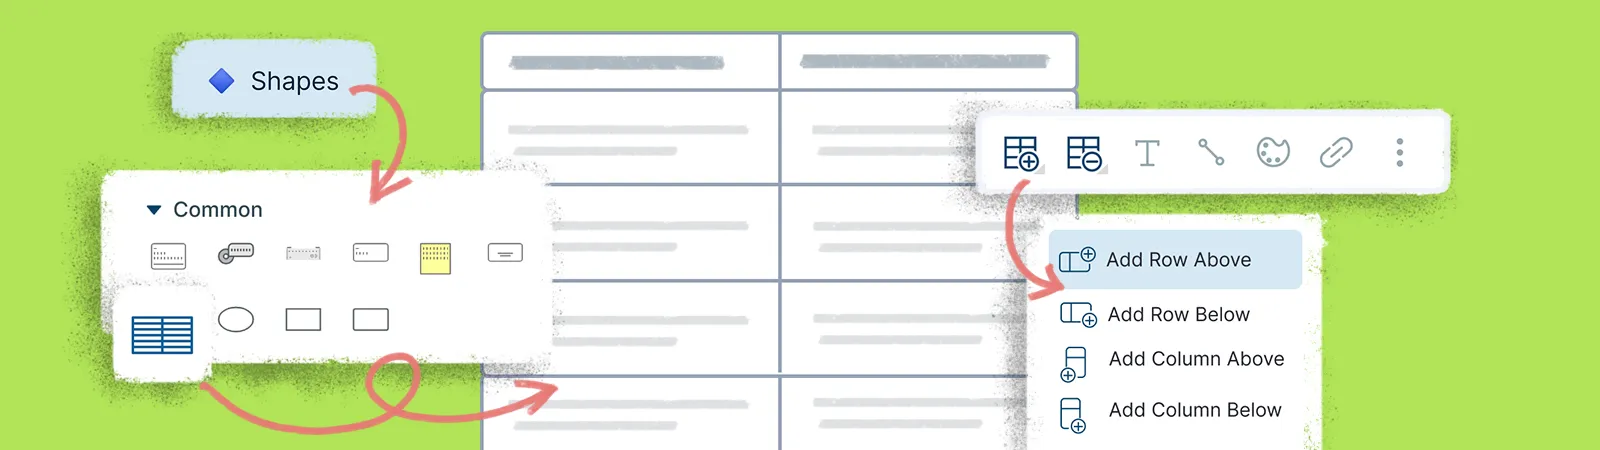
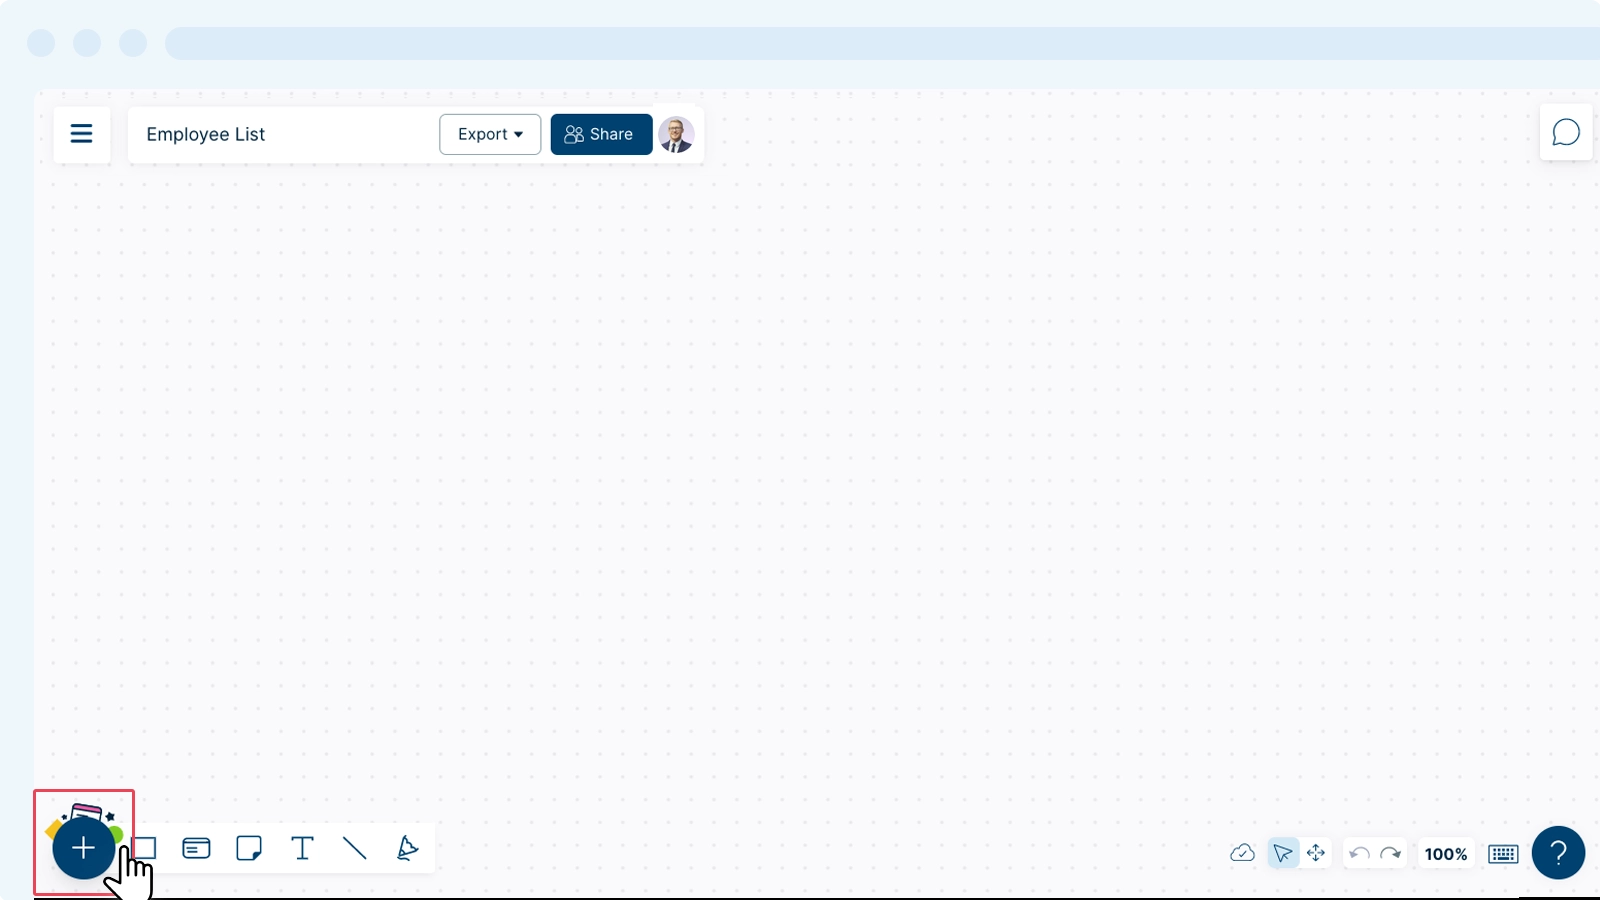
Getting Started
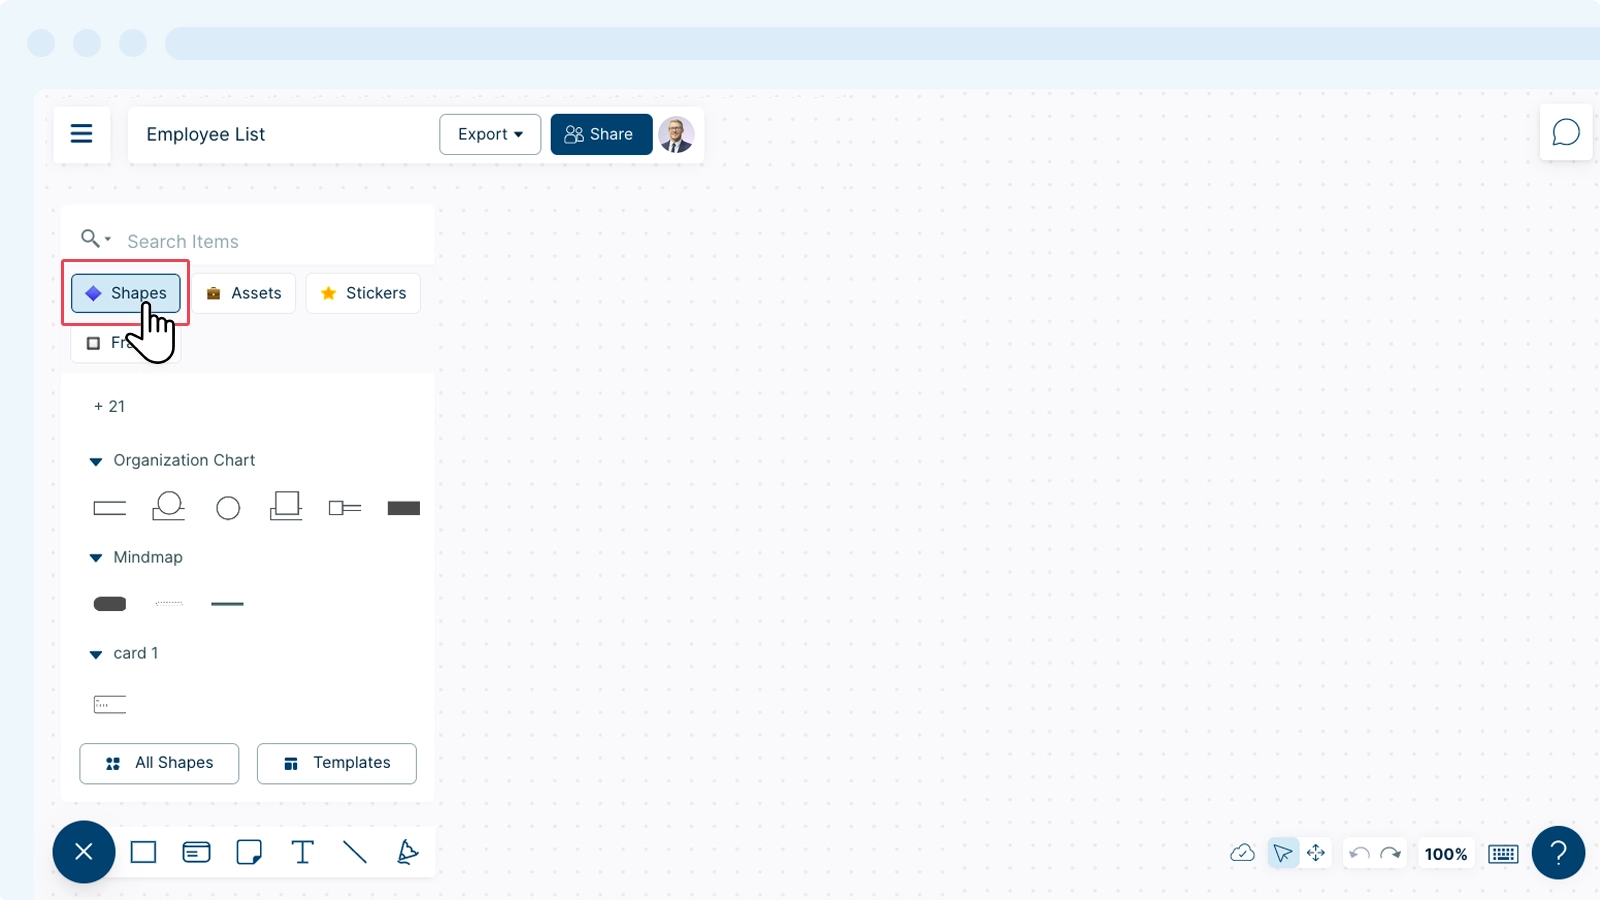
- Go to
 Shapes tab.
 - Find the
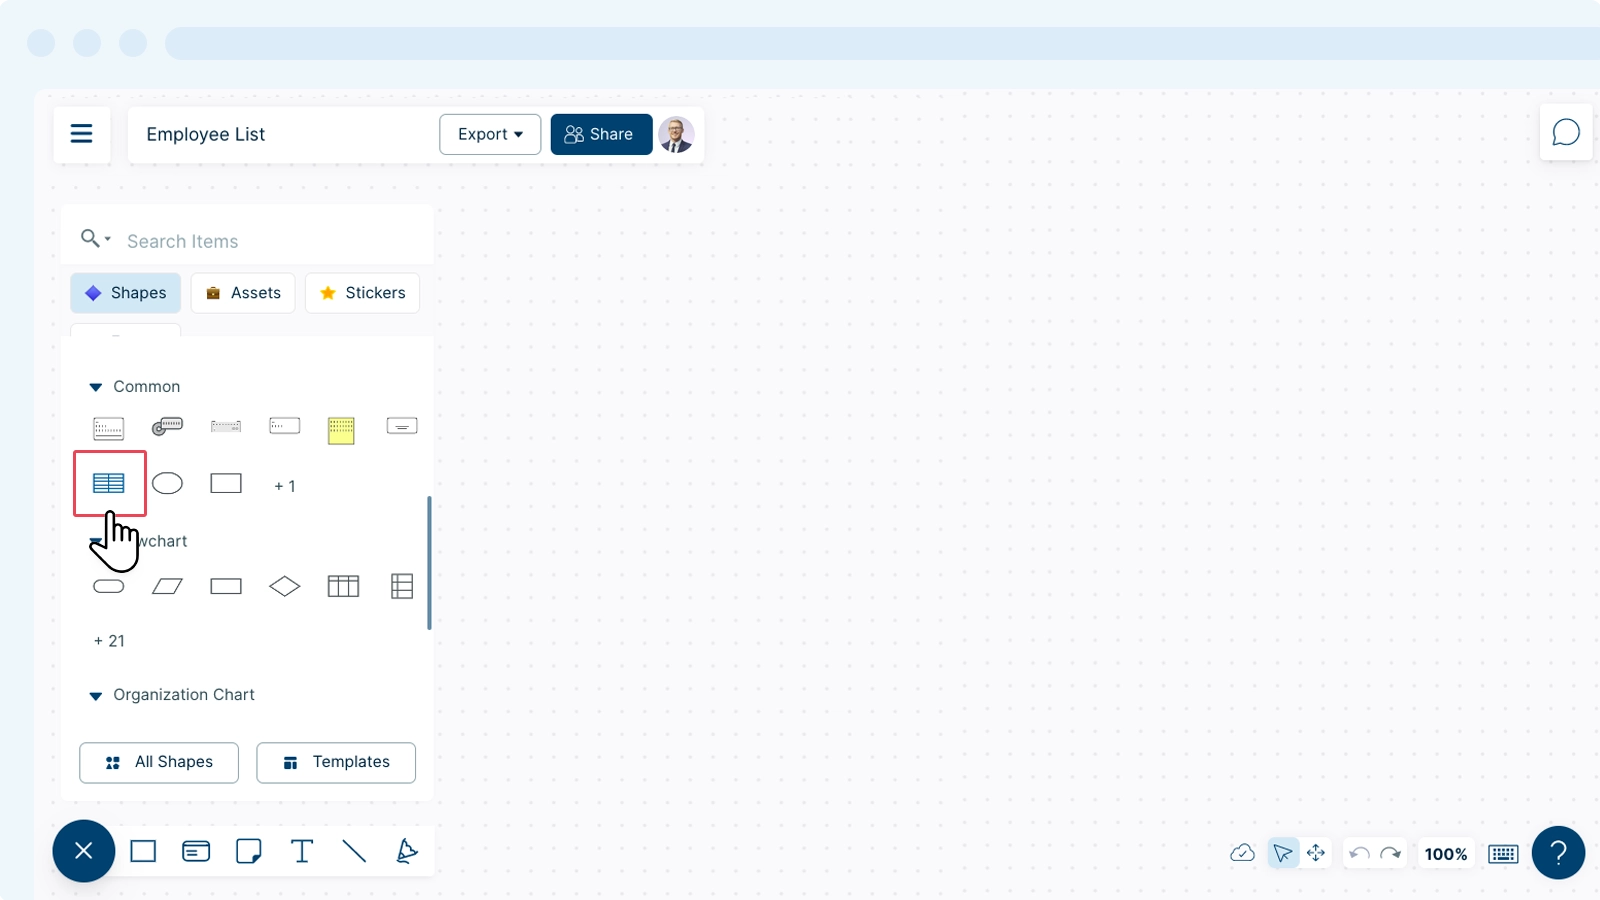
 Table shape placed under the Recent Shapes or Common Shapes library.
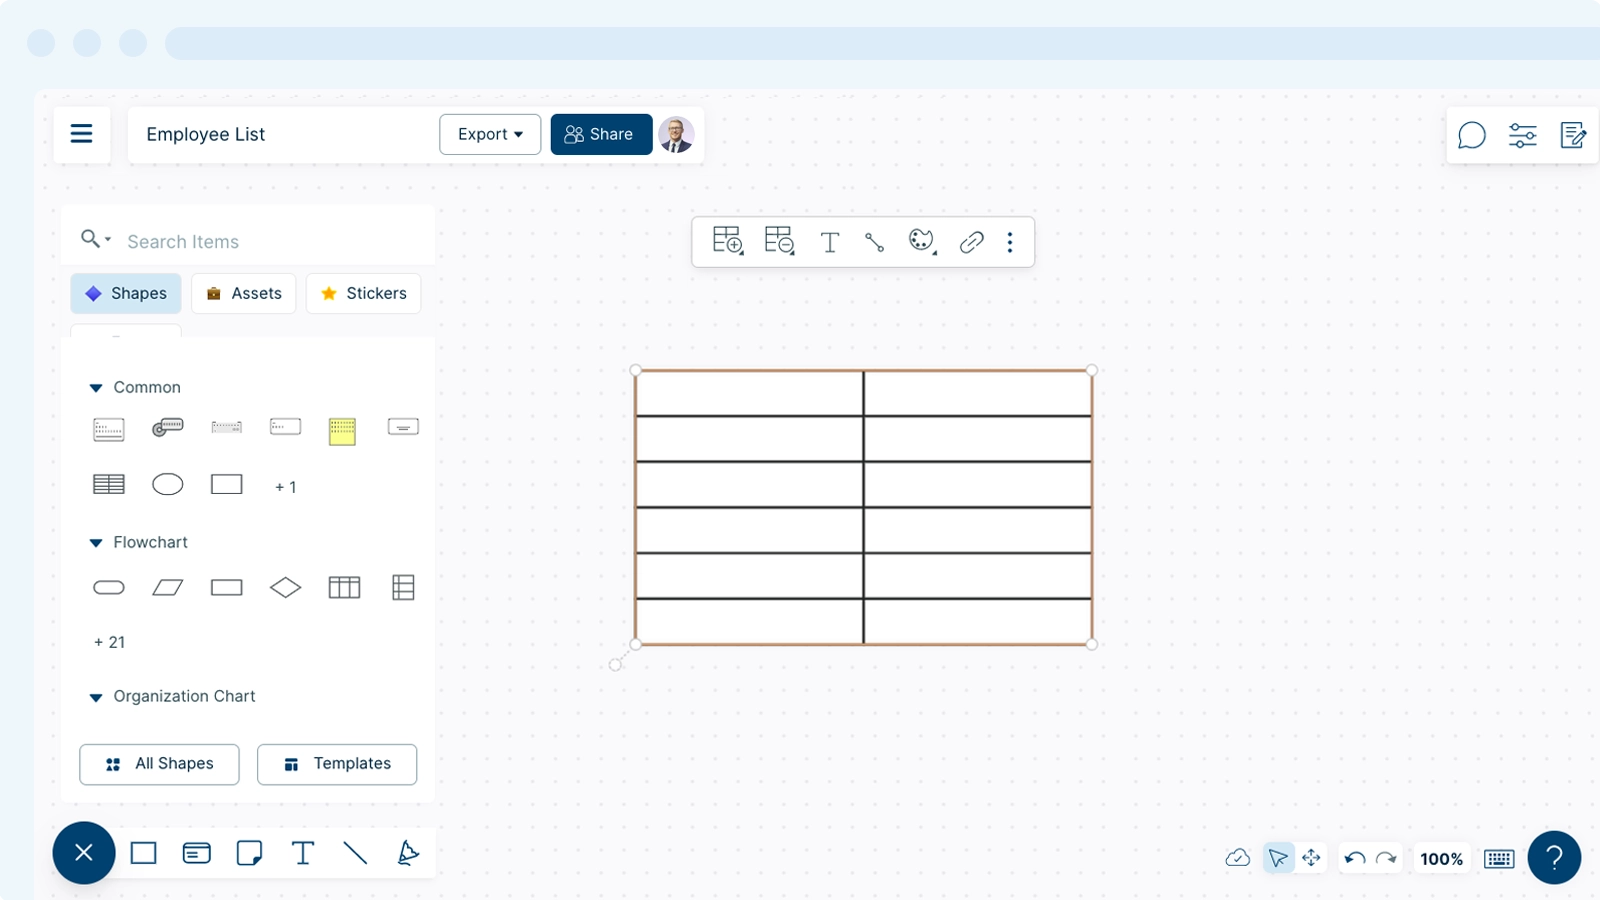
 - Drag and drop the table on to the canvas.
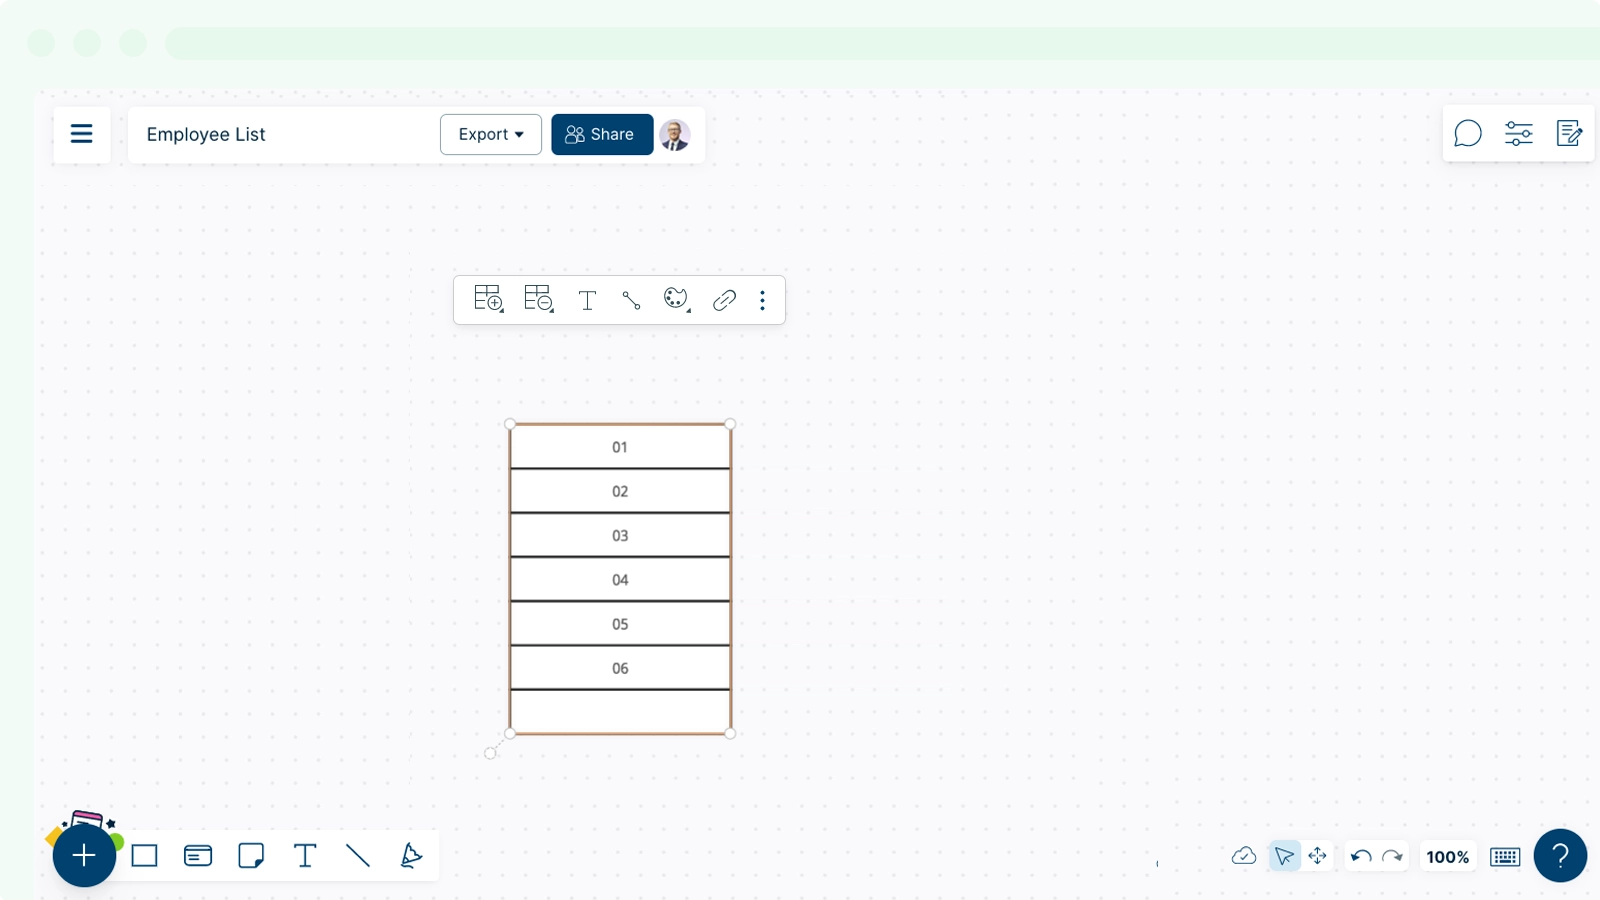
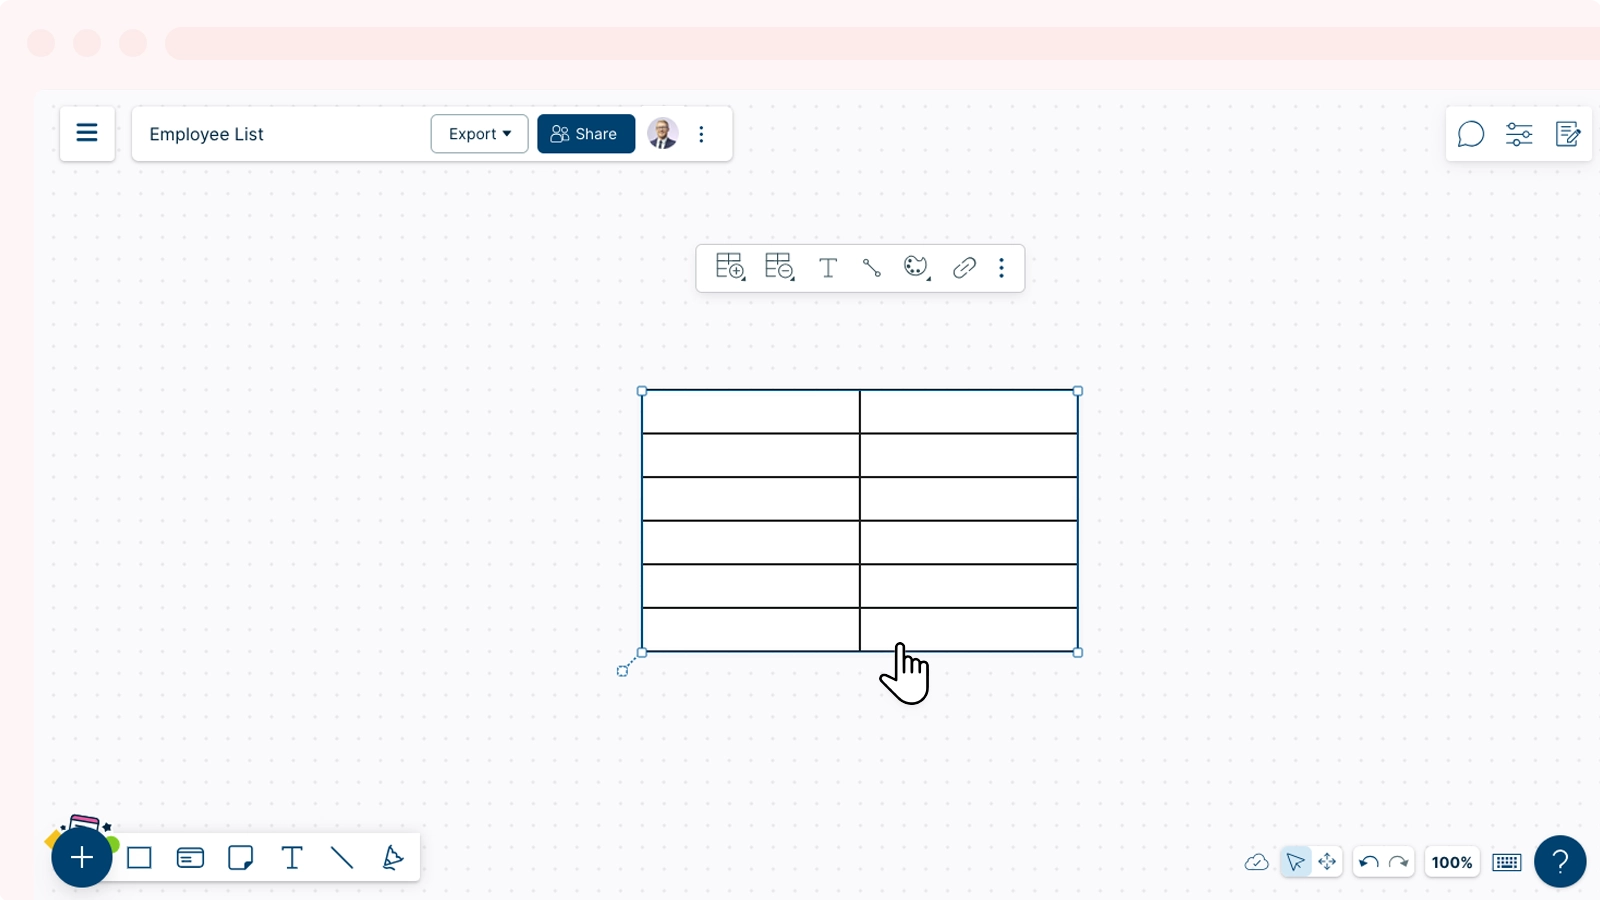
Adding and Removing Rows and Columns
You can customize the size of your table by using the options available in the Contextual toolbar.
- Select the table.
- To add rows or columns, select the table with the
 Plus icon.
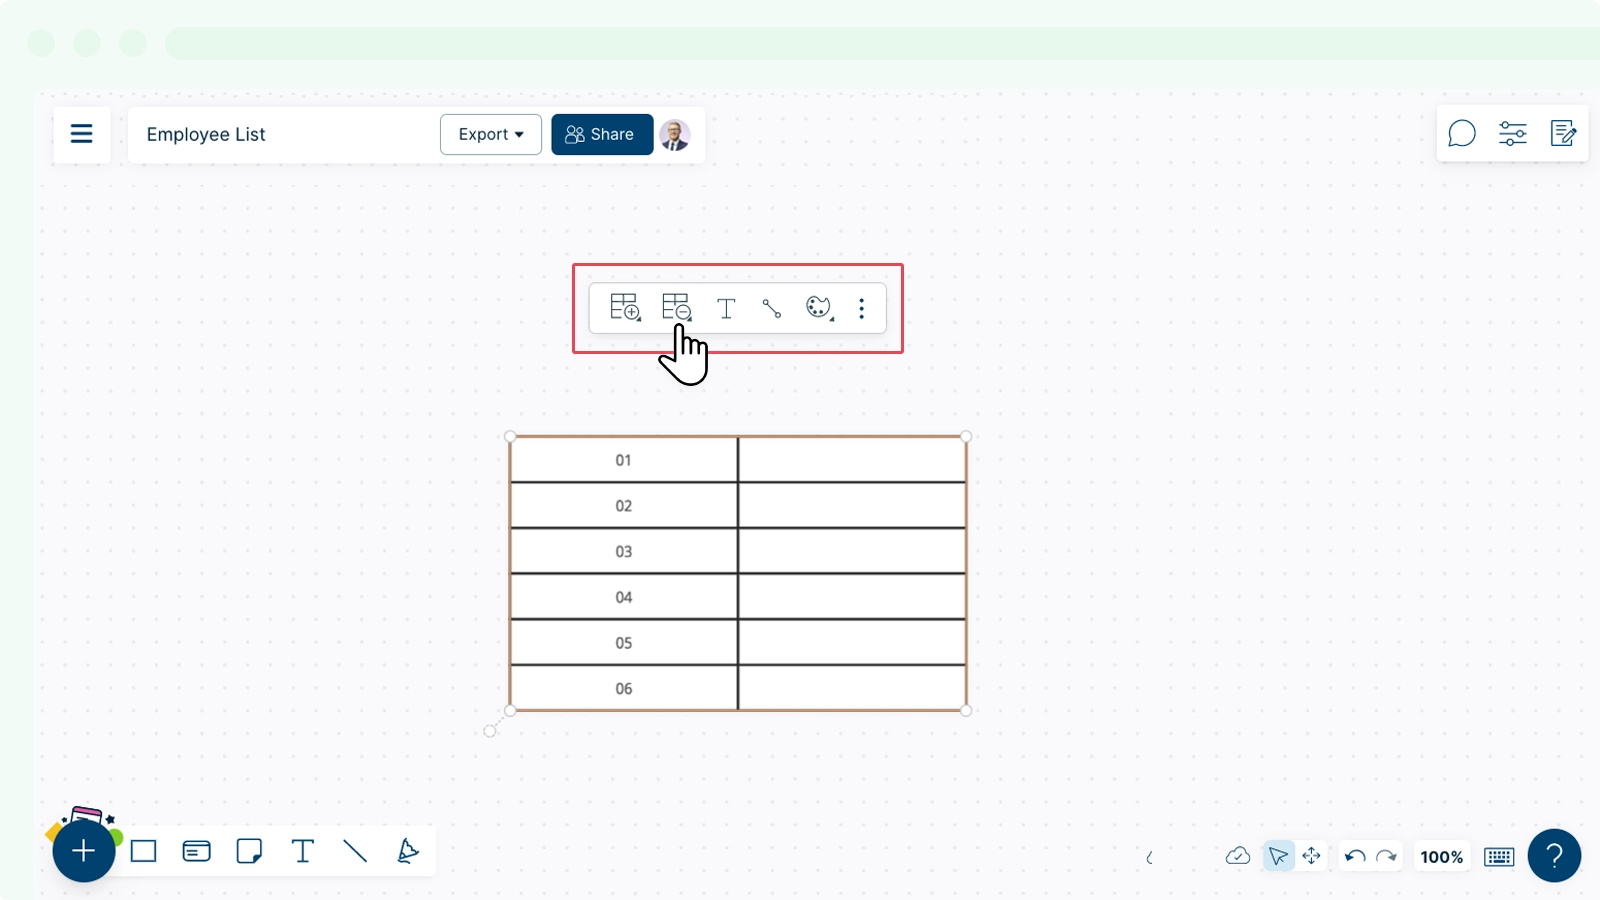
 - To delete rows or columns, select the table with the
 Minus icon.
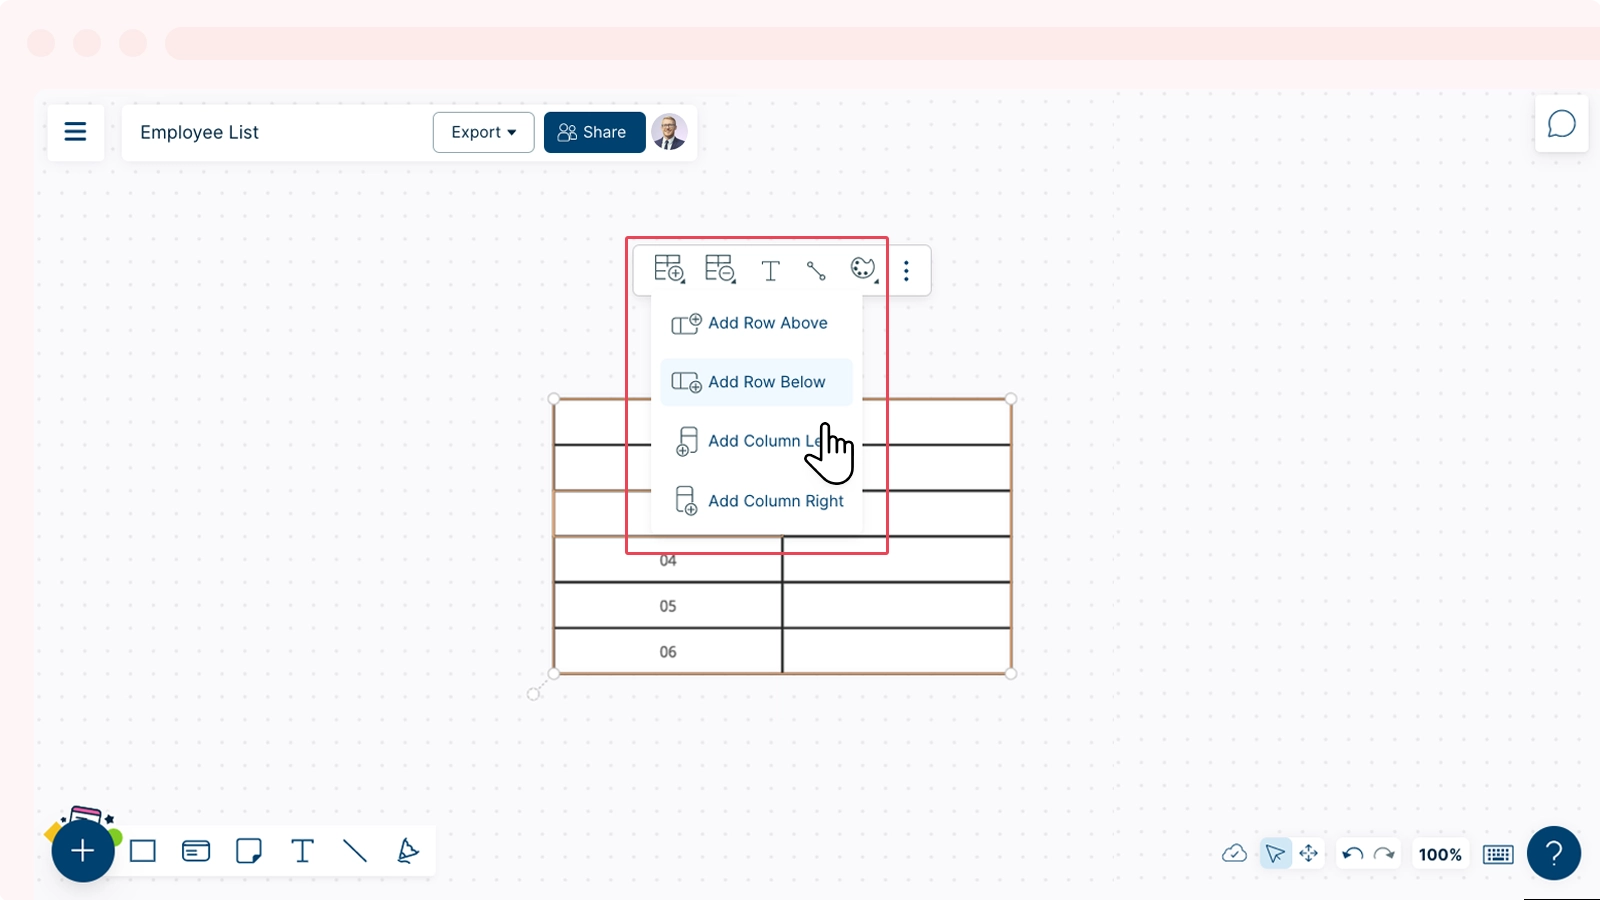
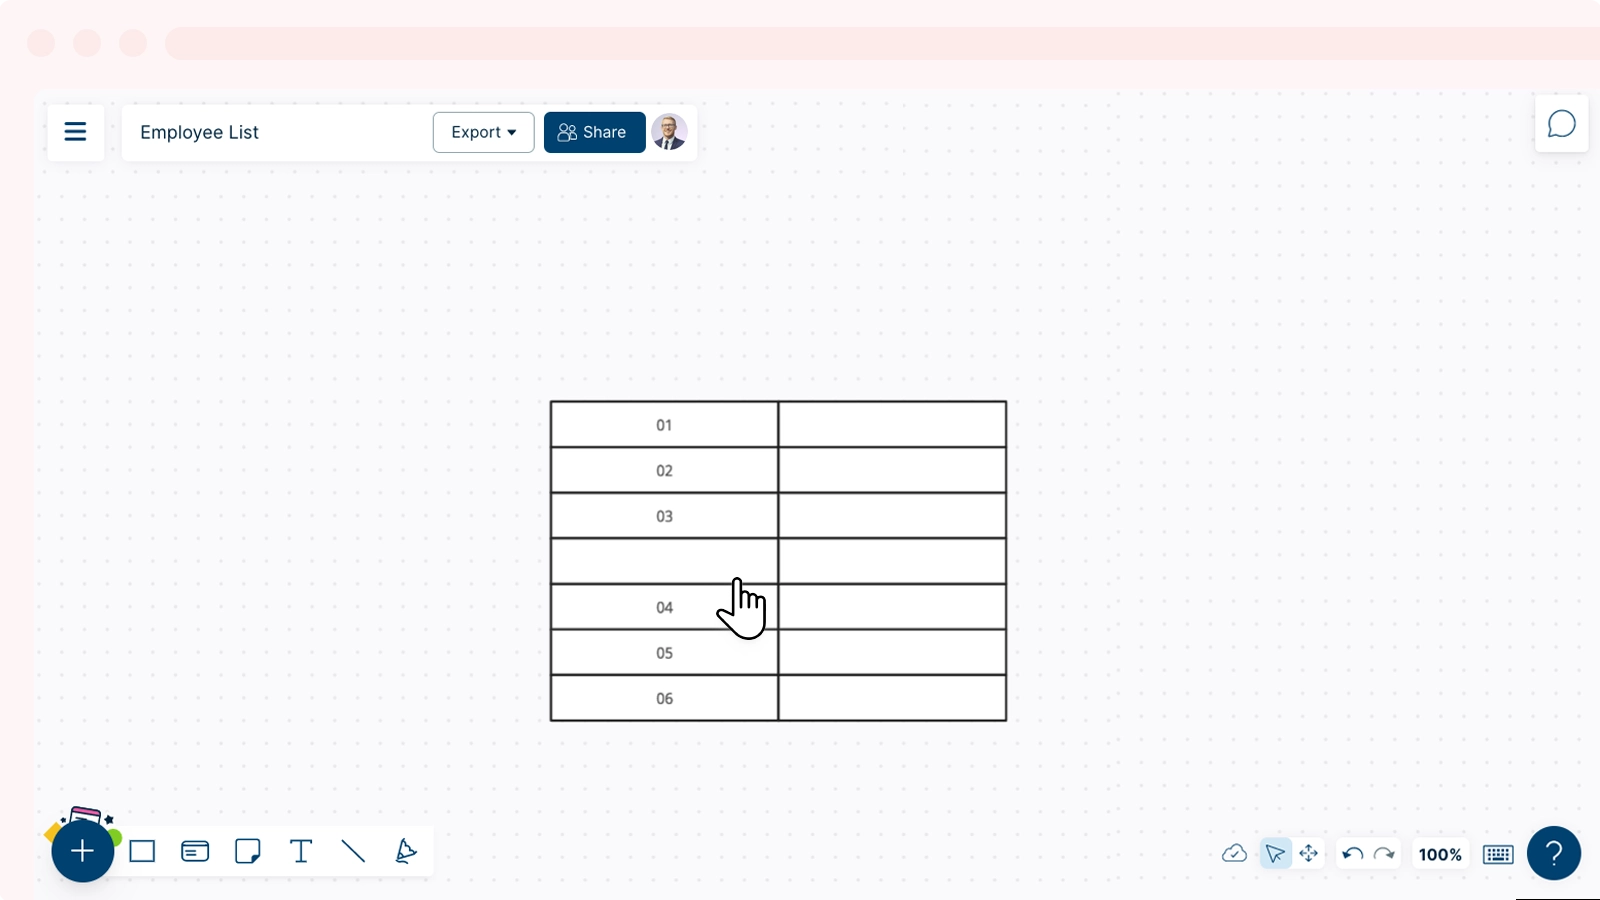
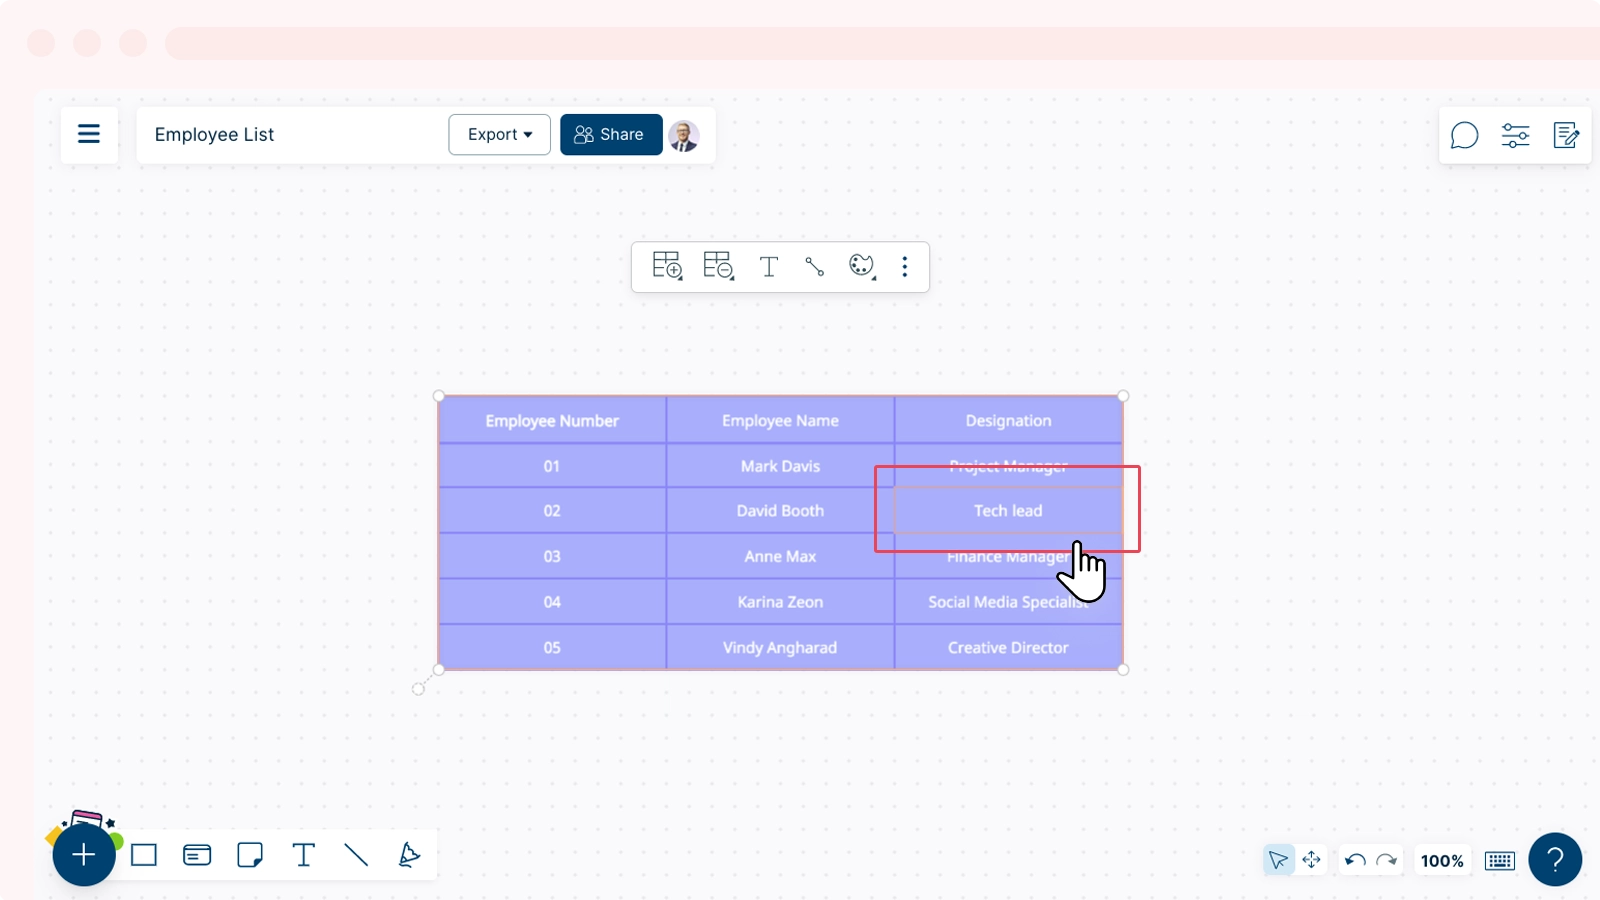
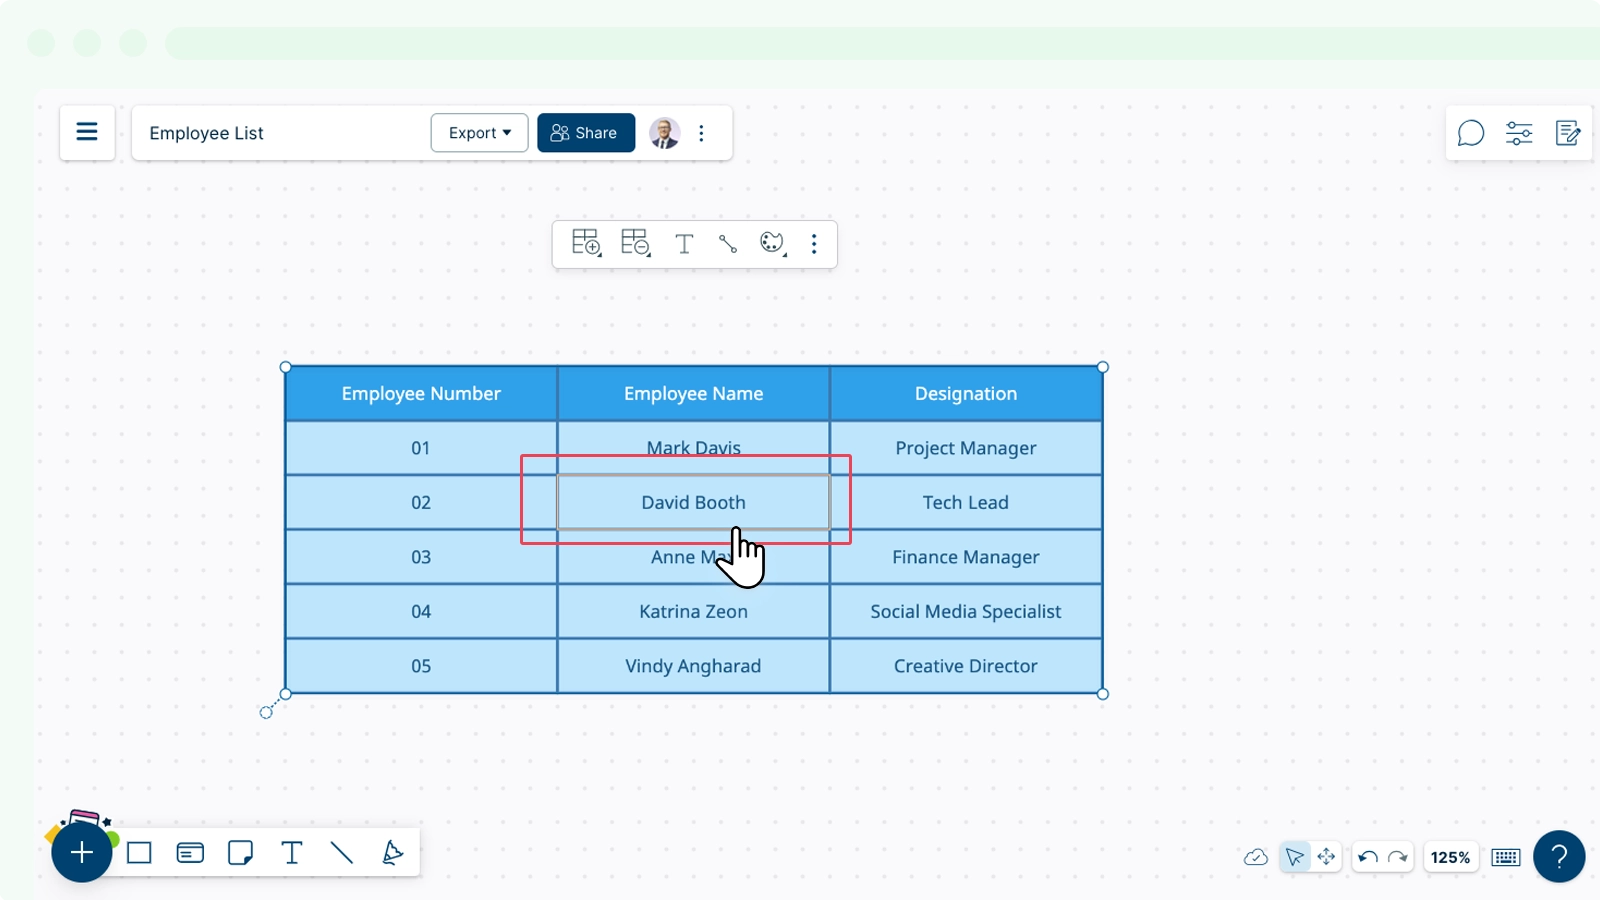
If you wish to add a row or column next to a specific row or column within the table, double click on a cell on that row or column and then add a row or column as shown below:
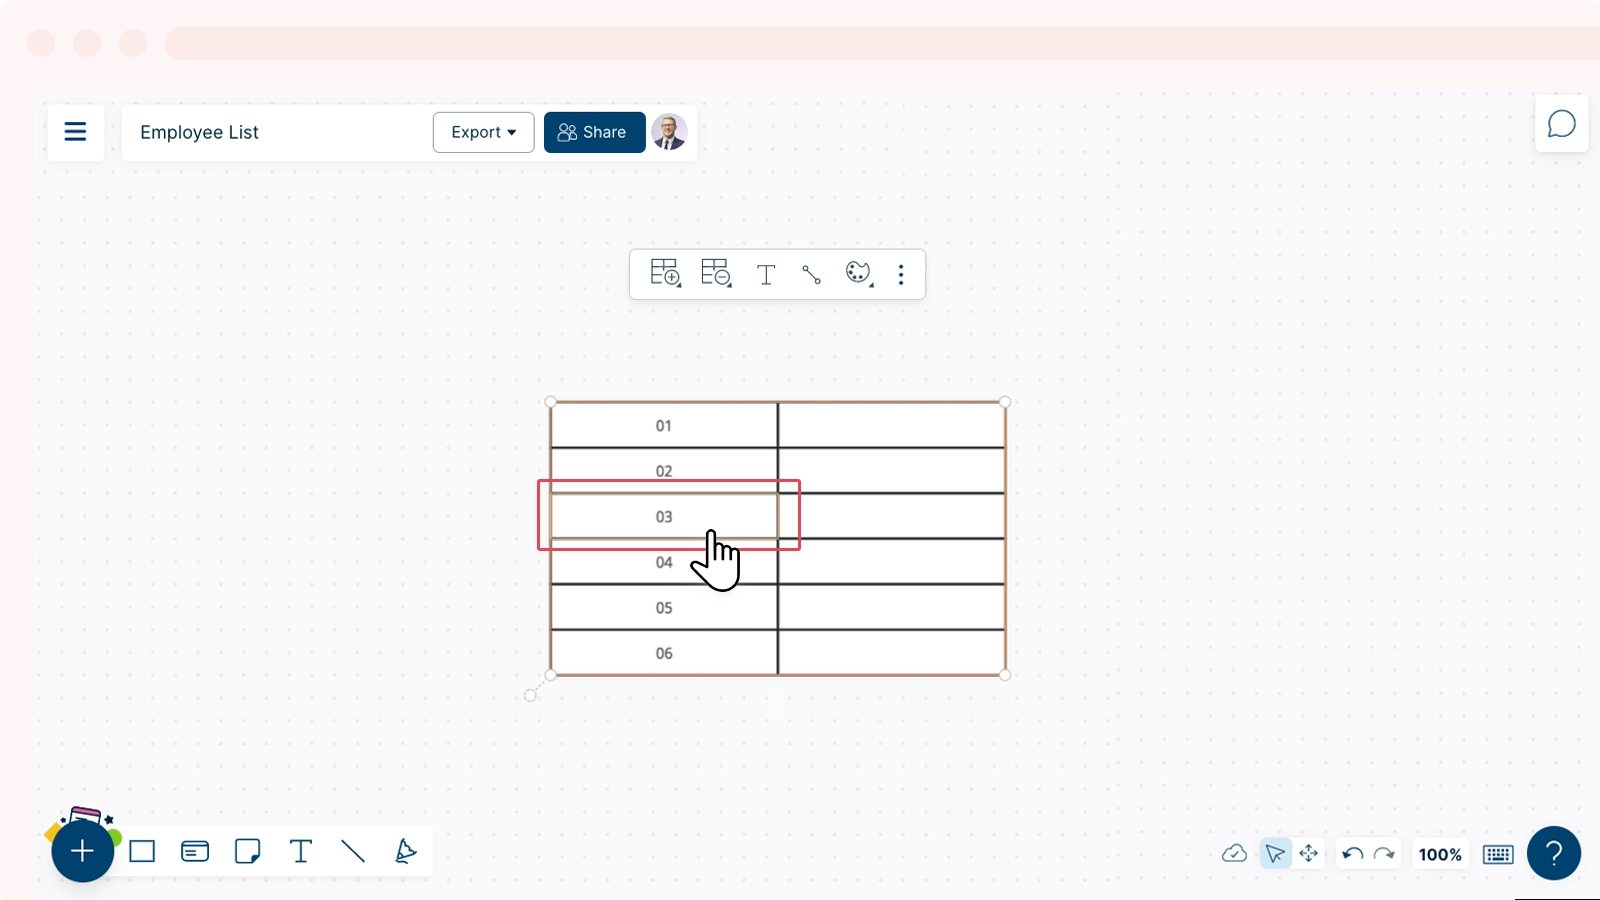
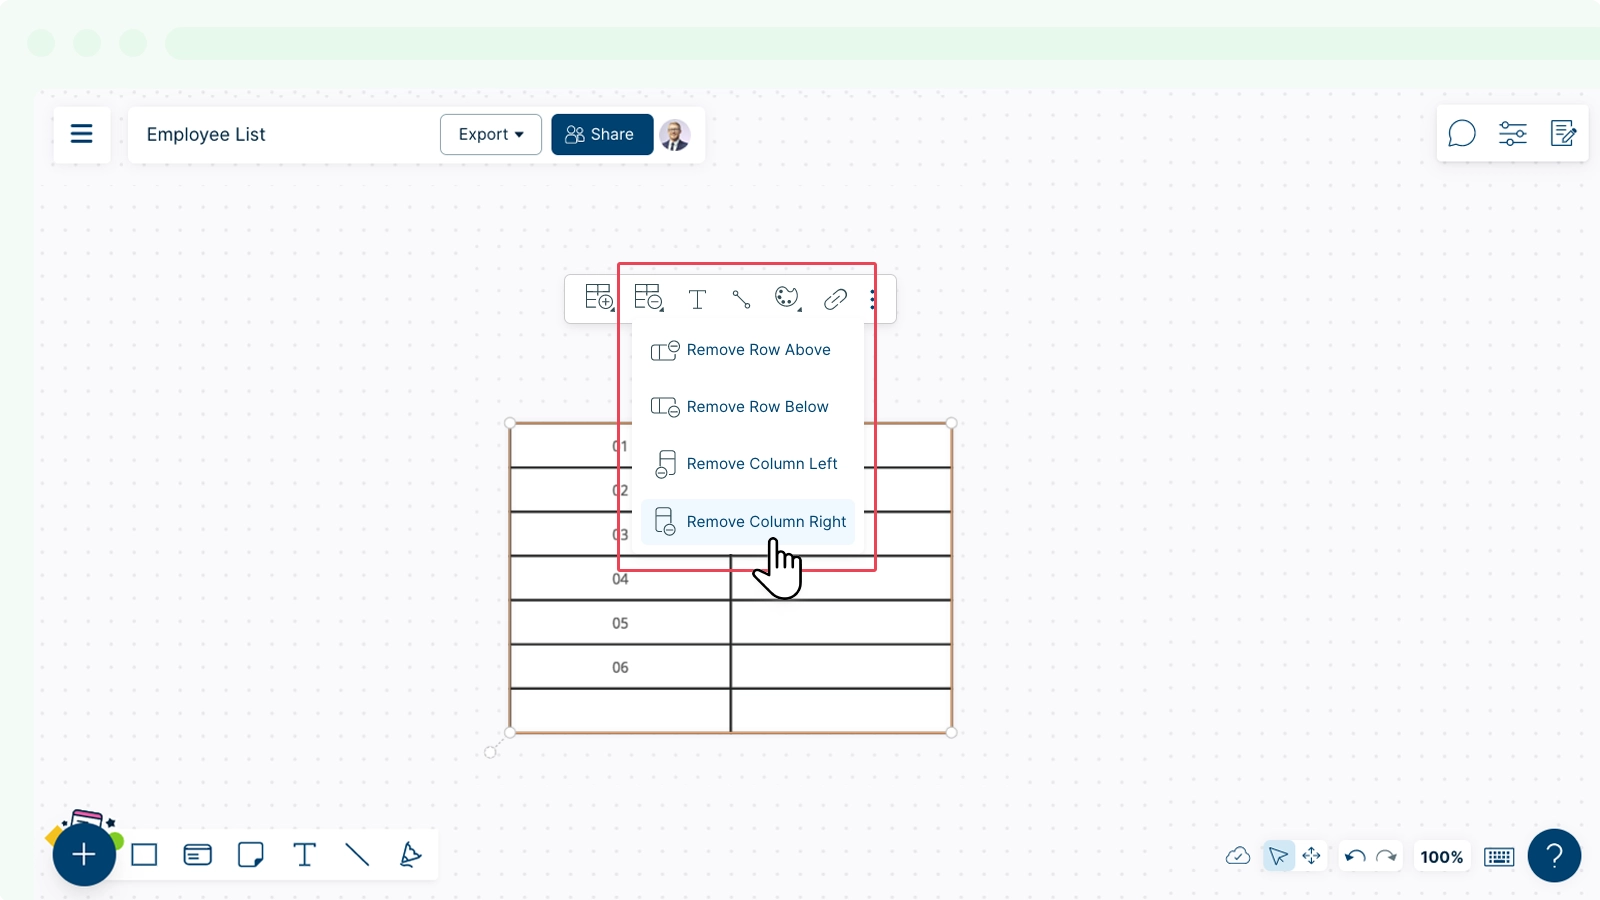
If you wish to remove a specific row or column, select a cell within that row or column and remove as shown below:
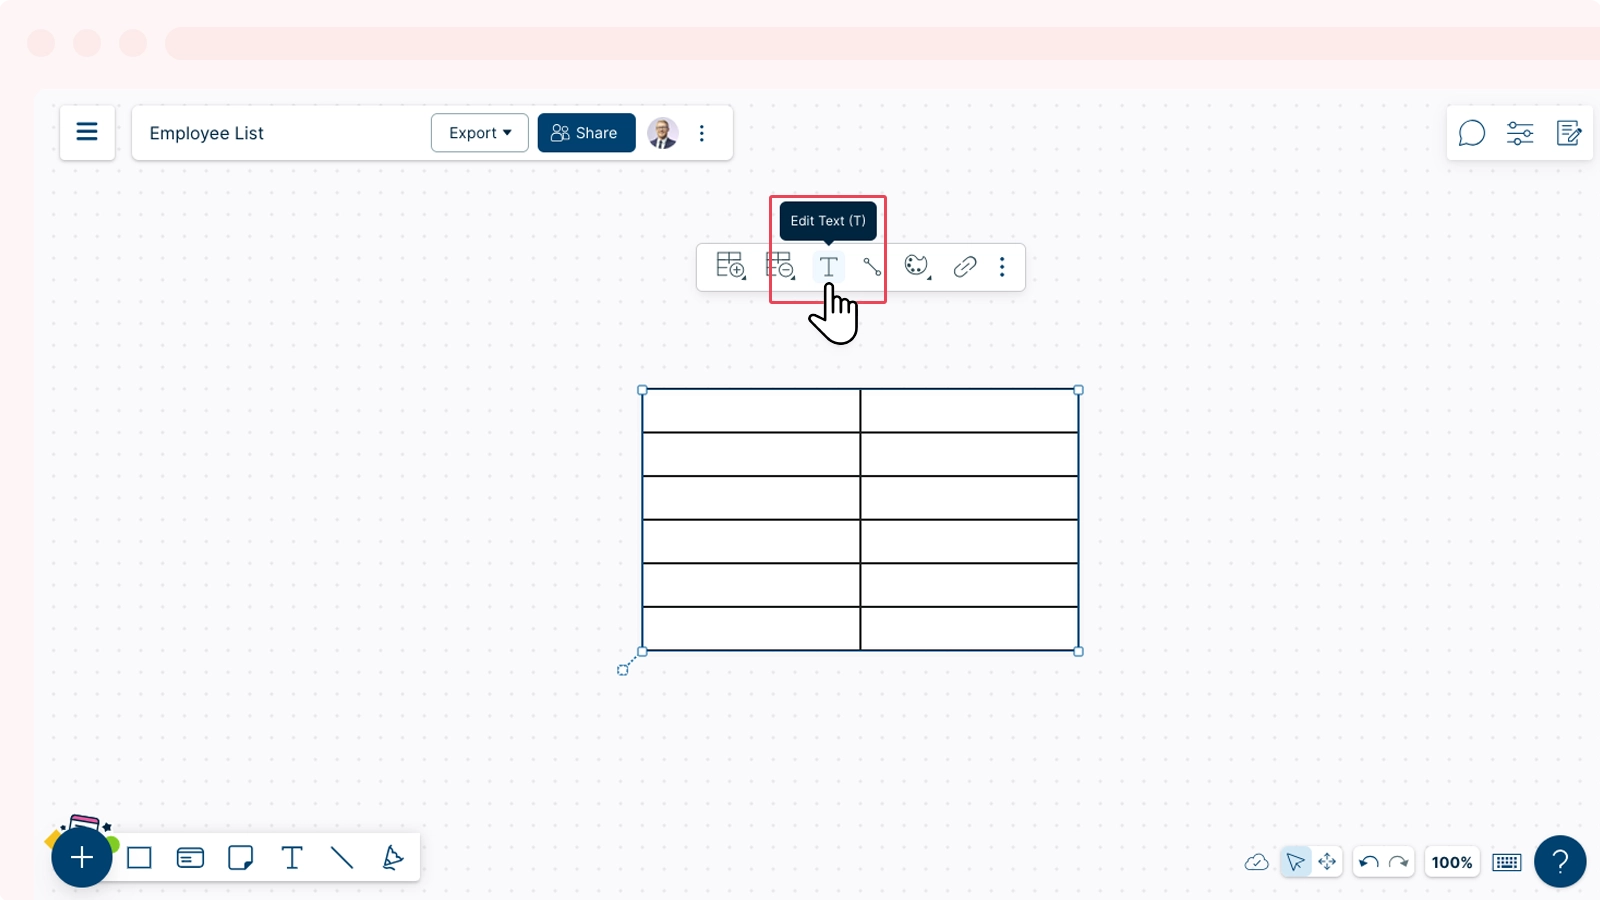
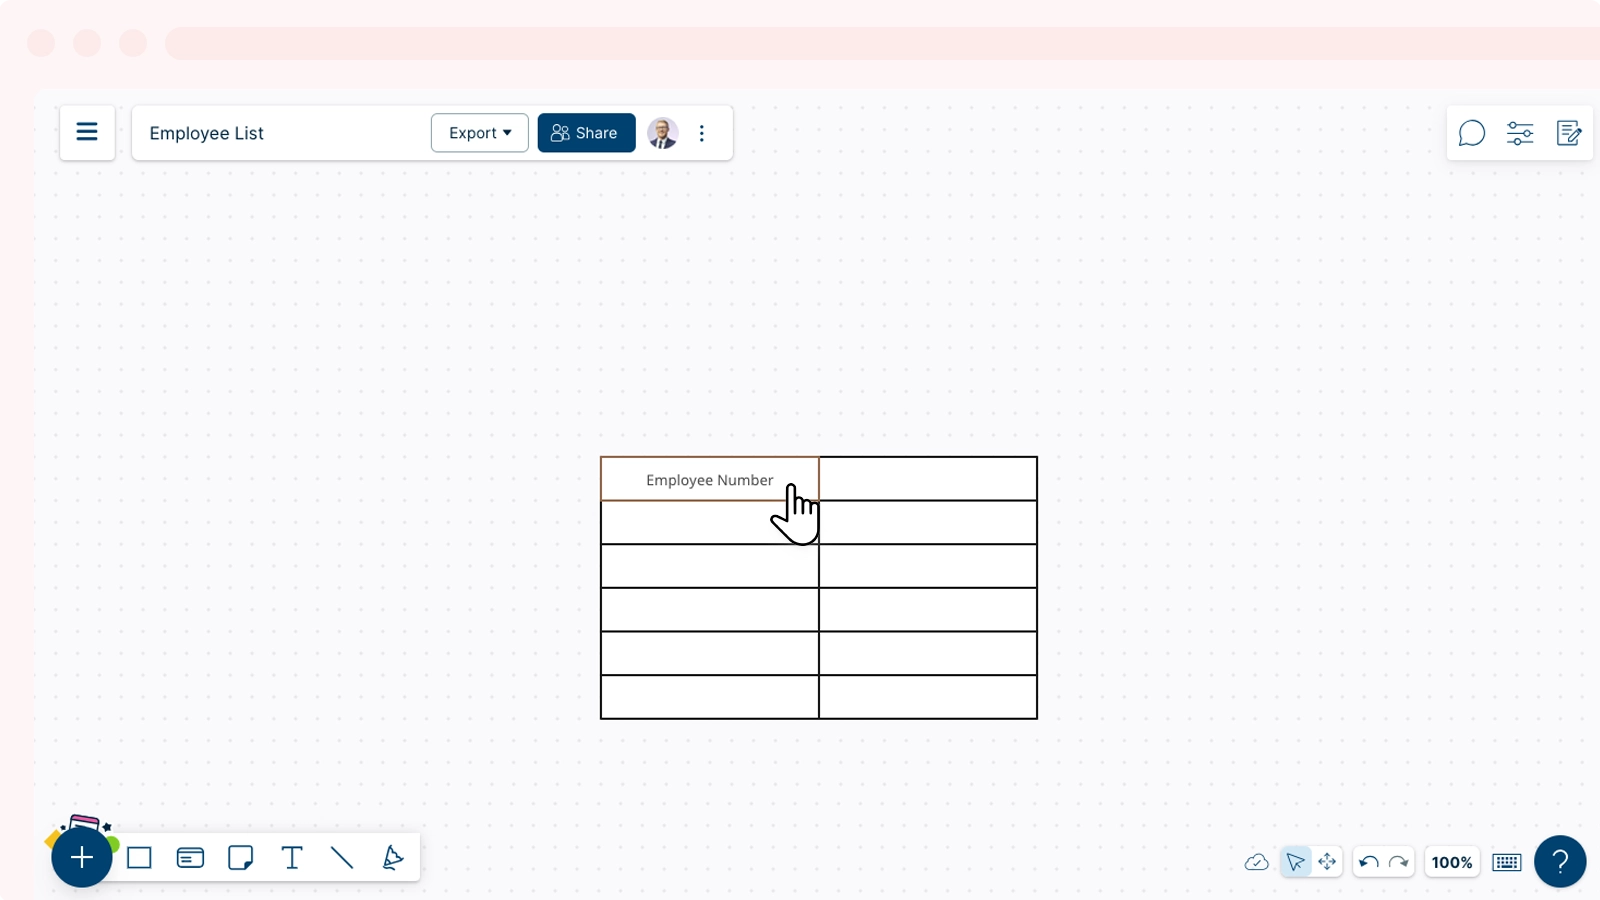
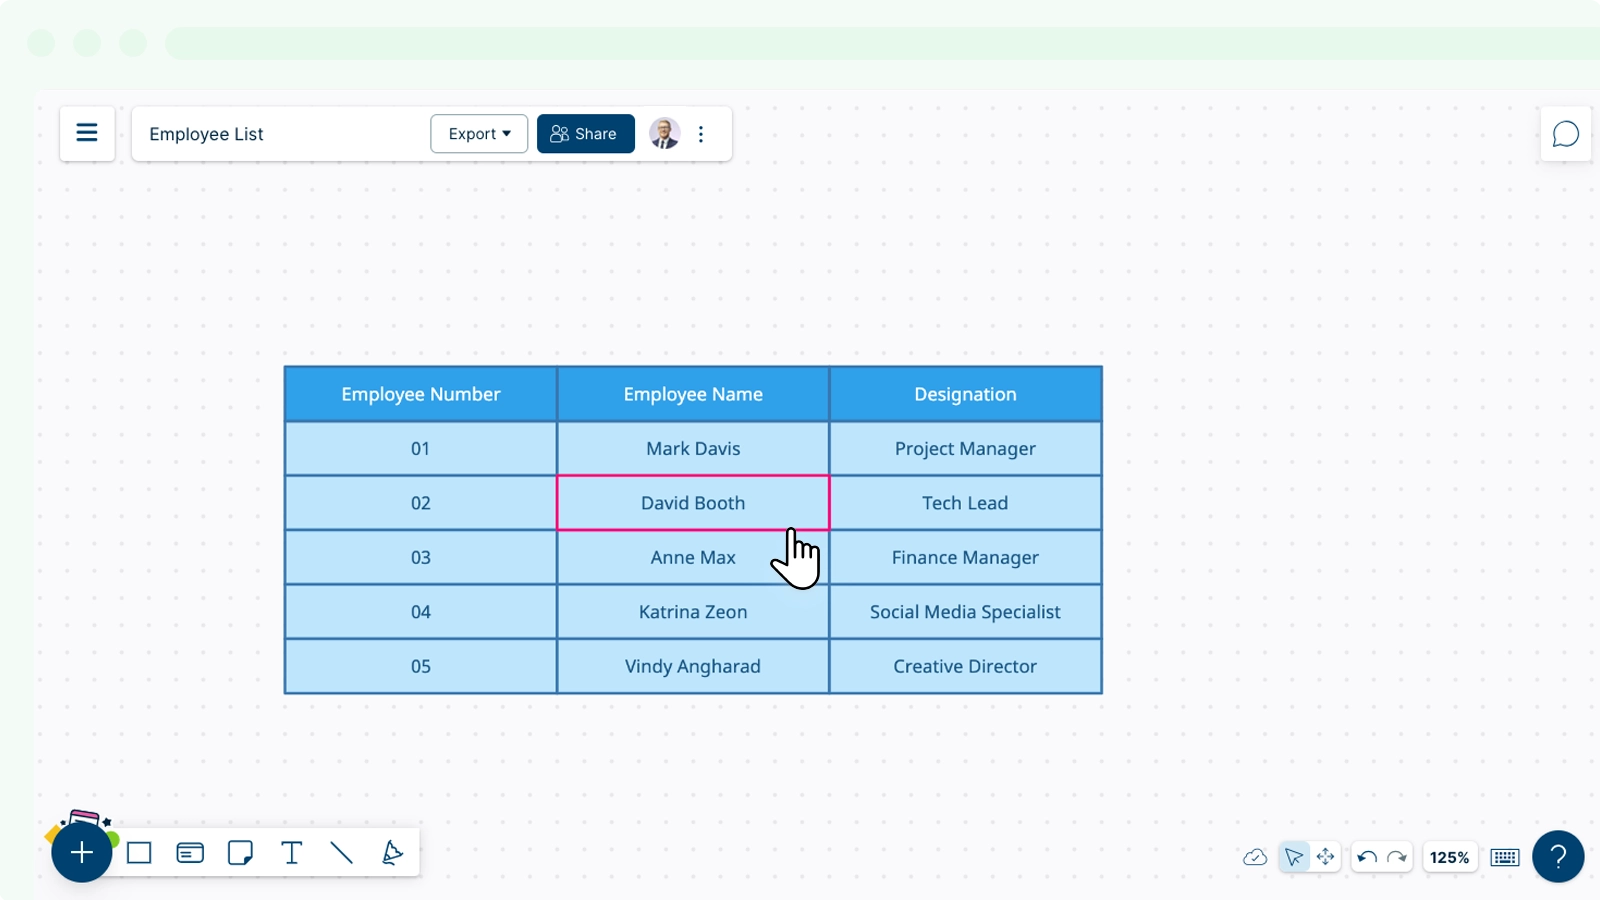
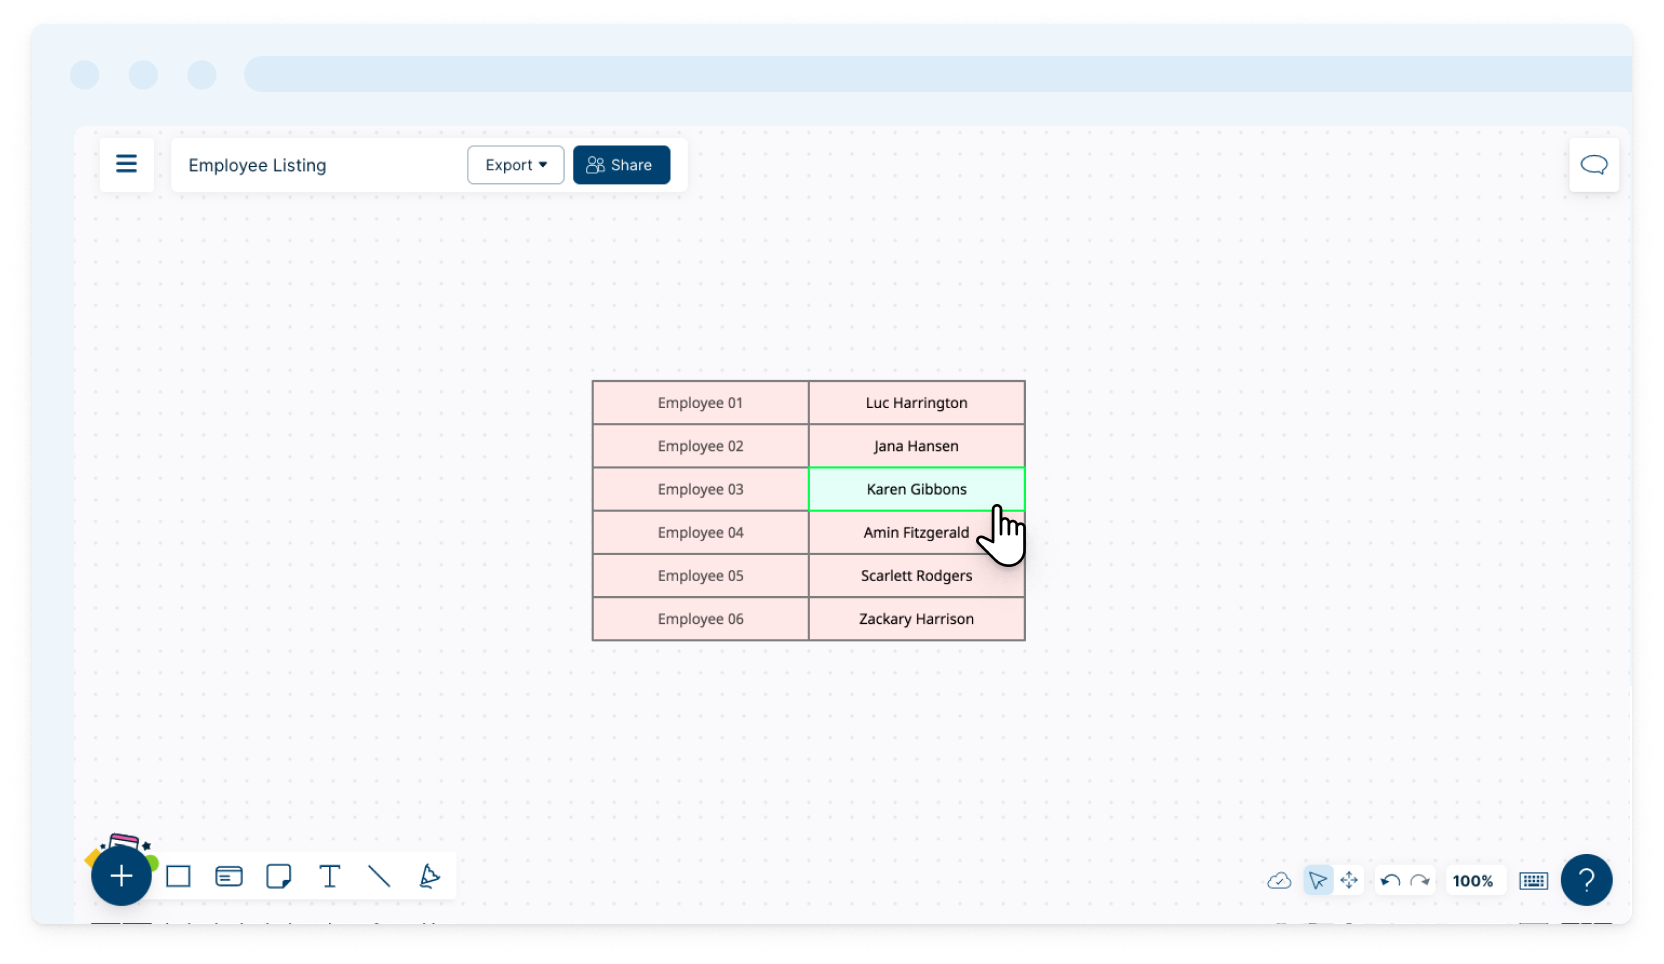
Adding Text to a Cell
Double click on the cell you want to add text or select the cell and click ![]() Text option on the contextual toolbar.
Text option on the contextual toolbar.
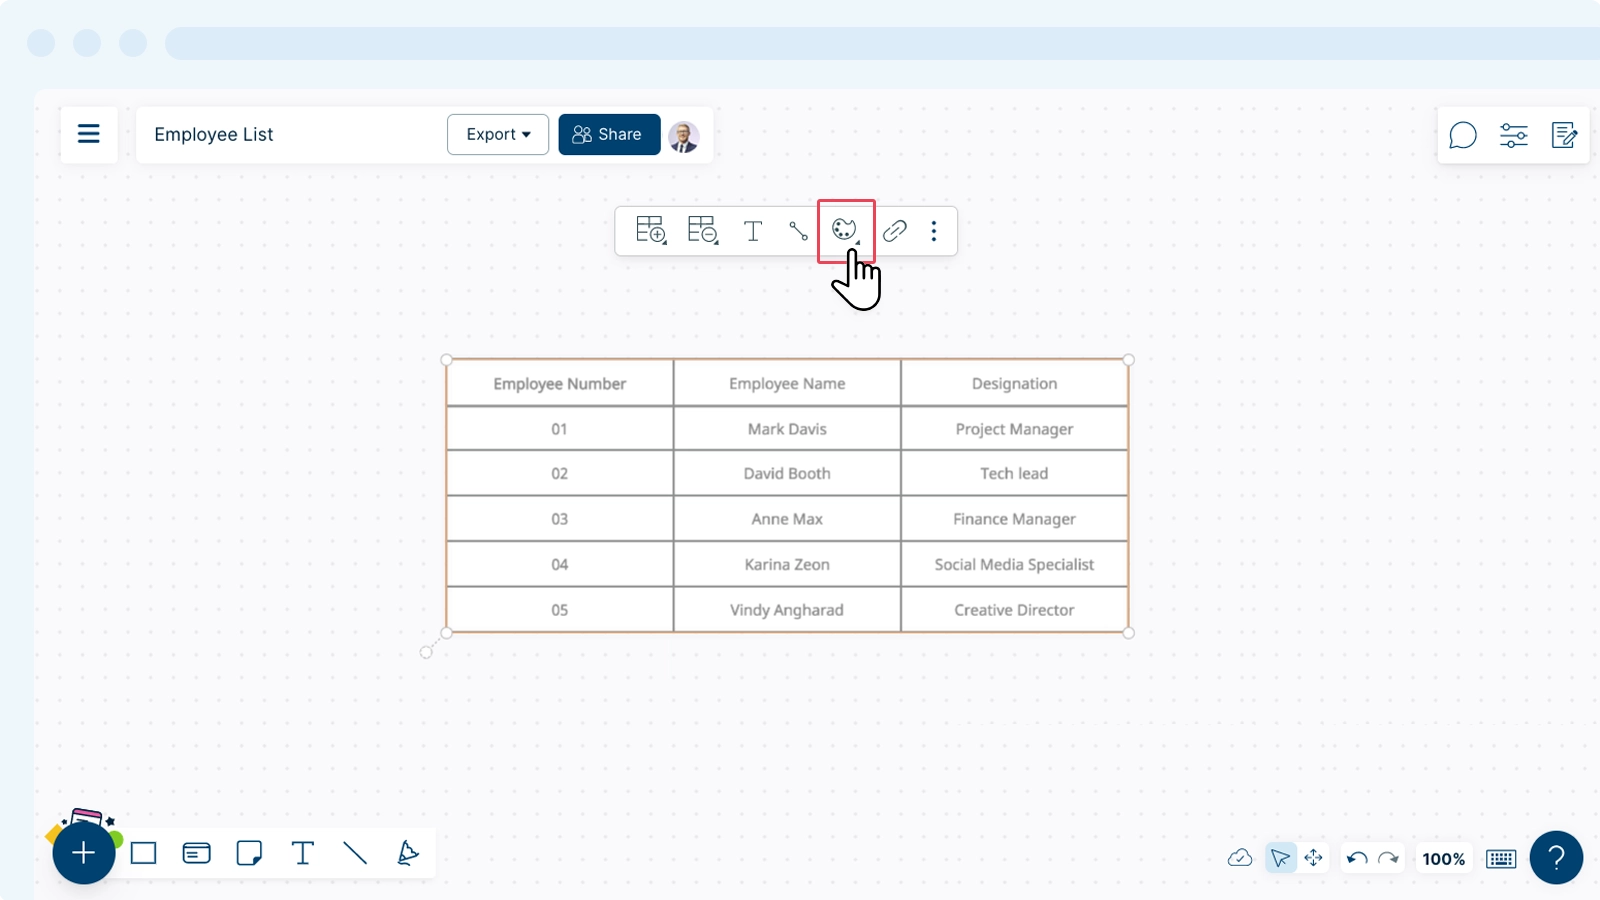
Adding Color to the Table
You can add color to the entire table using the contextual toolbar by selecting the ![]() Style icon. You can also select the table and open the
Style icon. You can also select the table and open the ![]() Shape properties panel on the right menu.
Shape properties panel on the right menu.
Method 1: Adding Color Using the Contextual Toolbar
- Select the entire table.
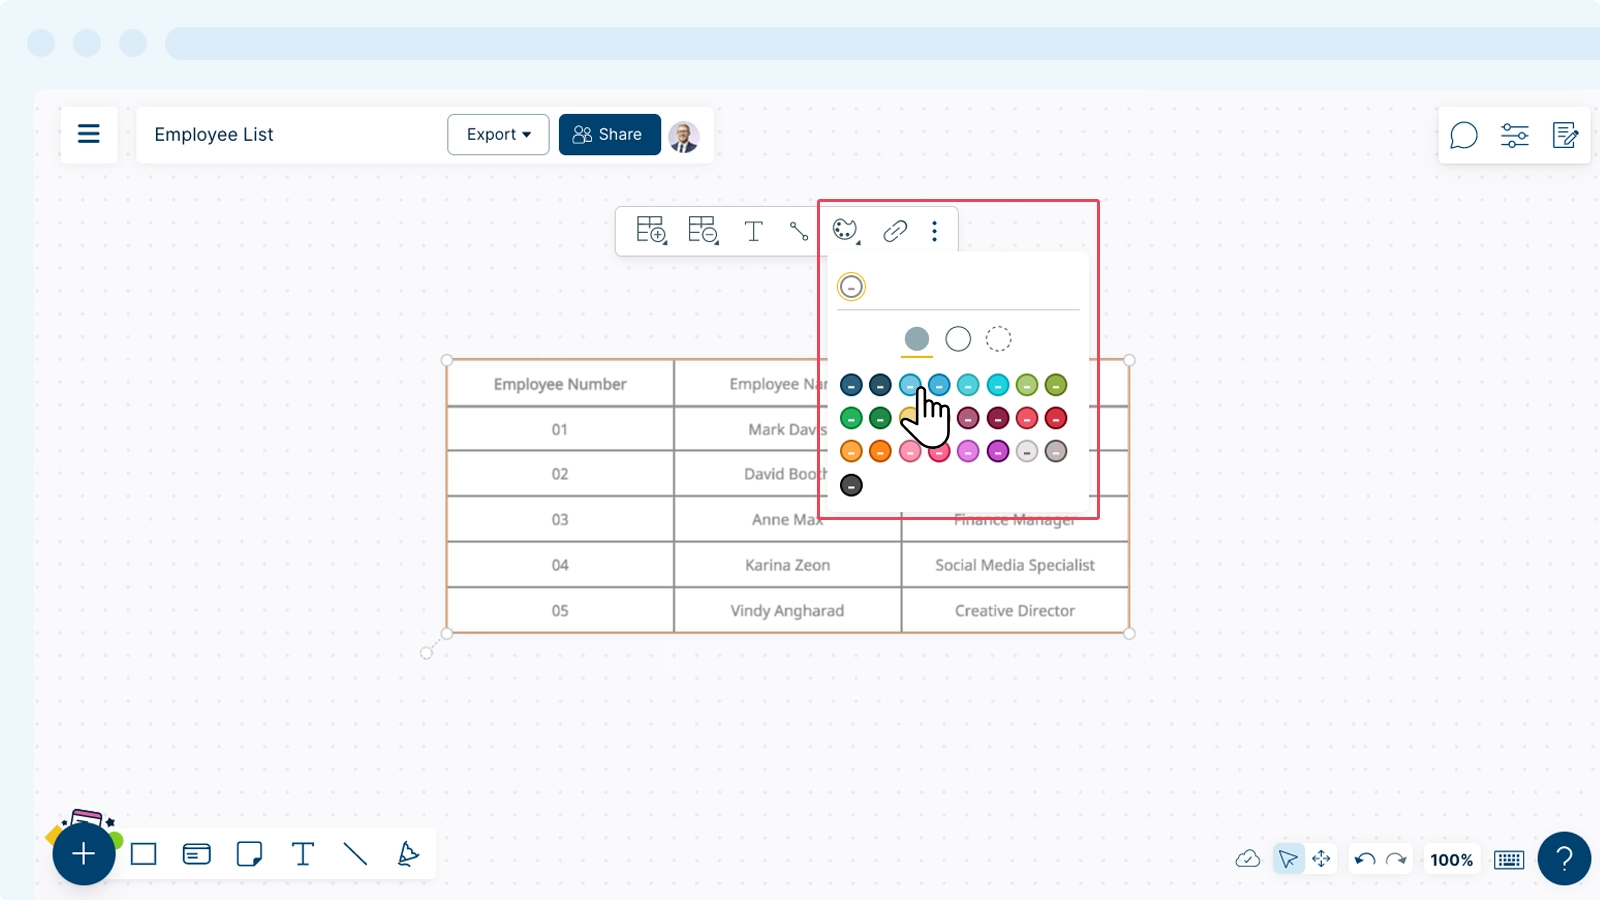
- Click the
 color icon on the contextual toolbar.
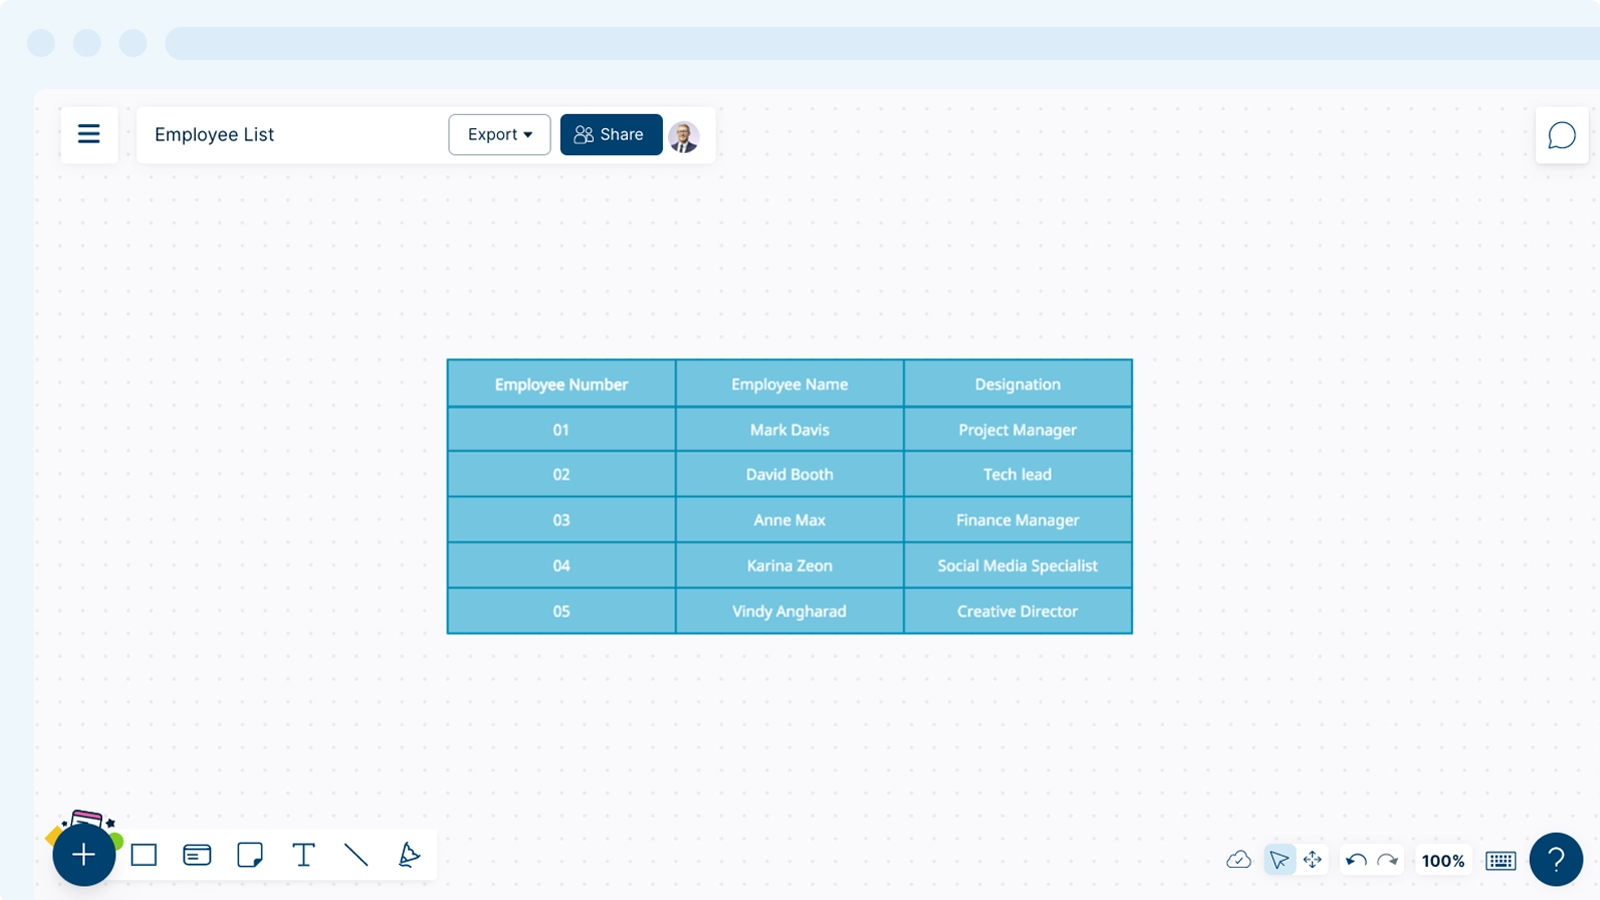
 - Select the color you prefer.
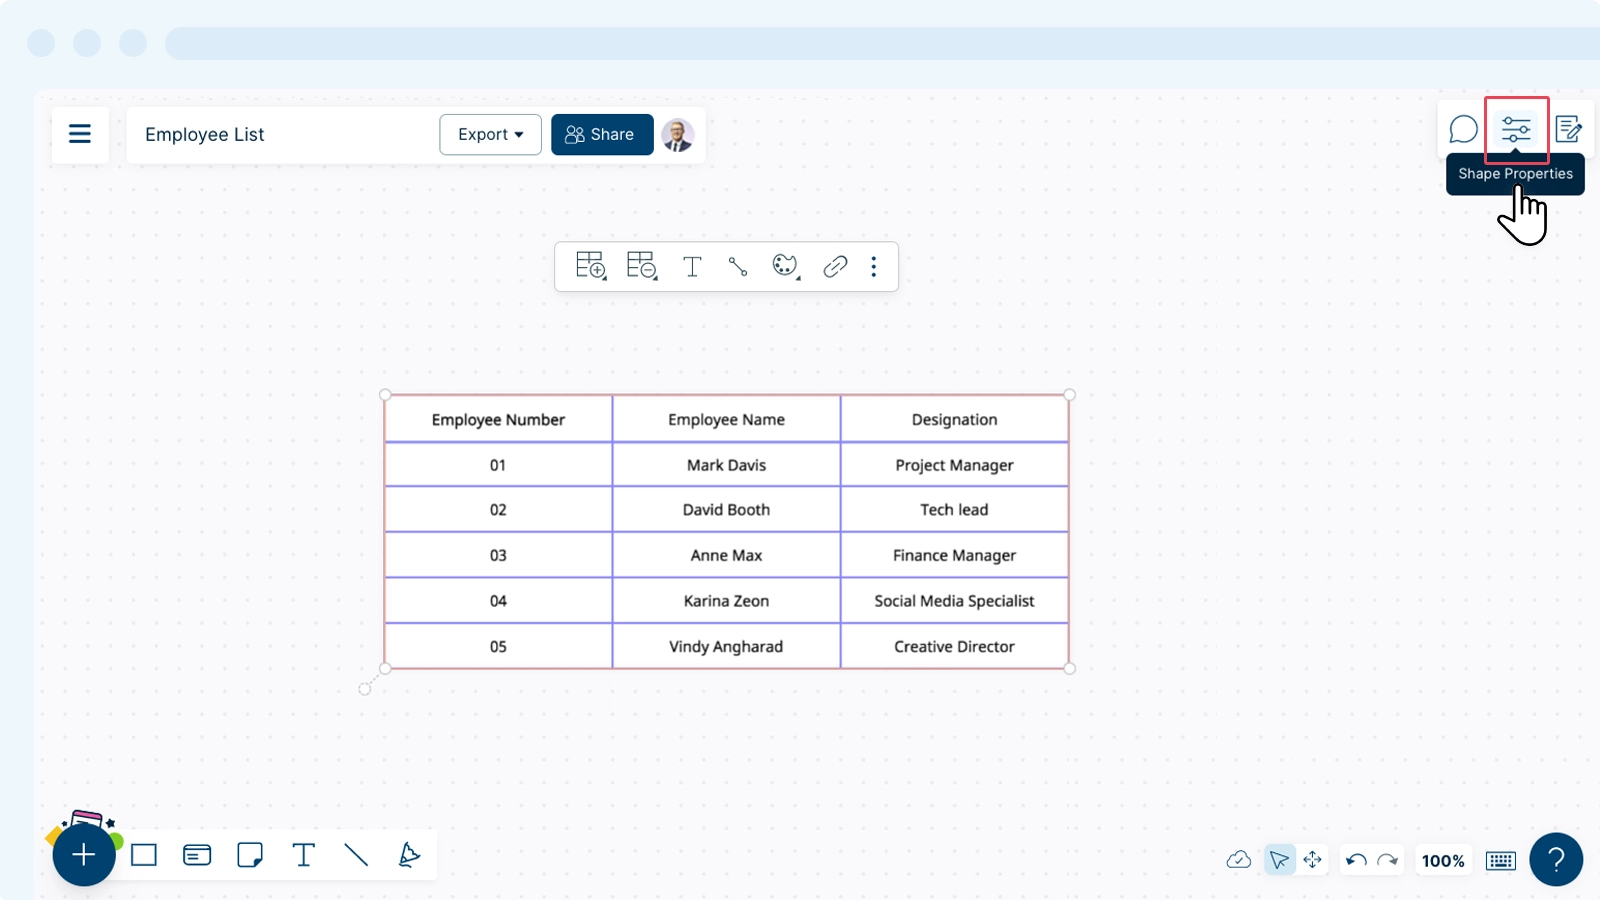
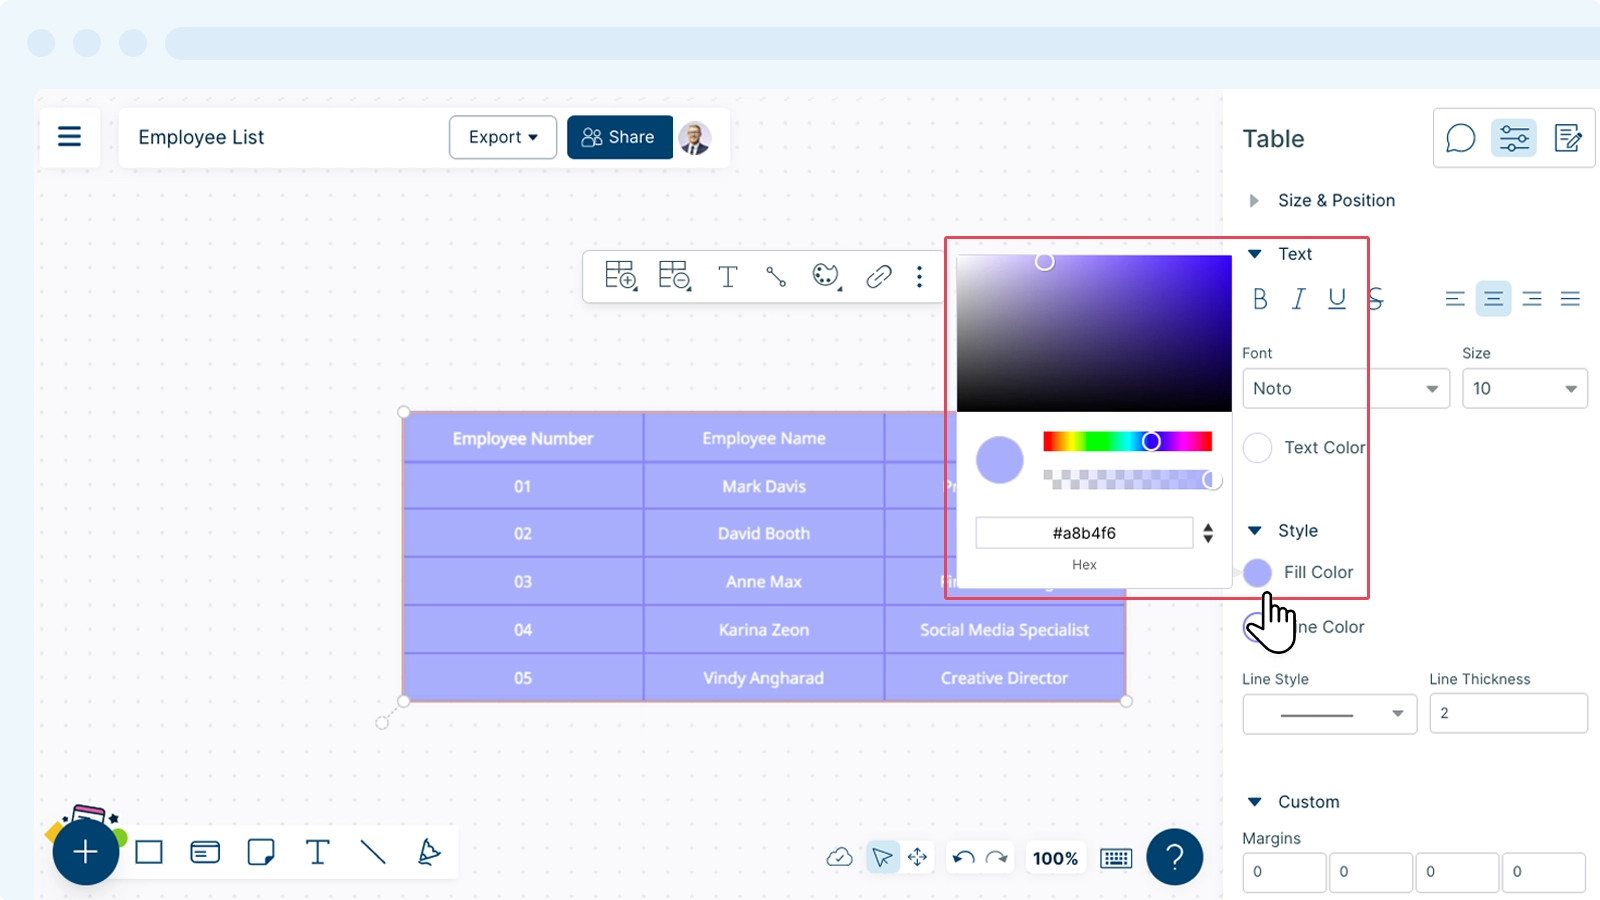
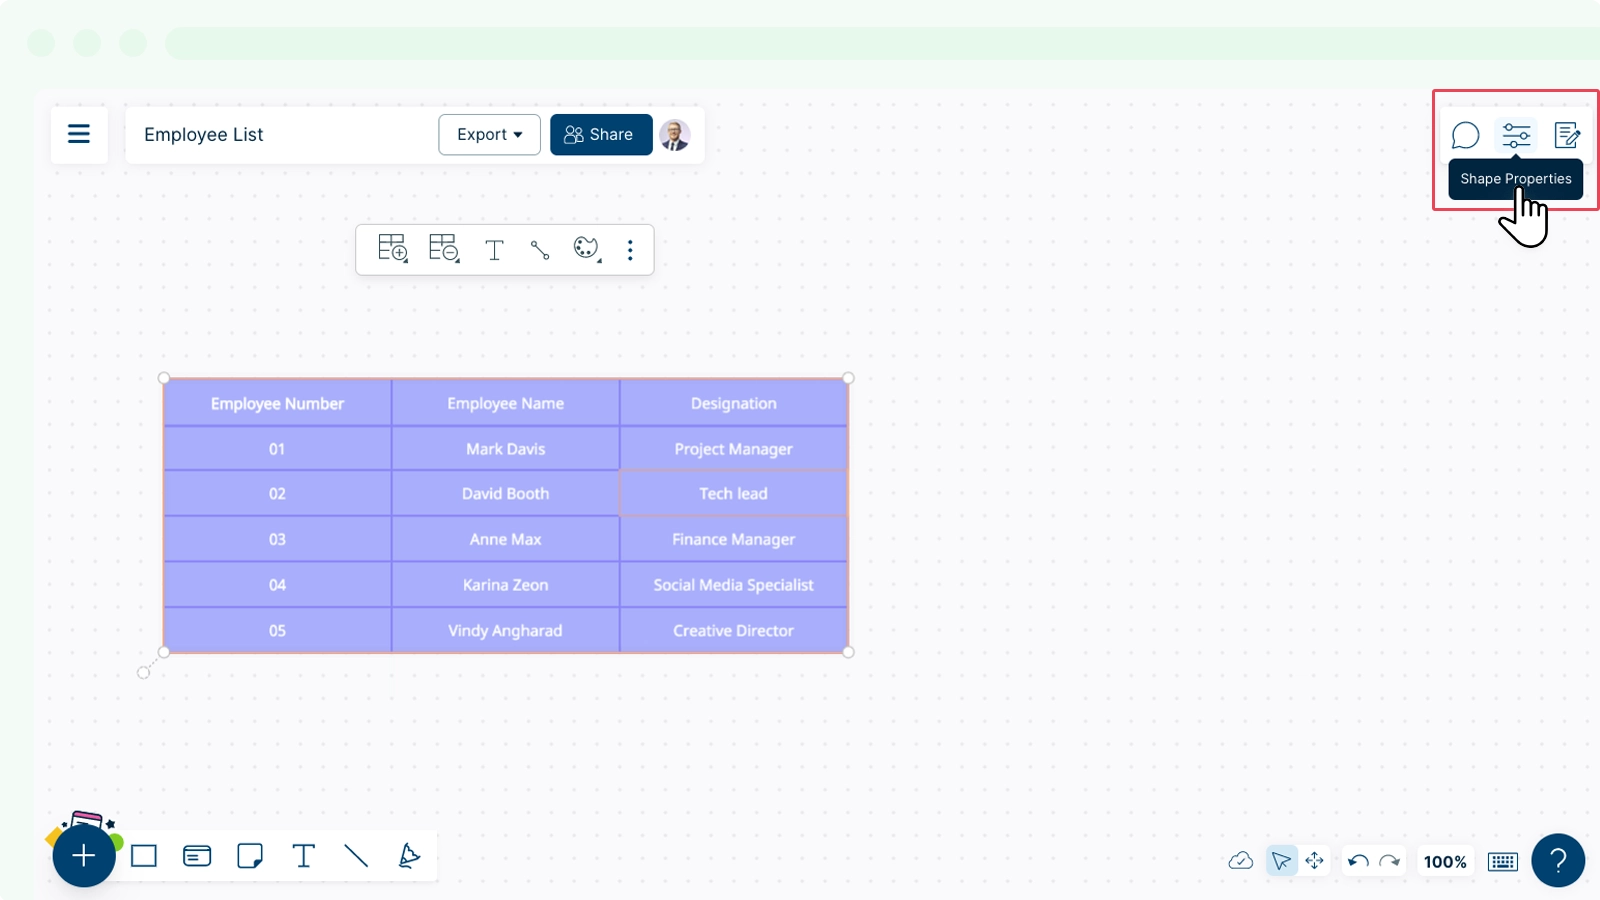
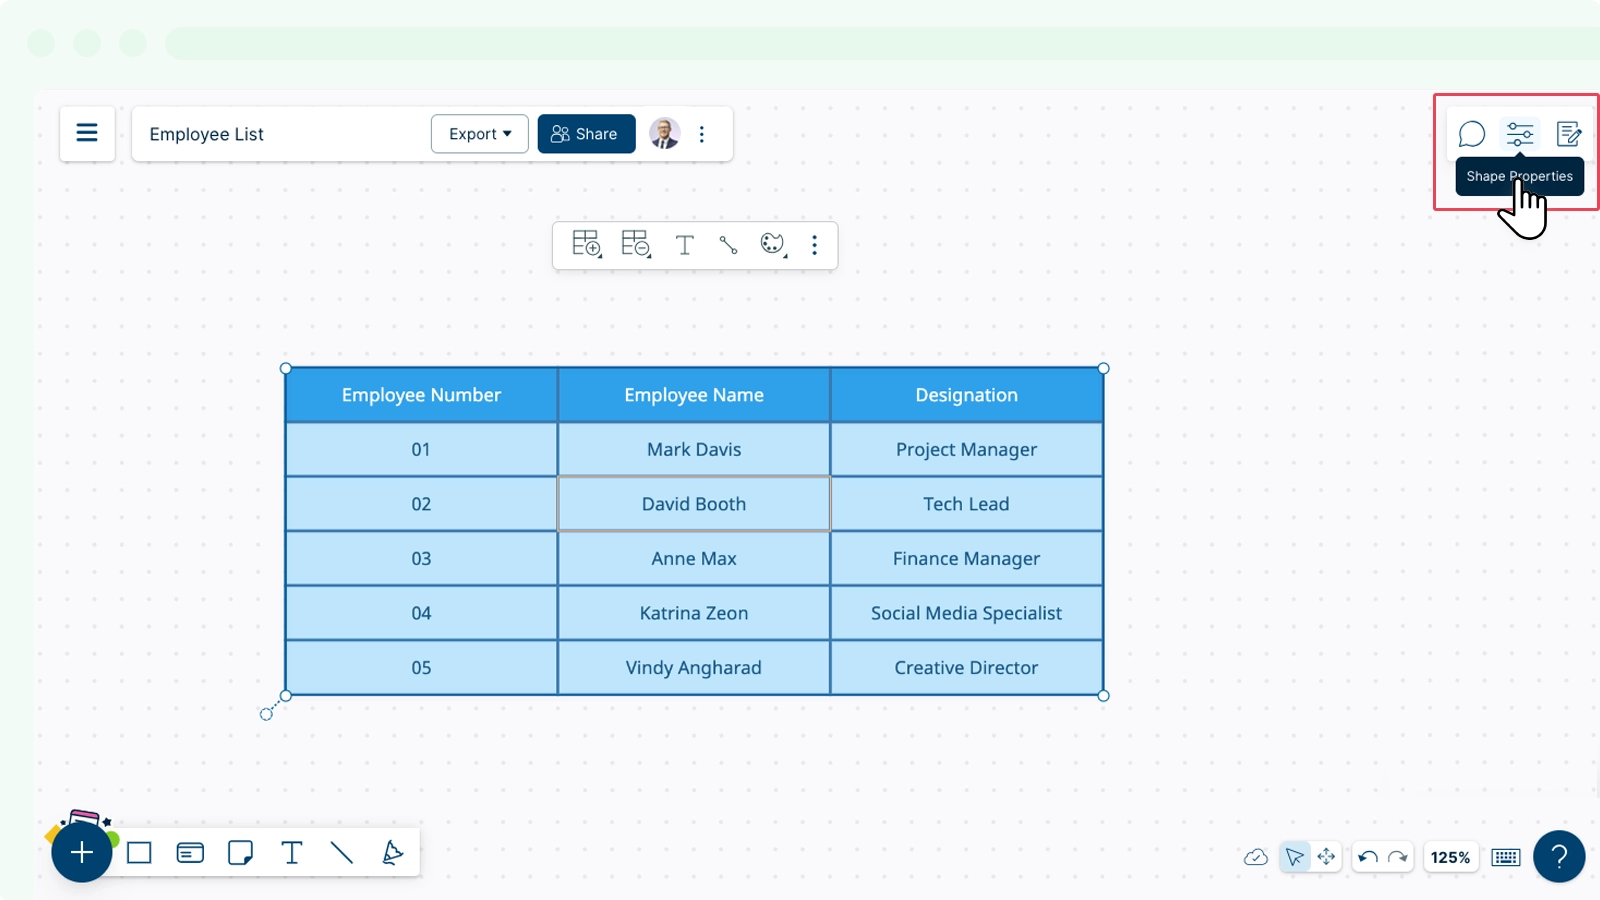
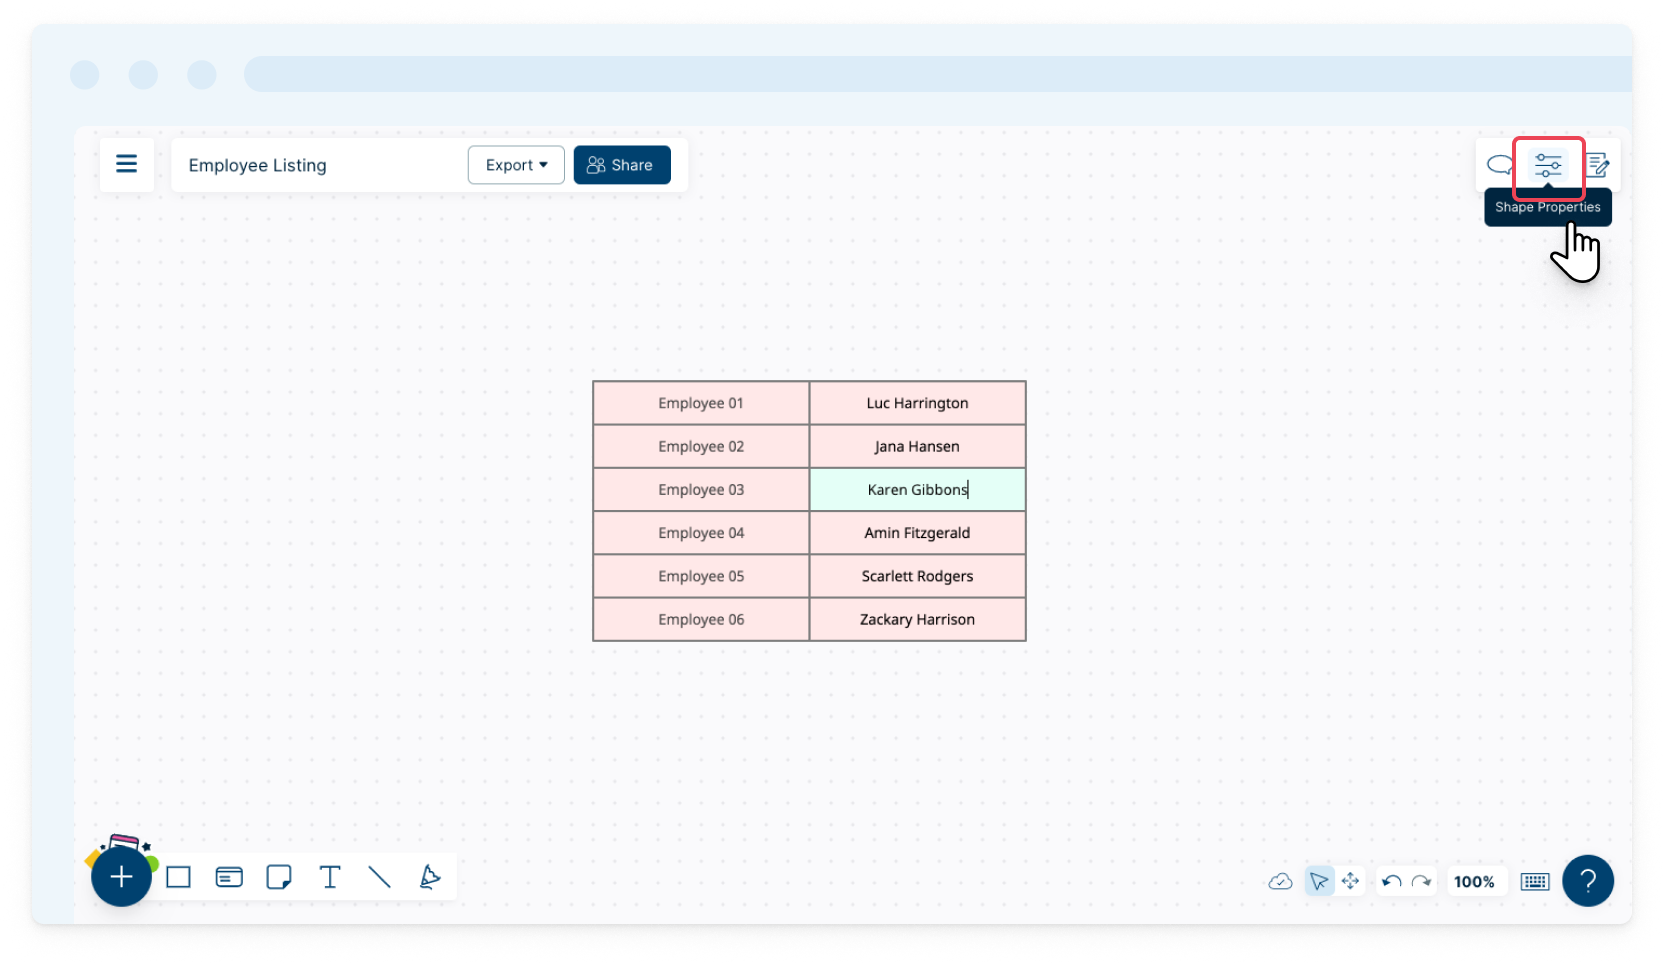
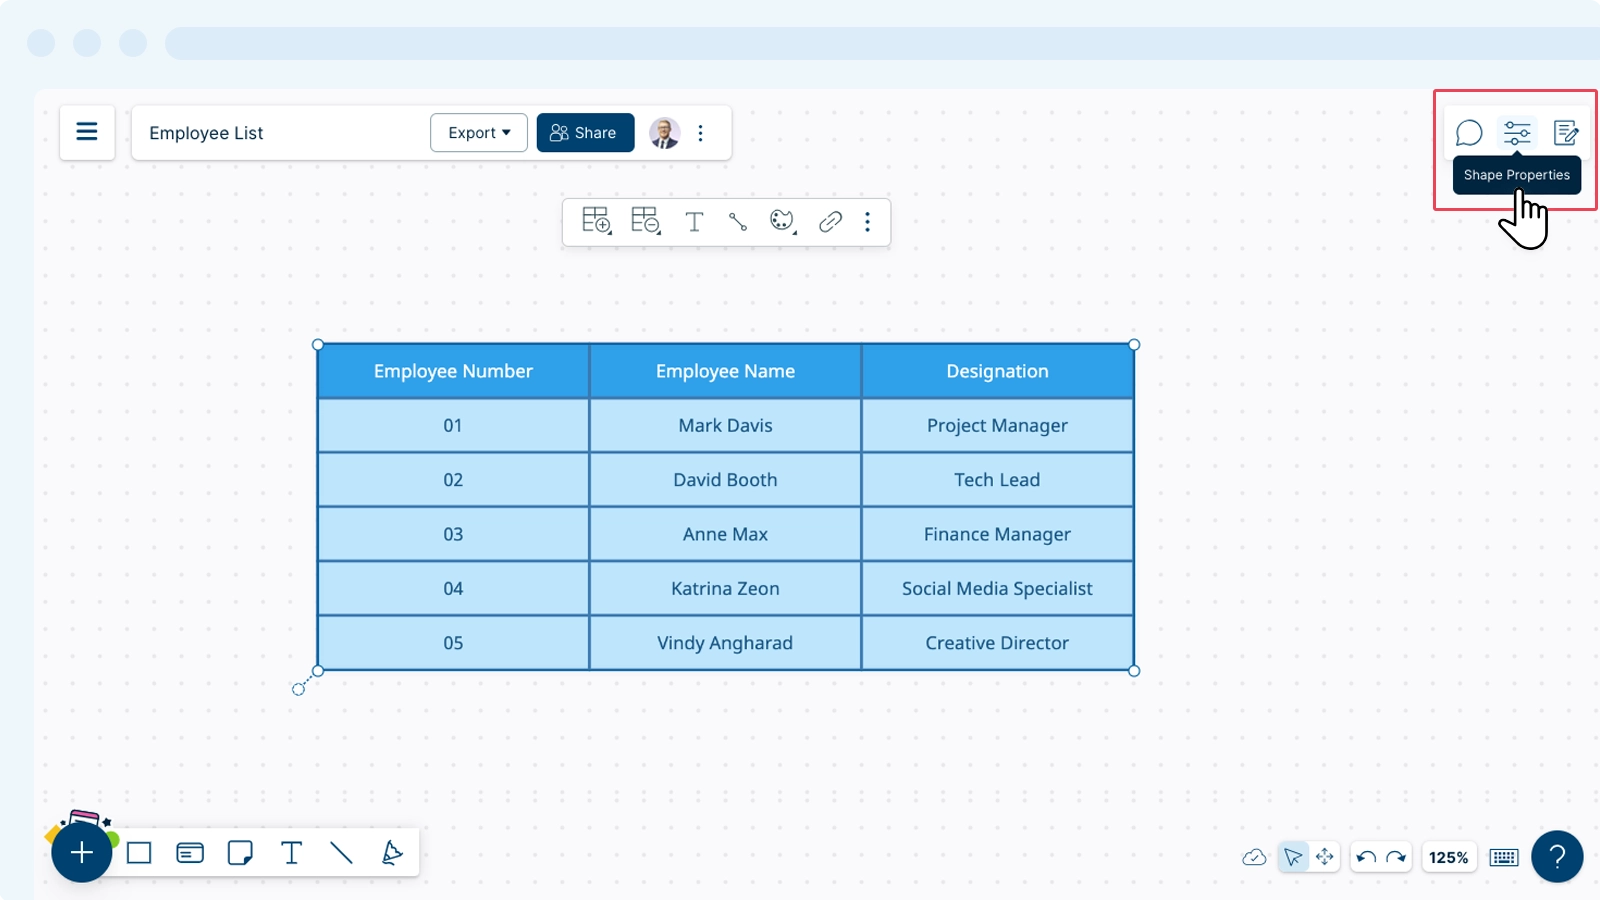
Method 2: Adding Color Using Shape Properties
- Select the entire table.
- Go to
 Shape Properties.
 - Click Fill Color and drag the cursor to select the color you prefer on the color board or type in the relevant color code and press Enter.
Adding Color to a Cell
You can add color to a specific cell using the contextual toolbar by selecting the ![]() Style icon. You can also select the table and open the
Style icon. You can also select the table and open the ![]() Shape properties panel on the right menu.
Shape properties panel on the right menu.
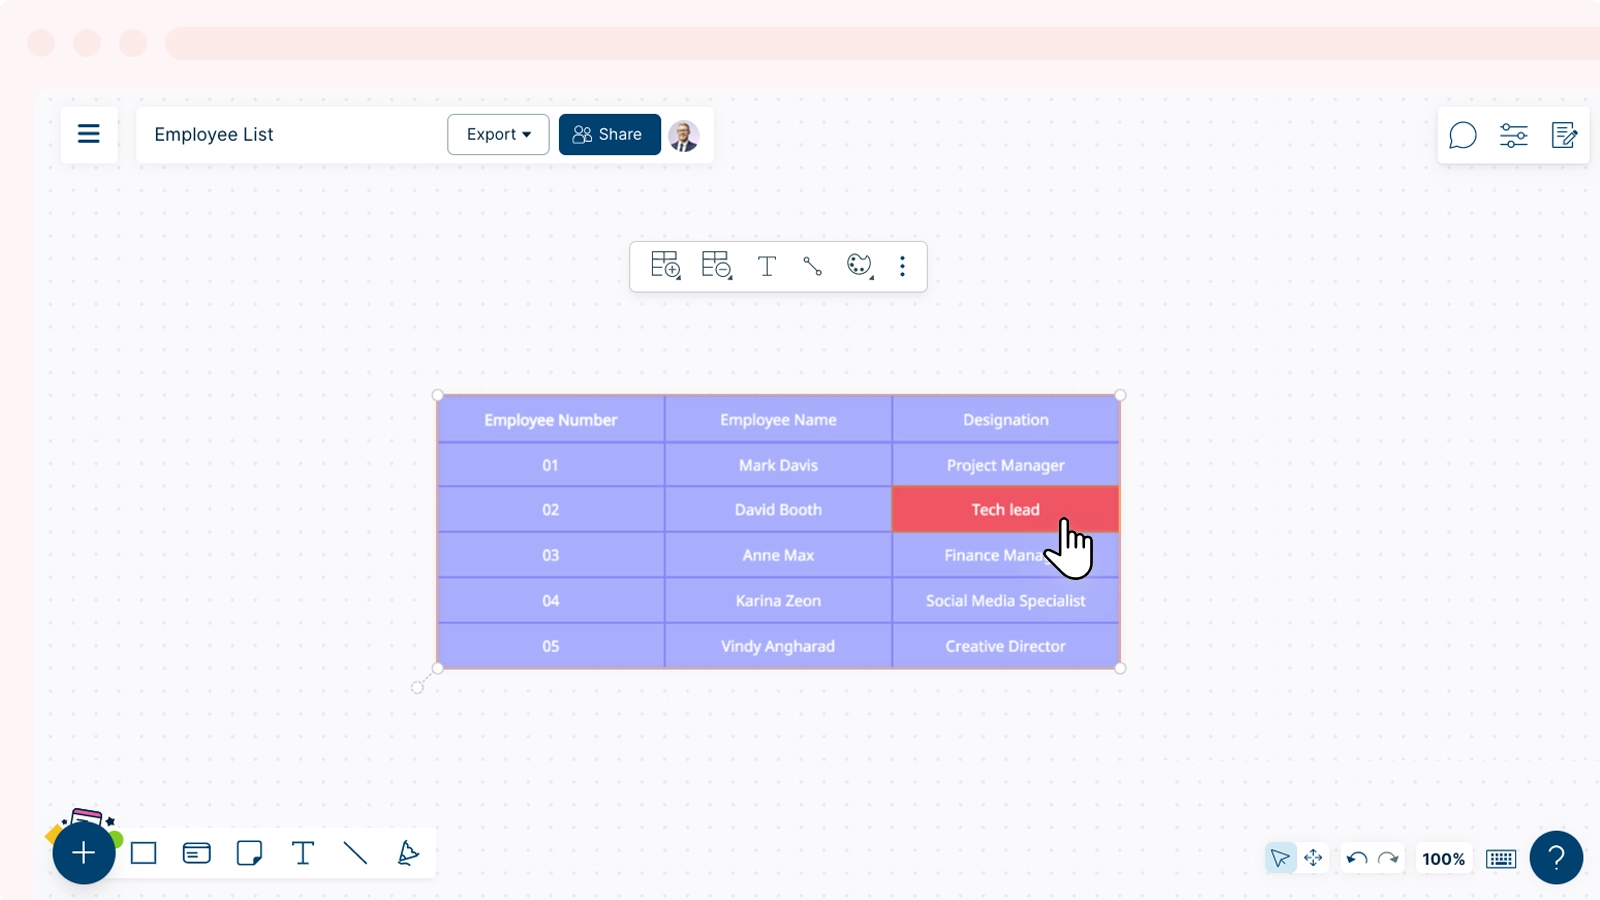
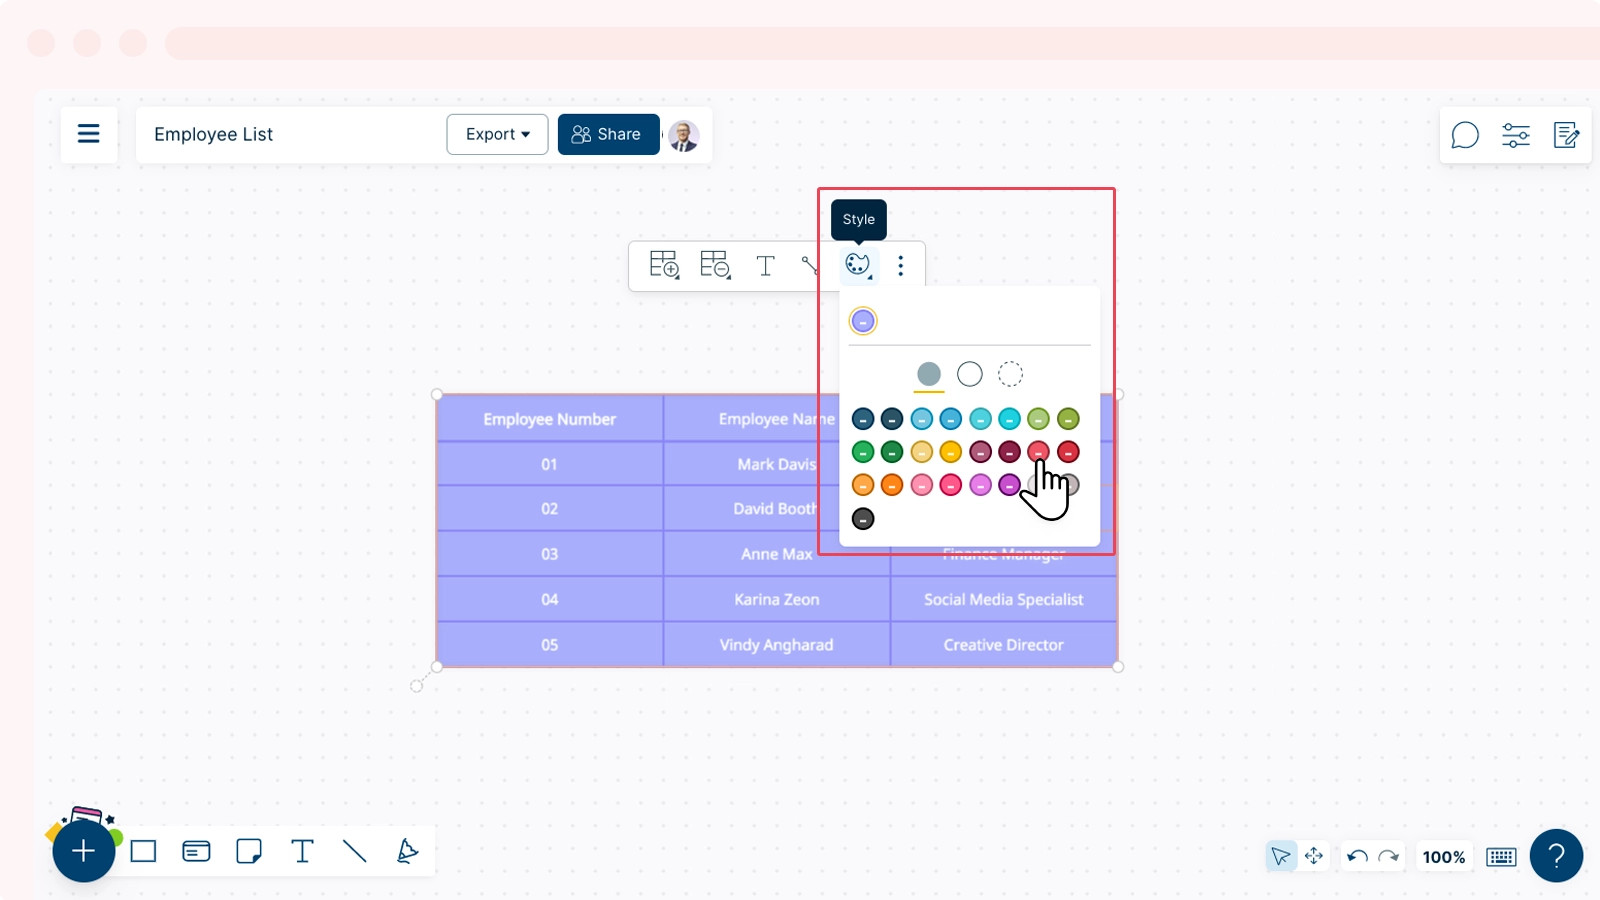
Method 1: Adding Color Using the Contextual Toolbar
- Select the specific cell.
- Click the color icon on the contextual toolbar.
- Select the color you prefer.
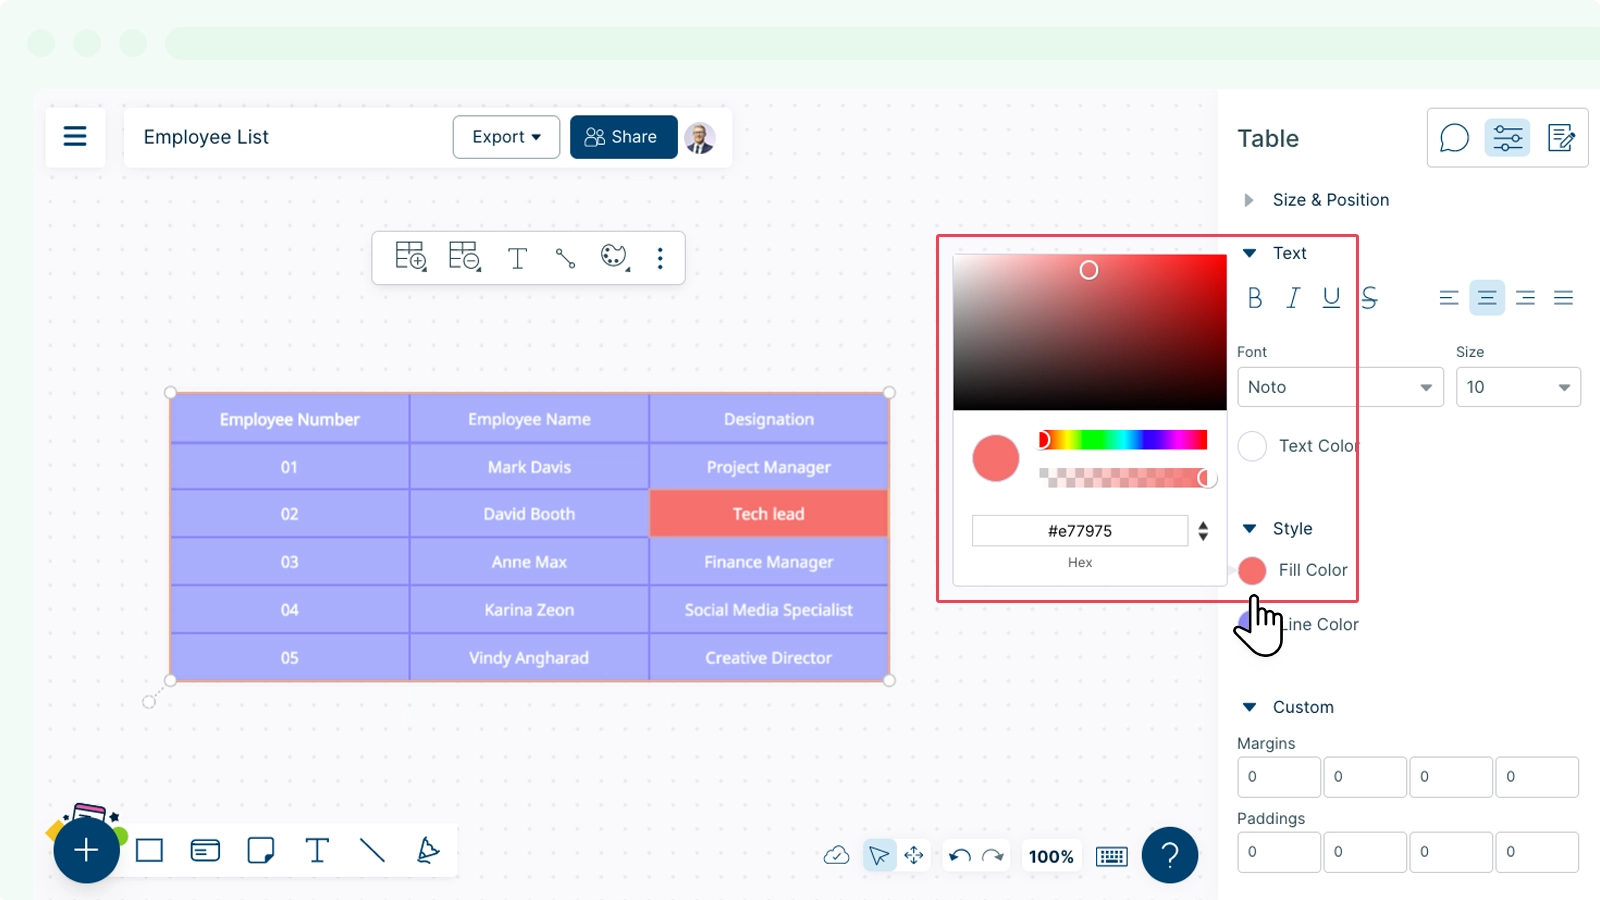
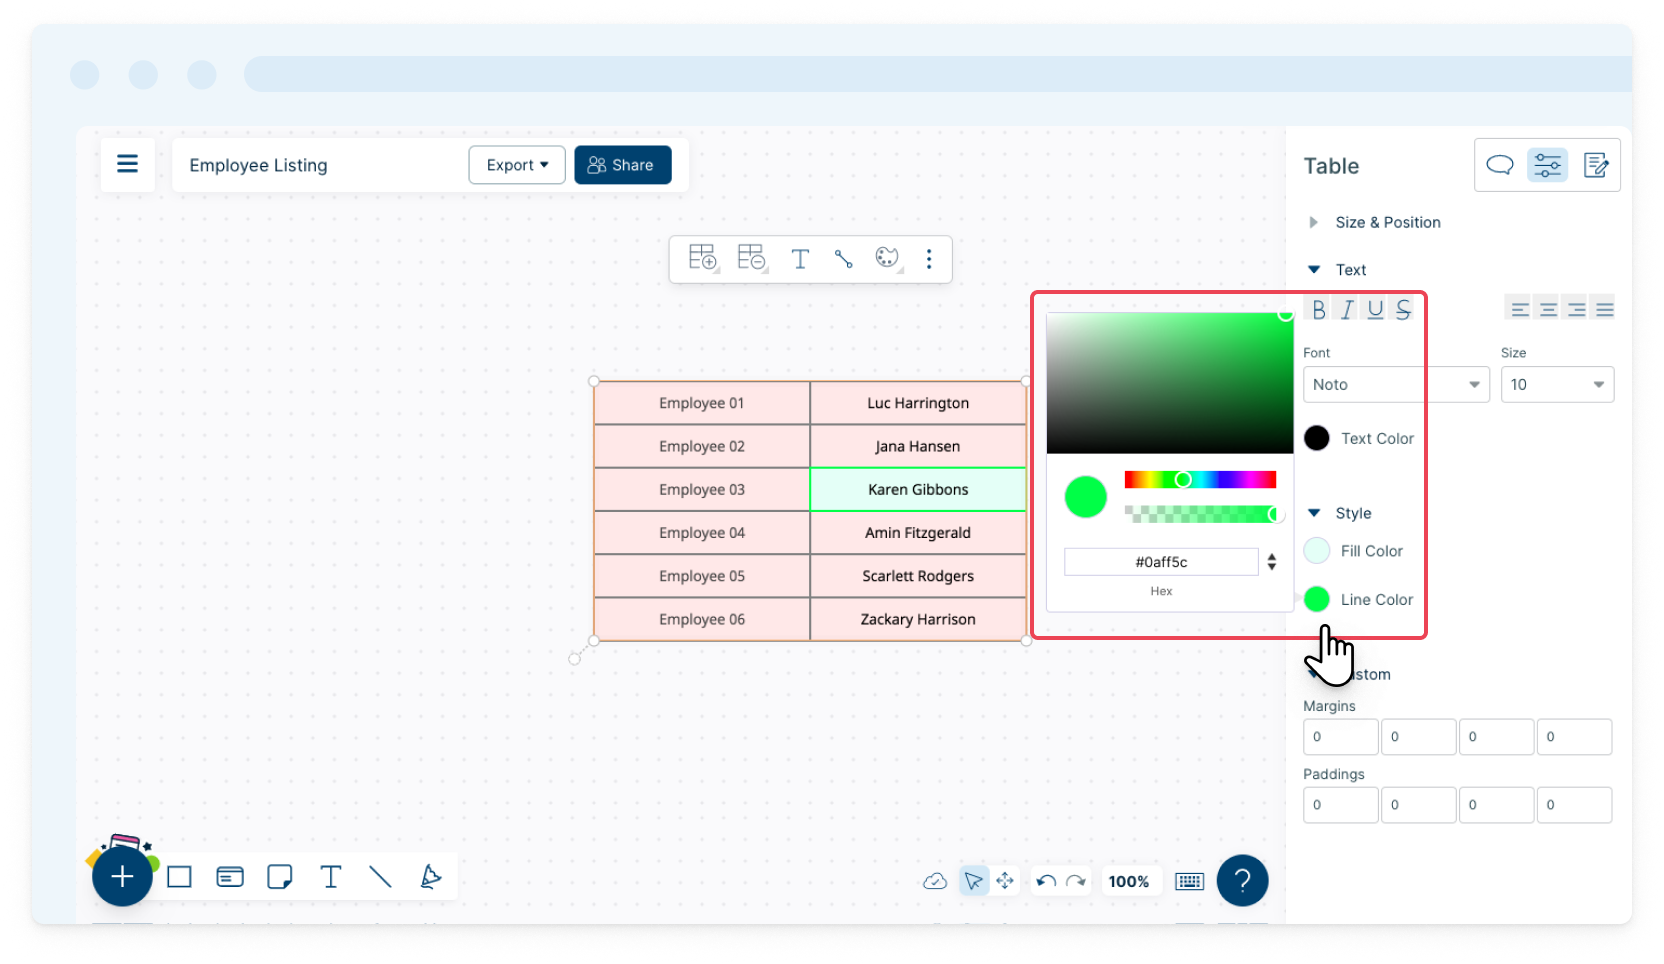
Method 2: Adding Color Using Shape Properties
- Select a specific cell.
- Go to Shape Property.
- Click Fill Color and drag the cursor to select the color you prefer on the color board or type in the relevant color code and press Enter.
Editing Outline Color
Method 1: To Add Color to the Outline of the Table
- Select the table.
- Go to Shape Properties.
- Click Line color.
- Drag the cursor to select the color you prefer on the color board or type in the relevant color code and press Enter.
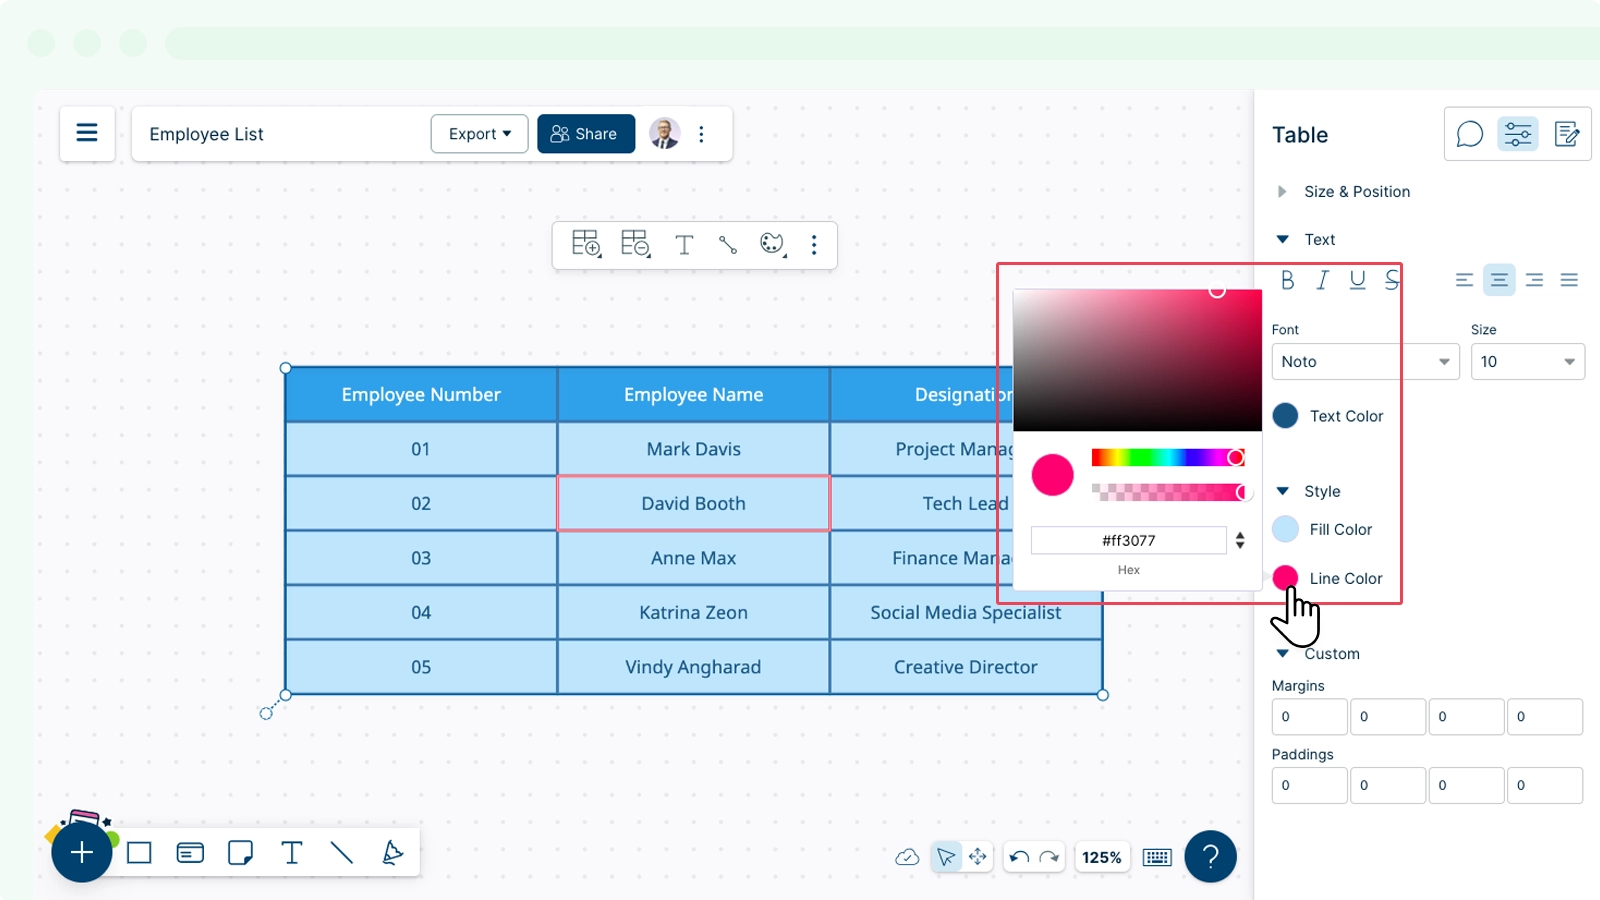
Method 2: To Add Color to the Outline of a Specific Cell
- Select the cell.
- Go to Shape Properties.
- Click Line color.
- Drag the cursor to select the color you prefer on the color board or type in the relevant color code and press Enter.
You can change the opacity of the color by dragging the cursor on the opacity bar. To know more about how to add custom colors using standard codes click here.
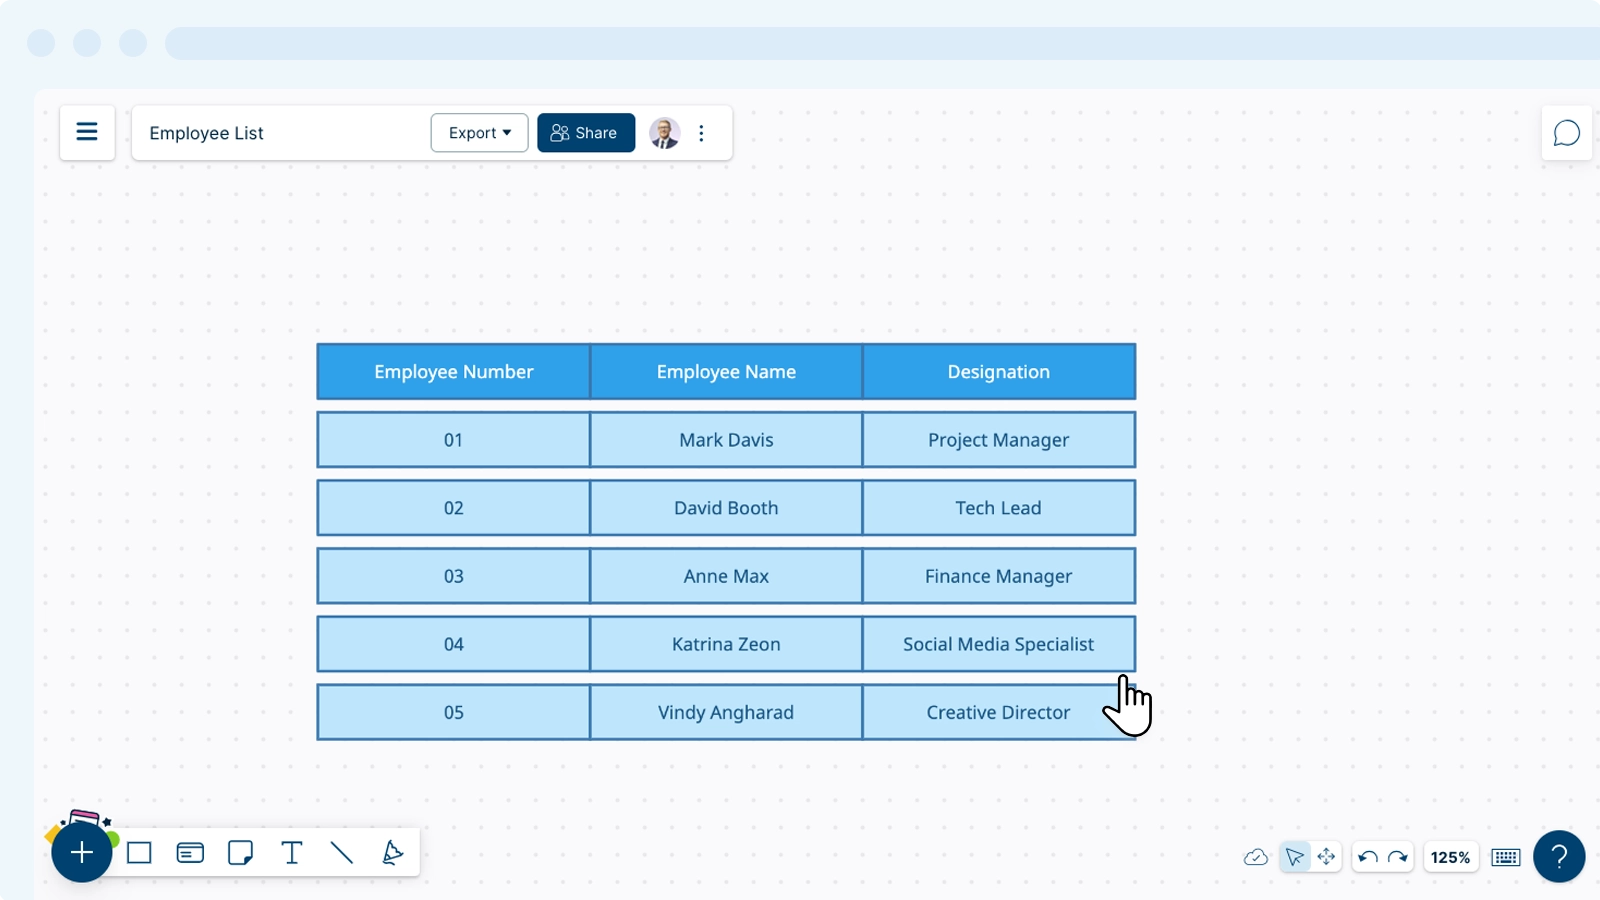
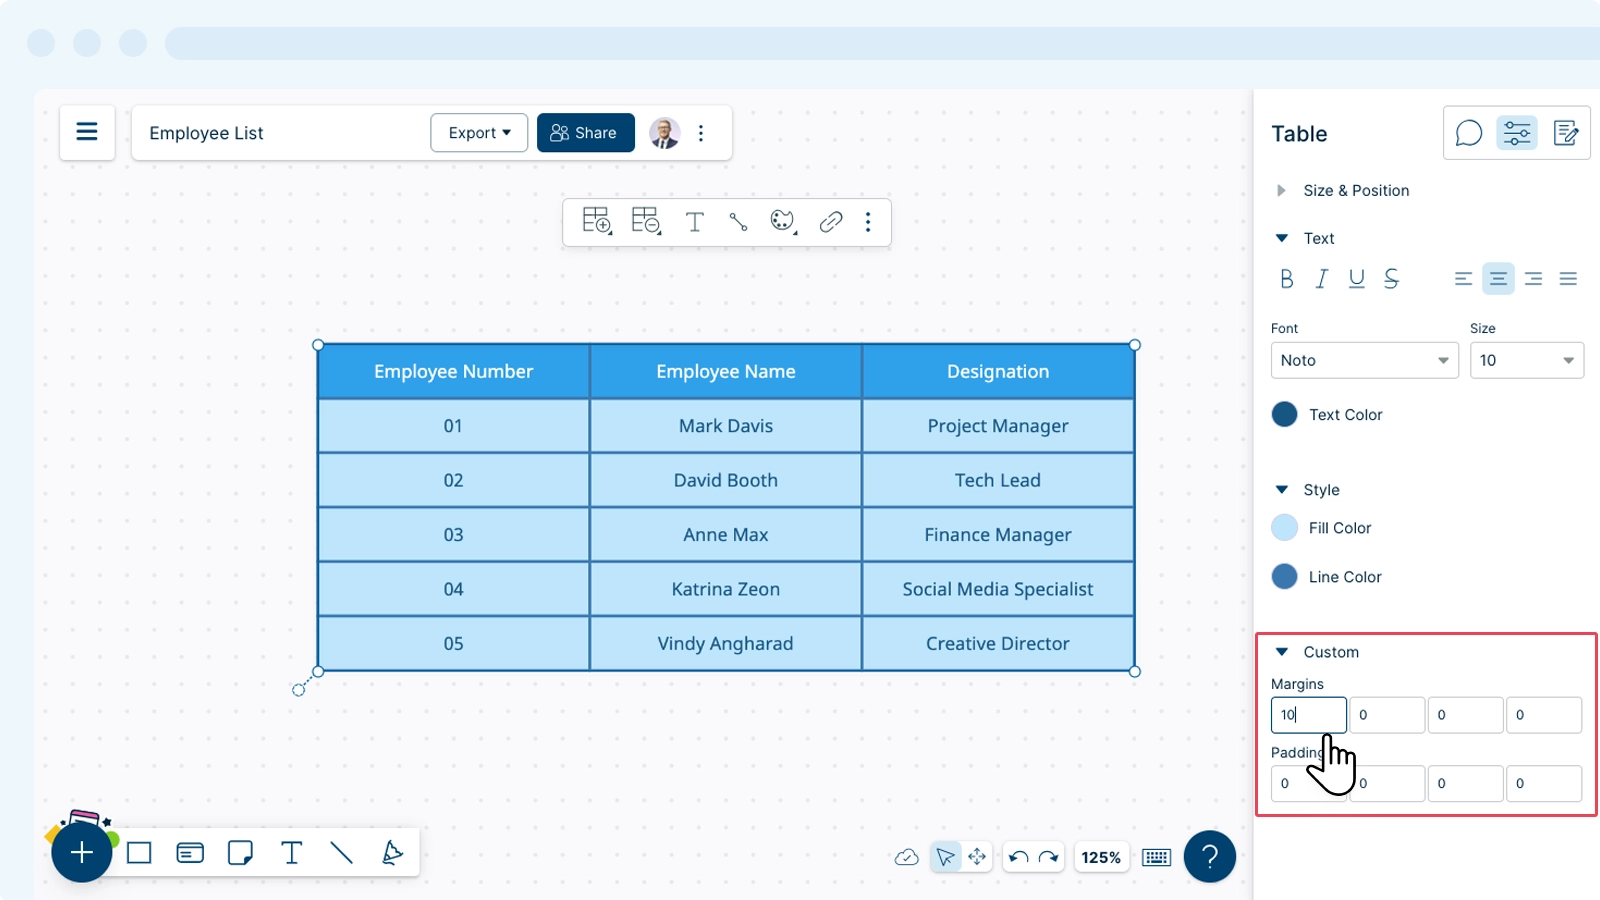
Adding Custom Margins
- Select the entire table.
- Go to Shape Properties → Custom.
- Change the margins and the paddings as required.
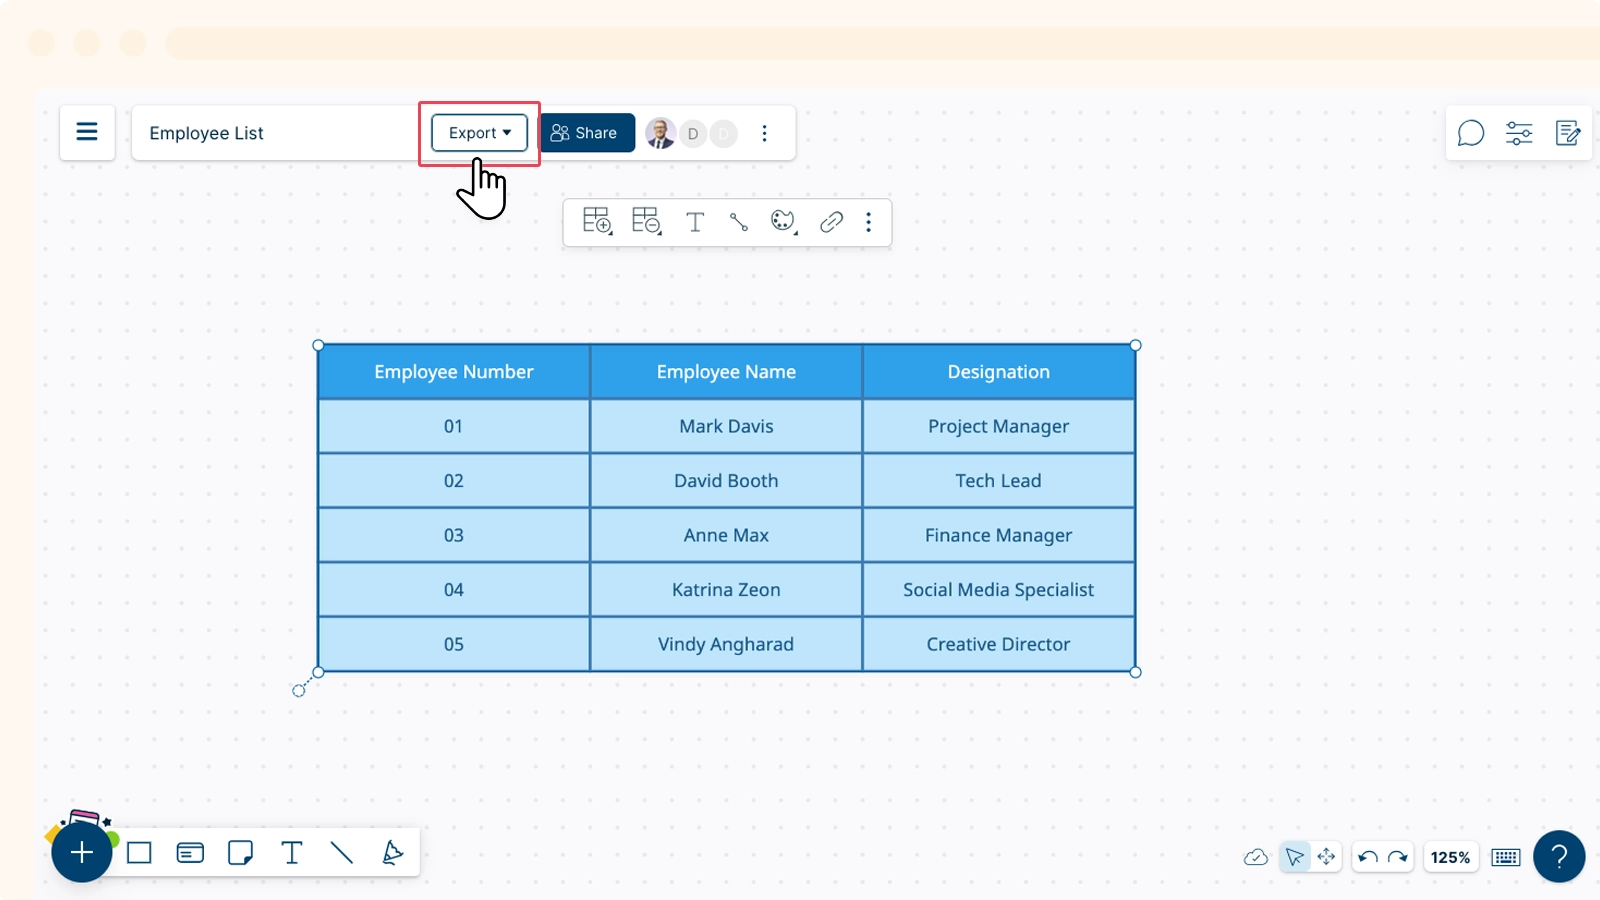
Exporting a Table
On Creately, you could also export individual table or multiple tables from a workspace.
- Select the table(s) you want to export.
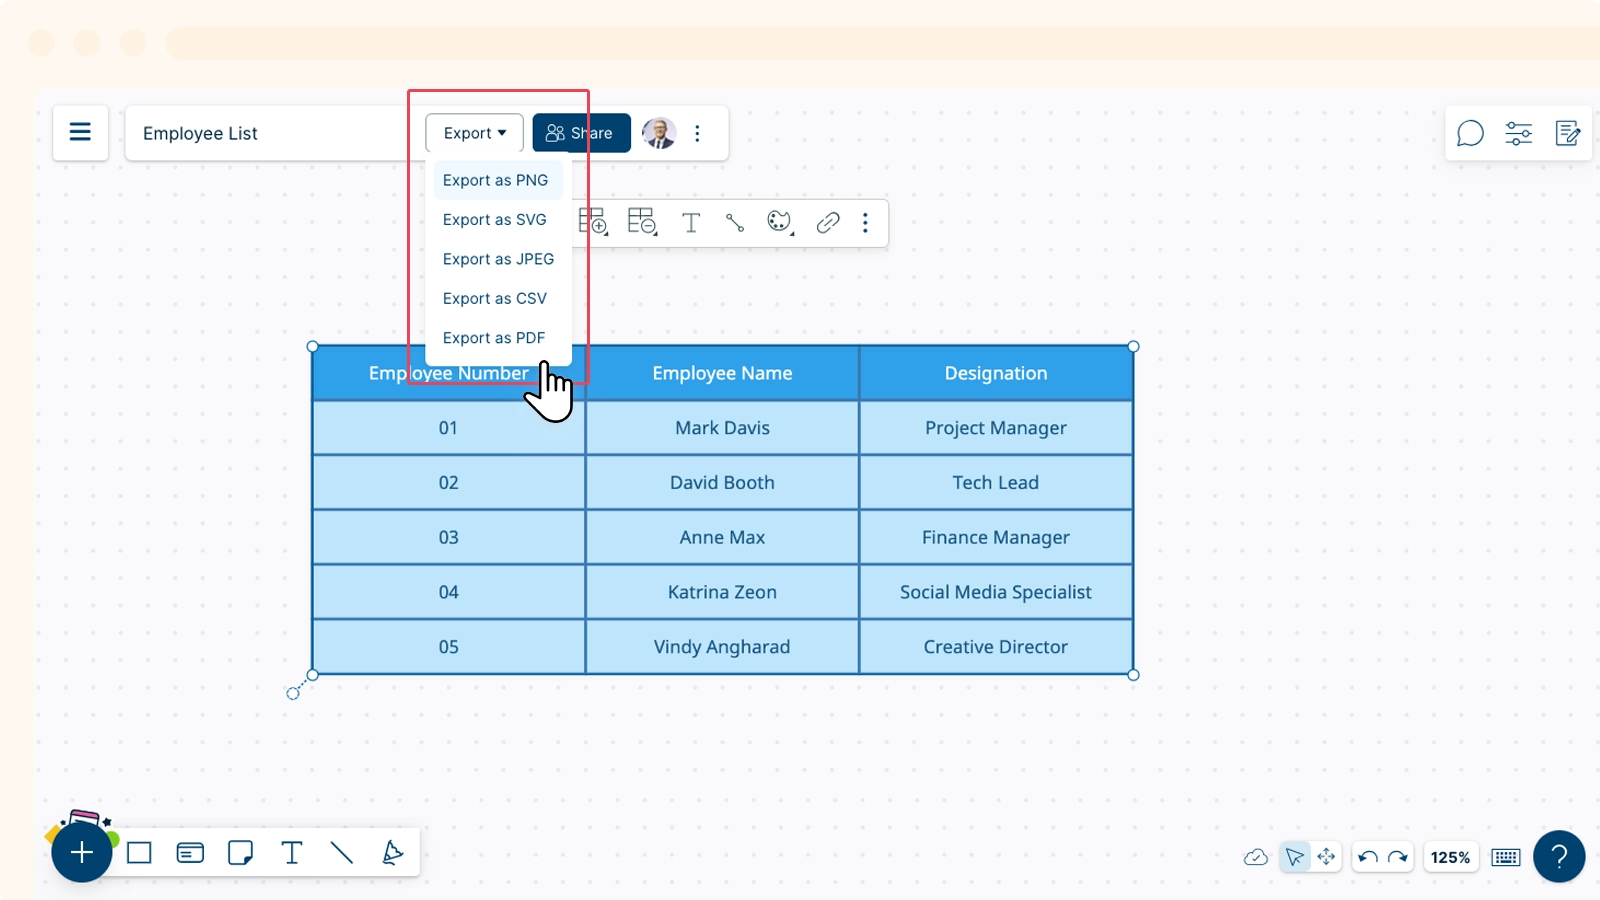
- Click
 and choose a format of your choice.