Easily visualize your processes and workflows with smart automation.
Create visual organizational structures with images and detailed profiles.
Visualize concepts and their relationships on an infinite visual canvas.
Map family history and understand the relationships with detailed genograms.
Visualize relationships between entities using Crows Foot or Chen notation.
Visualize your network infrastructure. Support AWS, CISCO, Azure and more.
Visualize and expand your ideas using our powerful mind mapping tool.
Easily create family trees with our professionally designed templates.
Infinite canvas to add diagrams, images, sticky notes and more.
Run collaborative meetings, workshops or brainstorming sessions.
Collaborative diagramming for educators and students at discounted rates.
Log In
Sign Up Free
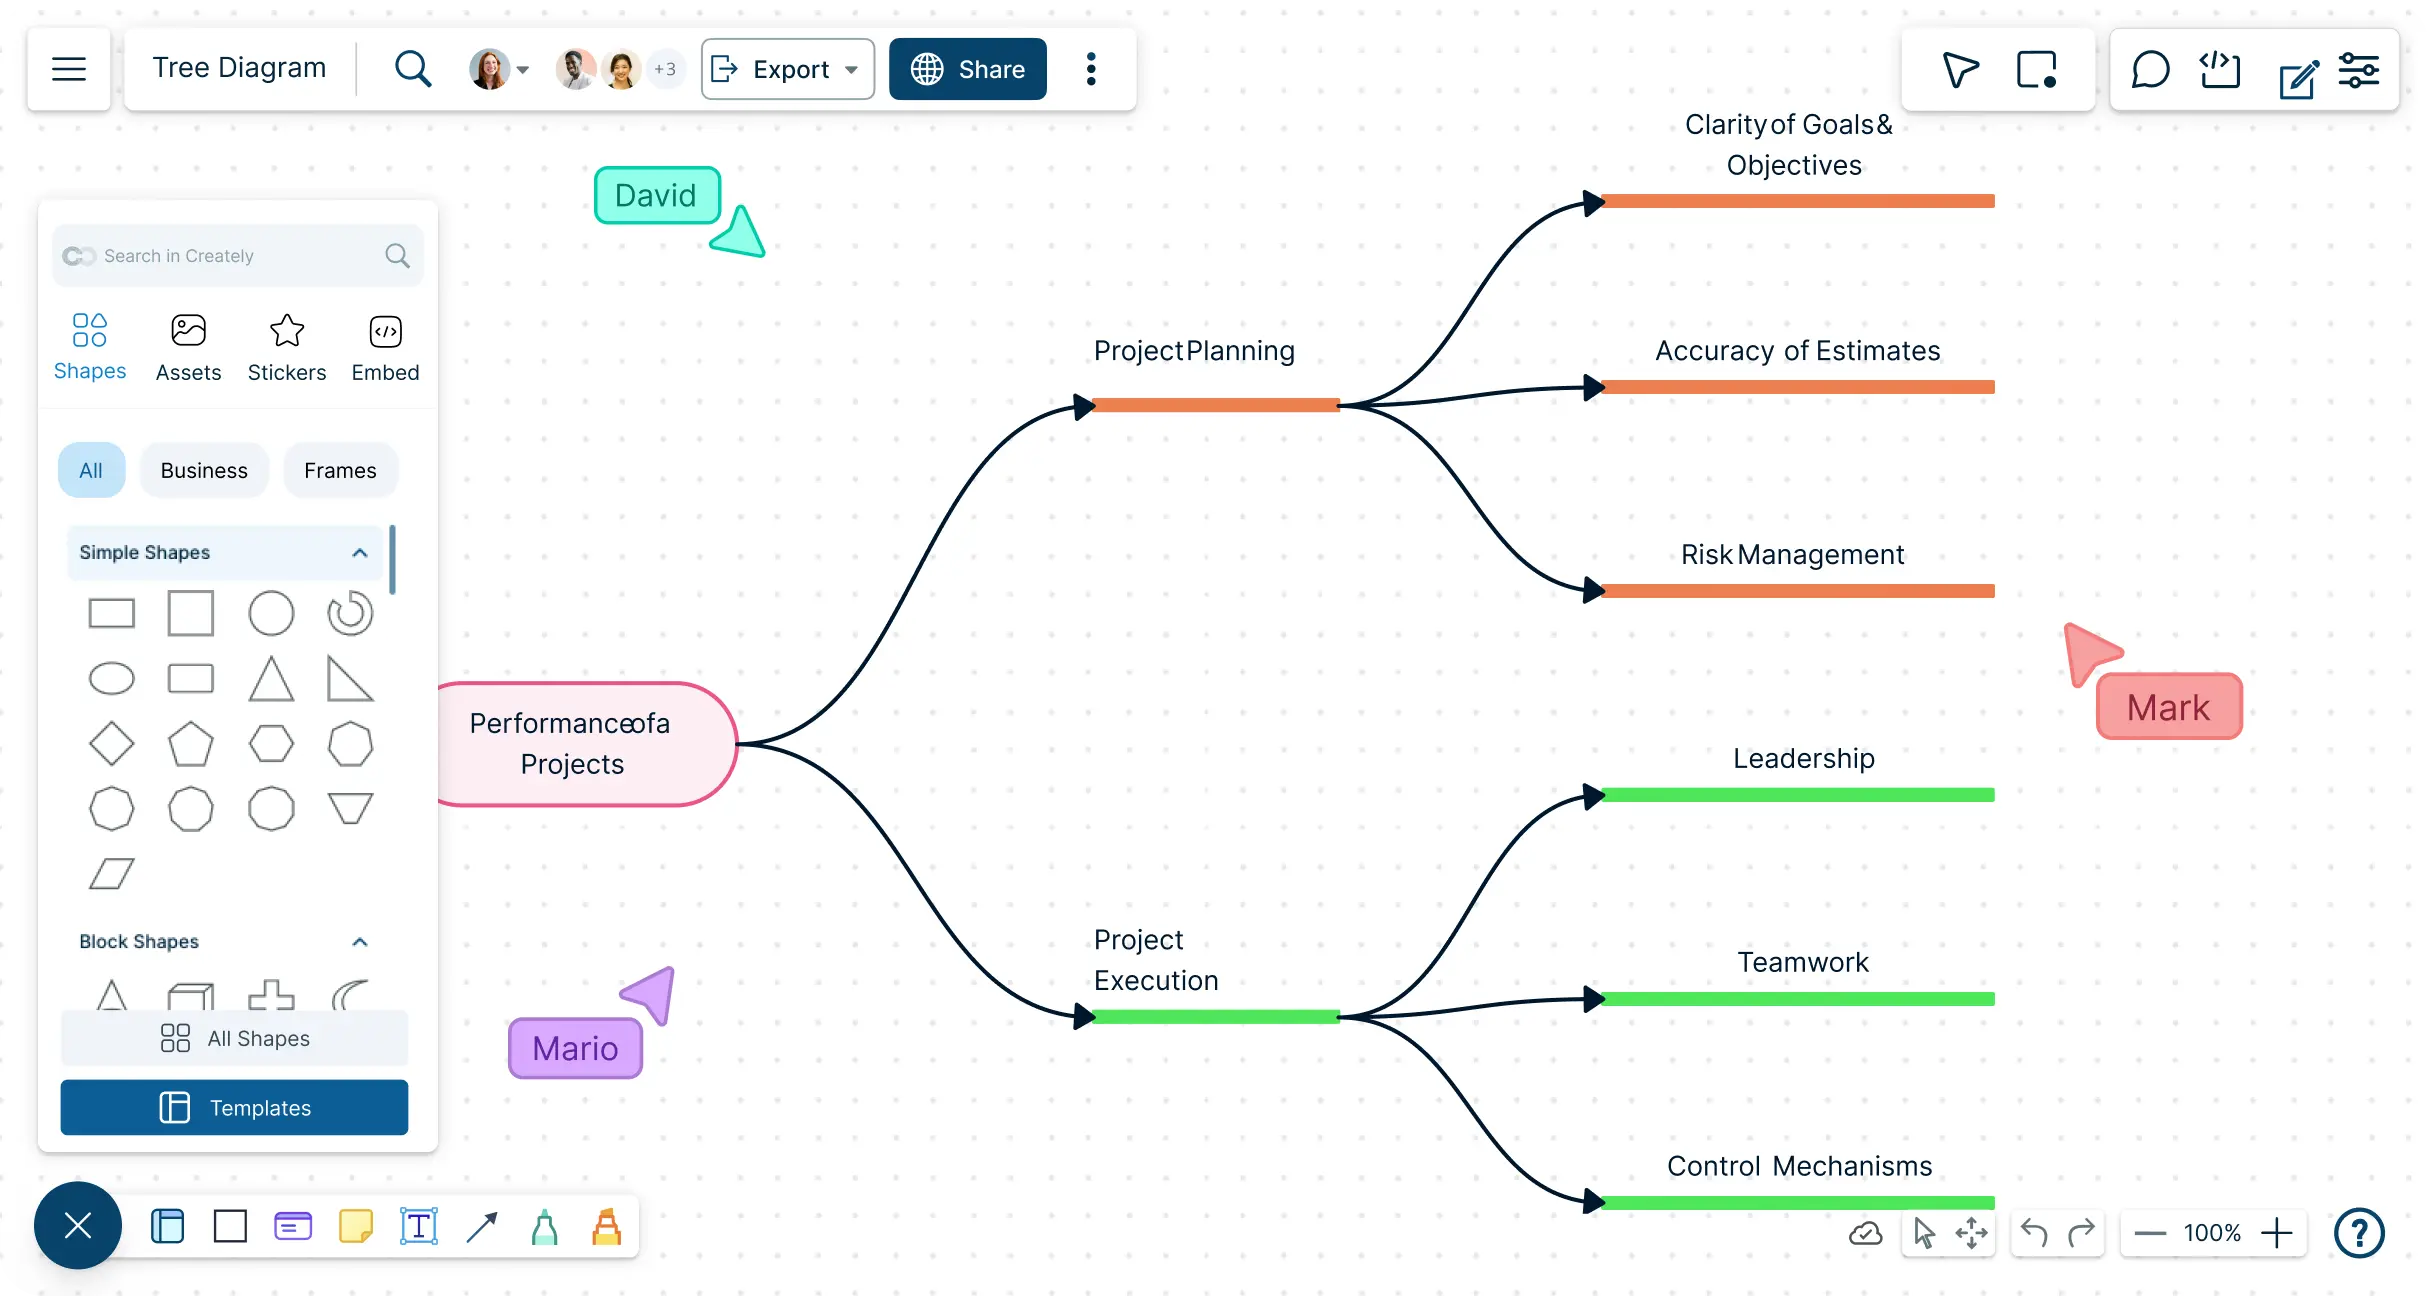
Transform complicated data into clear, easy-to-understand hierarchical data visualization with Creately’s intuitive online tool. Create, edit, and share professional decision analysis tree diagrams in minutes.
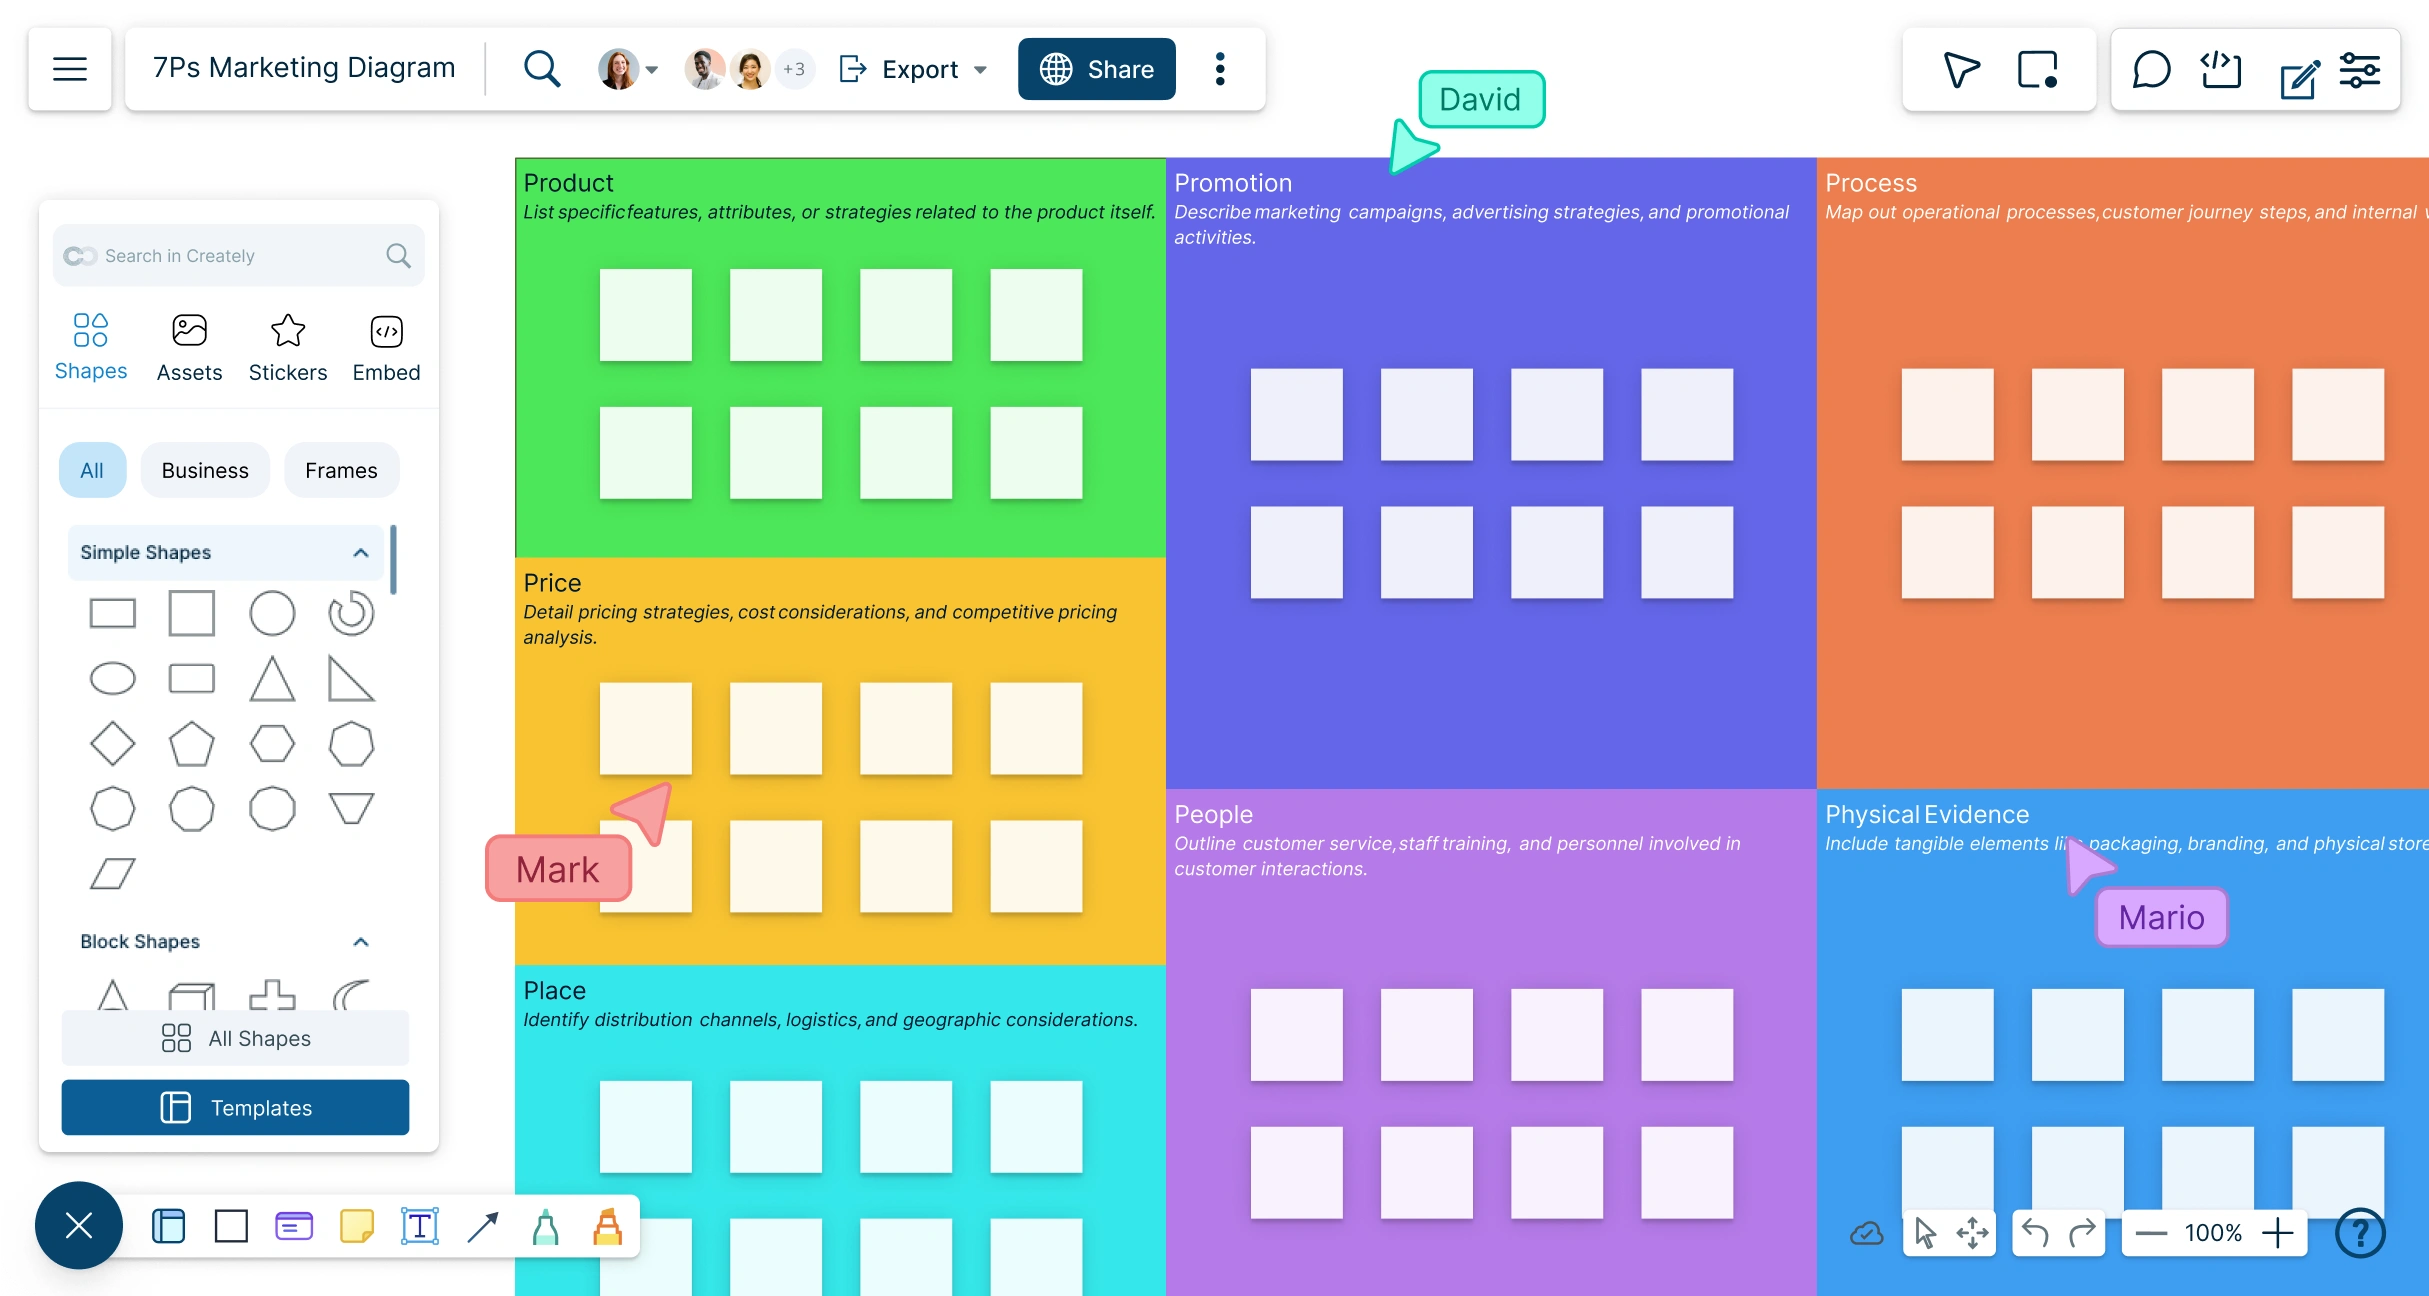
Collaborate with your team to set marketing goals, analyze customer data, and brainstorm ideas to develop marketing campaigns using strategy diagrams, all in one shared workspace.
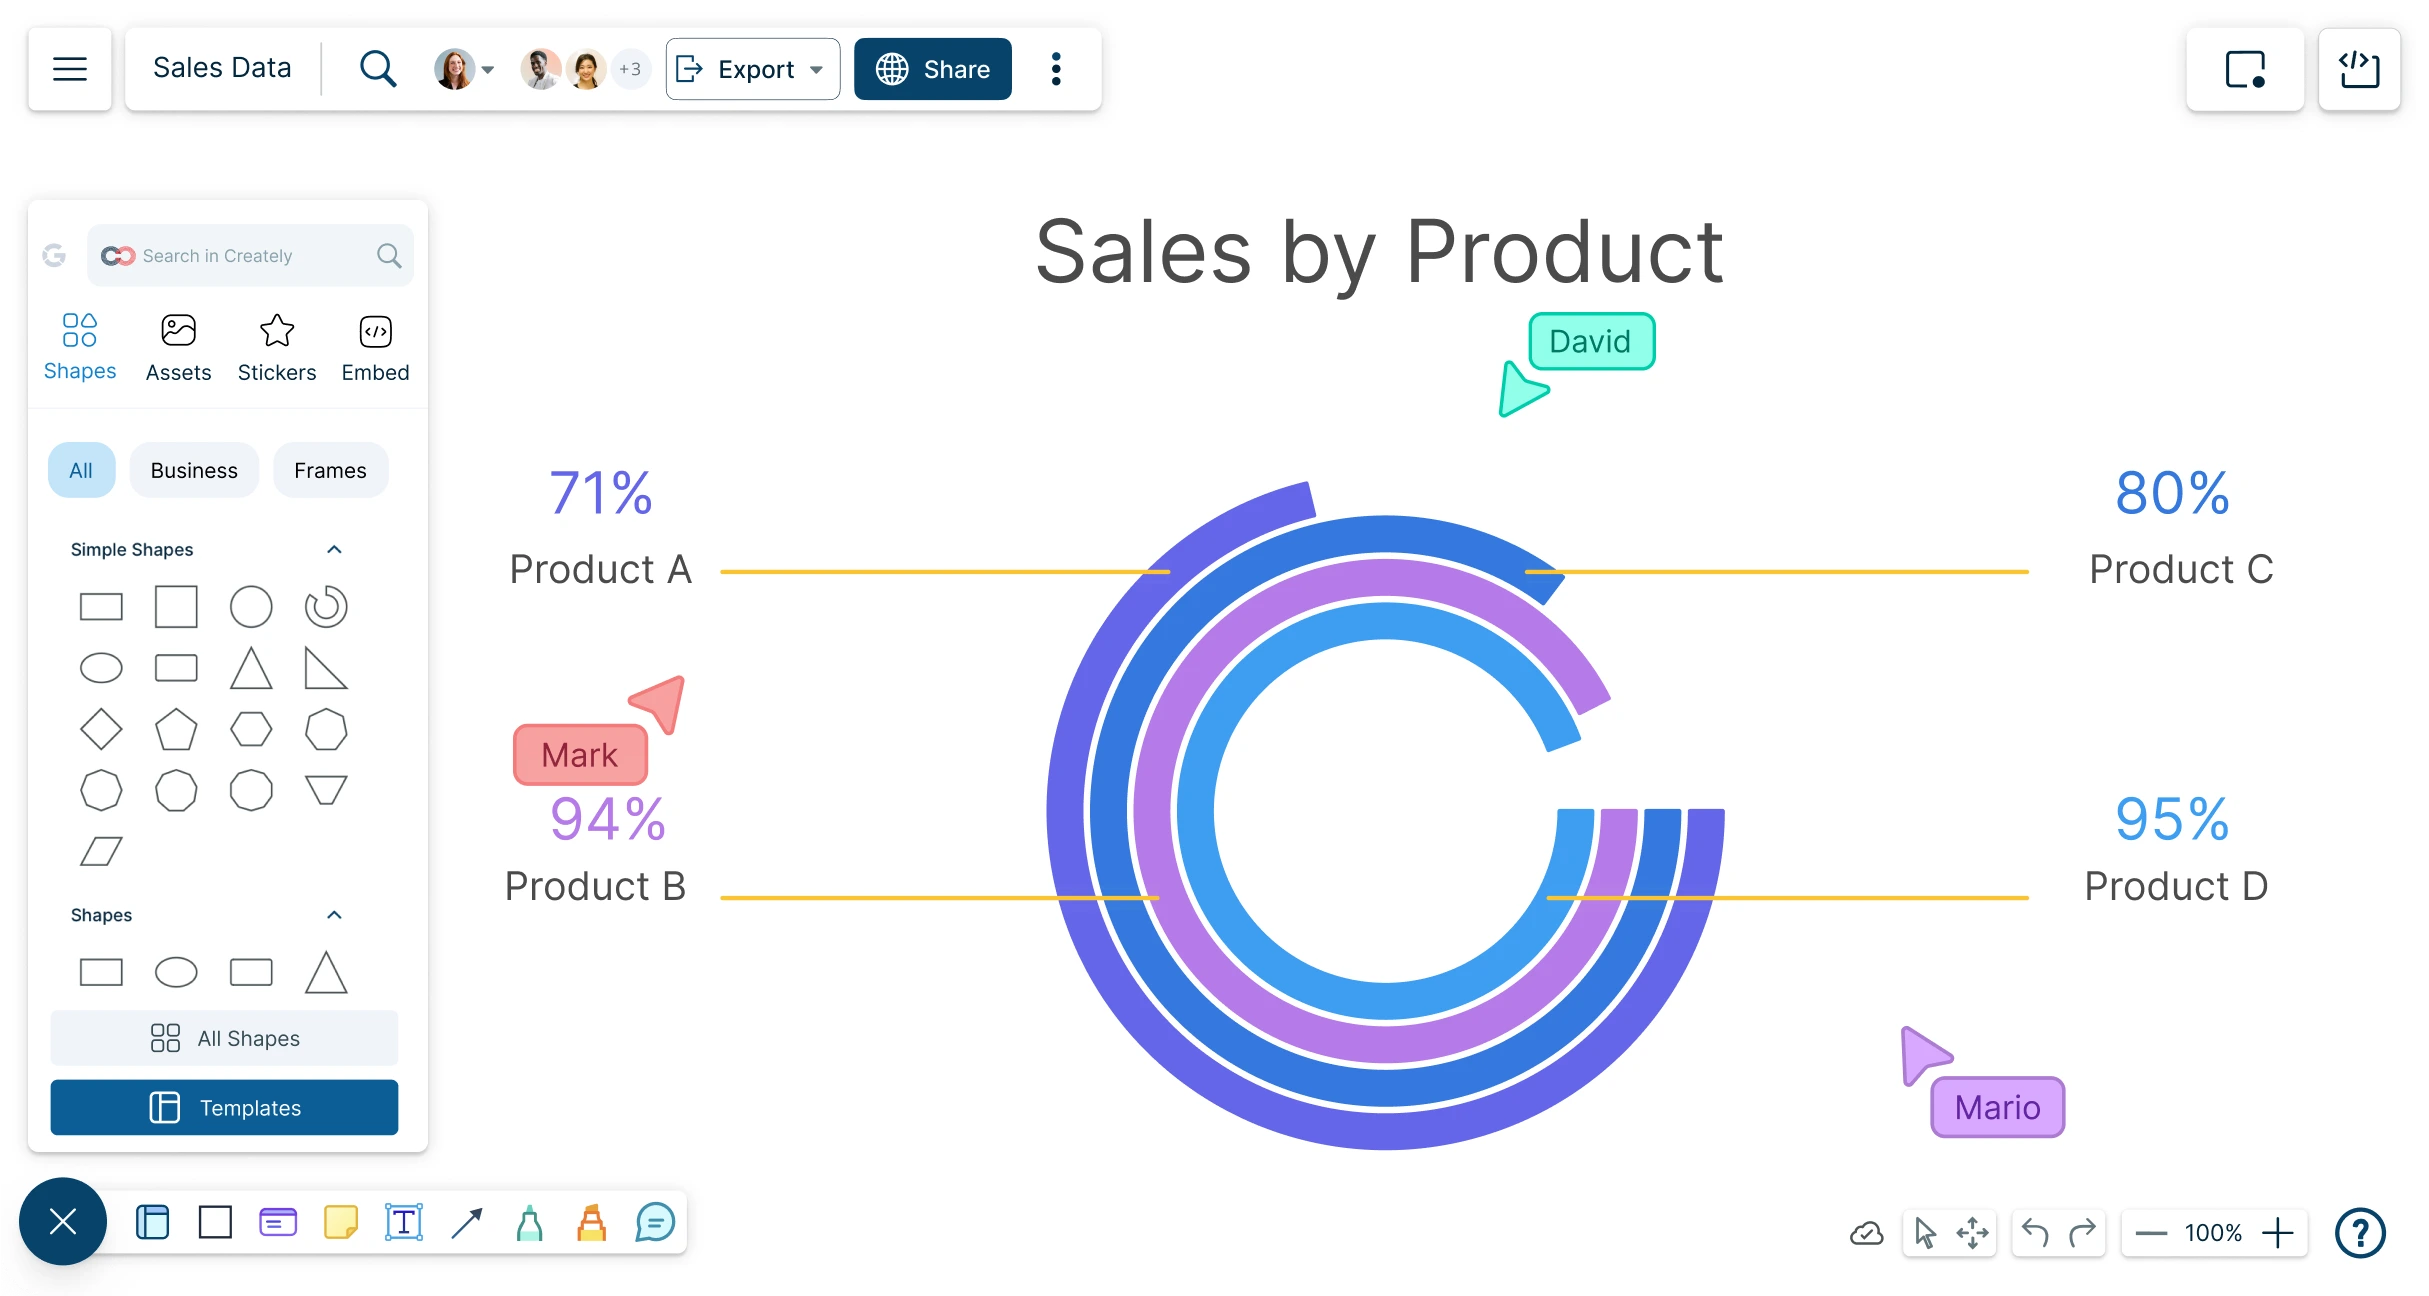
Create stunning graphs and charts that visually represent data with Creately’s online chart maker. Plot diagrams with ease, discover and analyze the relationship between data.
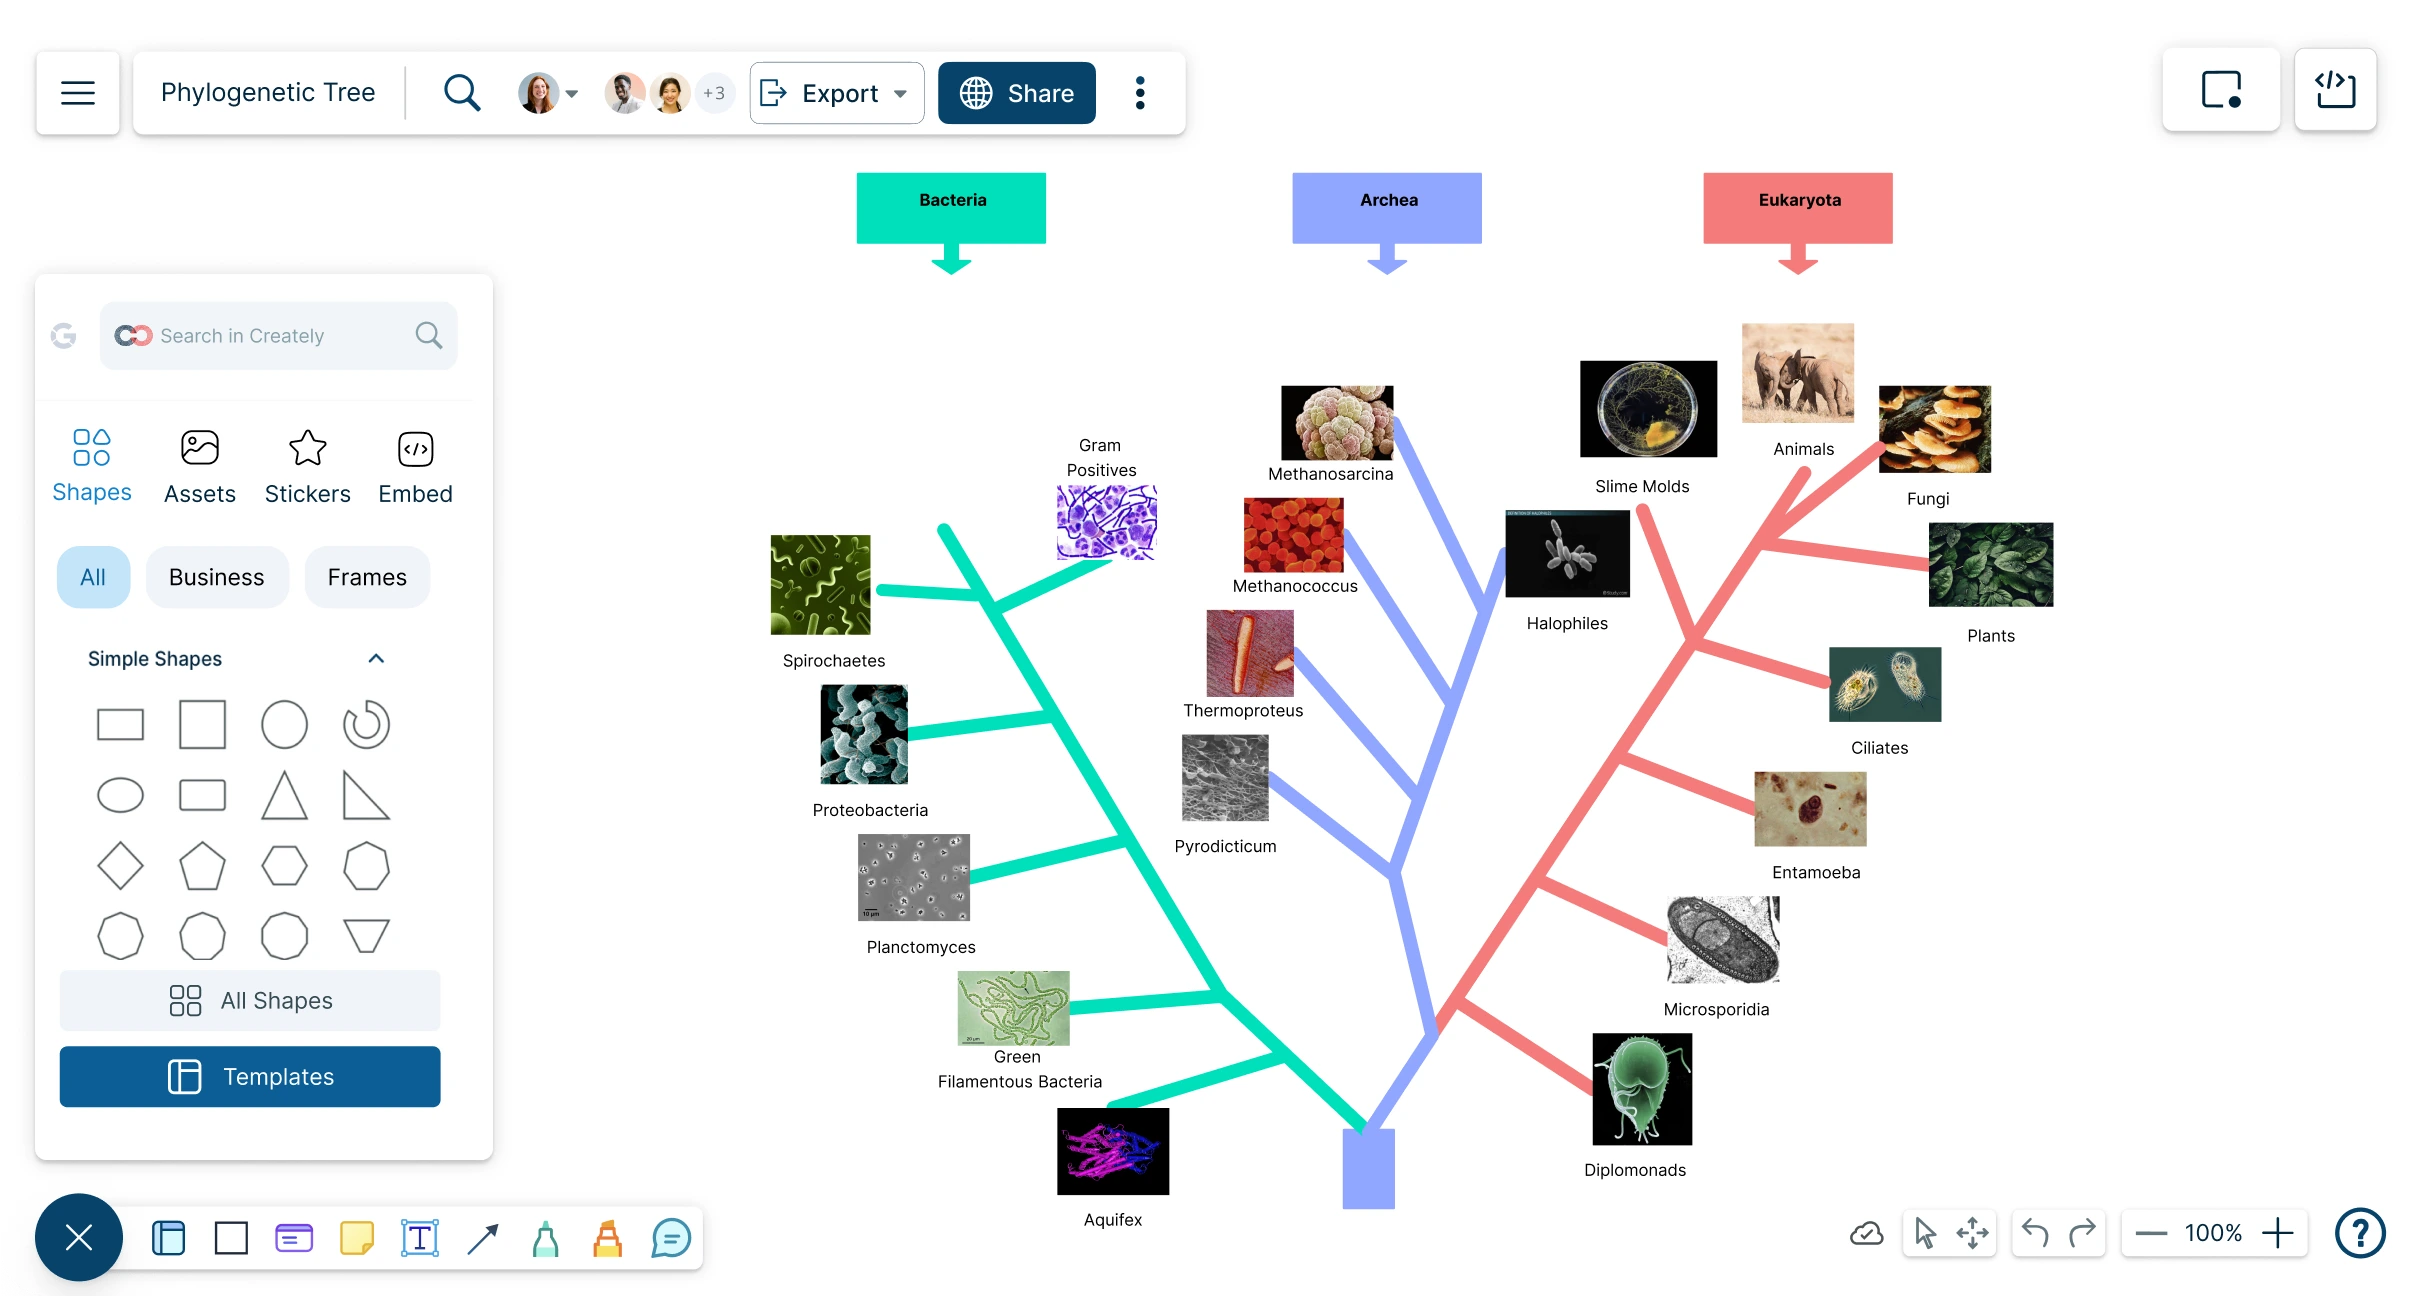
Effectively visualize and identify the evolutionary relationships among various biological species.
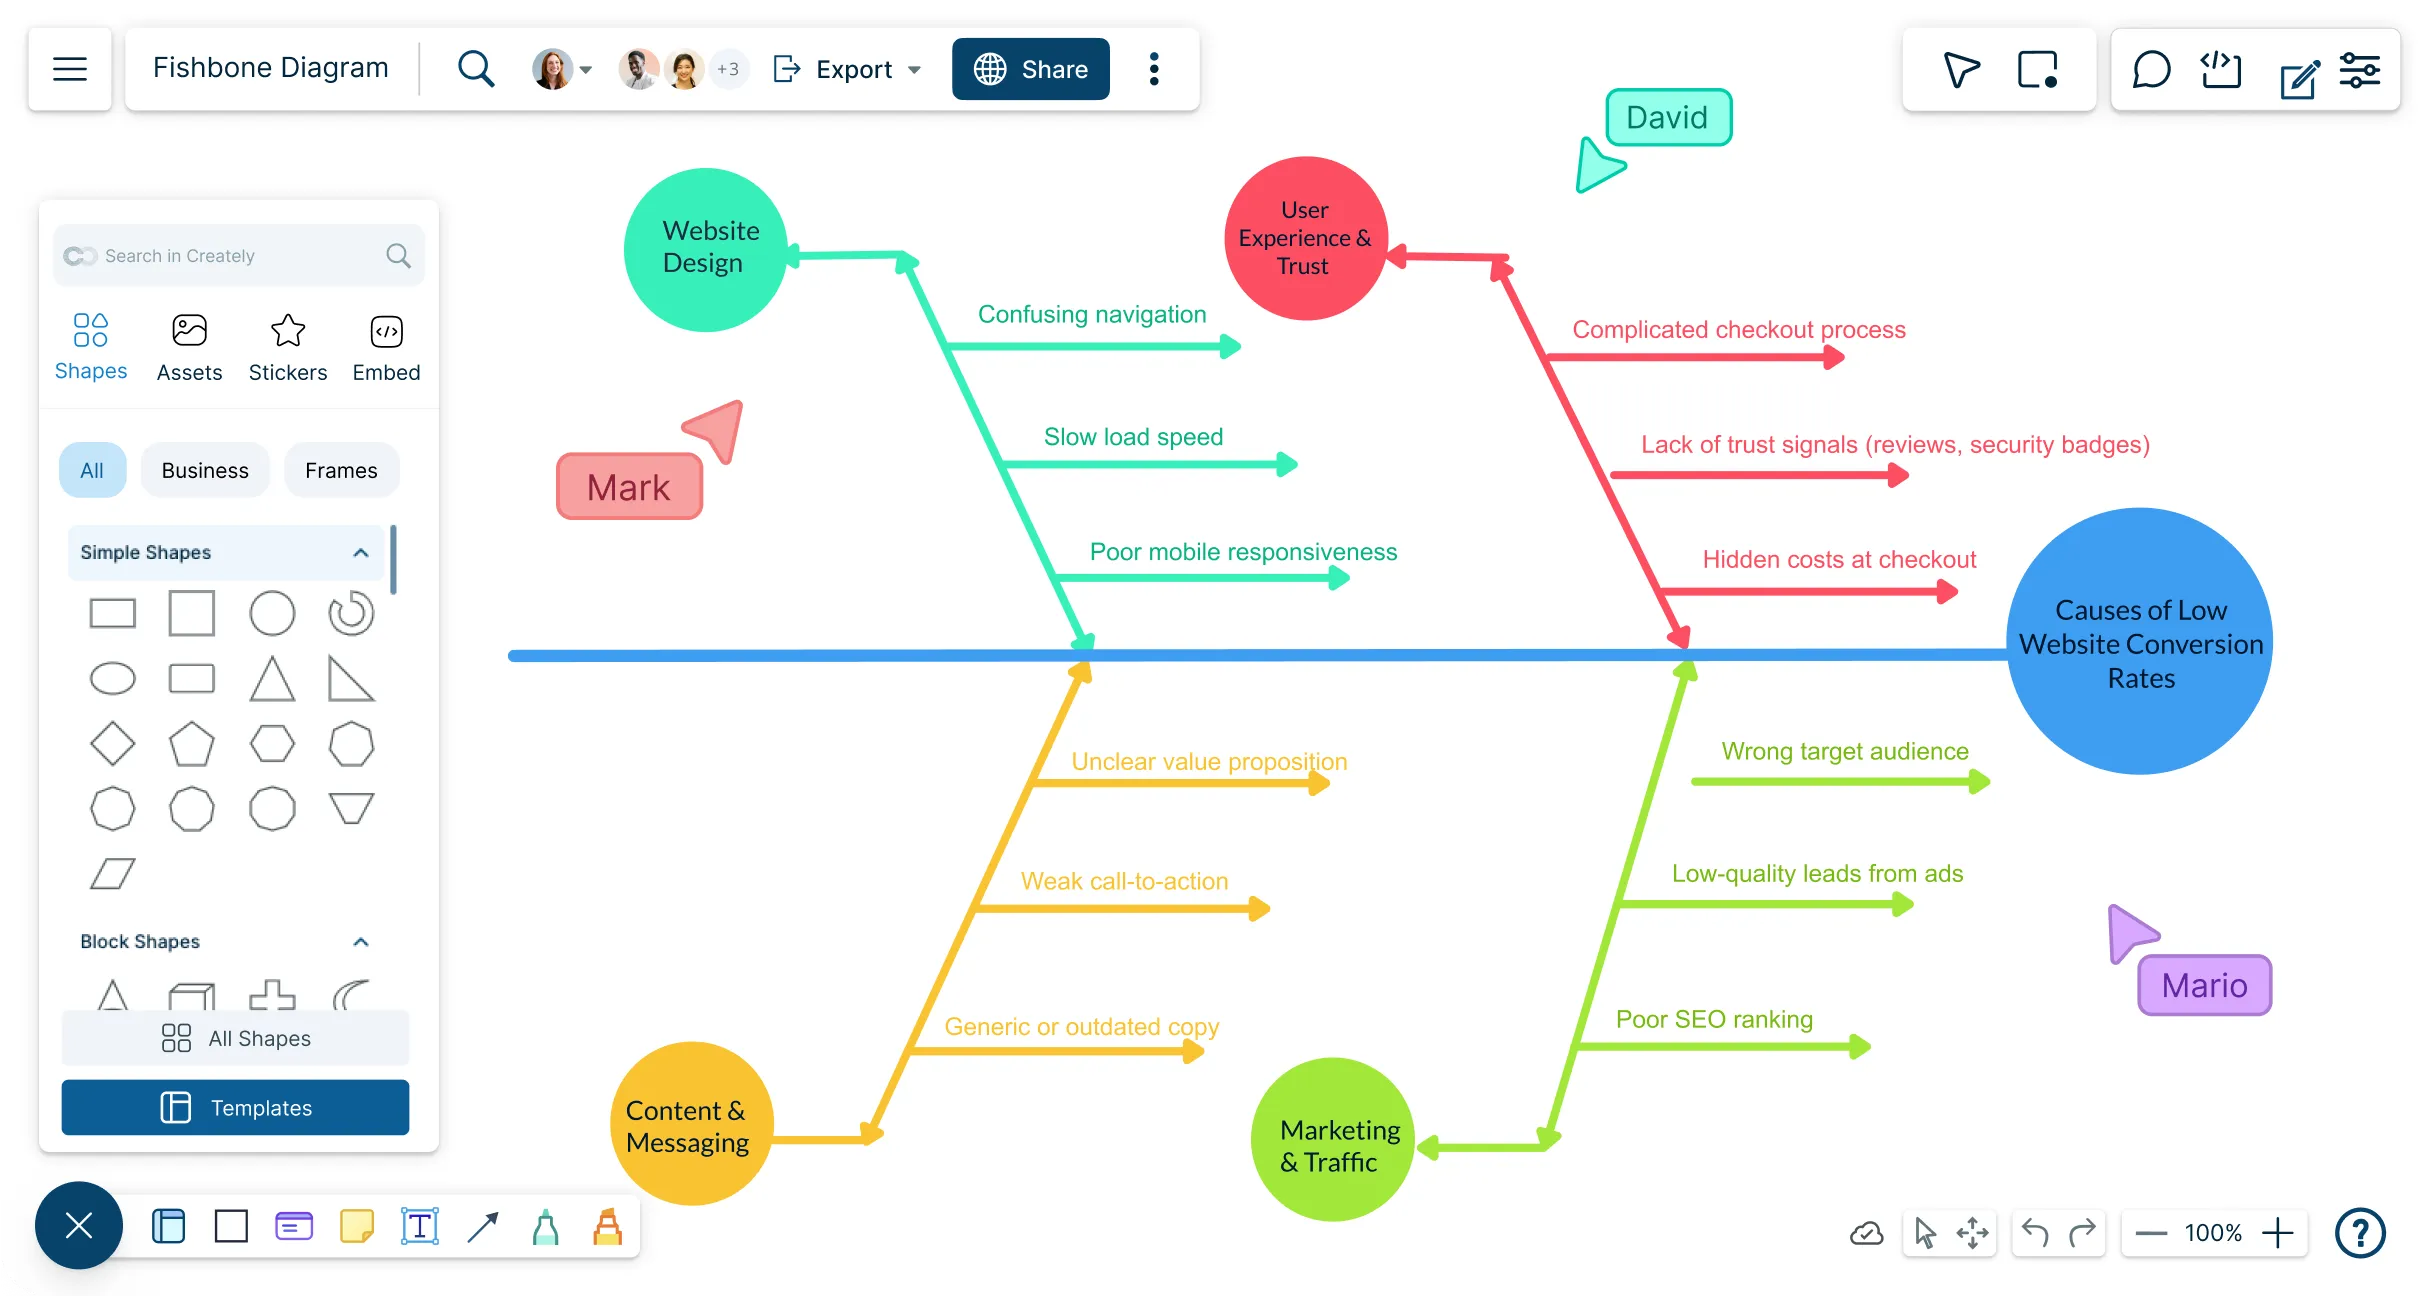
Uncover root causes faster — collaborate in real time, analyze issues, and find solutions together.
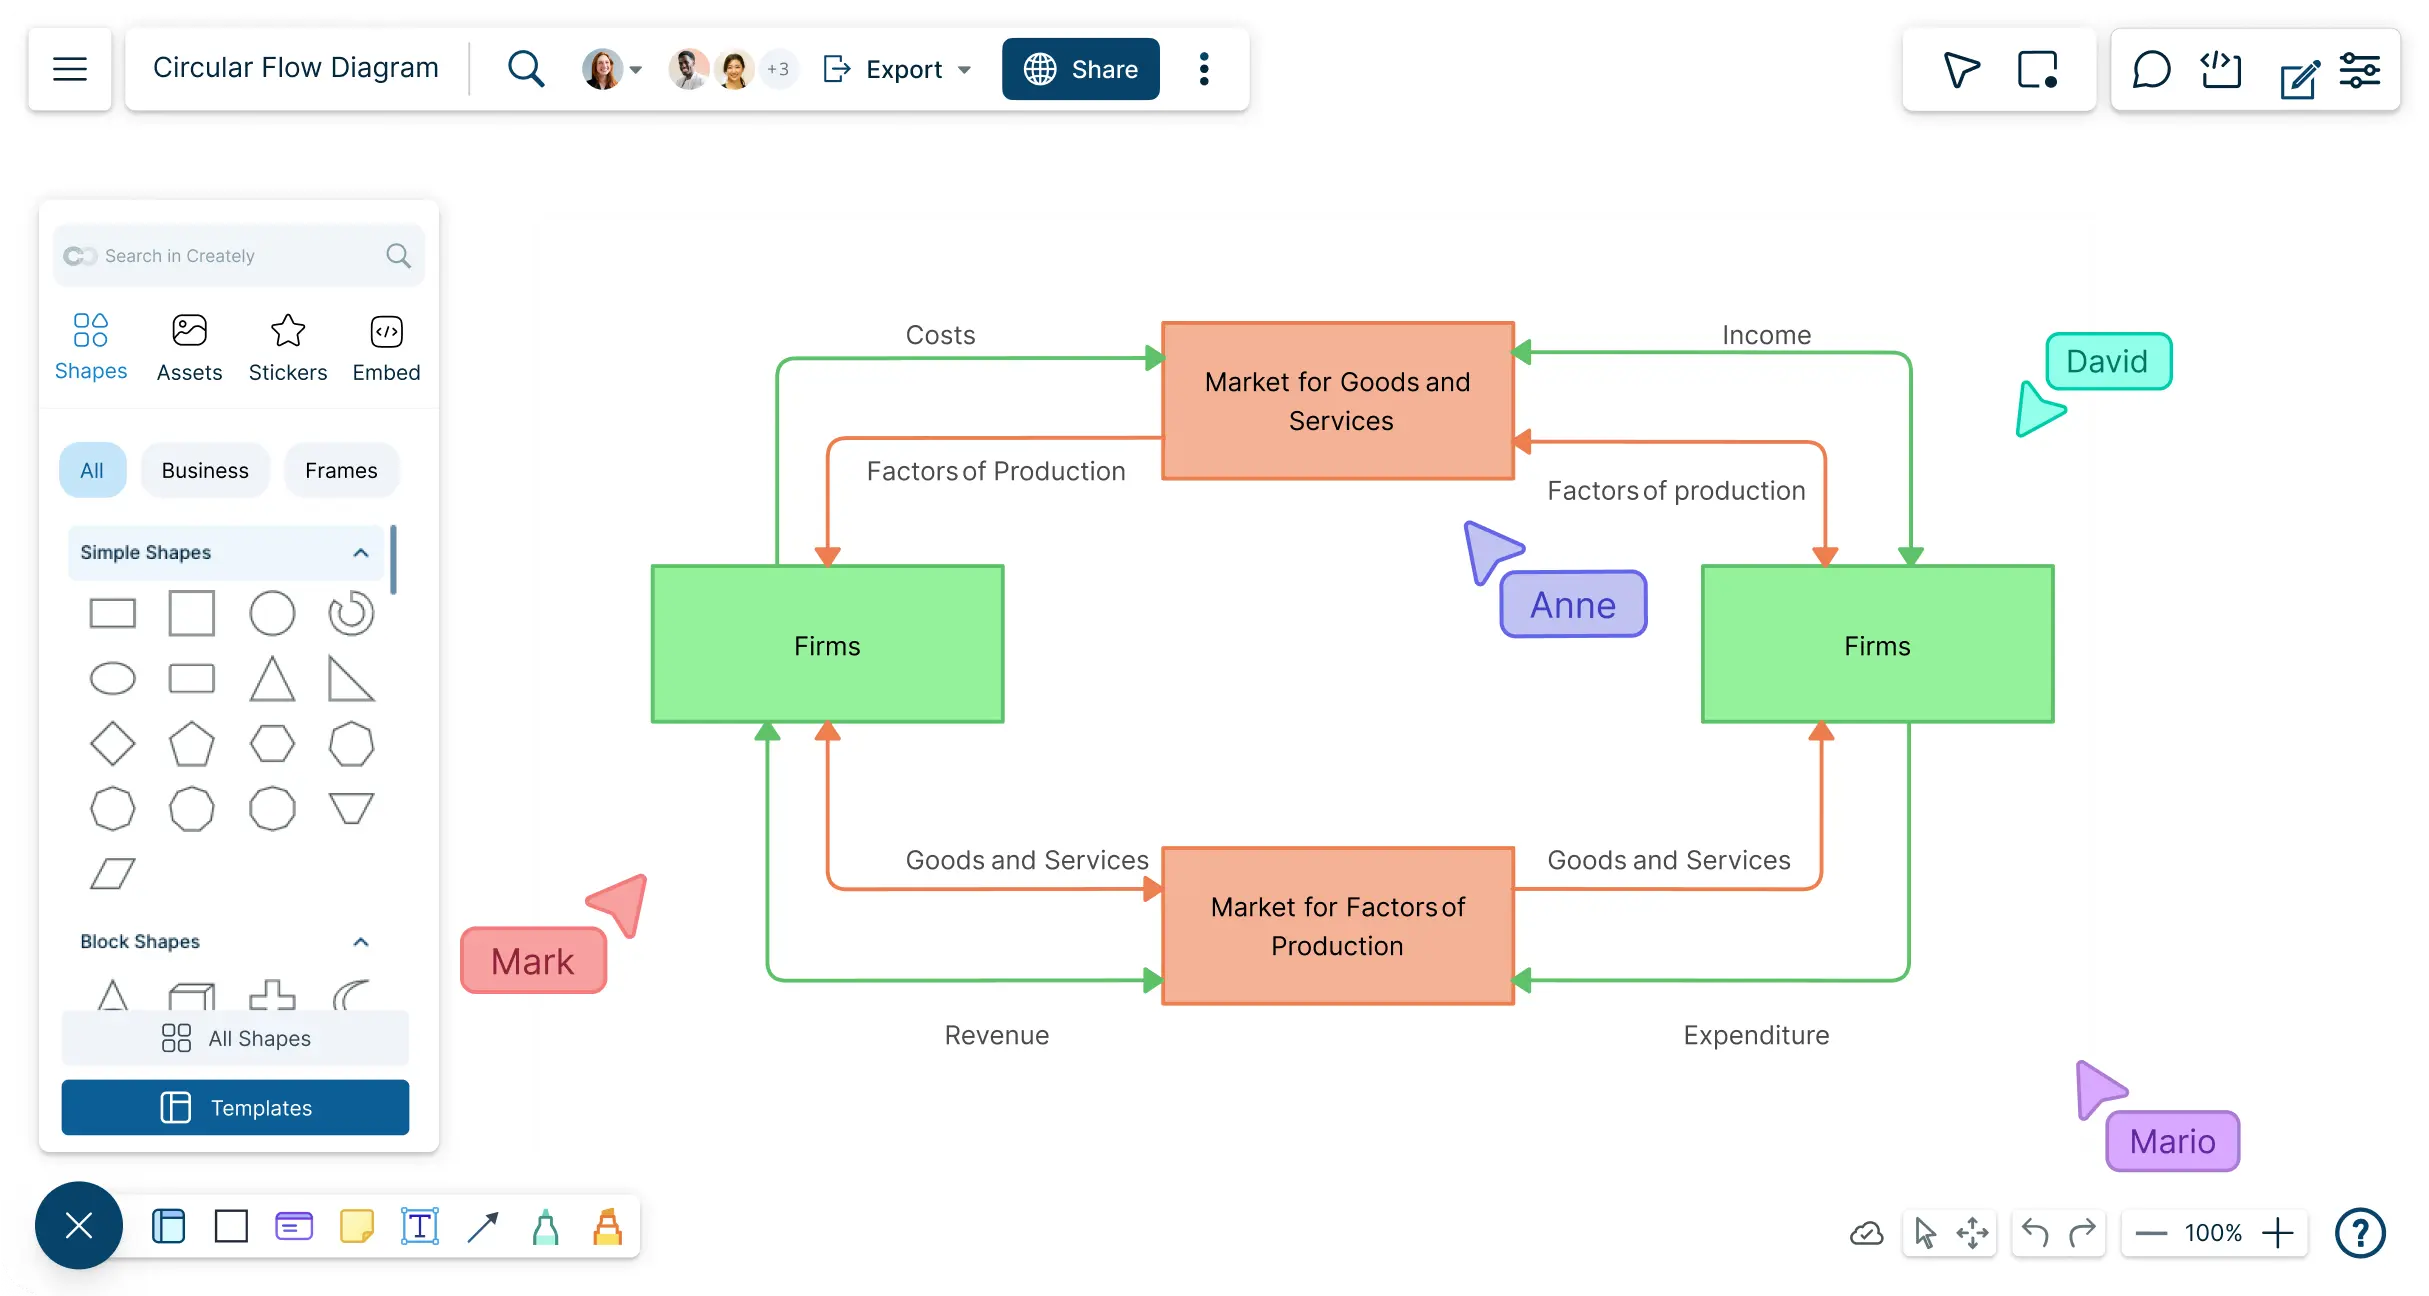
Bring in data from any source to create a circular flow diagram to trace interconnections between various elements of an economy.
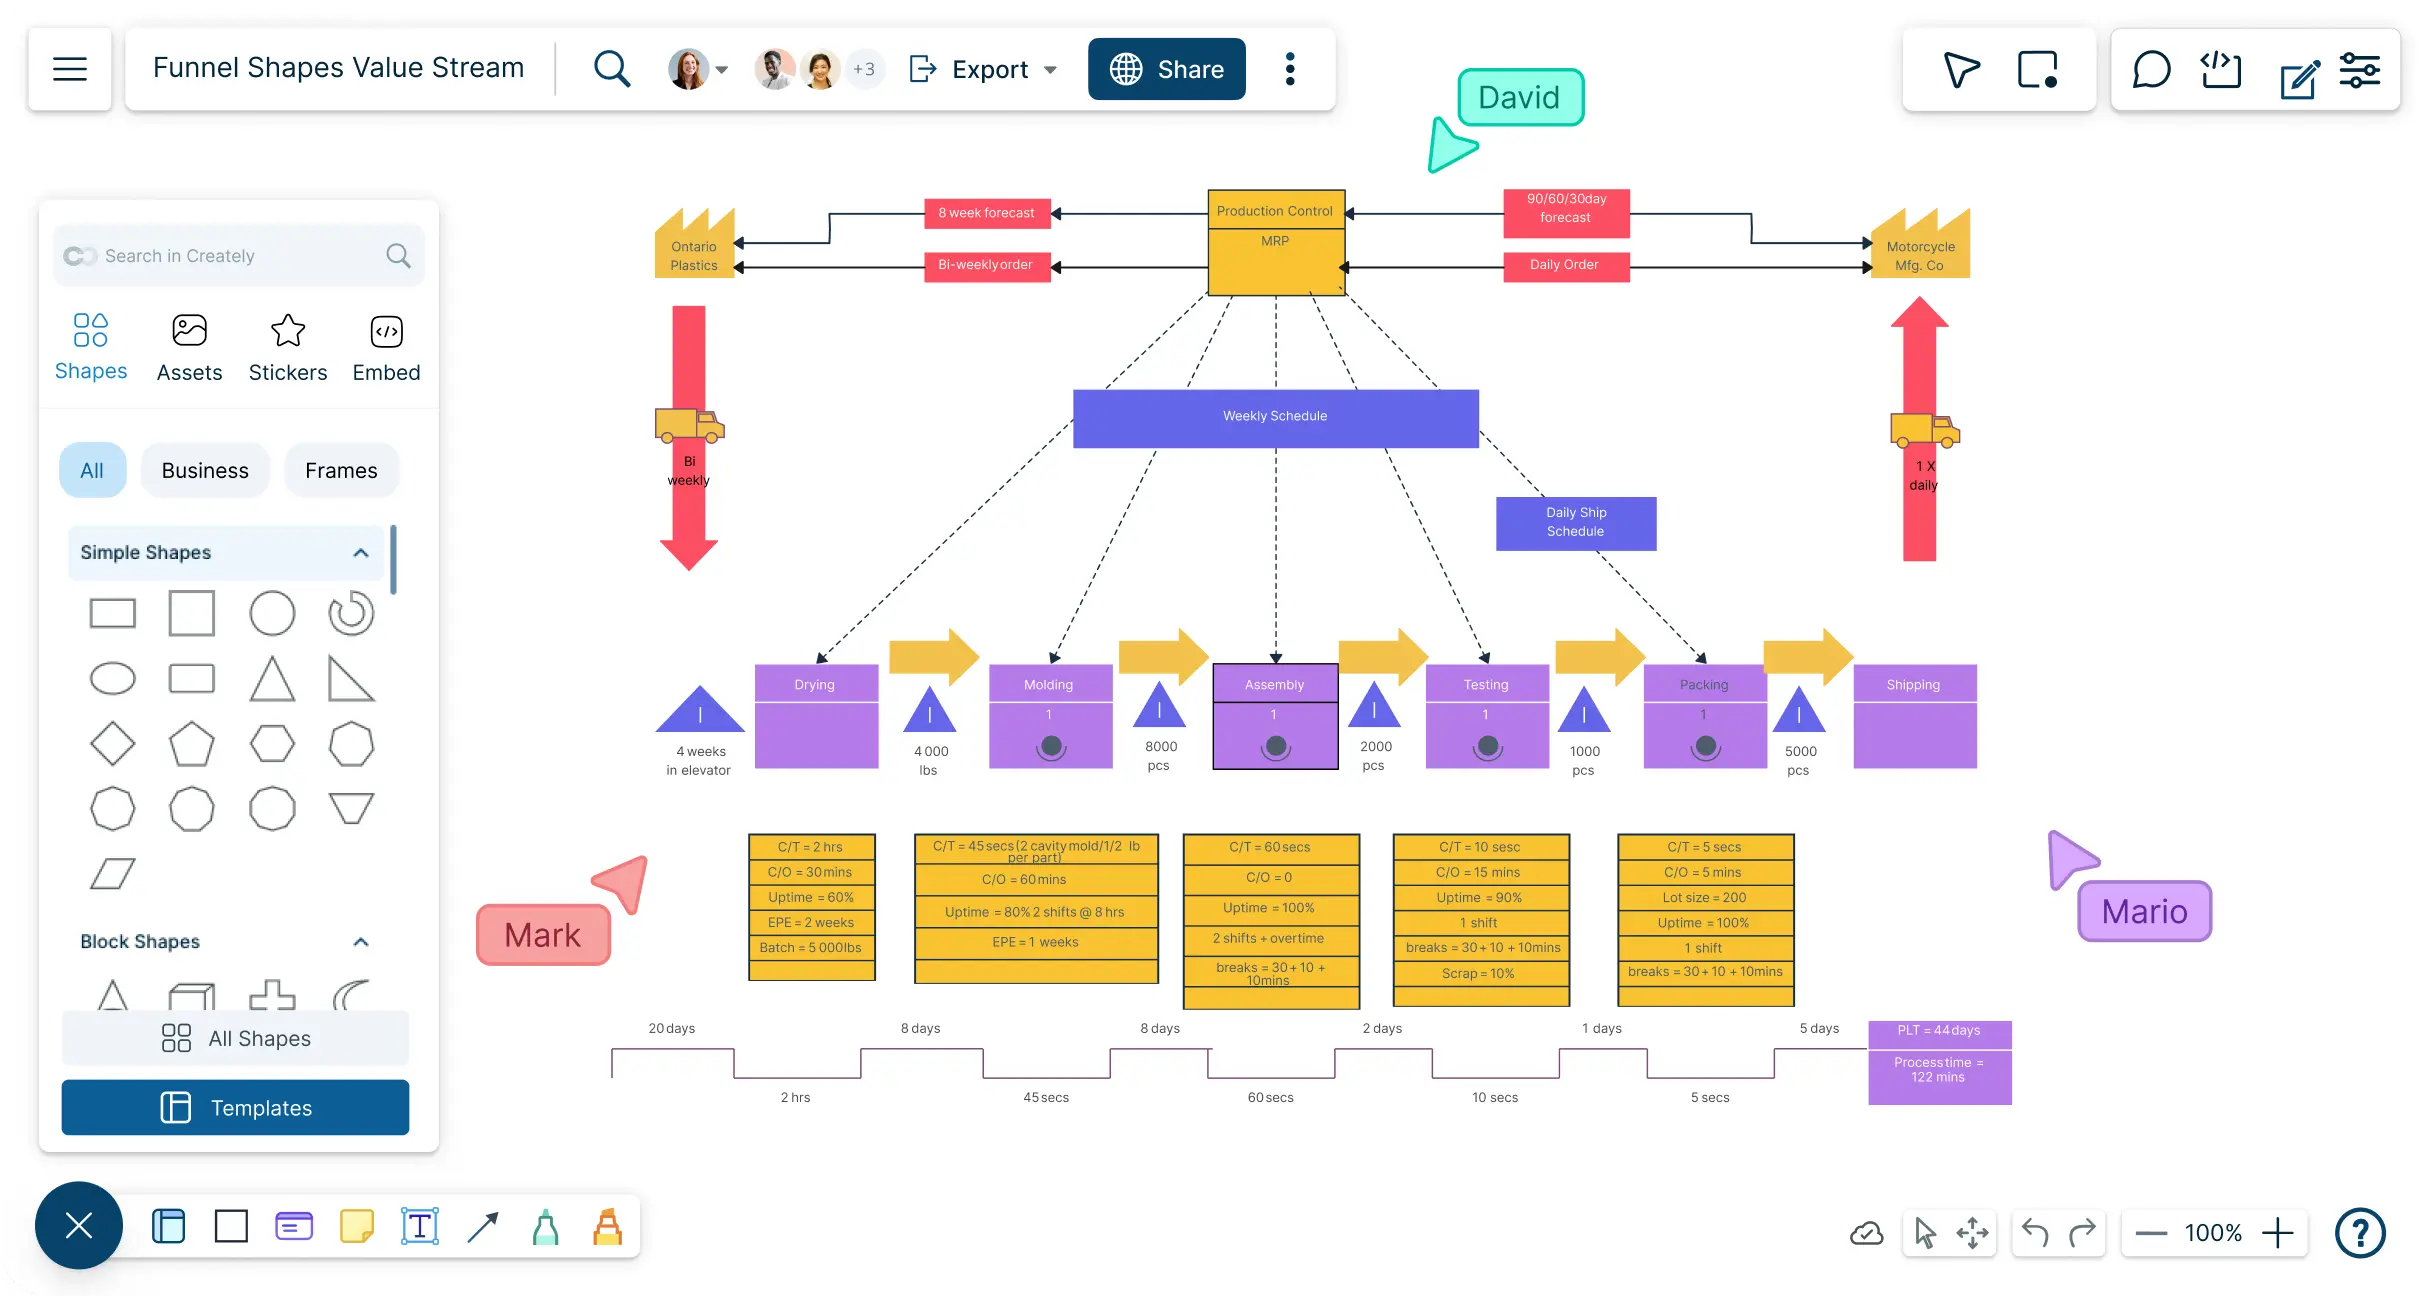
Identify waste and inefficiencies in your existing processes and collaborate to develop solutions for improvement using our advanced value stream mapping online.
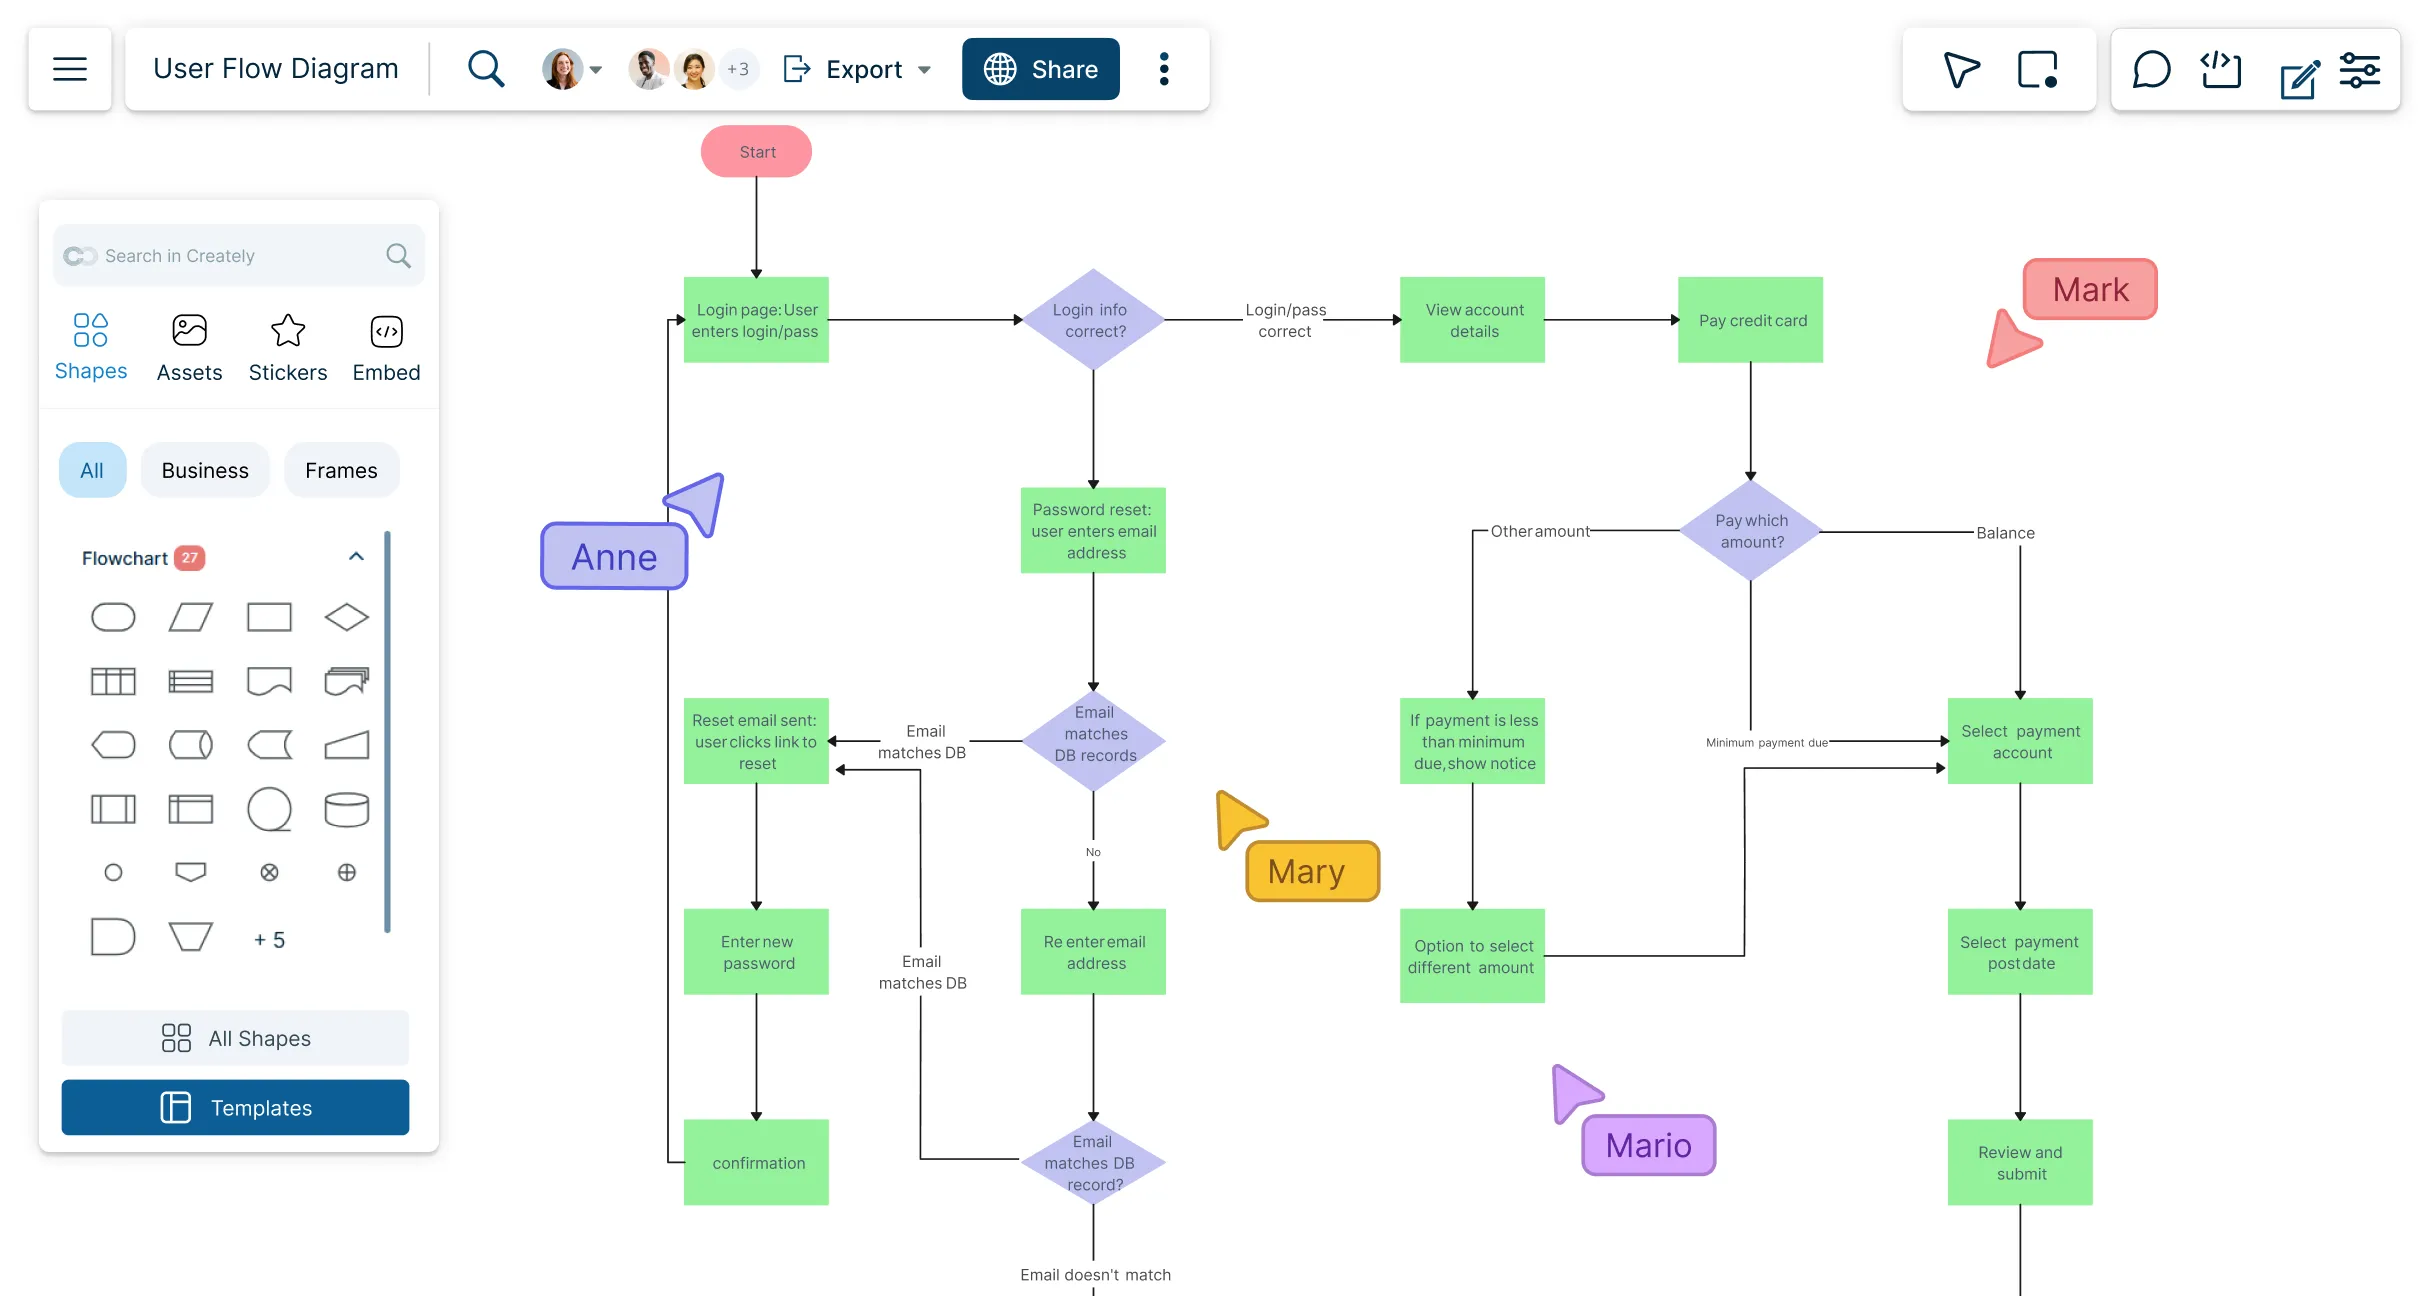
Easily visualize and analyze user flows and decision points throughout your product, identifying critical improvements to enhance user experience with Creately's online user flow diagram tool.
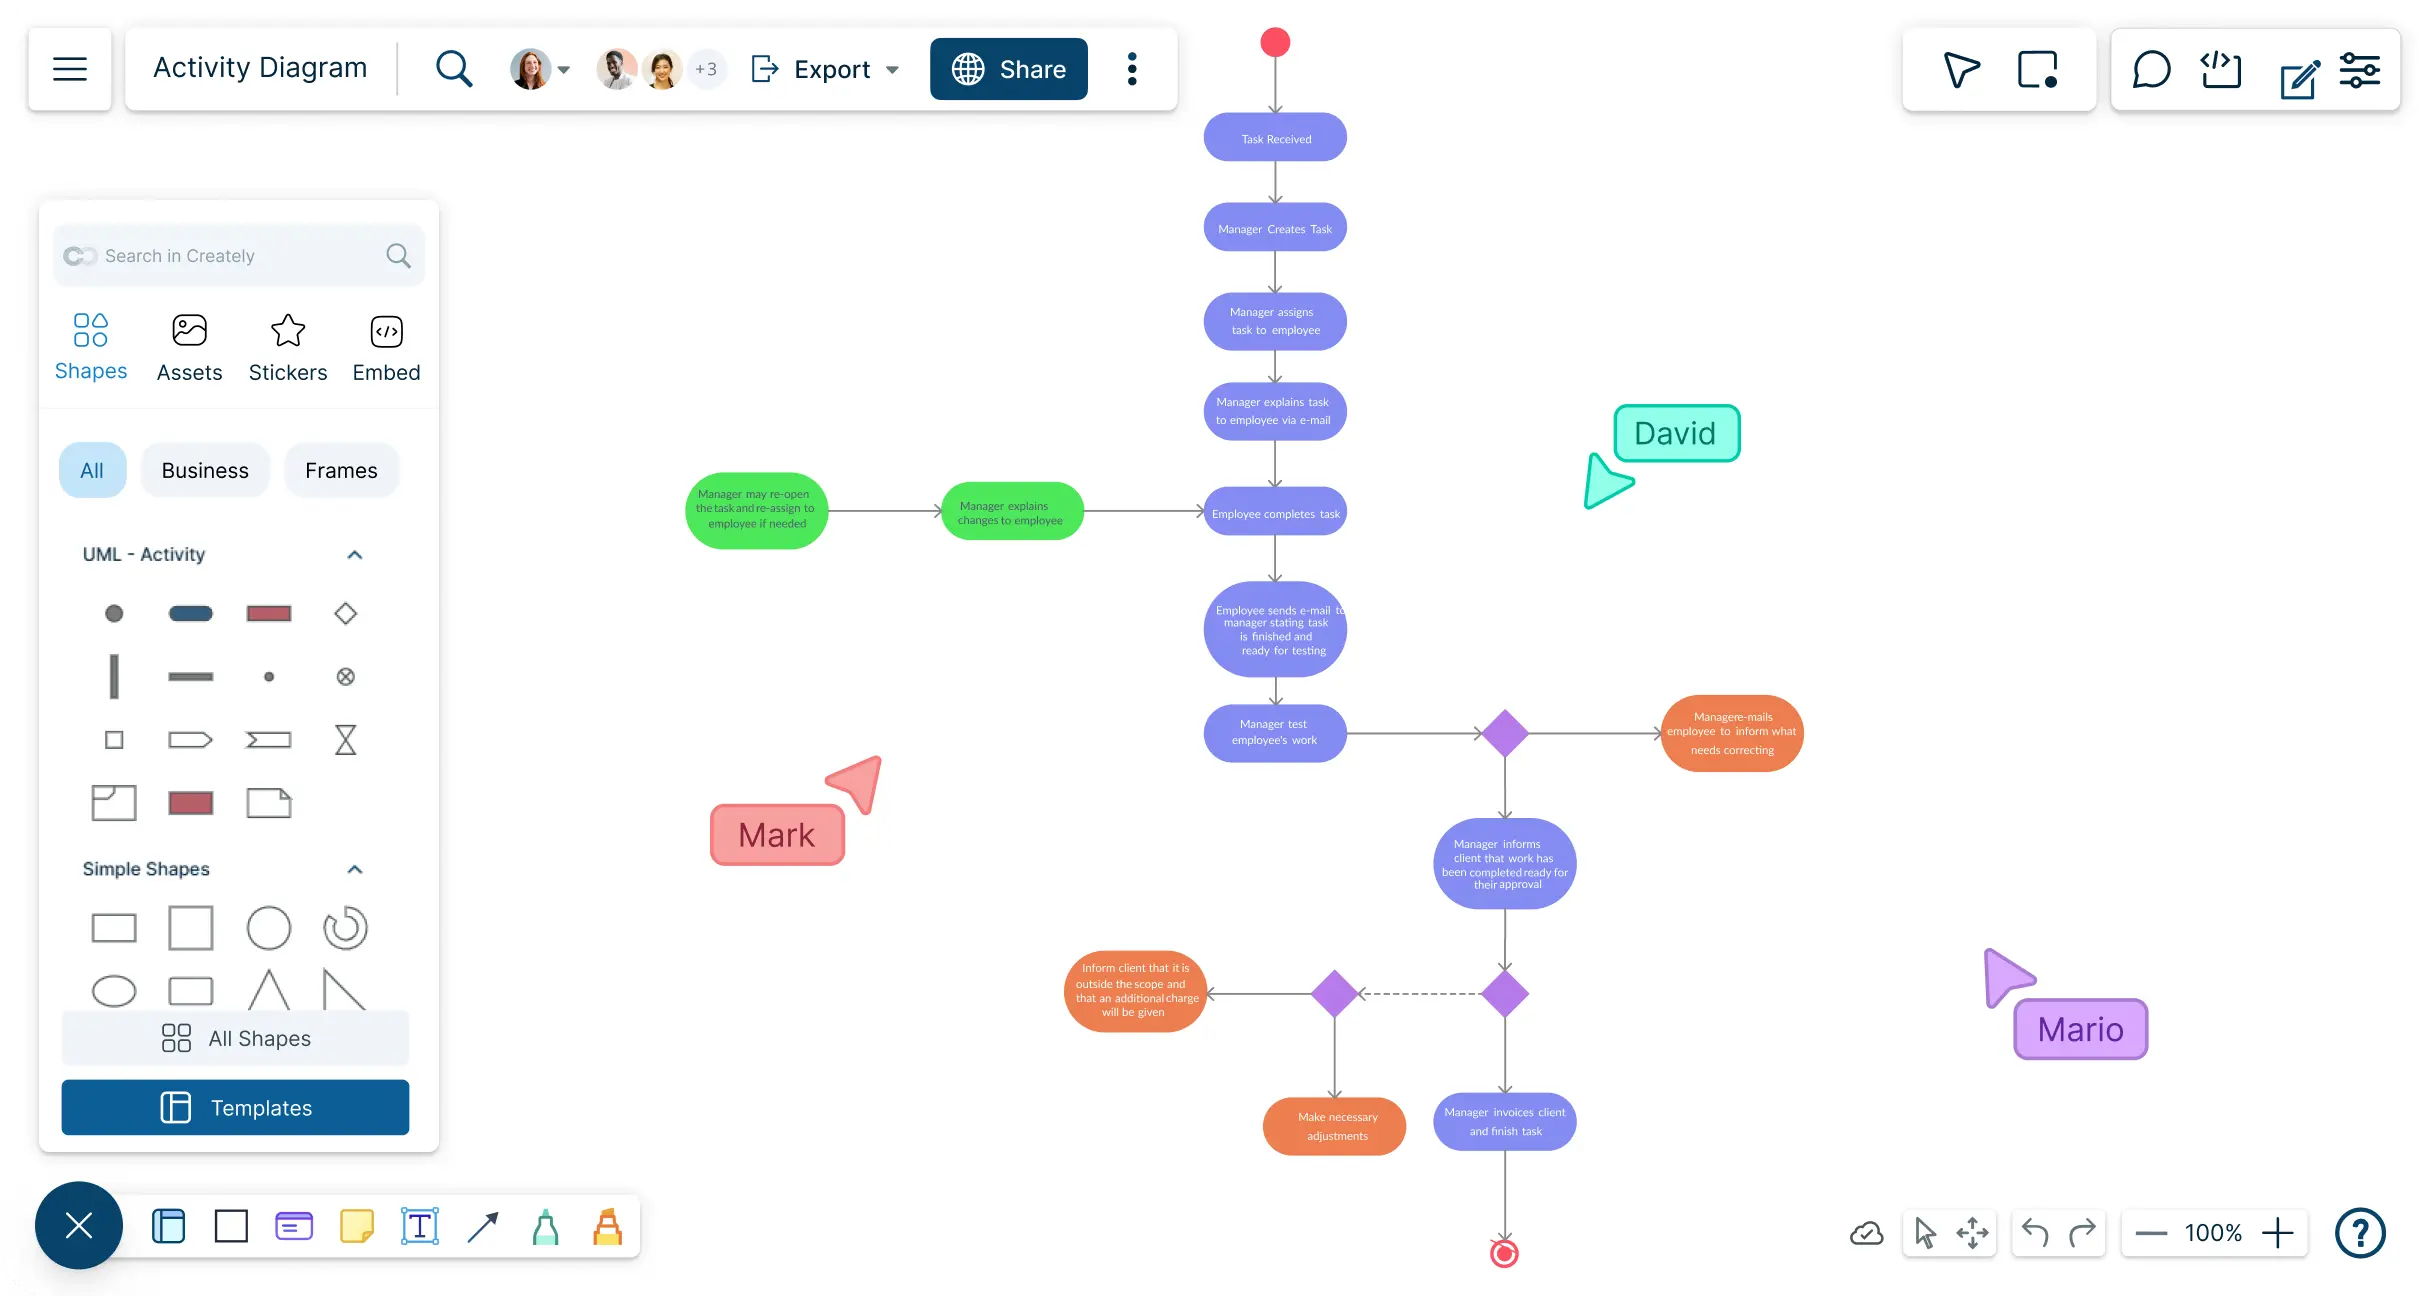
Intuitive activity diagram maker to visualize complex activity flows. Coordinate efforts with your team & develop a shared understanding of systems behavior.
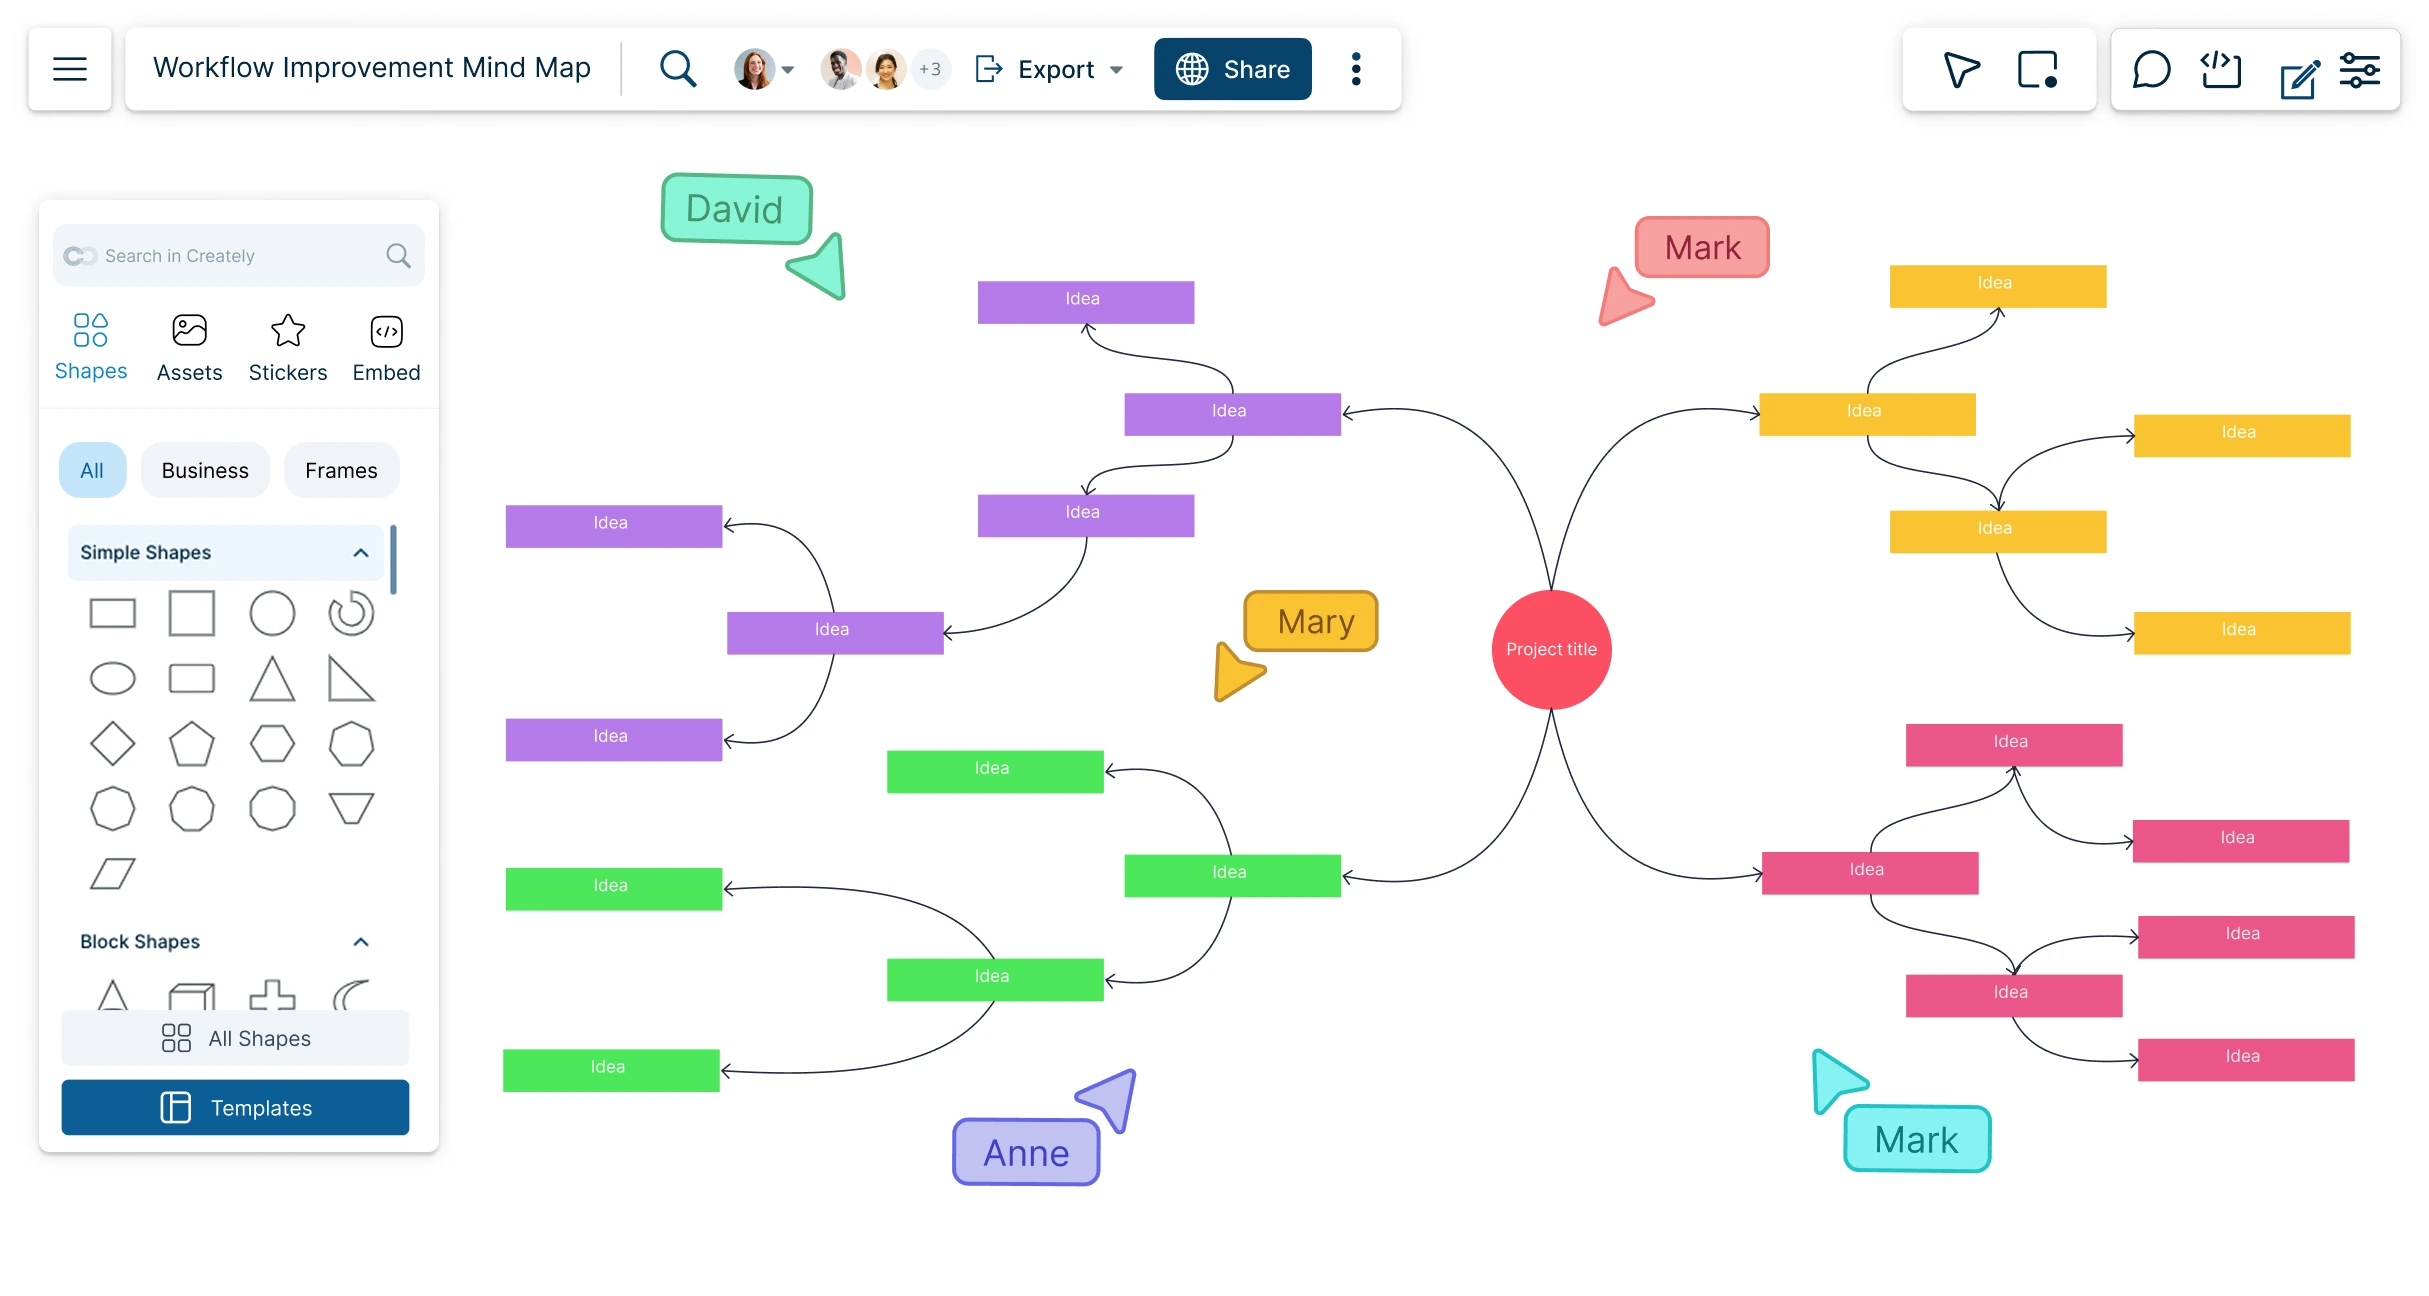
Use the mind map online tool to visualize ideas and concepts for collaborative brainstorming, creative thinking, problem-solving, and so much more.
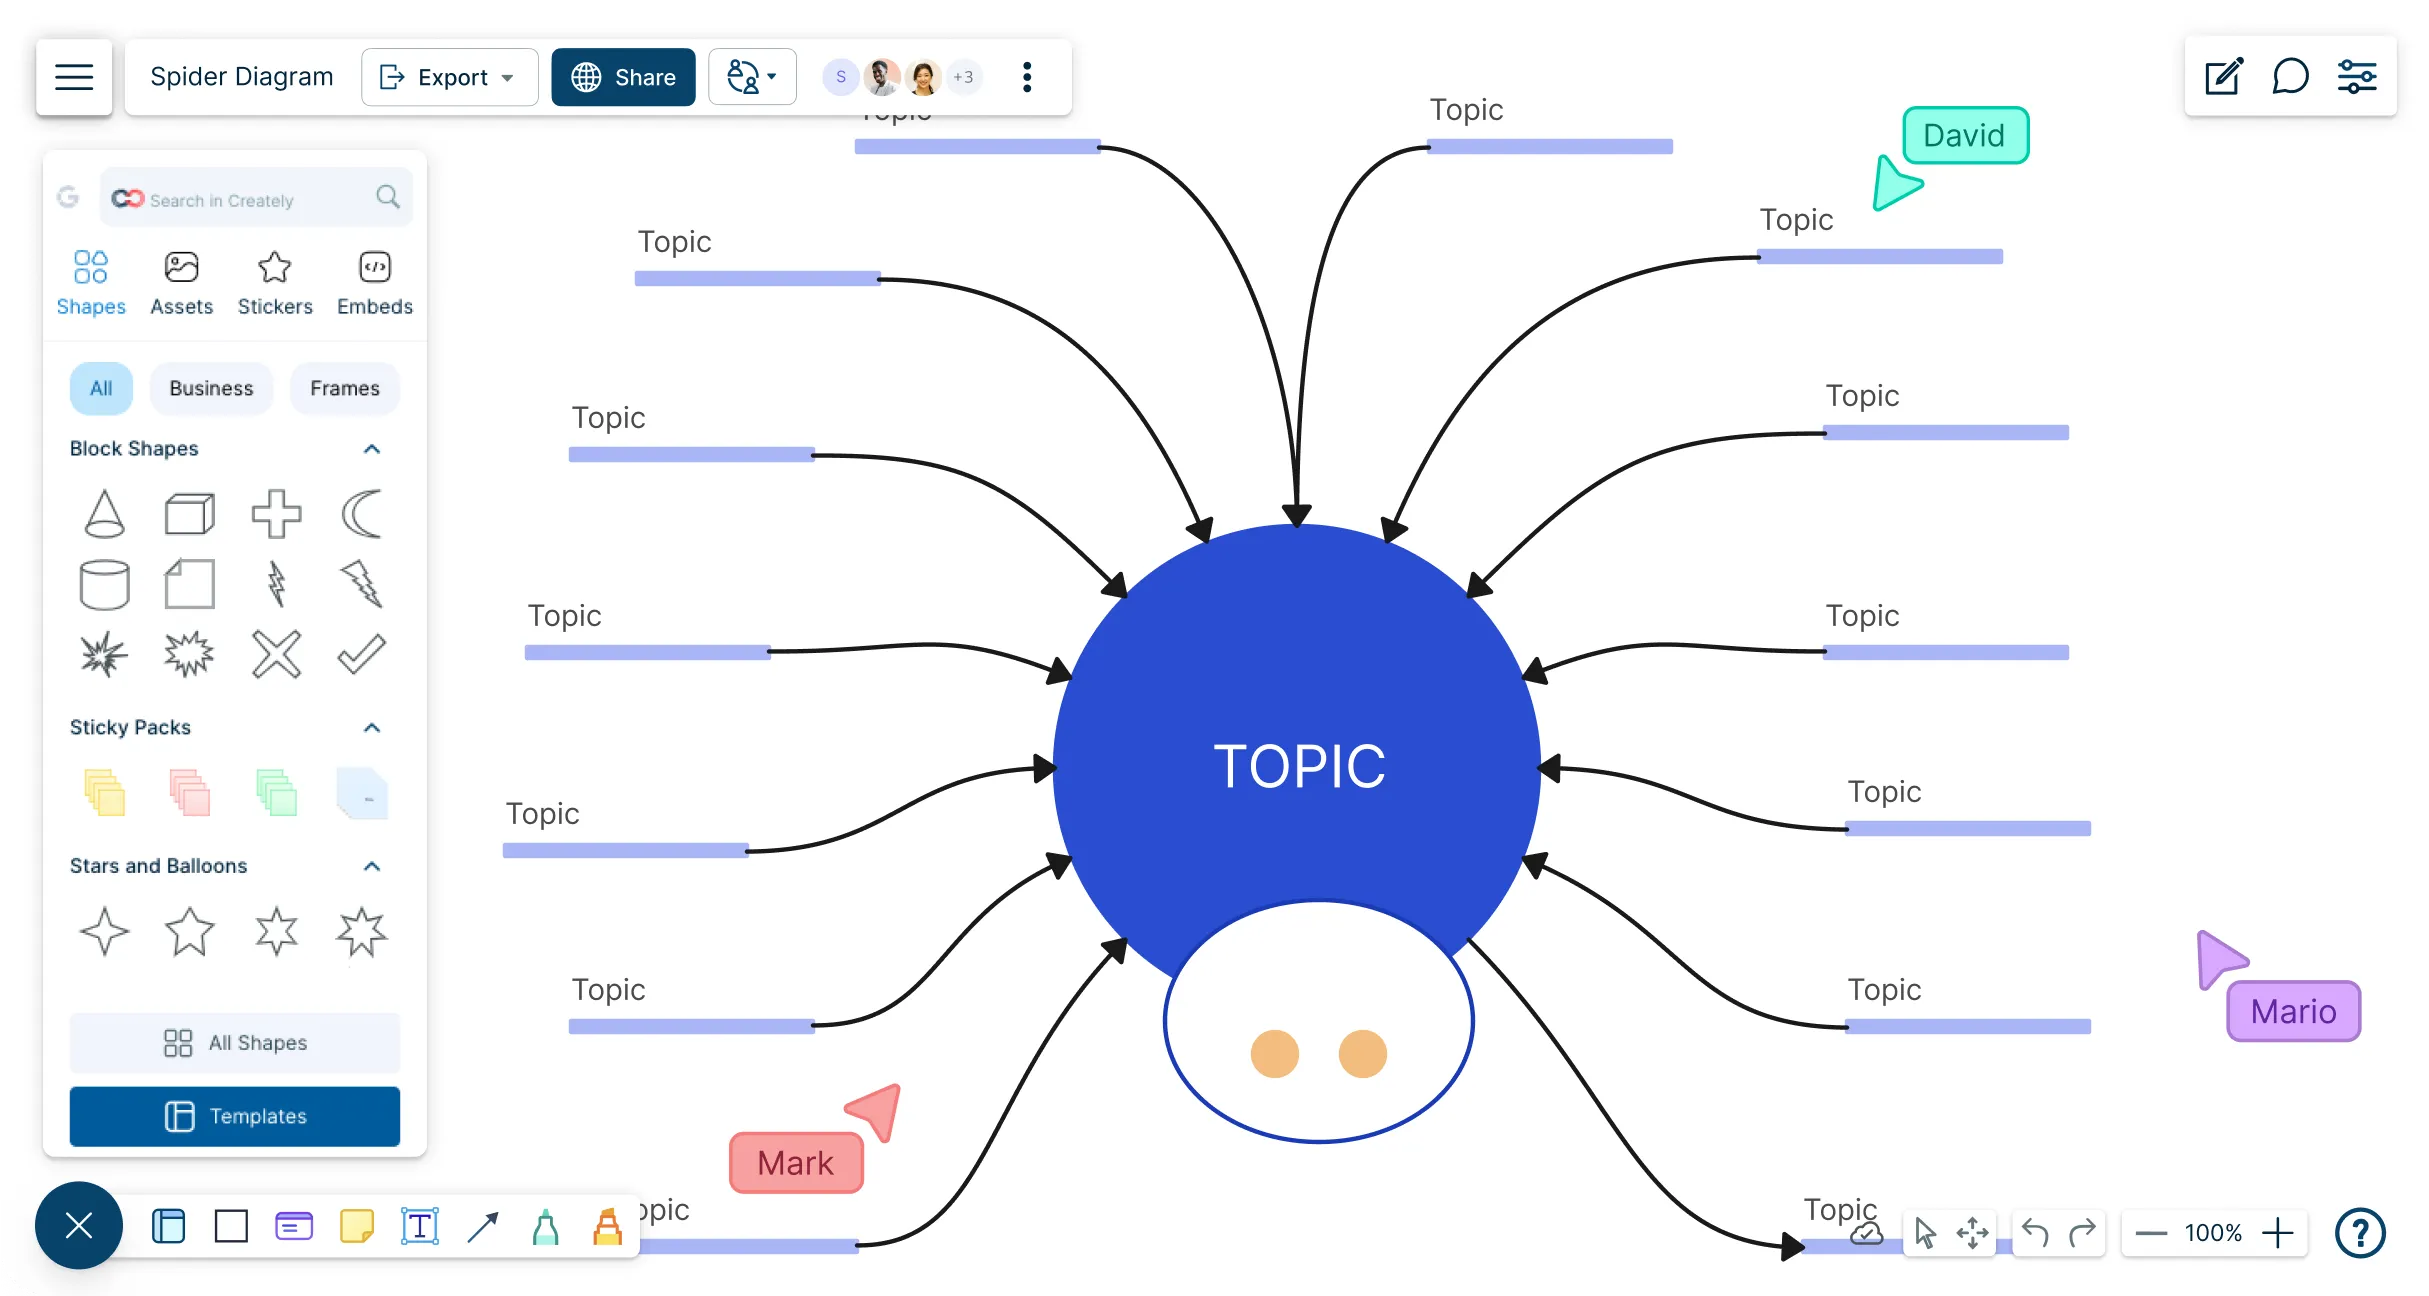
Spider chart maker to brainstorm, structure, and connect concepts in real time. Start with customizable templates and collaborate with your team on an infinite canvas.
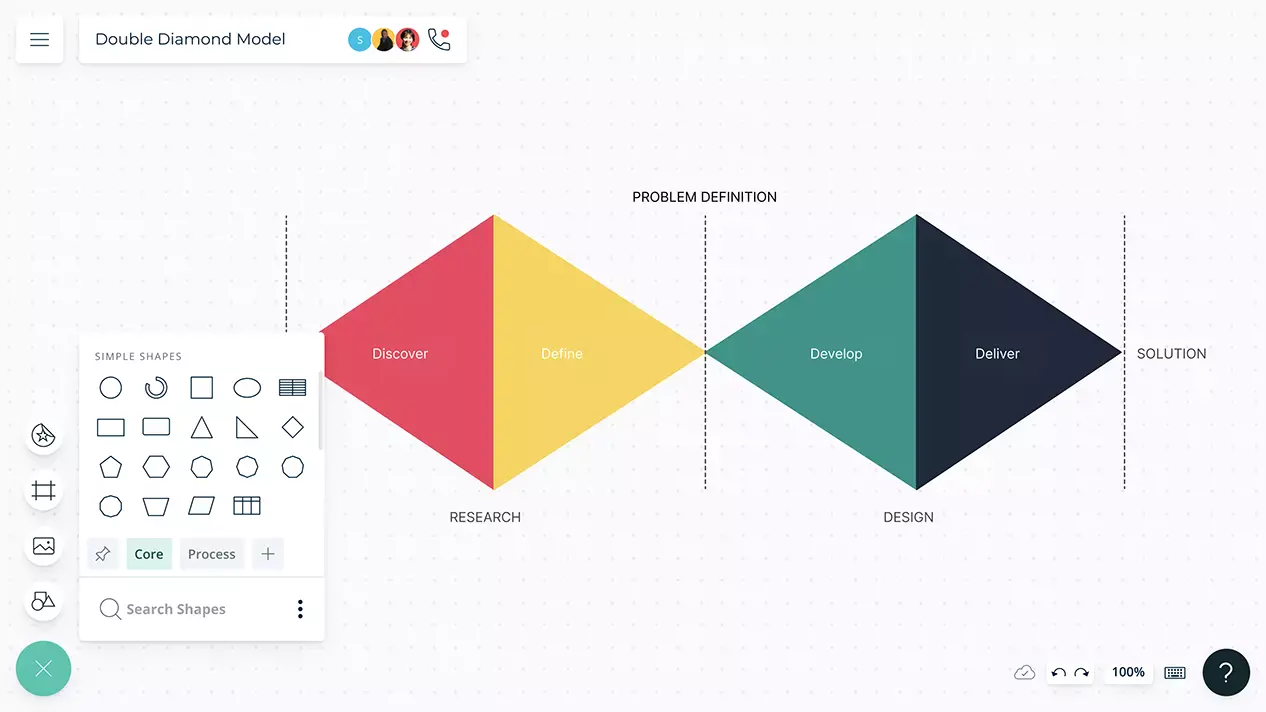
Unified workspaces with advanced real-time collaboration to organize and manage all the key design project stages.
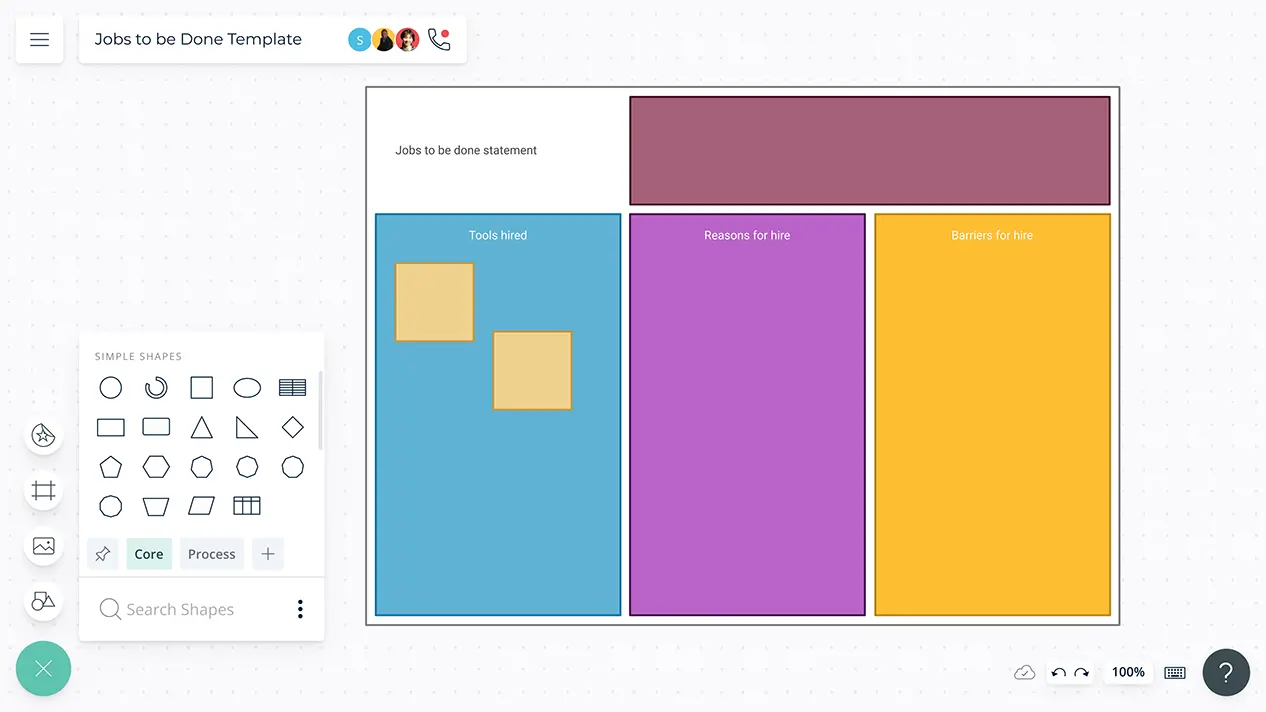
Categorize, capture, and organize all your customers’ needs to create compelling customer experiences.
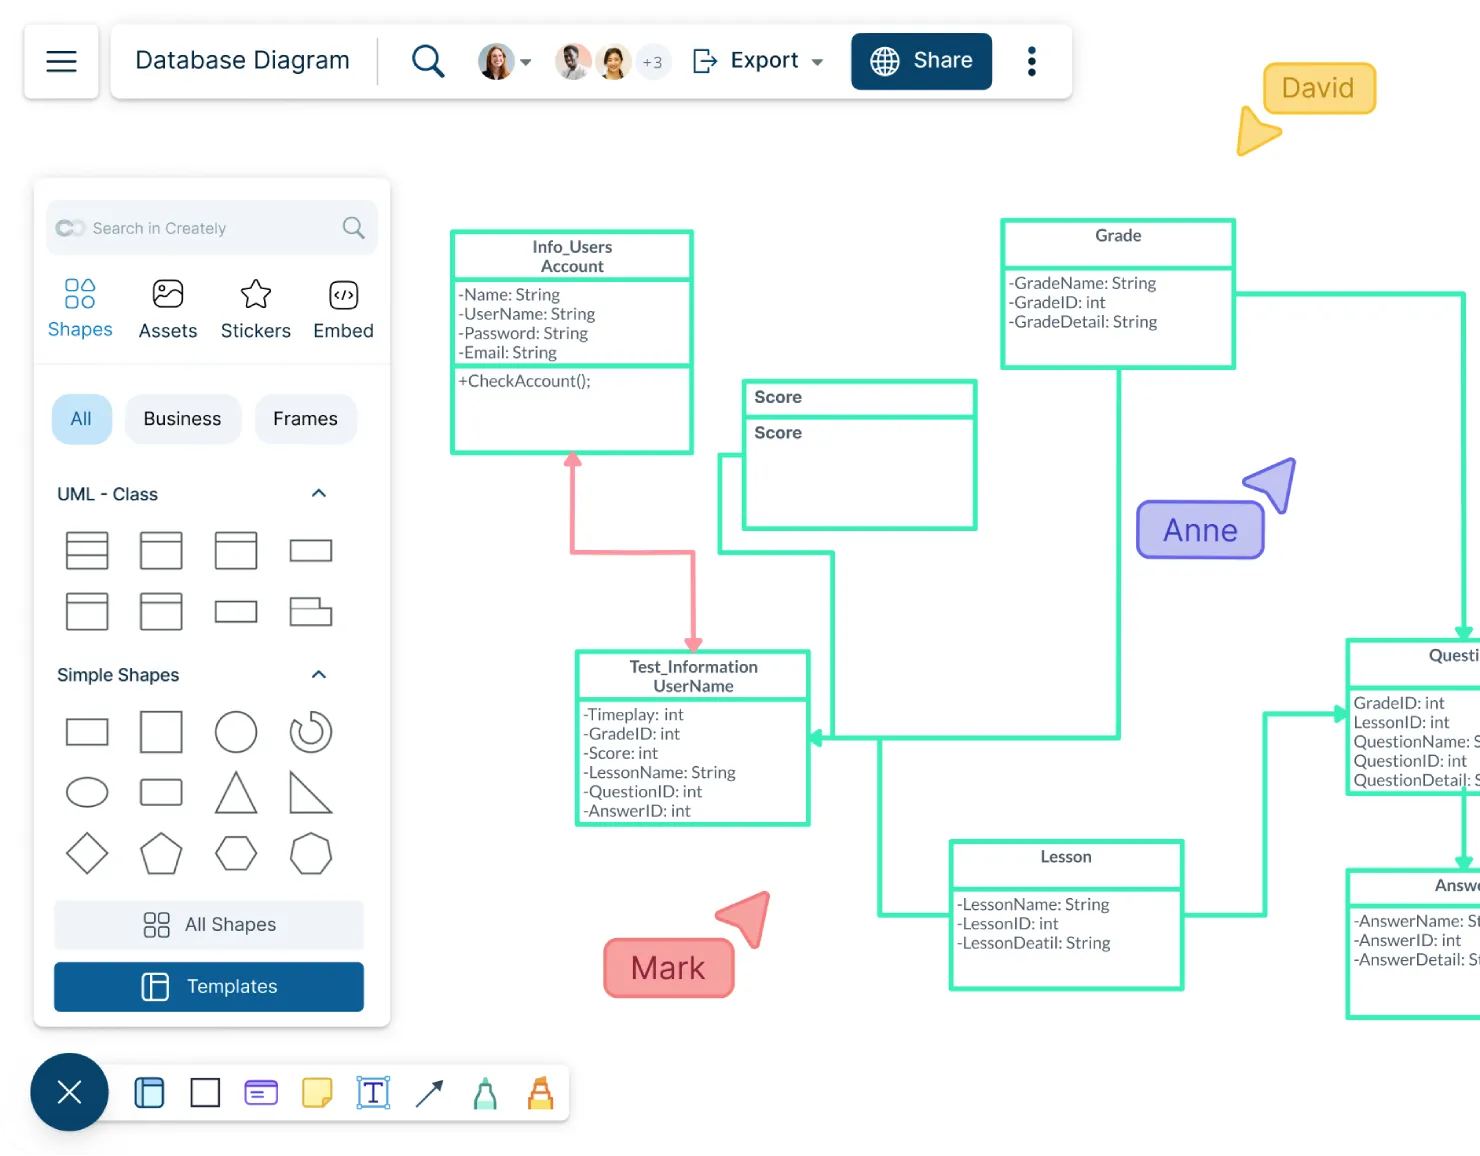
Create complete and accurate databases together with your team.