Online Chart Maker
Data Visualization Made Simple and Fast with Online Charts
Create stunning graphs and charts that visually represent data with Creately’s online chart maker. Plot diagrams with ease, discover and analyze the relationship between data.
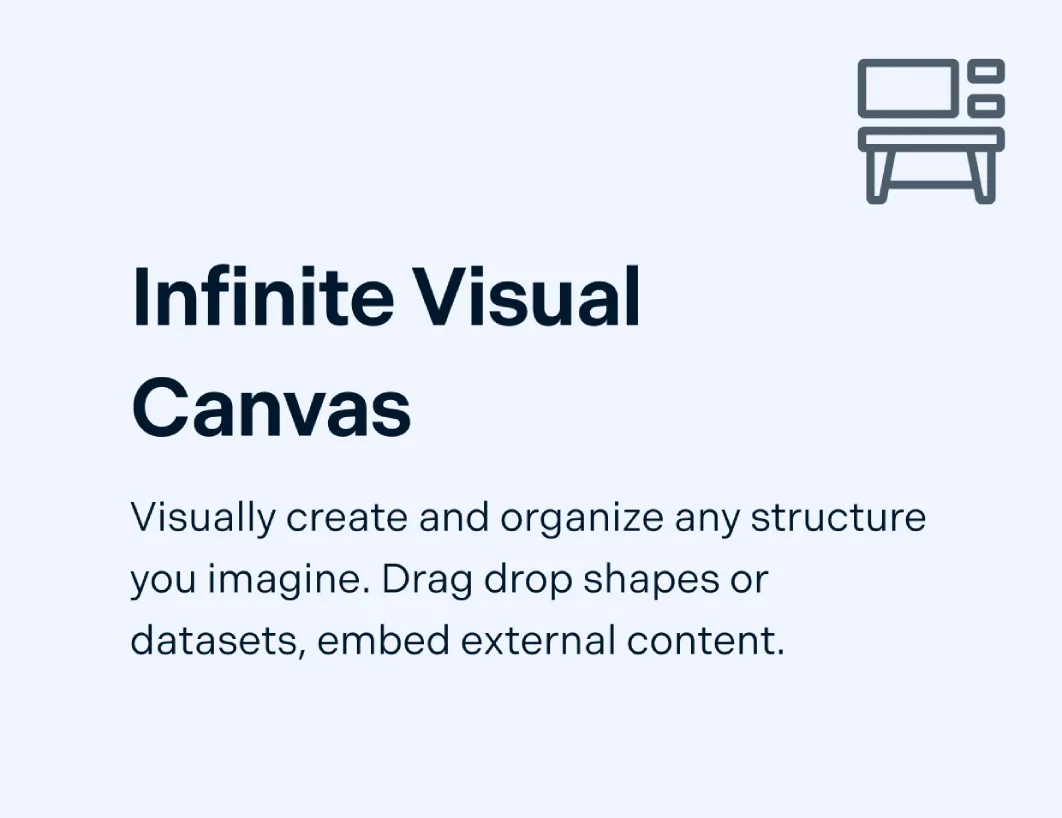
Visualize your data in multiple ways using different diagram & chart styles
Instantly create visually appealing presentations
Graph maker with customizable templates to get a head start


 Diagramming Visual Collaboration Org Chart


Effectively Narrate Your Data Story

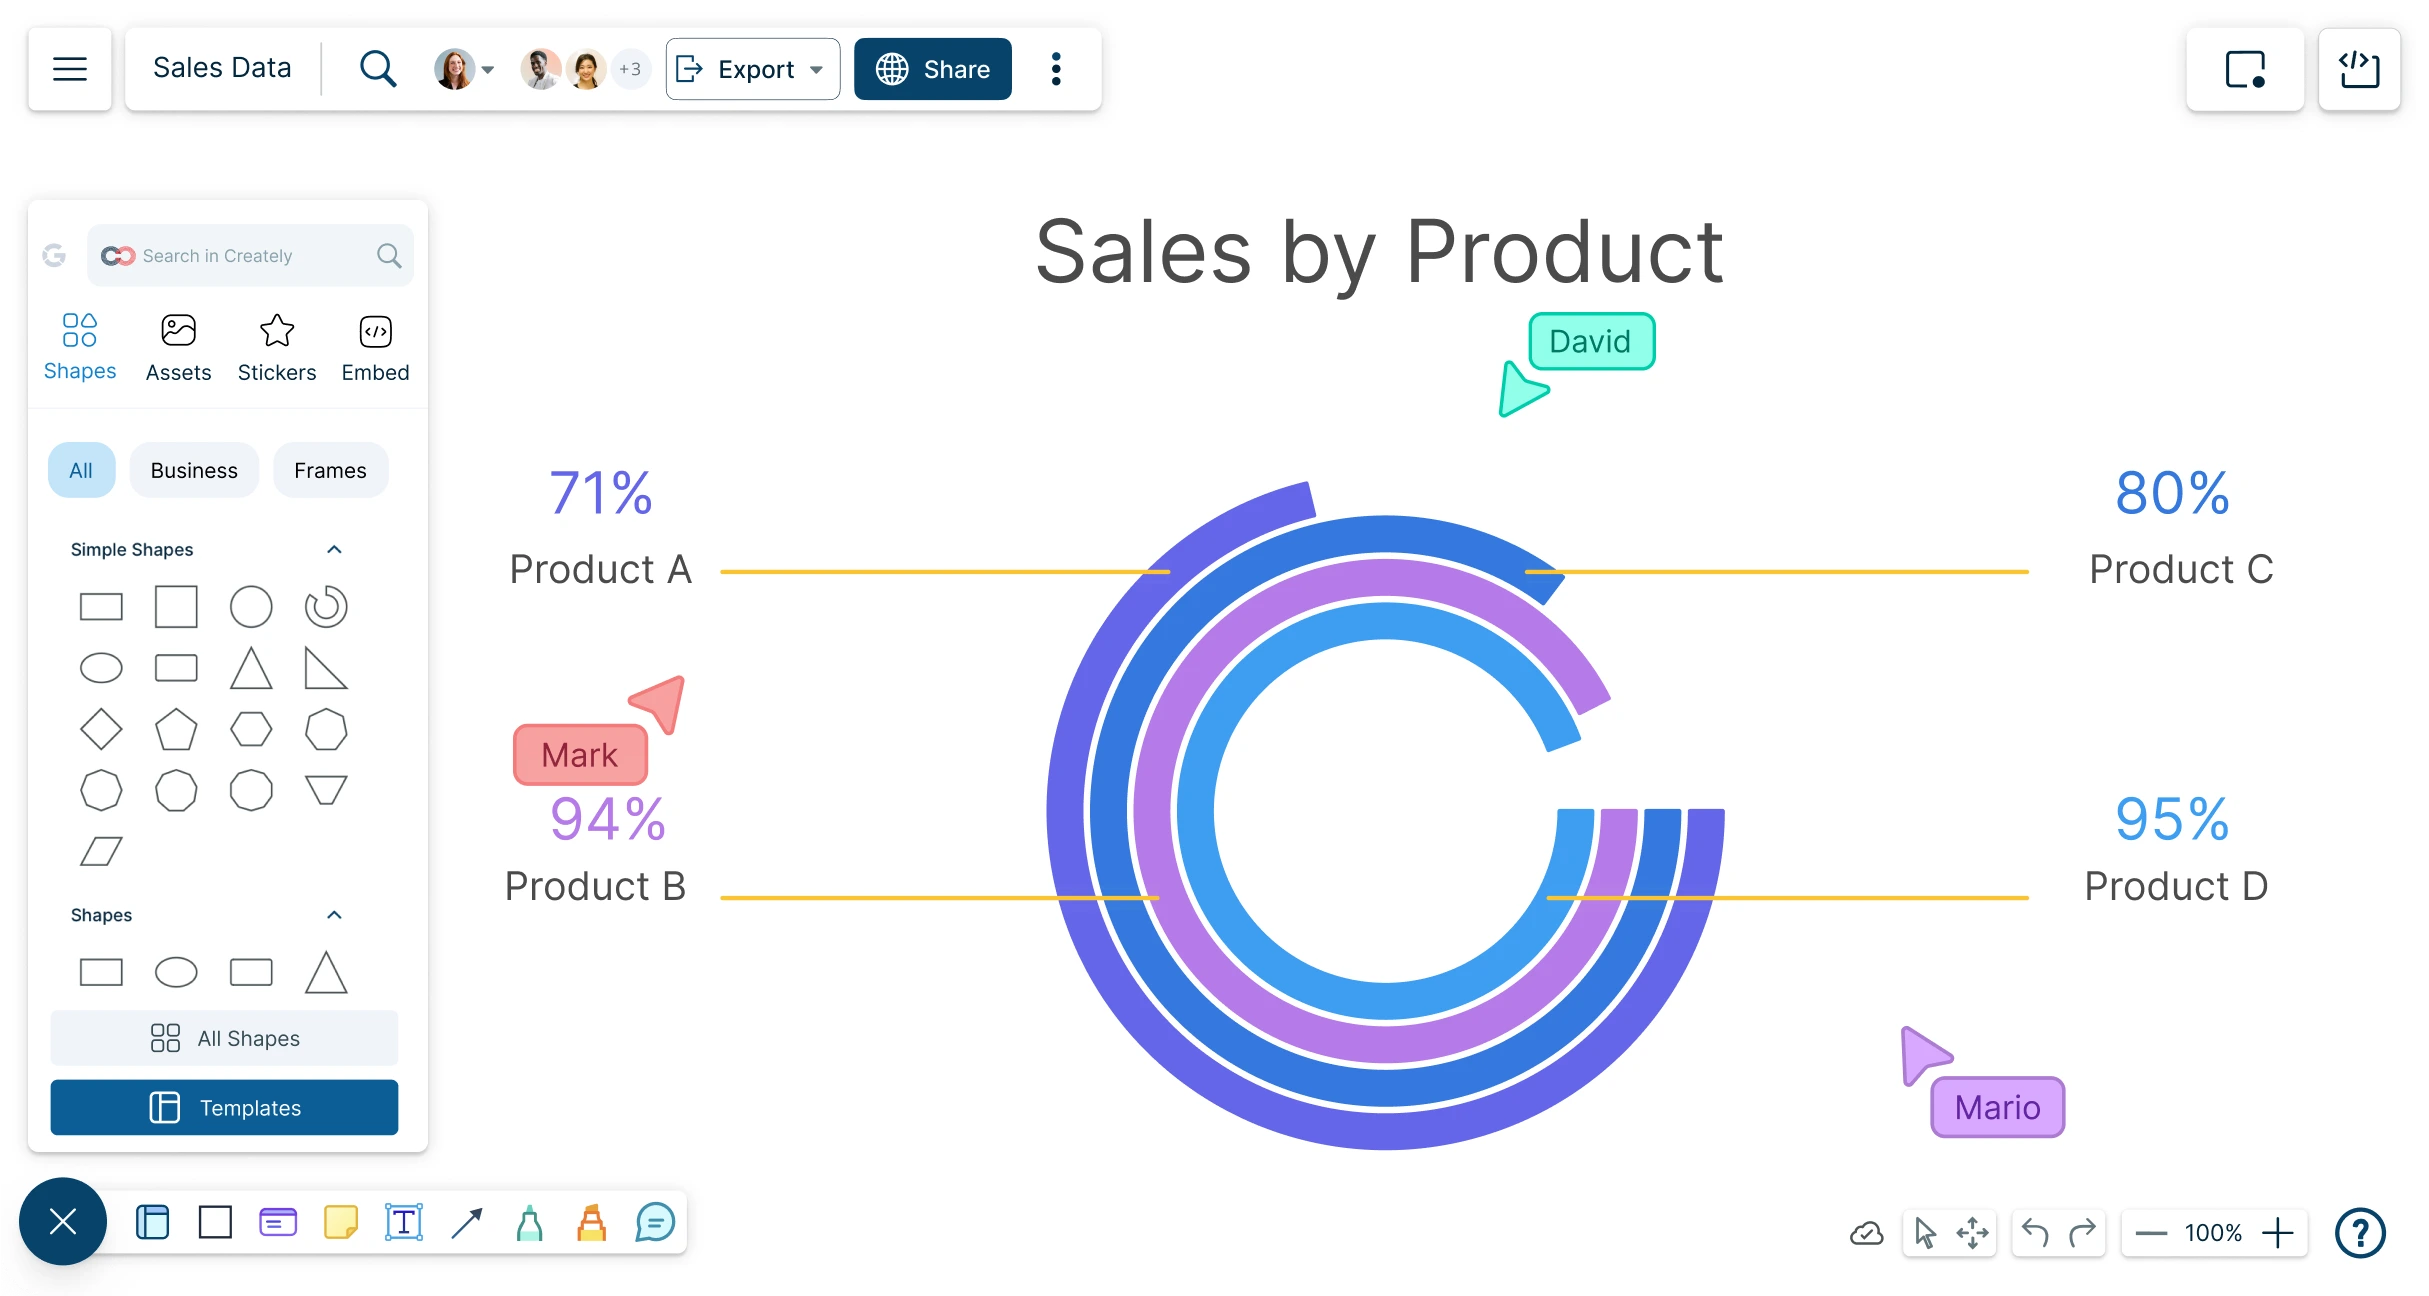
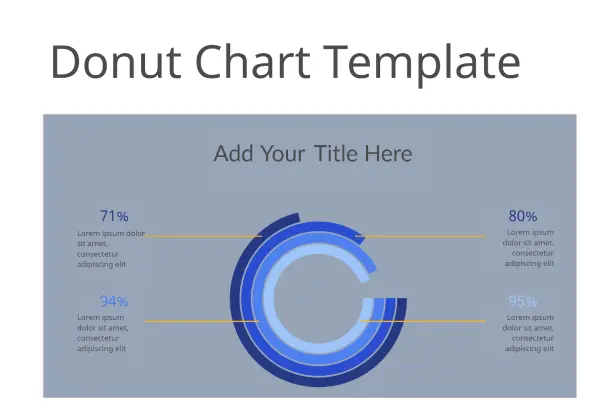
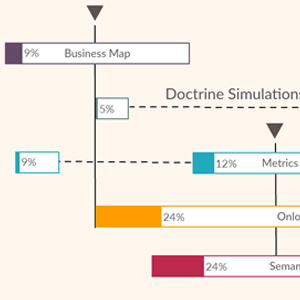
Easily create pie charts, bar graphs, scatter diagrams, and more with simple-to-use drag and drop tools.
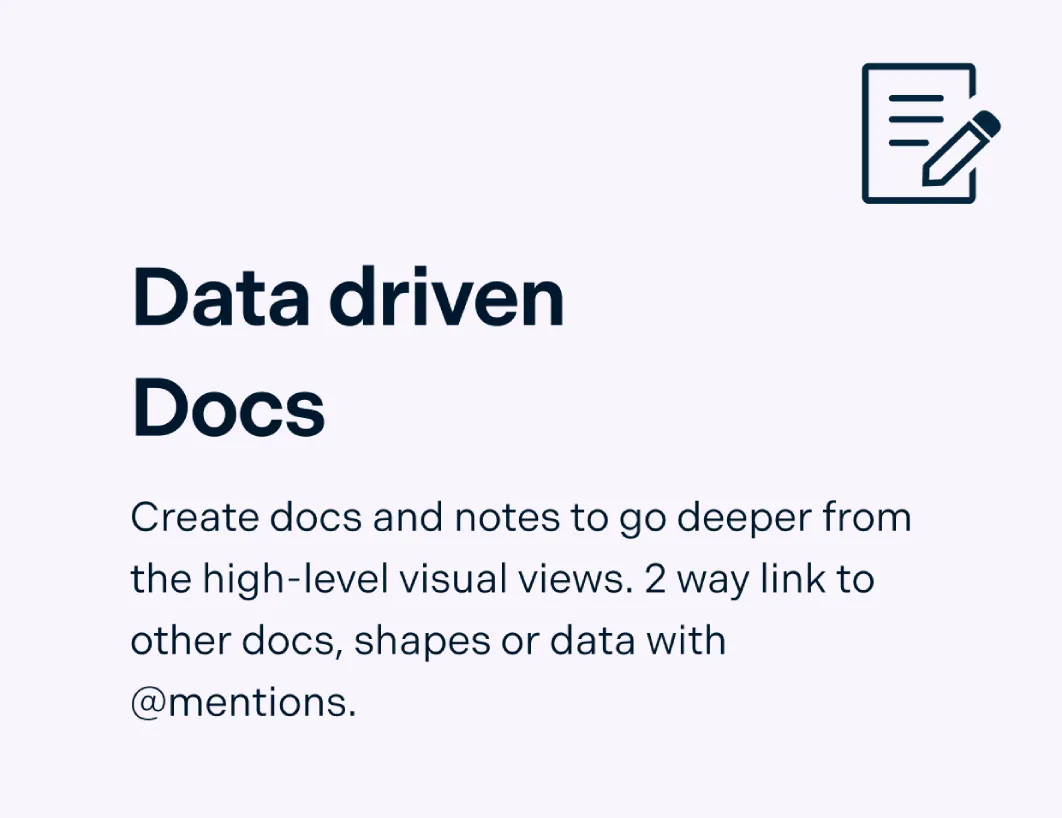
Add notes, references and links to source data for further analysis and better context.
Represent your data in multiple ways with specialized icon libraries.
Create highly customizable online charts with professional color themes, styling and formatting options.

Make Data-Driven Decisions Collaboratively
Have interactive sessions with teams on a real-time shared canvas.
Have in-depth discussions with @mentions, comments and threads.
Create presentation-ready charts that can be shared with anyone via an email or link invite to collaborate on.
Multiple app integrations to help you import and export data across teams on different platforms.
Augment Your Data

Link charts to documents or datasets in Creately to keep all project information connected in one workspace.
Export graphs and visuals in multiple formats including PNG, JPEG, SVG, PDF and more.
Universal text search to locate relevant information in complex data visualizations.
Import images, vectors, and more into the canvas to provide more context to your data visualizations.
What is an Online Chart Maker?

How to Make a Graph in 5 Easy Steps
Choose a Chart Template
Launch Creately and select a ready-made chart template from bar graphs to flowcharts. You can also use the relevant shape library to quickly create one from scratch.
Add Data & Chart Elements
Drag and drop chart elements onto the canvas. Use custom properties and fields to define your data, labels, and chart structure.
Customize the Chart
Personalize your chart with icons, images, preset color themes, and advanced text formatting. Use the notes panel or sticky notes to add context, explanations, or references directly on the chart.
Collaborate to Refine
Invite team members to the same workspace to co-edit. Share insights with real-time collaboration, inline comments, and version history to refine your chart together.
Review, Share & Export
Finalize your chart and share via secure links, embed it in documents or websites, or export as PNG, SVG, PDF, or JPEG for printing, publishing, or presentations.
Create a ChartCreate Charts Online with these Free Customizable Templates


FAQs About Creately’s Online Chart Maker
What are Creately’s free online chart maker pricing plans?
- Free Plan — $0/month for basic online chart creation and collaboration
- Starter & Team Plans — $8/month or $5/month billed annually
- Business Plan — $149/month or $89/month billed annually
Annual billing helps you save more while unlocking advanced collaboration, workspace management, and enhanced online chart features. You can compare all available plans and features on the Creately Pricing Page.
How can you create charts faster?
Are there templates for different chart use cases?
Can teams collaborate on charts?
Can I add notes, data, and files?
Can I share, present, or export charts?