PERT Chart Maker
Your Ultimate PERT Chart Tool for Streamlined Project Planning
Easily schedule, organize, and map project tasks and keep track of dependencies in a single collaborative, visual platform with Creately’s best PERT Chart Maker.
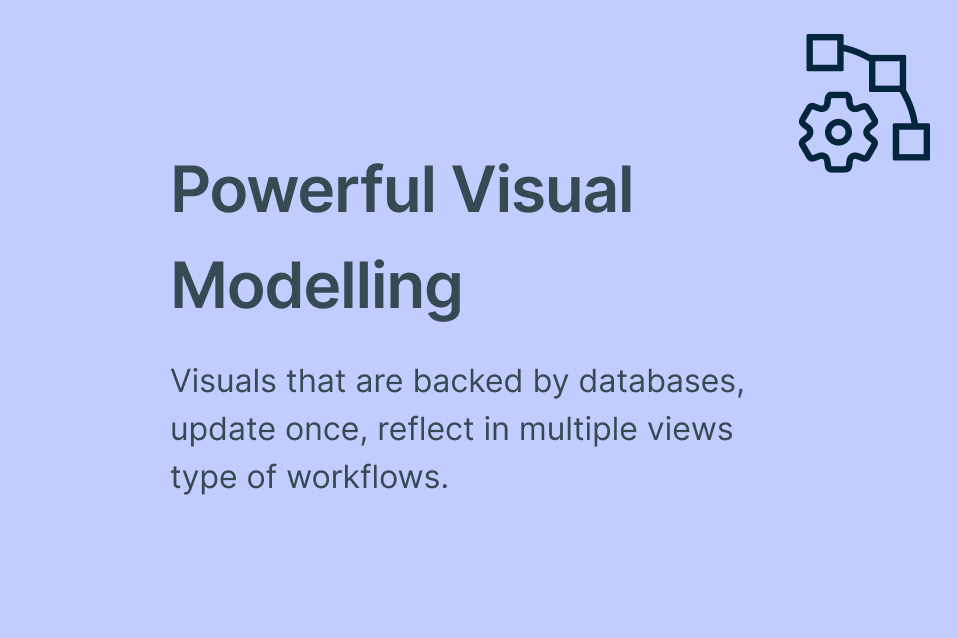
Built-in tools for visual project management
Customizable templates for planning & tracking
Real-time collaboration to work with teams


 Diagramming Visual Collaboration Org Chart


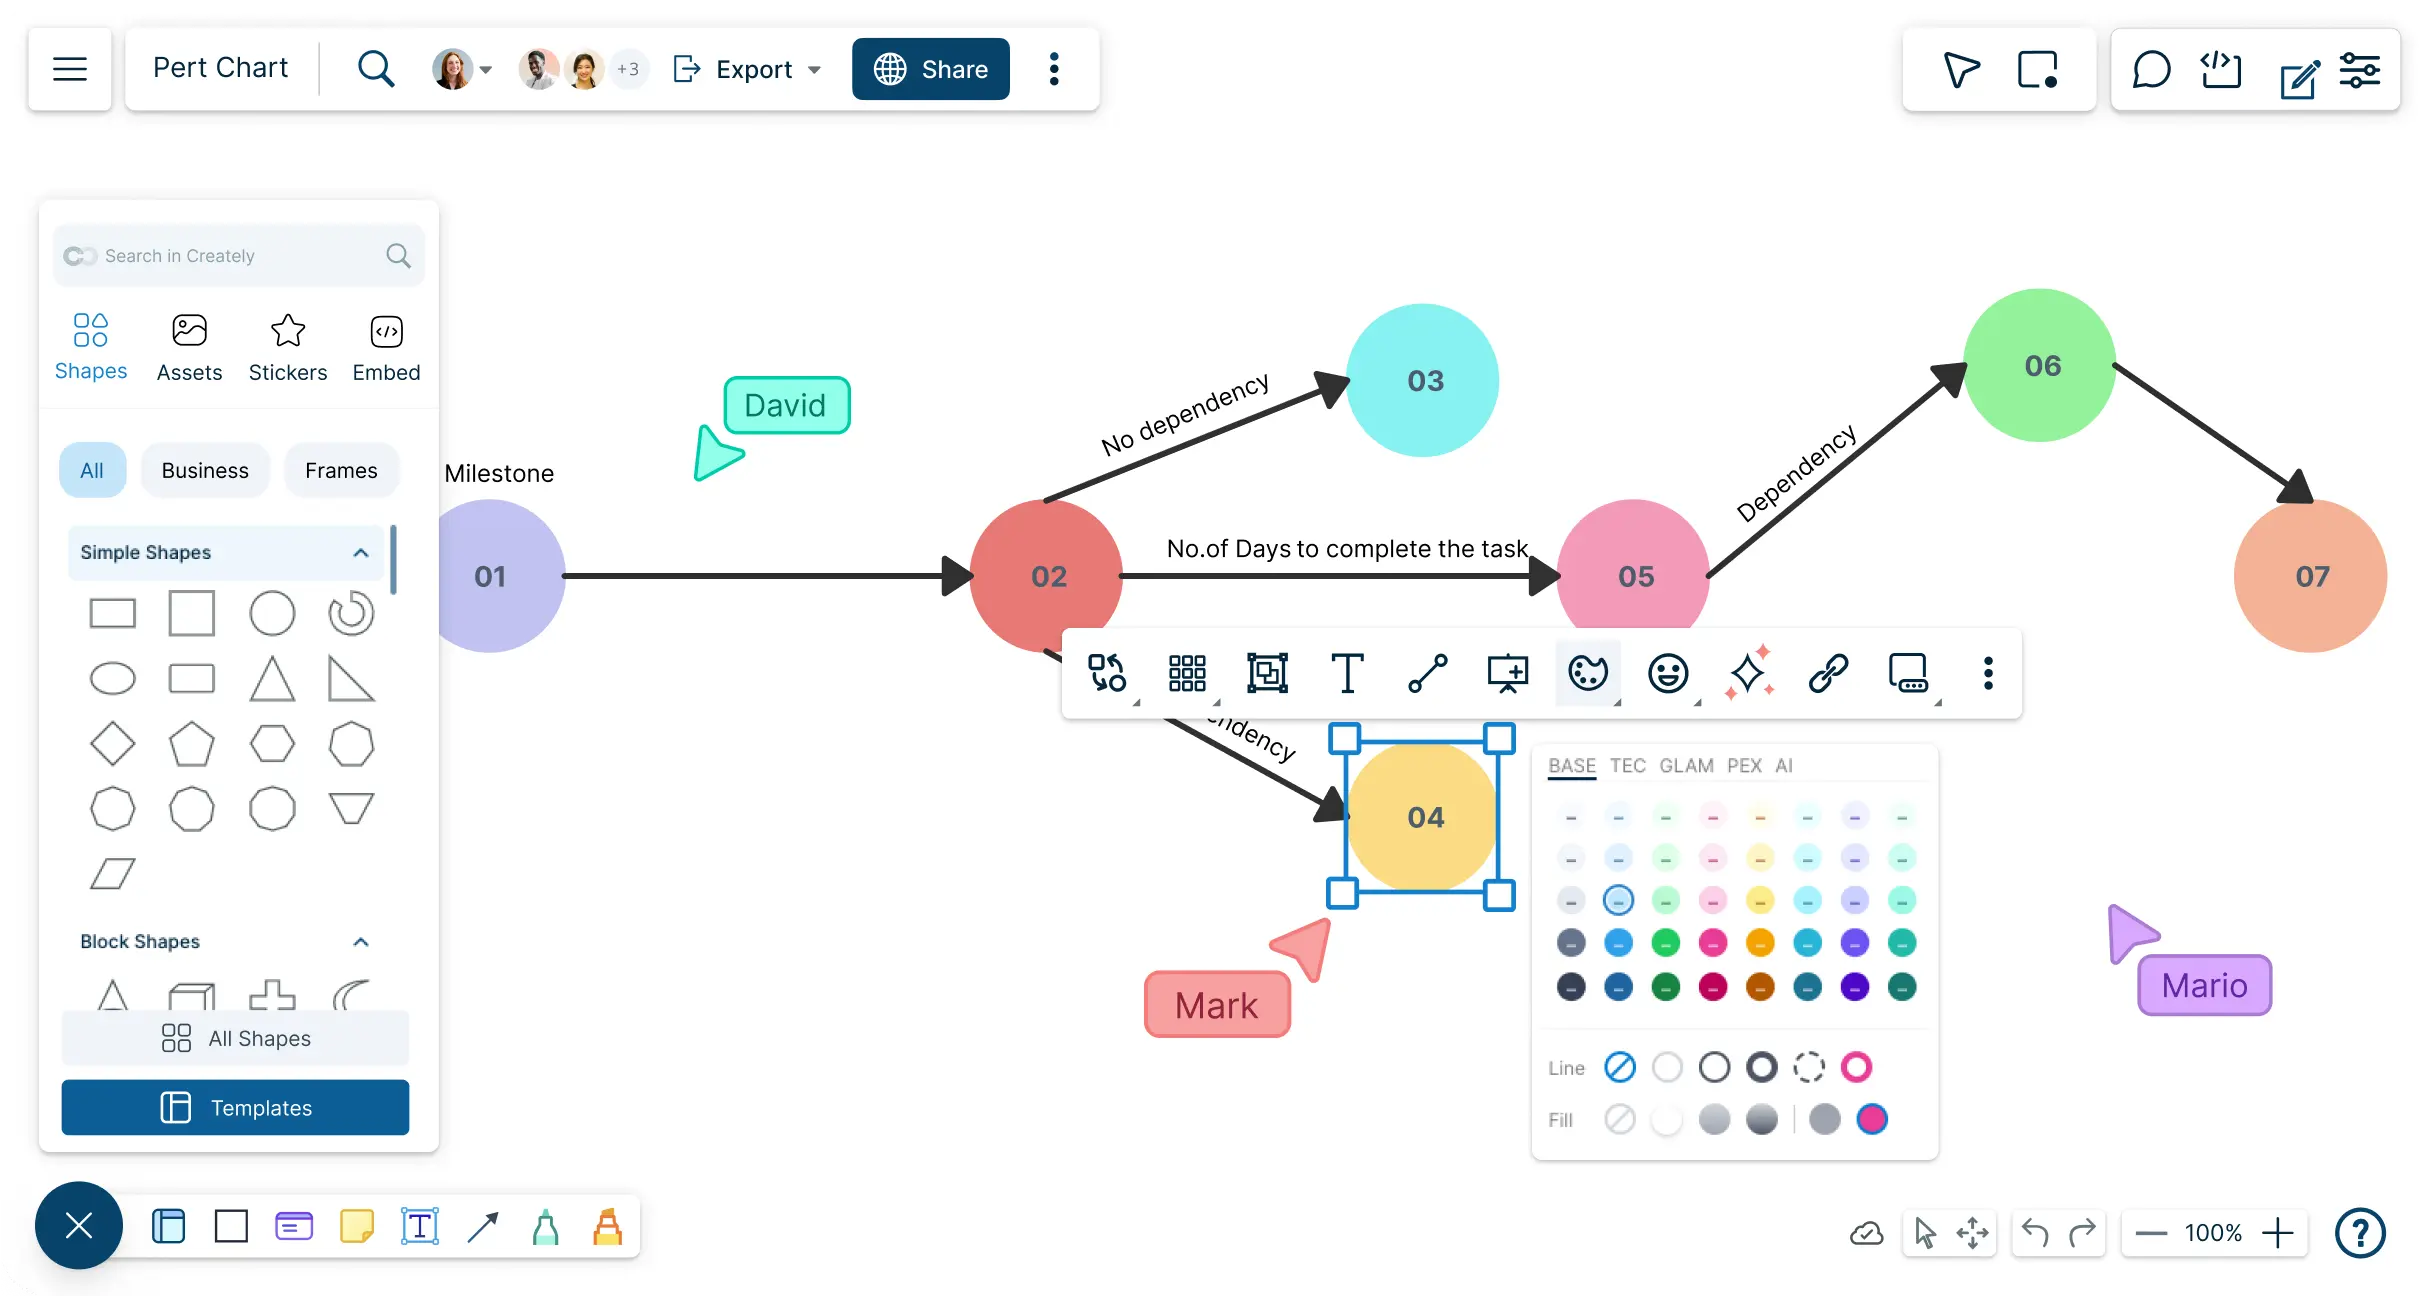
PERT Chart Software to Visually Map out Complex Projects in Minutes

Use PERT Chart templates to easily identify critical paths and dependencies.
Plan projects, schedule tasks, & monitor progress centrally with our PERT chart creator.
Link to Gantt charts, project timelines, work breakdown structures, workflows, and more.
Centralize all project information from plans to meeting notes in a single place.

Collaborative PERT Chart Generator to Keep Everyone & Everything in Sync
Collaborate with teams and clients in real-time to plan and execute projects.
Have discussions and follow-ups on the same canvas.
Use @mention comments to assign people to tasks.
Import data from other project management tools with multiple integrations.
Intuitive PERT Diagram Creator to Better Manage Task Progress

Set estimated times and due dates for tasks.
Allocate resources based on availability and skill sets.
Attach additional information to each node with integrated notes.
Connect to roadmaps, Kanbans and more to begin executing your project.
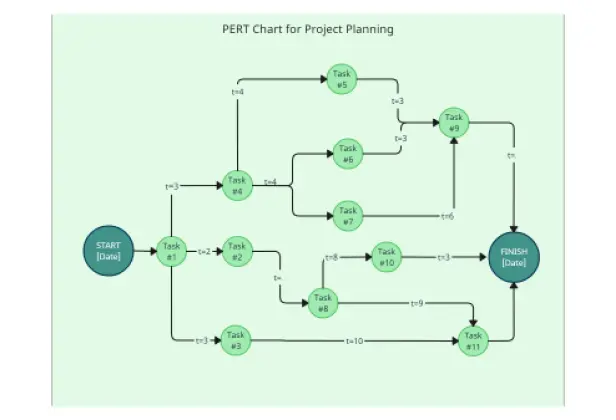
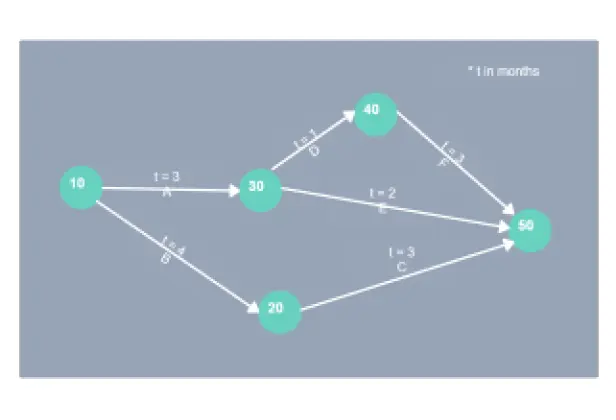
What Is a PERT Chart?

How to Make a PERT Chart with Creately’s Online PERT Chart Maker?
Launch Creately
Open a workspace in Creately’s PERT Chart Maker and add your project team as collaborators for seamless planning.
Identify Milestones and Tasks
Use mind maps or post-it notes to break project milestones into individual tasks, preparing them for visualization in your PERT Chart tool.
Define Dependencies and Estimate Durations
Map out which tasks depend on others and estimate the time required for each task. This helps determine the critical path in your PERT Chart software.
Build Your PERT Chart
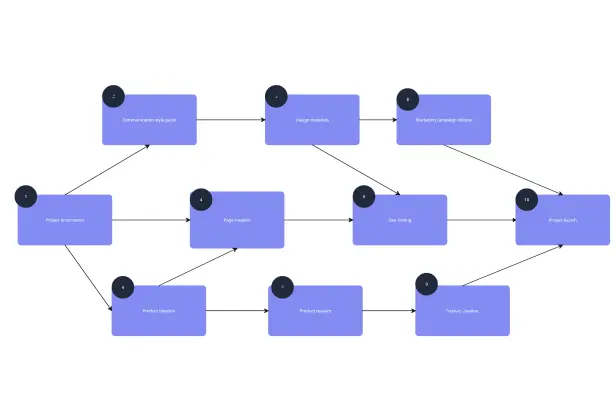
Use a prebuilt PERT Chart template or create one from scratch in the PERT diagram generator, connecting tasks and setting up a clear workflow.
Review, Update, and Share
Refine your chart for readability, update it as tasks progress, and share or export it with stakeholders using Creately’s PERT Chart Maker.
Create a PERT ChartCreate Your PERT Chart Diagram Online with These Free Editable Templates

FAQs About the PERT Chart Maker
What are Creately’s pert chart maker pricing plans?
- Free Plan — $0/month for basic pert chart creation and collaboration
- Starter & Team Plans — $8/month or $5/month billed annually
- Business Plan — $149/month or $89/month billed annually
Annual billing helps you save more while unlocking advanced collaboration, workspace management, and enhanced pert chart features. You can compare all available plans and features on the Creately Pricing Page.
How can you create PERT charts faster?
Are there templates for different PERT chart use cases?
Can teams collaborate on PERT charts?
Can I add notes, data, and files?
Can I share, present, or export PERT charts?