Perceptual Map Maker
See Your Brand Through Your Customers’s Eyes with Perceptual Maps
Online perceptual map tool built for marketers, product managers and brand strategists to help understand consumer perceptions and competitor positions at a glance and develop innovative strategies to compete better. Invite colleagues for discussions and brainstorming sessions to bring in multiple perspectives and determine optimal strategies.
- Analyze competitors instantly with build-in marketing strategy templates
- Visualize market gaps and insights with an intuitive canvas
- Collaborate with your team or clients for faster alignment
Over 10 Million people and 1000s of teams already use Creately
Start Quickly with Free Ready-Made Perceptual Map Templates


Visualize and Brainstorm Your Market Positioning with Ease

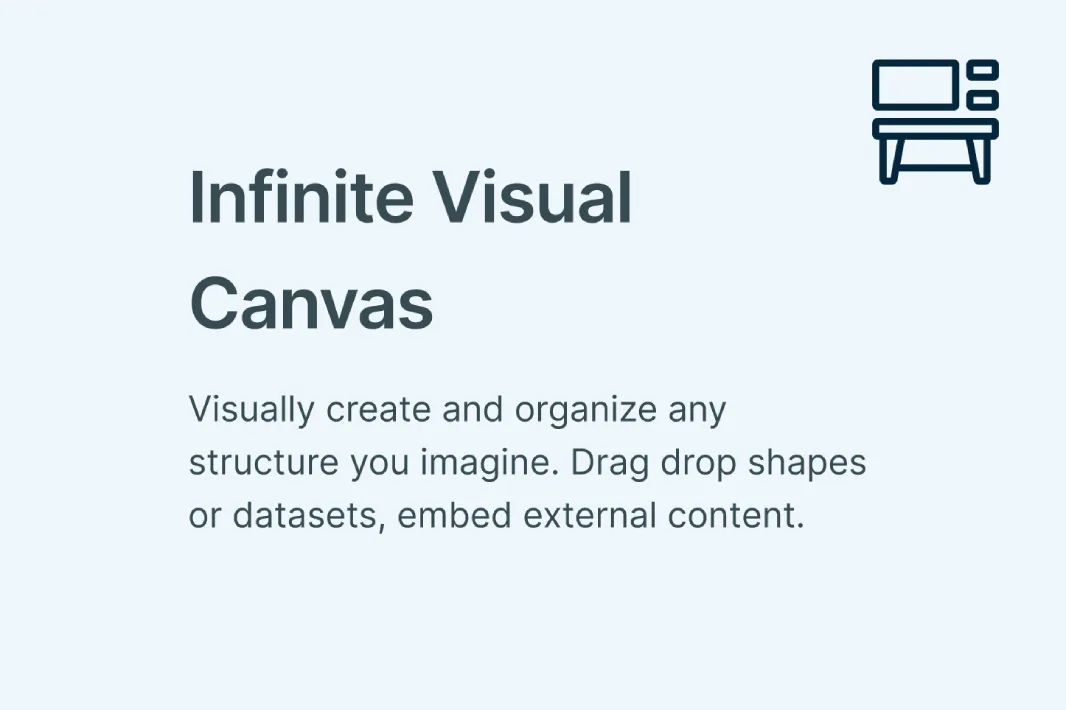
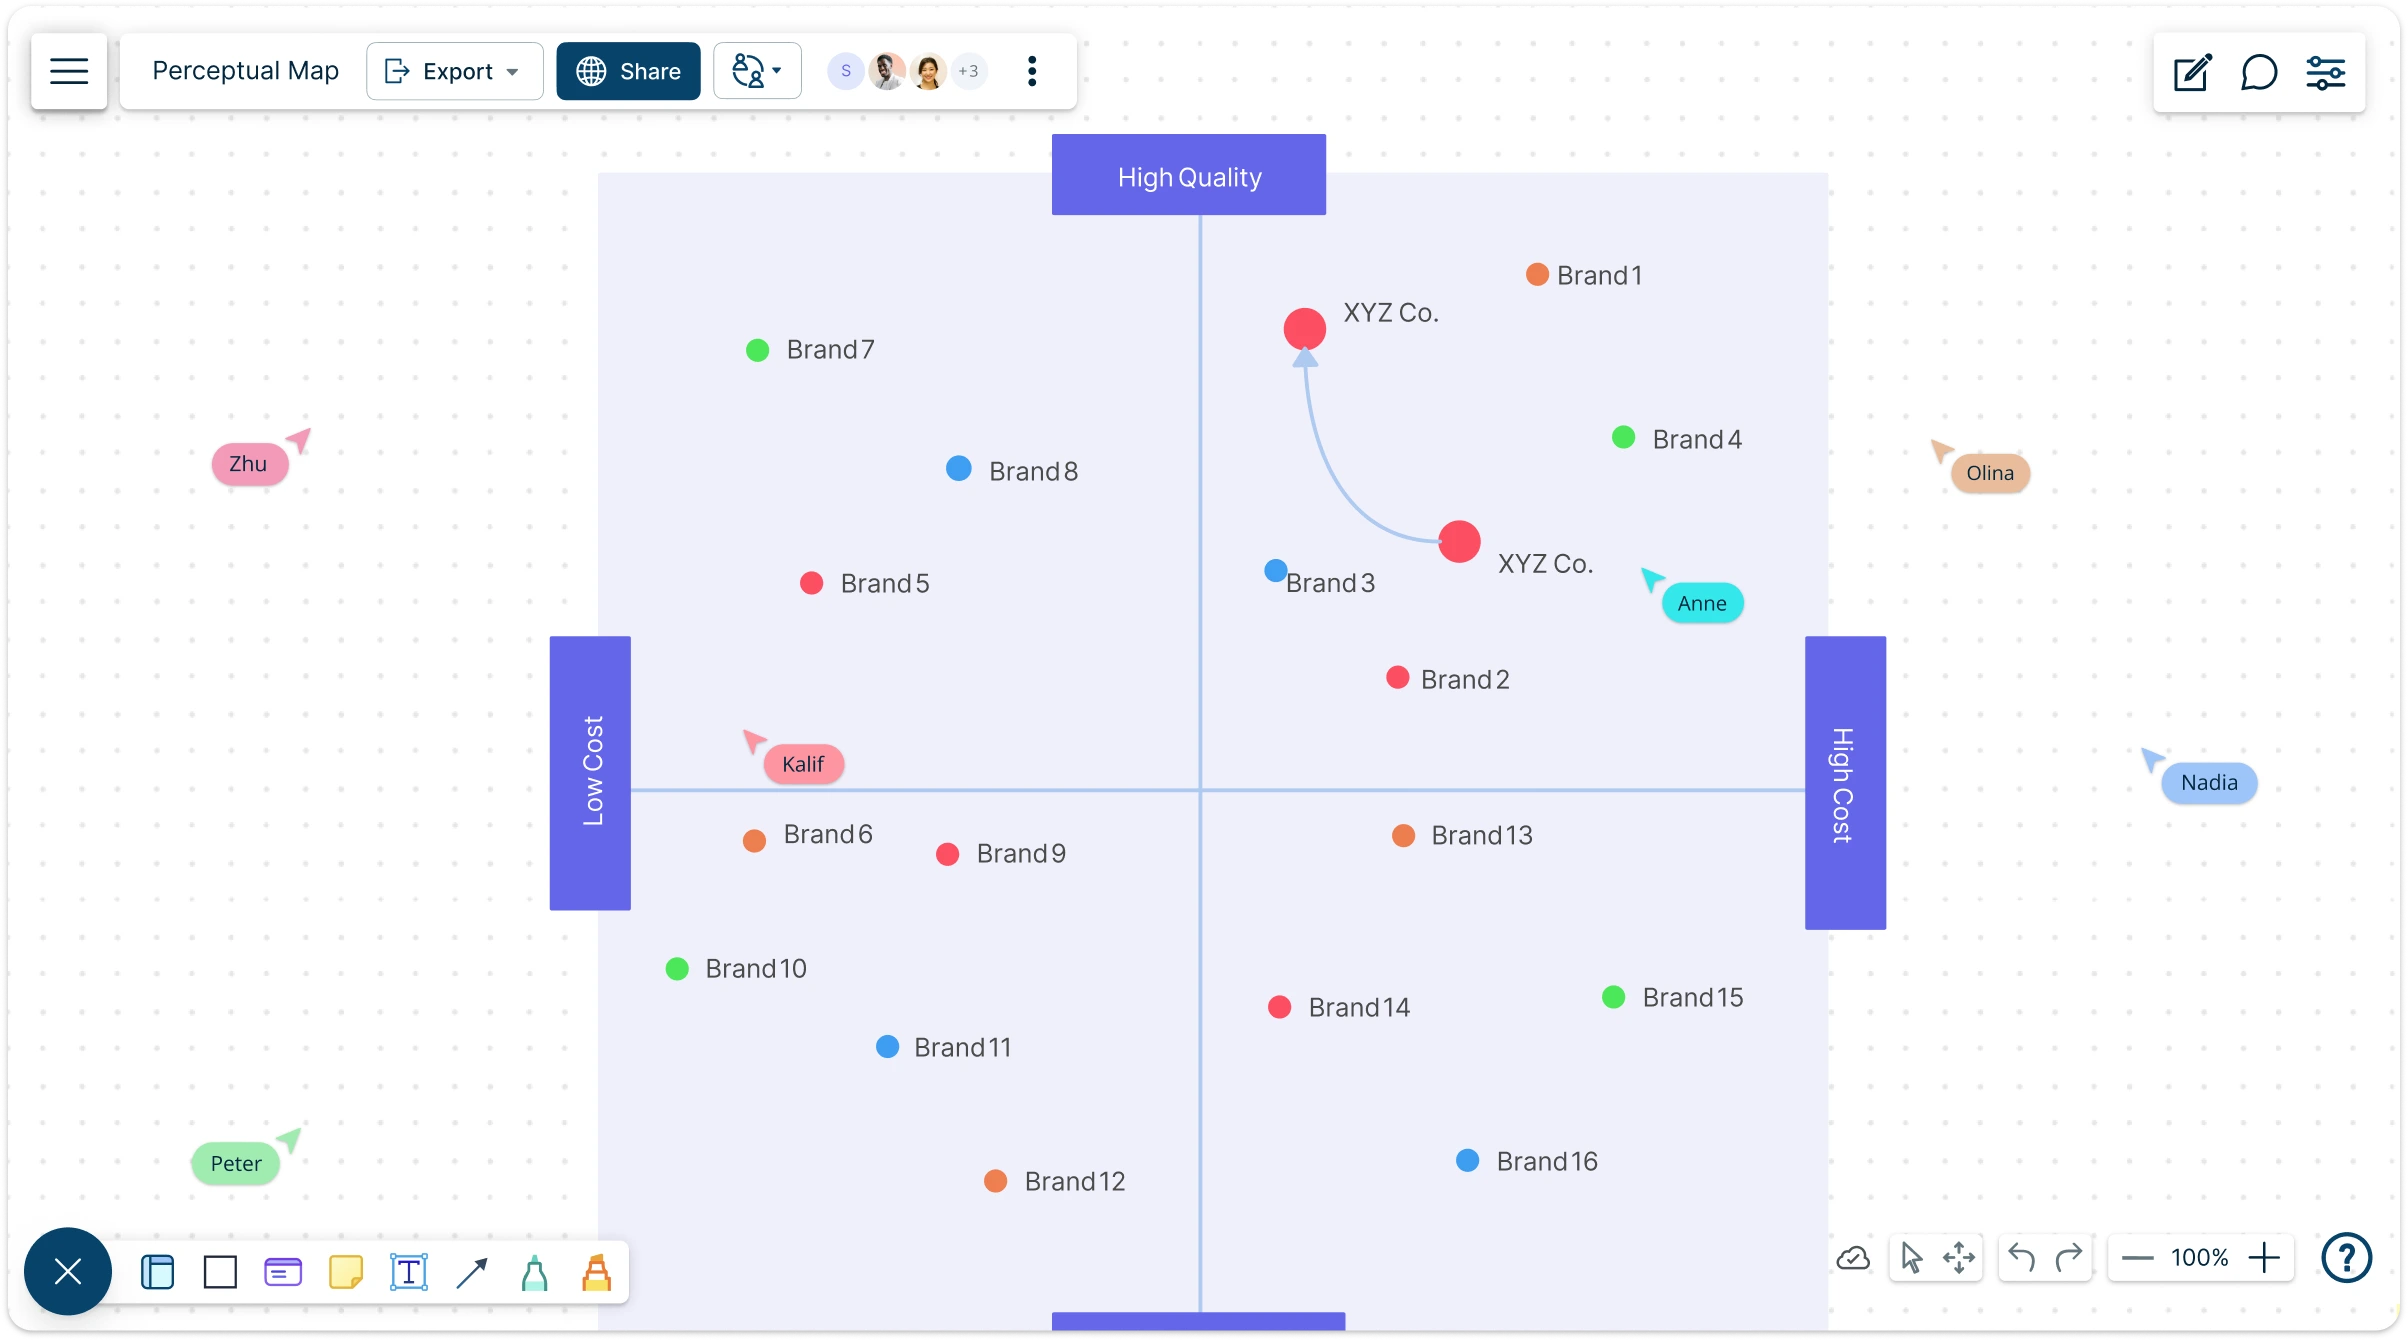
Bring your marketing insights to life with Creately’s Perceptual Map Maker, a flexible visual workspace for brainstorming, planning, and mapping brand strategies. Easily explore industry trends, competitor moves, and customer perceptions with an intuitive infinite canvas and easy diagramming tools. Start with ready-to-use perceptual map templates and proven frameworks for competitor analysis and brand positioning. Add mind maps, SWOT diagrams, and sticky notes to organize your ideas and uncover new opportunities. Customize colors and layouts in this brand positioning map to highlight product attributes and clearly visualize brand positions. Uncover opportunities and visualize your market strategy — all in one collaborative canvas.

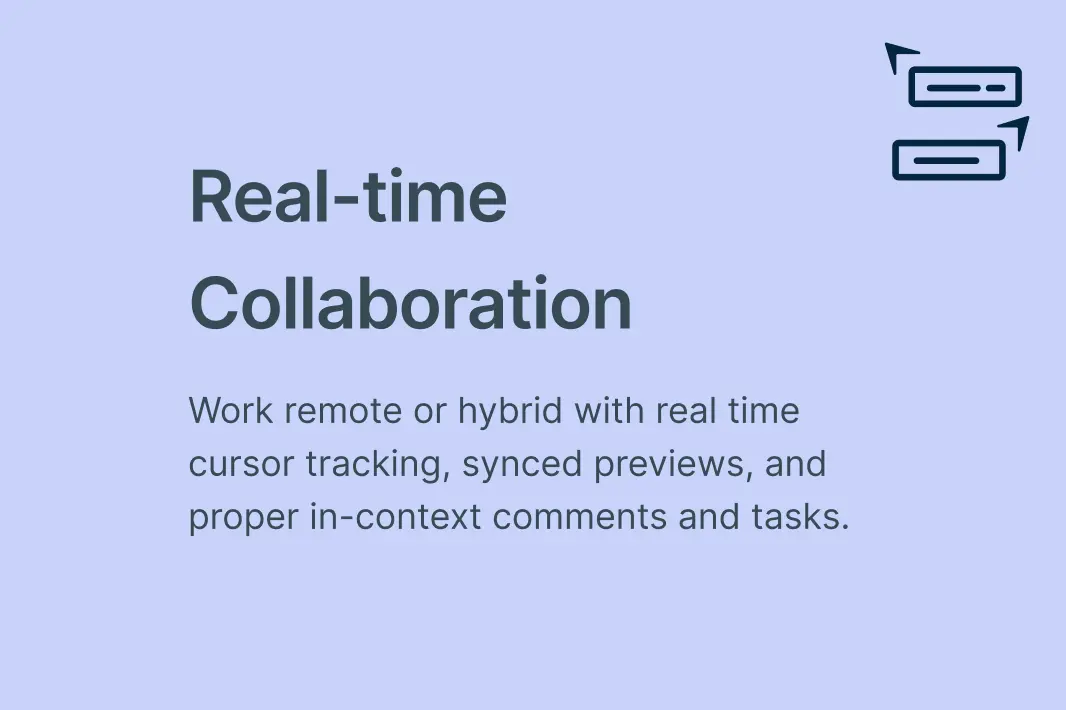
Collaborate with Teams, Anytime, Anywhere
Collaborate live with your team or clients on a shared canvas. Comment, review, and refine ideas together, from anywhere. Make feedback and discussions actionable using @mention comments and threaded conversations directly on the canvas. Control access with multiple roles and permissions, ensuring secure sharing, smooth editing, and efficient review of your market plans and perceptual maps. Keep every marketer, strategist, and stakeholder aligned from idea to execution.
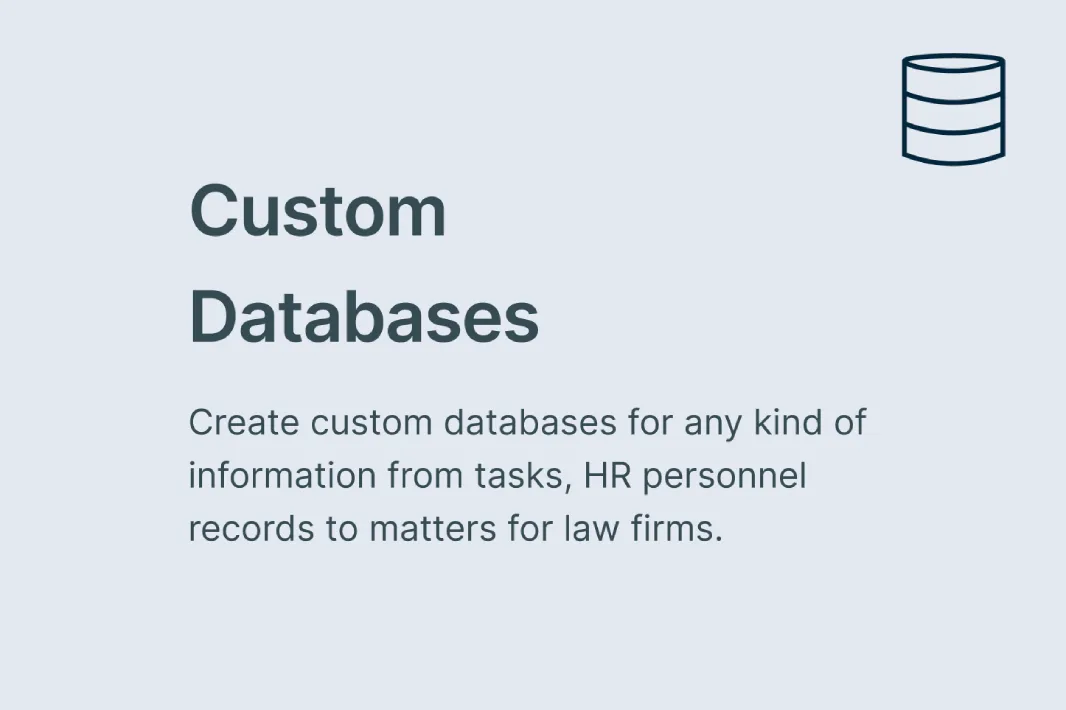
Organize Data to Discover Market Insights Faster

Turn data into insights, organize all your research, competitive data and survey results on one visual canvas. to see connections and patterns at a glance. Creately’s tools make it easy to create dynamic presentations, reports, and dashboards that clearly communicate insights to stakeholders. Enhance your perceptual maps by importing images, vectors, and documents with in-app previews, giving your analysis added context. Use the notes feature on each element to attach detailed information, links, and resources, capturing both granular details and the bigger picture in one organized workspace. With everything in one place, spotting trends and presenting findings becomes effortless.

Go From Ideation to Execution with Dynamic Visual Tools
Move seamlessly from brainstorming to execution with Creately’s built-in tools for organizing ideas and creating interactive presentations for stakeholders. Use prioritization grids to rank initiatives for maximum impact and Kanban boards to track progress across teams. Integrate perceptual map builder effortlessly with other apps to import and export data across platforms, keeping everyone aligned. Generate multiple perspectives of your plans using model objects, and transform them into Kanban boards, roadmaps, workflows, and more to bring your strategies to life. From mapping perception to driving market success, everything happens in one connected workspace.
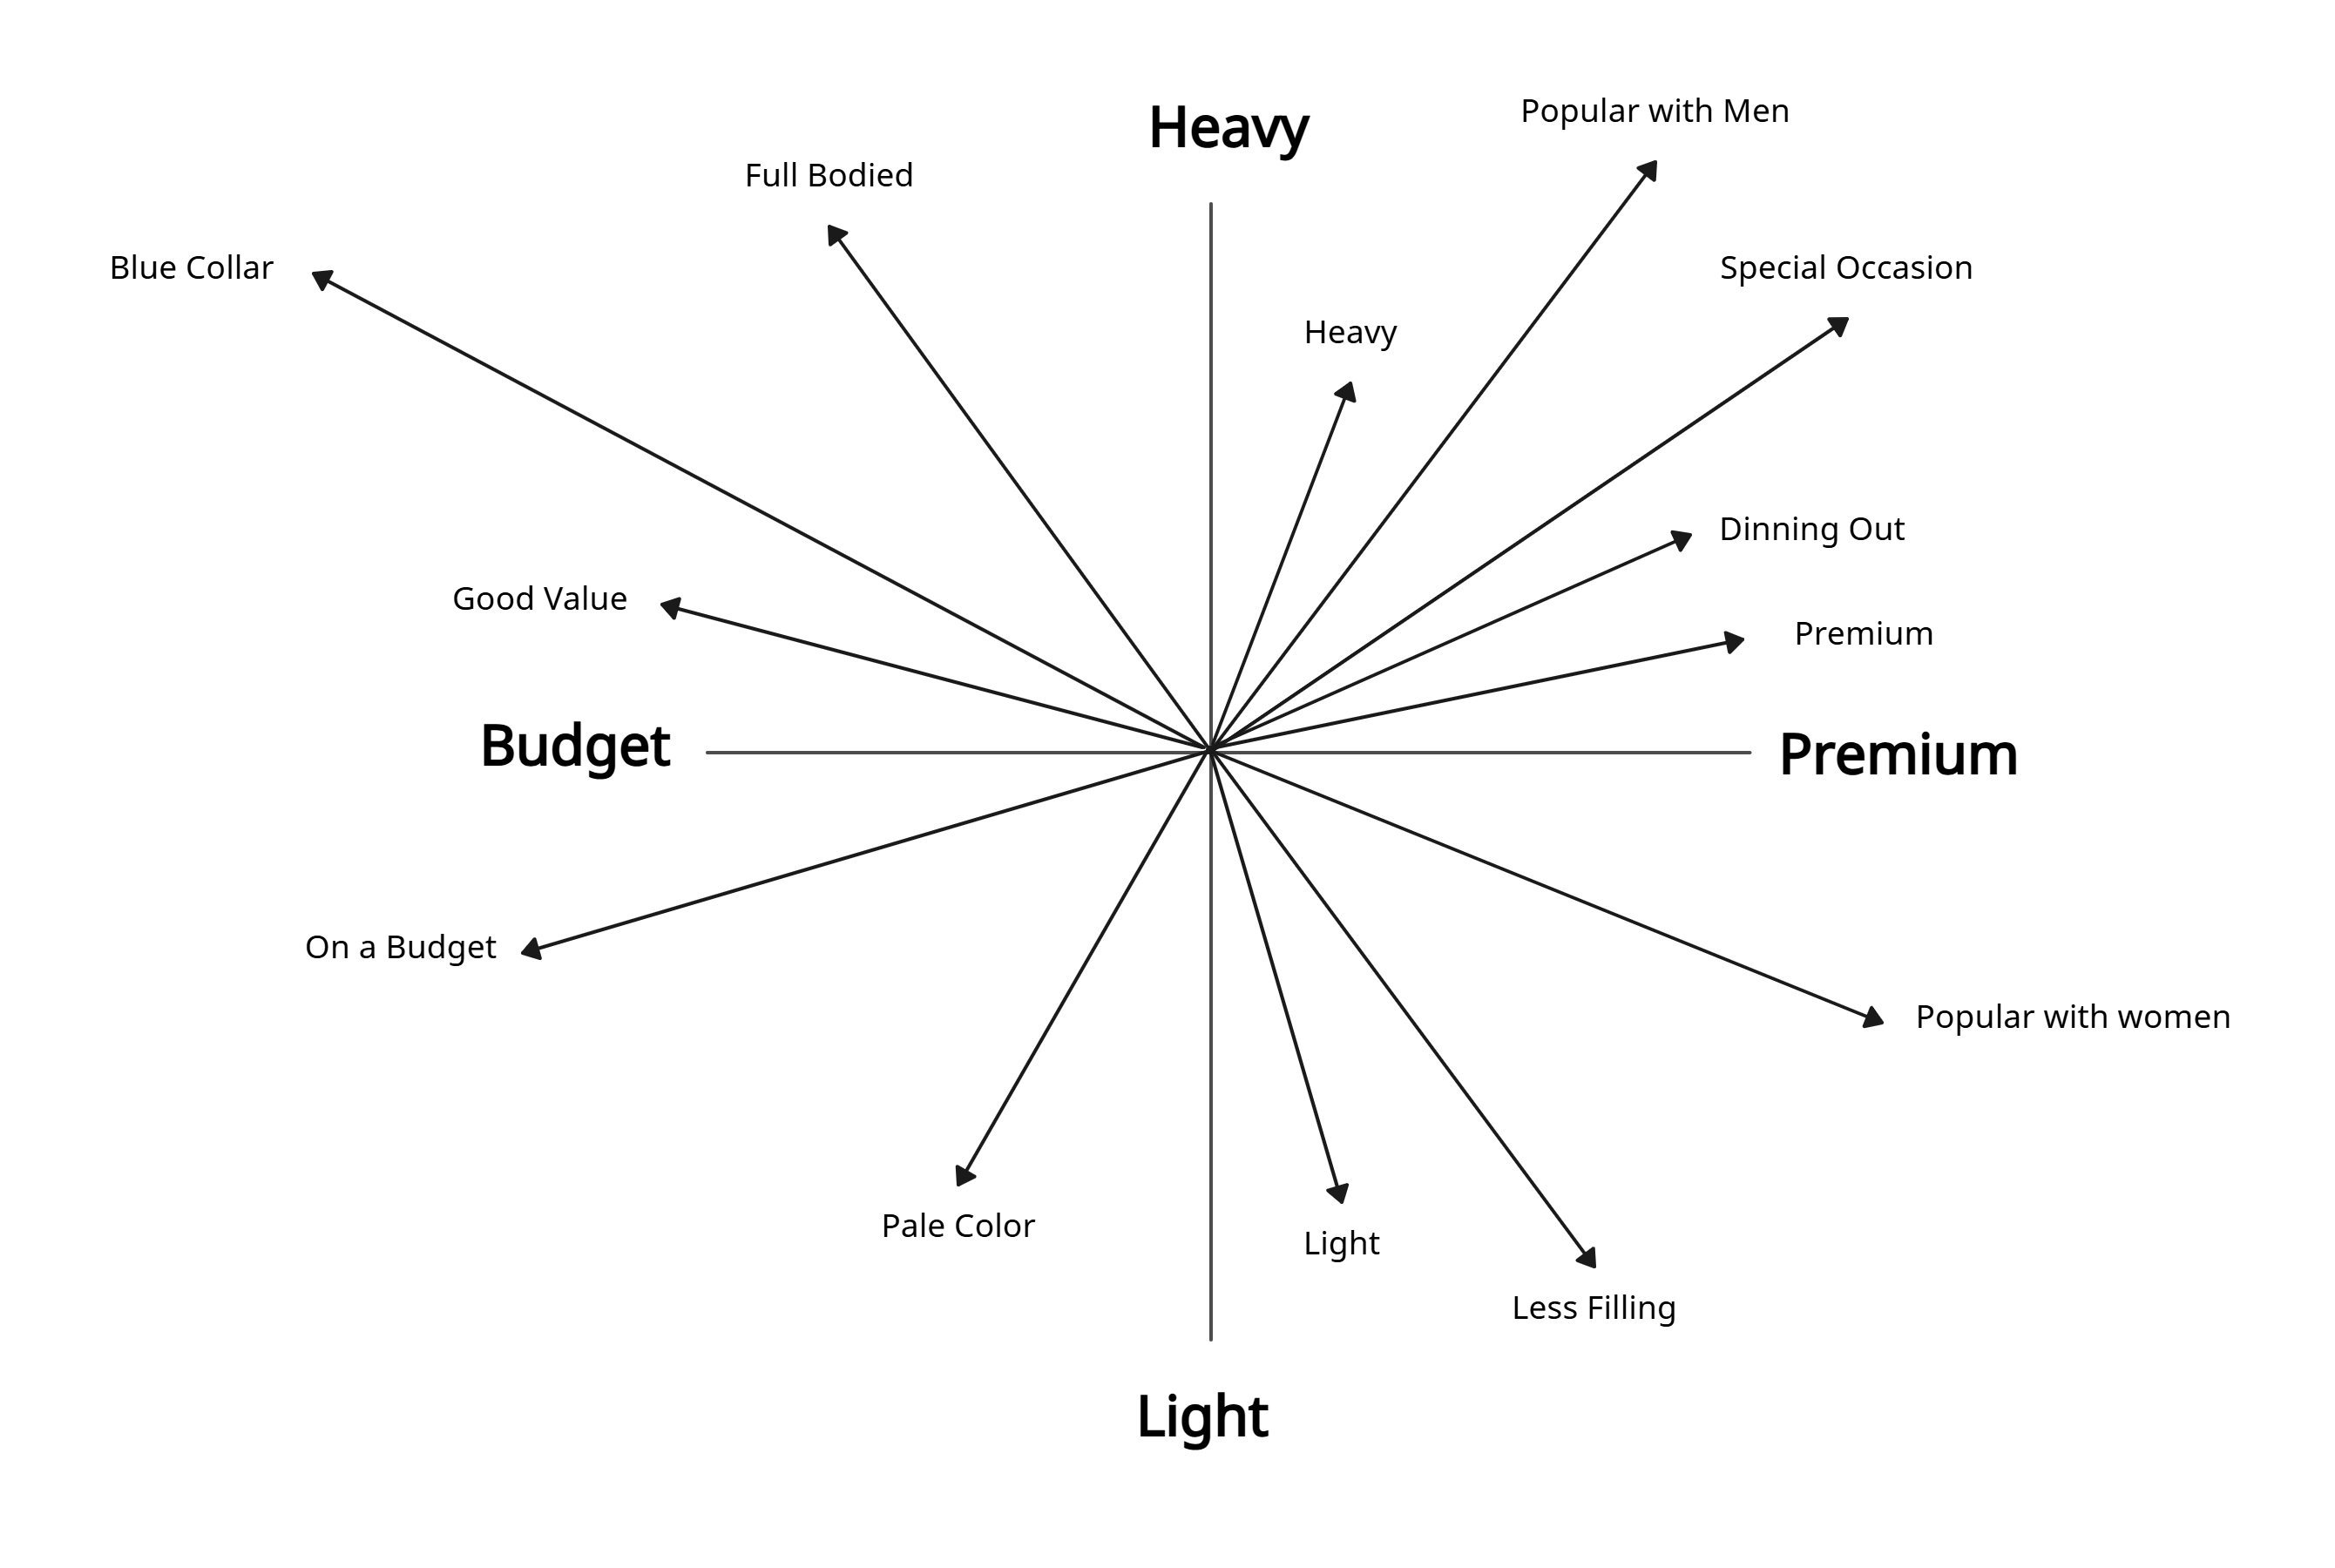
What Is a Perceptual Map?

How to Create a Perceptual Map with Creately
Launch Creately:
Sign in to your account and open a new workspace to start your perceptual mapping project.
Choose a Template:
Select a ready-made perceptual map template or start from scratch on the infinite canvas to match your analysis needs.
Add Data and Visual Elements:
Use sticky notes, shapes, and the notes panel to input customer insights, competitor positions, and key attributes. Customize colors, icons, and labels for clear differentiation.
Collaborate and Refine:
Invite teammates to collaborate in real-time. Use @mentions, comments, and threaded discussions to review and refine your perceptual map together.
Review, Share, and Export:
Finalize your map and share it securely with stakeholders. Export as PDF, PNG, SVG, or embed it on websites and presentations for seamless access.
FAQs About the Perceptual Map Maker
What are Creately’s free perceptual map maker pricing plans?
- Free Plan — $0/month for basic perceptual map creation and collaboration
- Starter & Team Plans — $8/month or $5/month billed annually
- Business Plan — $149/month or $89/month billed annually
Annual billing helps you save more while unlocking advanced collaboration, workspace management, and enhanced perceptual map features. You can compare all available plans and features on the Creately Pricing Page.
How can you create perceptual maps faster?
Are there templates for different perceptual map use cases?
Can teams collaborate on perceptual maps?
Can I add notes, data, and files?
Can I share, present, or export perceptual maps?