Buyer Utility Map Template
Uncover Hidden Innovation Opportunities in Your Industry
Uncover strategic opportunities to create outstanding value for your customers.
- Professional templates and frameworks for analyzing customer/market needs
- Real-time collaboration to seamlessly discuss, edit, and sync with co-workers
- Infinite canvas to bring together your market research, analysis, brainstorm ideas, develop strategies and plans

Map New Strategic Innovation Opportunities
Simple to use drag-drop tools to easily compare your and your competitor offerings on the buyer utility canvas.
Notes to add detailed docs, attachments, links and more to capture industry/market /product details and the big picture in a single space.
Built-in visual brainstorming tools such as mind maps and post-it note walls to quickly capture ideas during analysis and brainstorm ideas during problem solving.
Connect All Teams Across the Board

In-app video and audio calls to work with your remote teammates like you are in the same room.
Multiple access and role levels to streamline sharing, reviewing, and editing your workspaces.
Real-time cursors for any number of participants. Collaborate with team members on a shared canvas and understand buyer journeys together.
Comment with context, have discussions and follow-ups on the same canvas. Async!

Discover Important Insights Faster
Import other documents and images onto your workspace to compile a data-rich buyer utility maps in one space.
Built-in tools to create dynamic and interactive presentations, reports, and dashboards for stakeholders.
Full-version history to keep track of all the changes and revisions to your strategies and plans and revert back whenever necessary.
Run Better Business Innovation Projects

Use multi-perspectives of the same data models to analyze different scenarios and arrive at quantifiable conclusions.
Prioritization grids to visually rank ideas for optimal effort and impact and Kanban boards to track work progress across teams.
Track your progress of project implementation and perform updates on the spot within Creately.
Frames for Kanban boards, timelines, grids, and more to visually arrange your data and create a view for your own working style on the canvas.
What Is a Buyer Utility Map?
Developed by W. Chan Kim and Renée Mauborgne, the buyer utility map is a tool from the Blue Ocean Strategy. It’s used to help companies identify innovation opportunities that will create new and better utility propositions to the customers, by improving the current offering or identifying an under-served industry opportunity to offer a new product. It also helps to make sure the new product actually delivers the value (utility proposition) it’s been created for, to the customer.
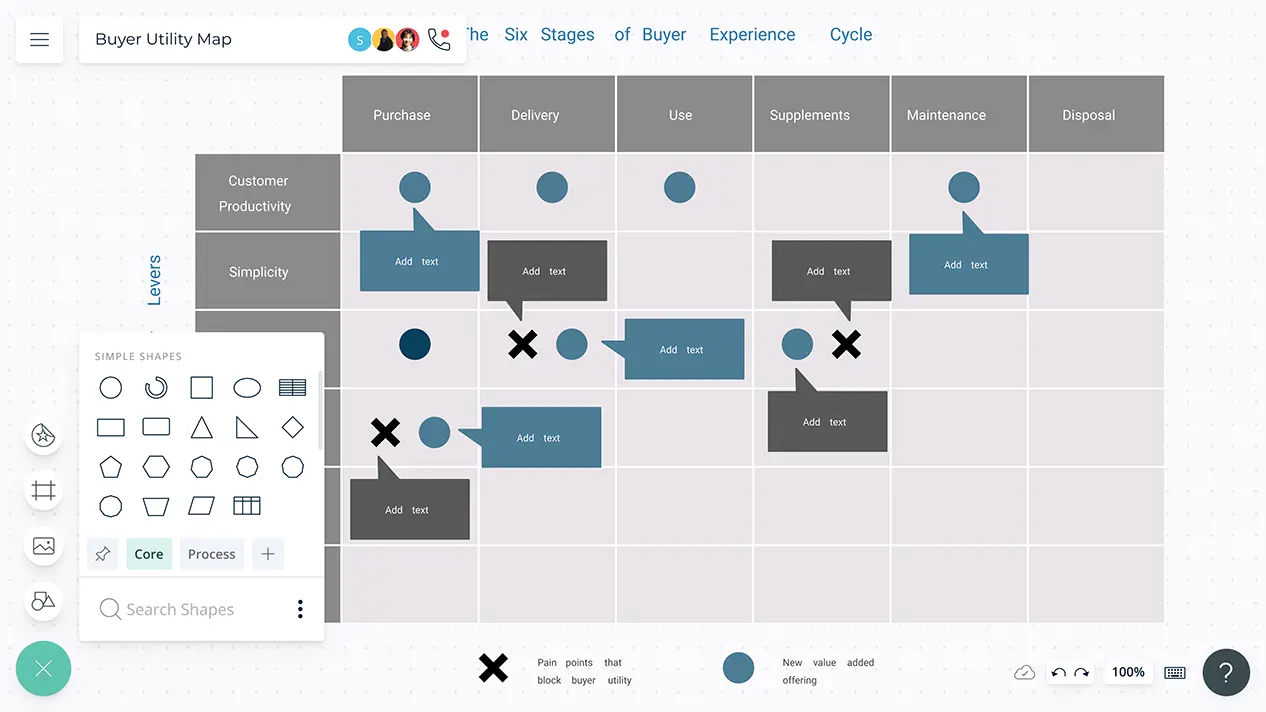
The buyer utility map is a 6 by 6 matrix which consists of two dimensions; the buyer experience cycle and the utility levers which can be used to develop your marketing messaging and strategy. By carefully examining the intersection of these categories, you can identify the pain points of the industry or the areas the industry is prioritizing and disregarding and take advantage of them to deliver better utility to buyers.
How to Create a Buyer Utility Map?
- The buyer utility map is composed of two axes; along the horizontal axis is the buyer experience cycle and along the vertical axis are the utility levers.
- The buyer experience cycle can be broken down into six distinct stages. Consider how to improve or change each stage of the cycle.
1. Purchase: How easy is it to purchase the product, in terms of security, location, and speed?
2. Delivery: How easy is it to get the product delivered or installed?
3. Use: How easy is it to use the product? (i.e. training requirements, storage requirements, etc.)
4. Supplements: What other things (other products or services) are required to use the product?
5. Maintenance: How easy or difficult is it to maintain the product?
6. Disposal: How easy is it to dispose of the product? - The utility levers can be used to develop your strategy and messaging and hence offer buyers greater utility. They include:
1. Productivity: refers to anything related to increasing the efficiency in meeting the buyer’s needs. (i.e. less time, money, etc)
2. Simplicity: anything that makes it easier for the buyer by eliminating or minimizing hassles or complexities.
3. Convenience: this lever focuses on the buyer’s convenience by saving them from frustrations and wasting their time.
4. Risk Reduction: includes ways to reduce risks associated with the purchase or the use of the product. These risks include financial, physical, and reputational risks.
5. Fun and image: refers to things like the look, attitude and the feel conveyed by the product.
6. Environmental friendliness: refers to how green your product or service is. - When combined, the buyer experience cycle and the utility levers produce 36 potential utility spaces. By looking at these utility spaces based on your industry, you can try to identify customer pain-points and how to make opportunities out of them.
- And you can utilize it for locating new products, improving or repositioning existing ones, and for market research by sharing the workspace or exporting as a SVG, PNG, JPEG, or a PDF file.