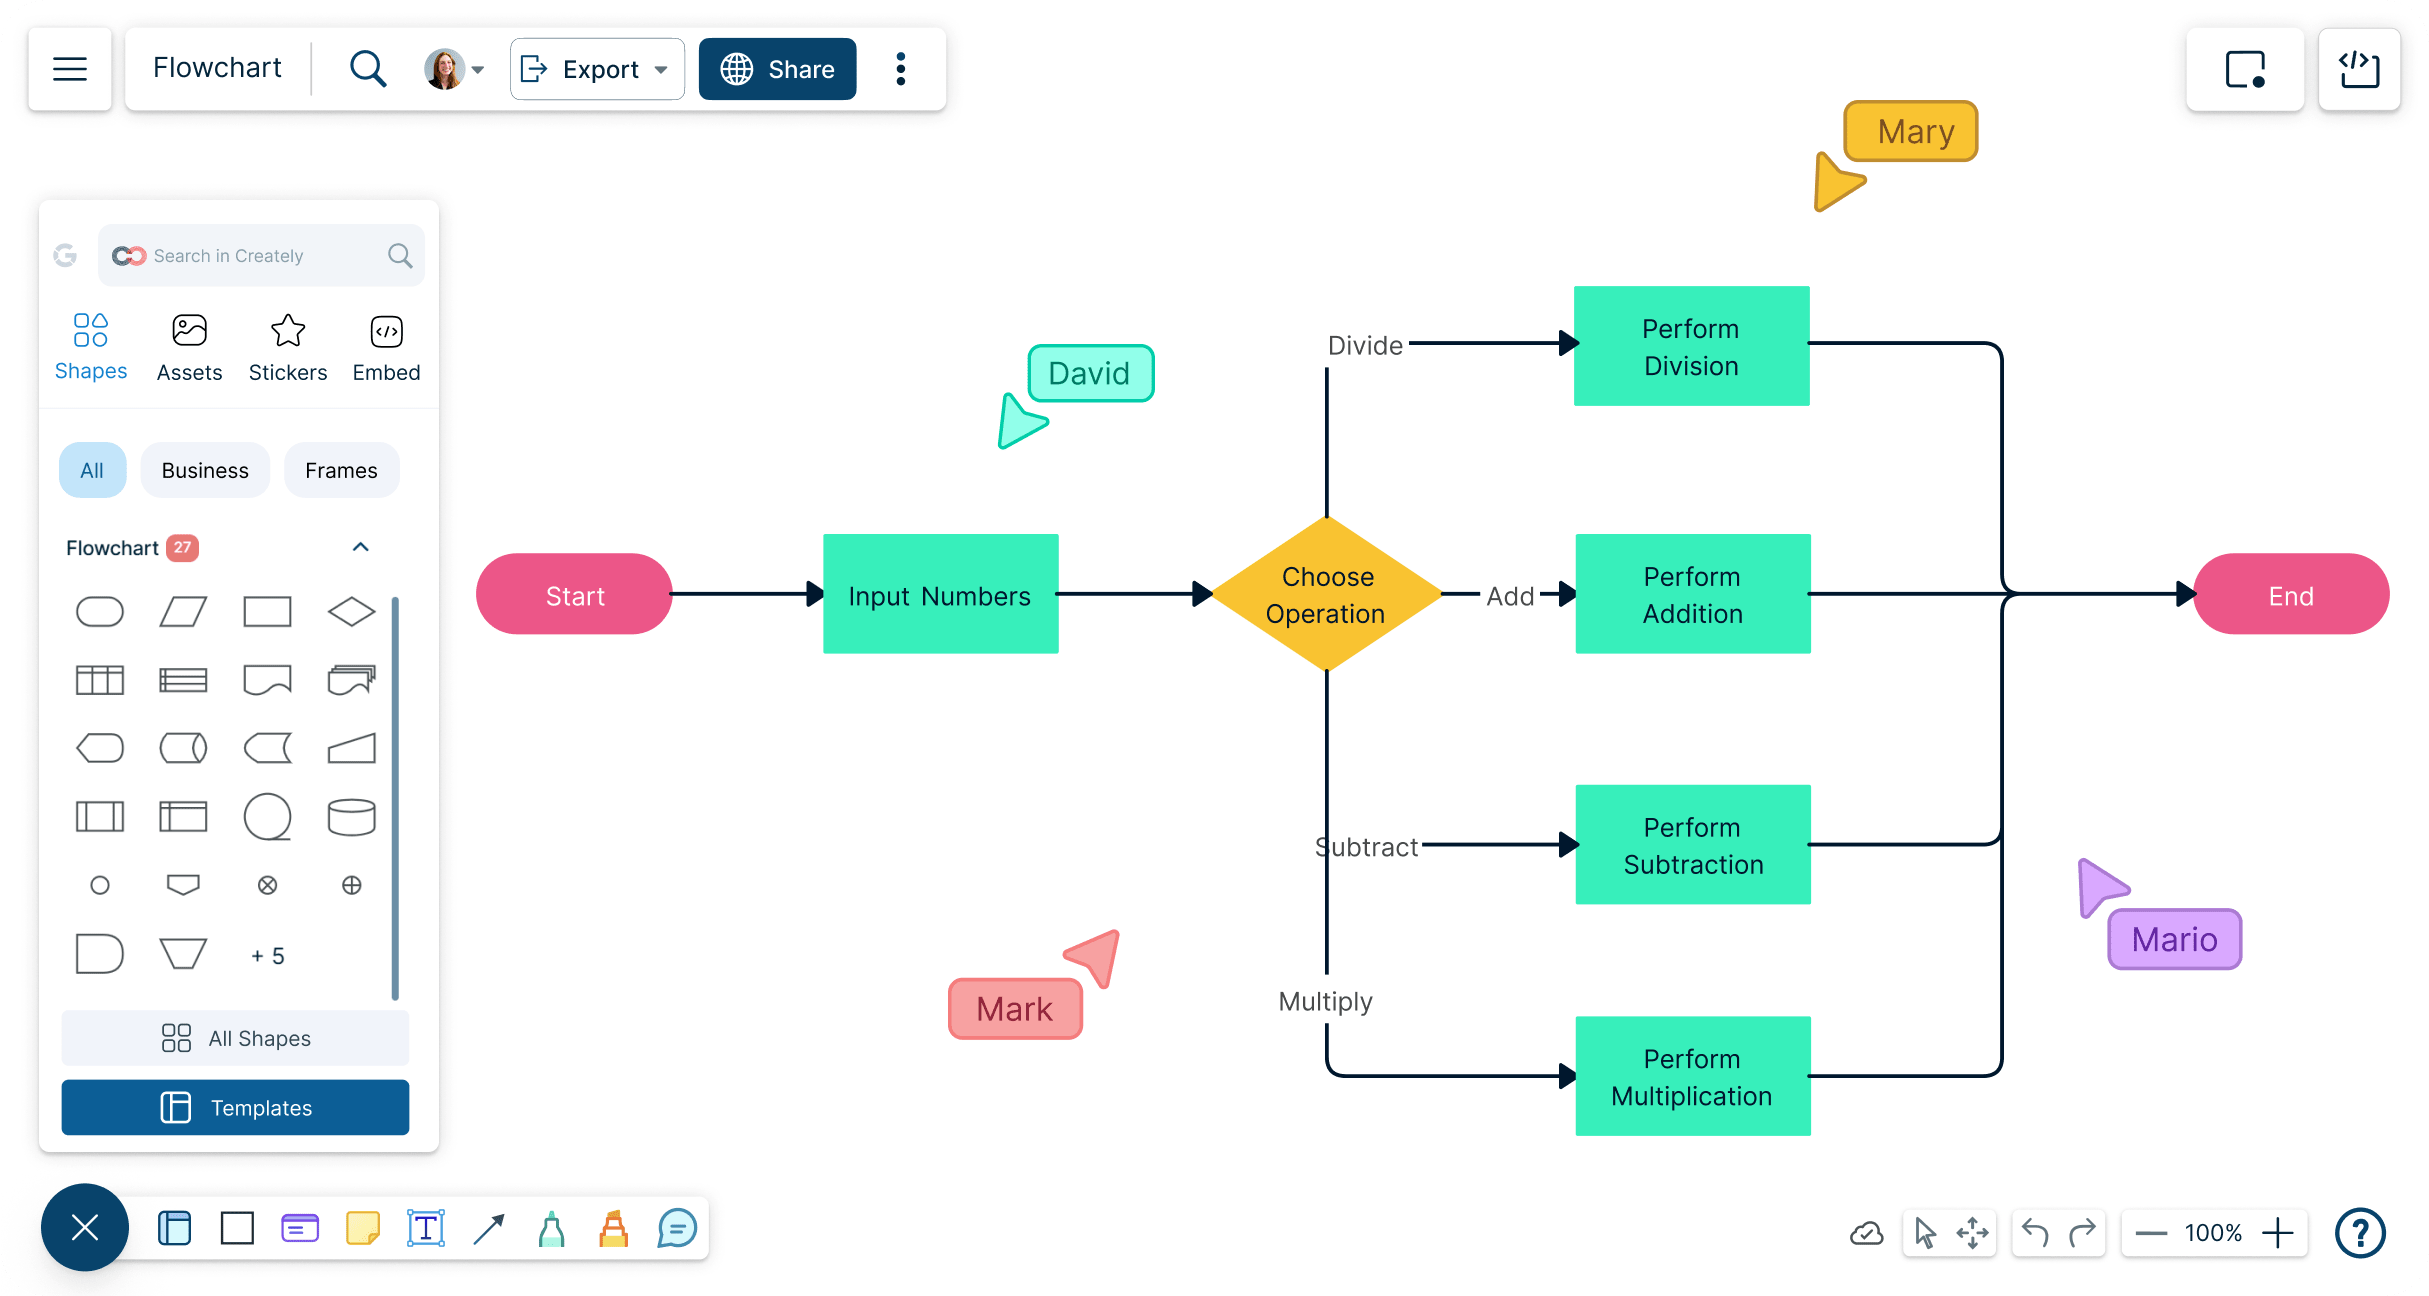
Easily visualize your processes and workflows with smart automation.
Create visual organizational structures with images and detailed profiles.
Visualize concepts and their relationships on an infinite visual canvas.
Map family history and understand the relationships with detailed genograms.
Visualize relationships between entities using Crows Foot or Chen notation.
Visualize your network infrastructure. Support AWS, CISCO, Azure and more.
Visualize and expand your ideas using our powerful mind mapping tool.
Easily create family trees with our professionally designed templates.
Infinite canvas to add diagrams, images, sticky notes and more.
Run collaborative meetings, workshops or brainstorming sessions.
Collaborative diagramming for educators and students at discounted rates.
Generate customizable diagrams with a simple prompting tool.
Log In
Sign Up Free
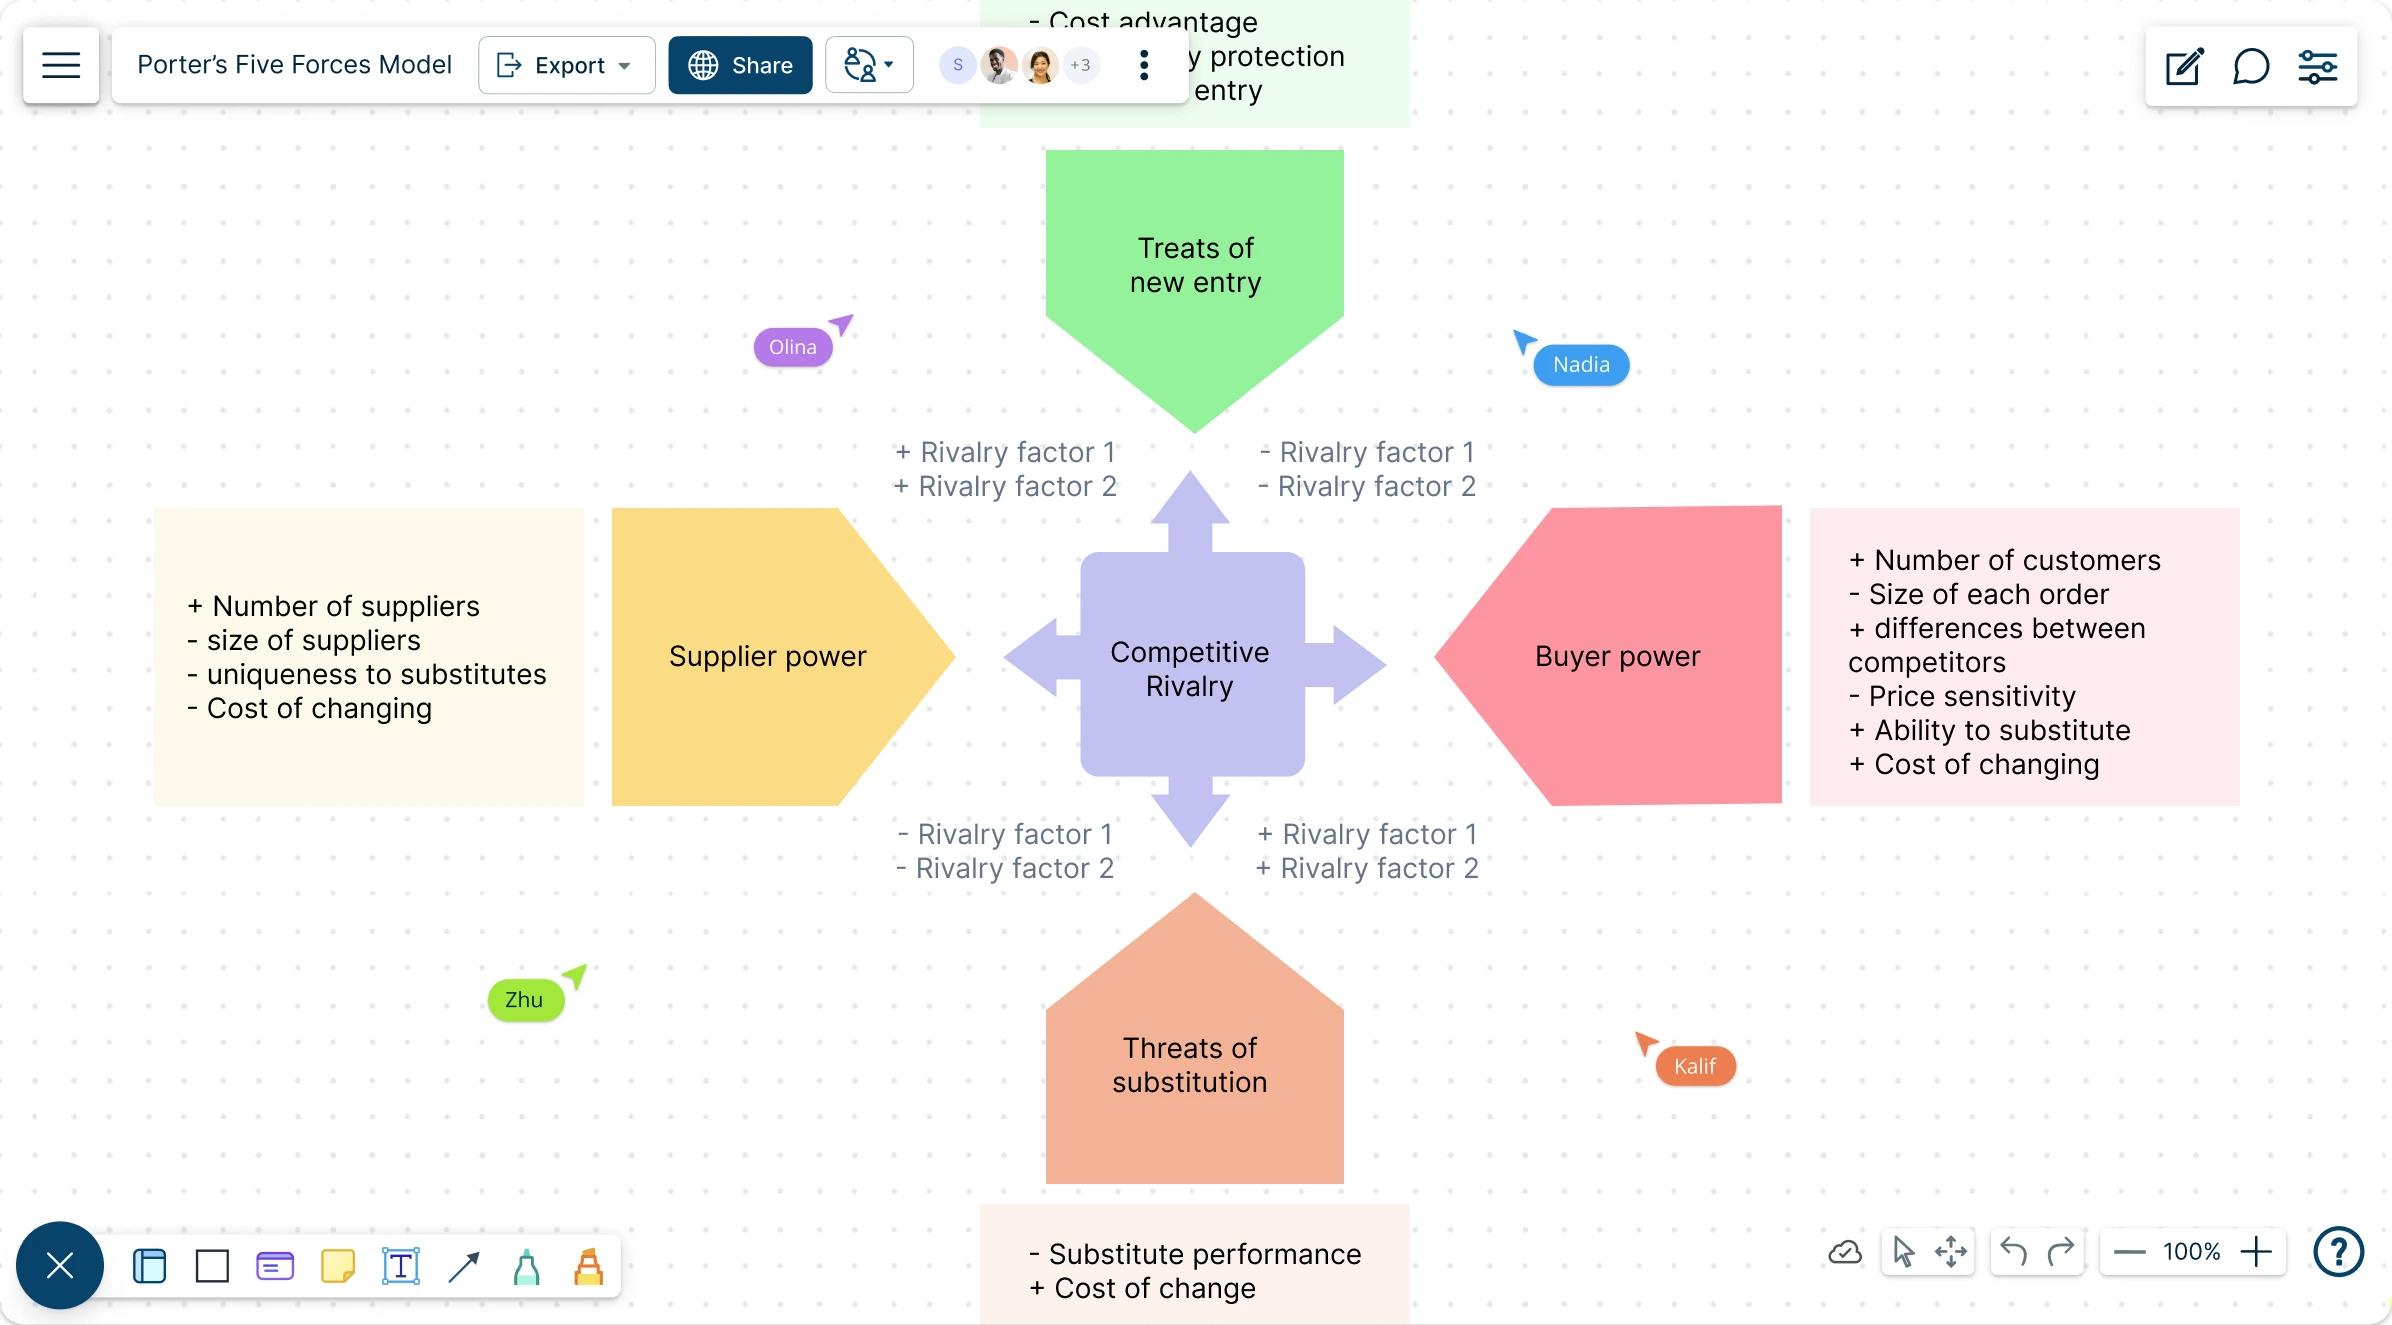
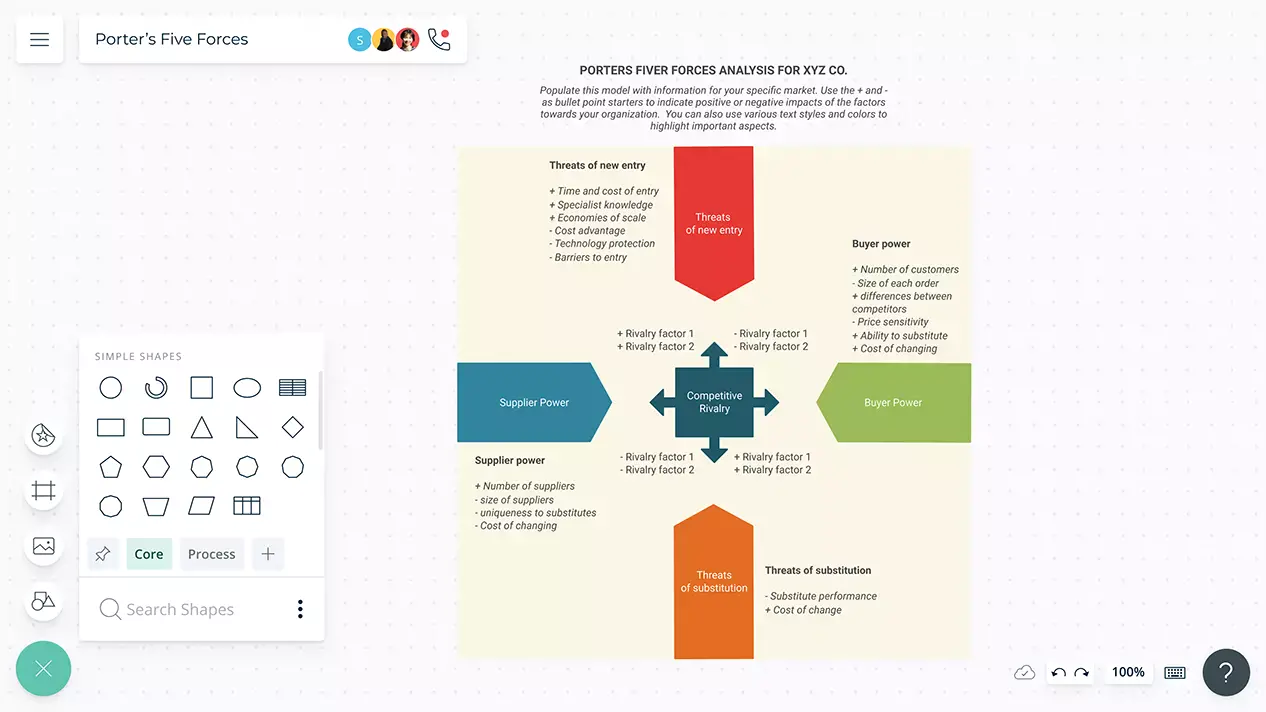
A single, connected workspace with built-in visual tools to get a deeper understanding of competitive forces and formulate strategies to rival them.
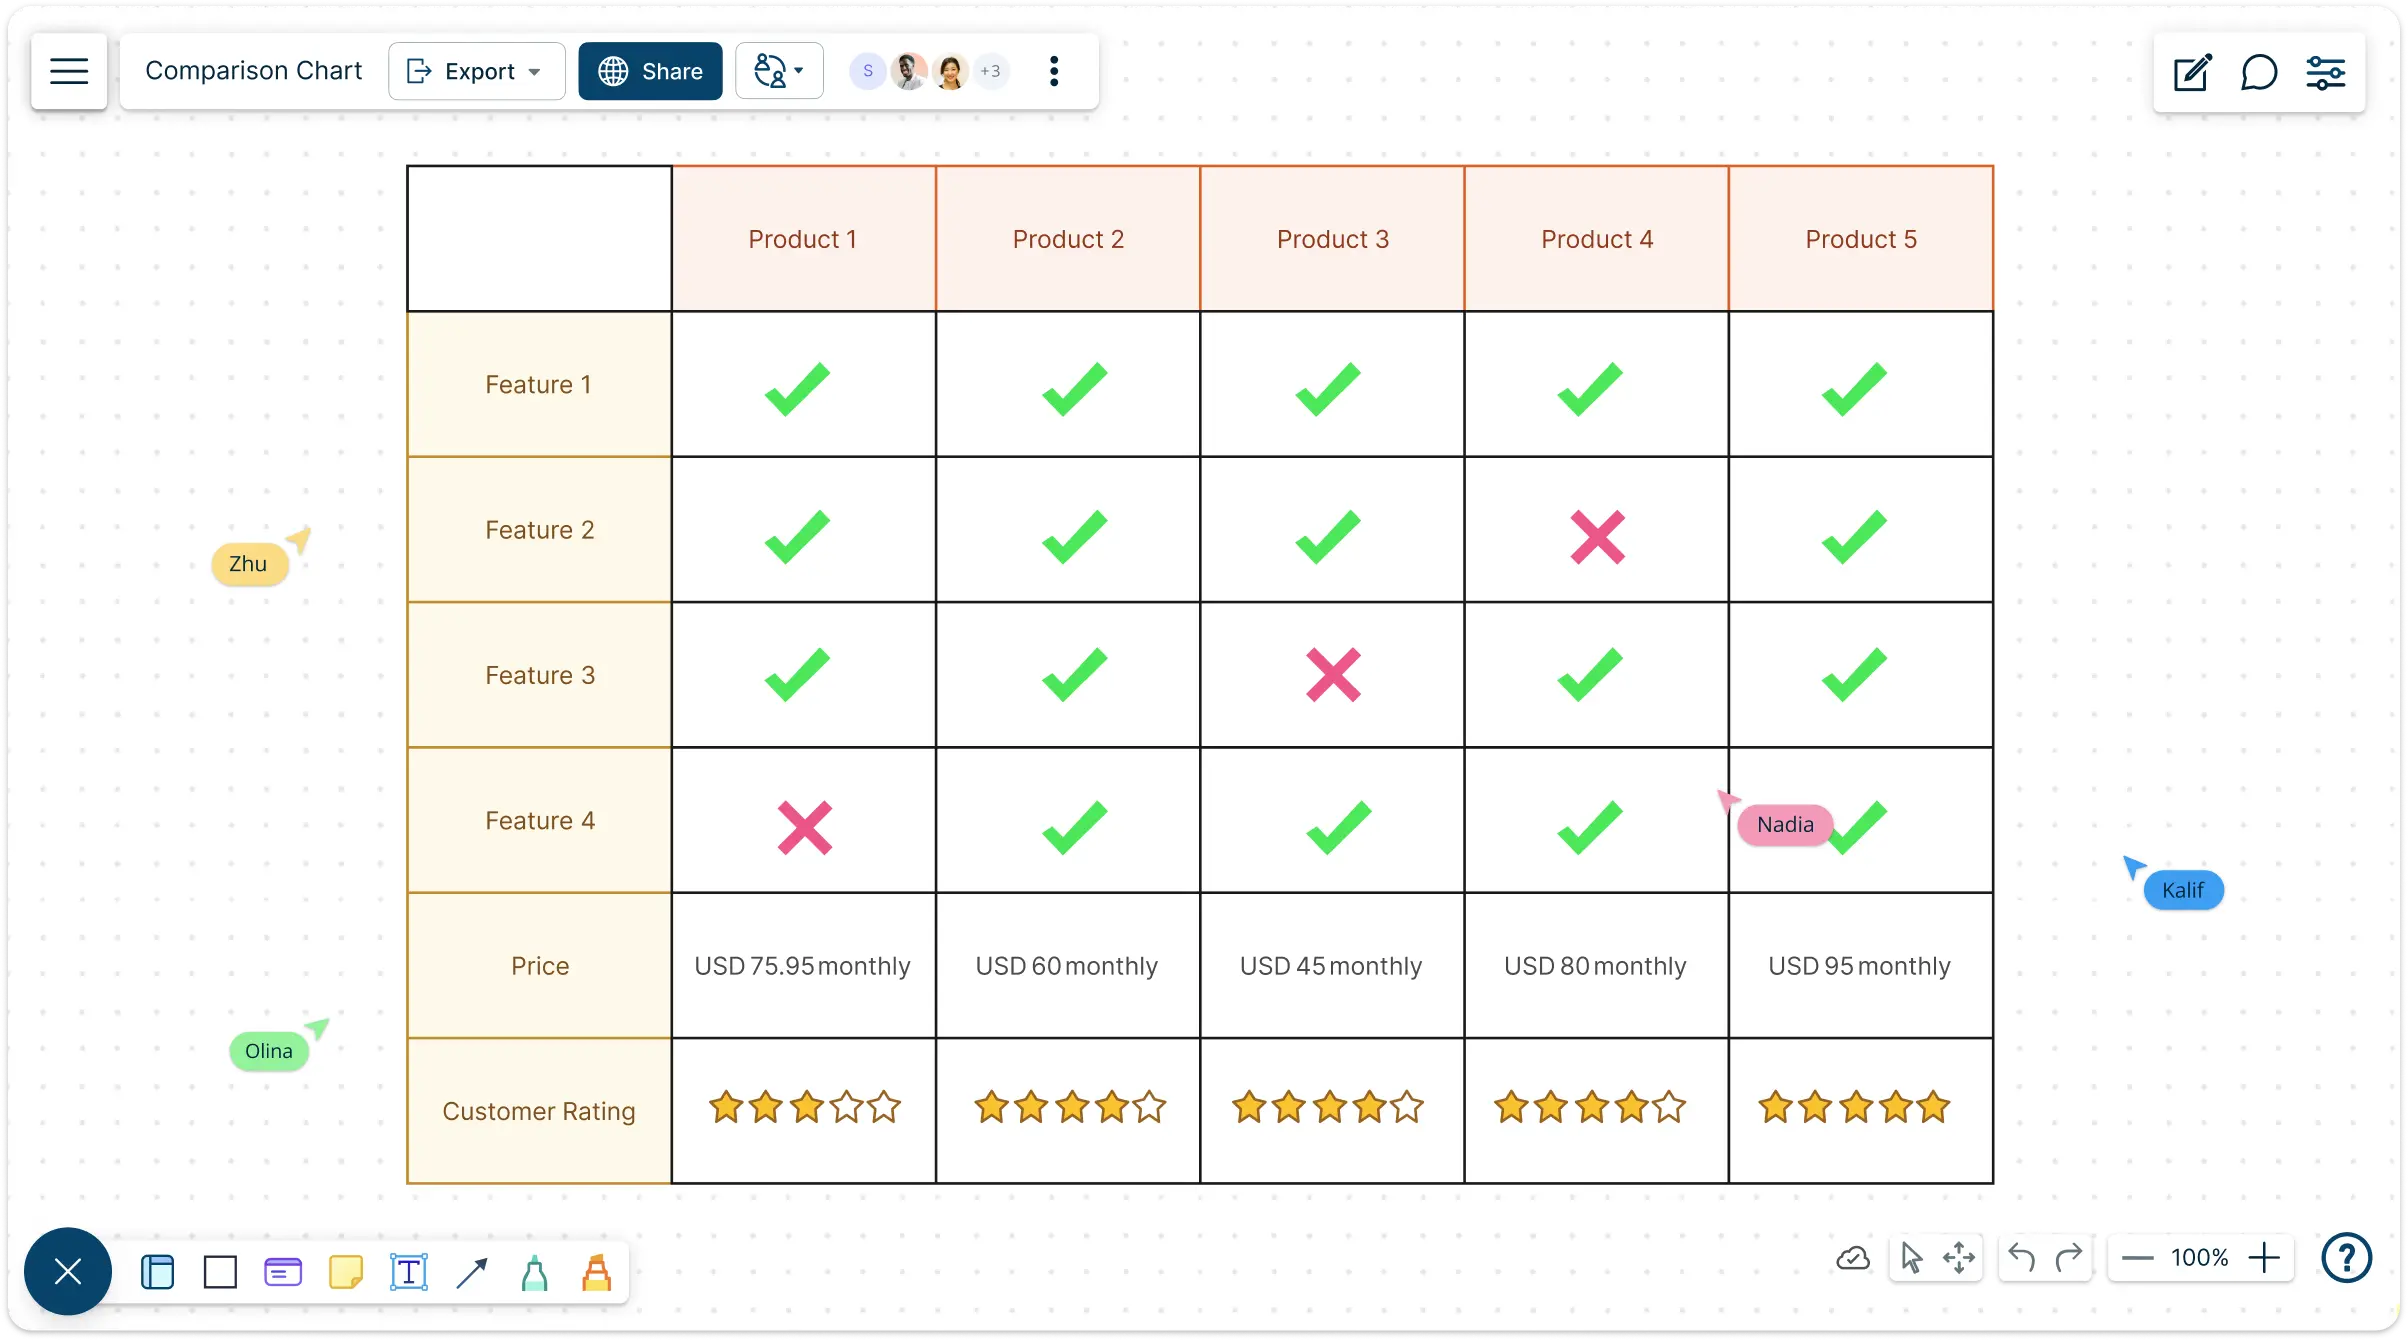
Create professional, data-driven comparisons with Creately’s intuitive online comparison chart maker to analyze, organize, and align your team in real-time.
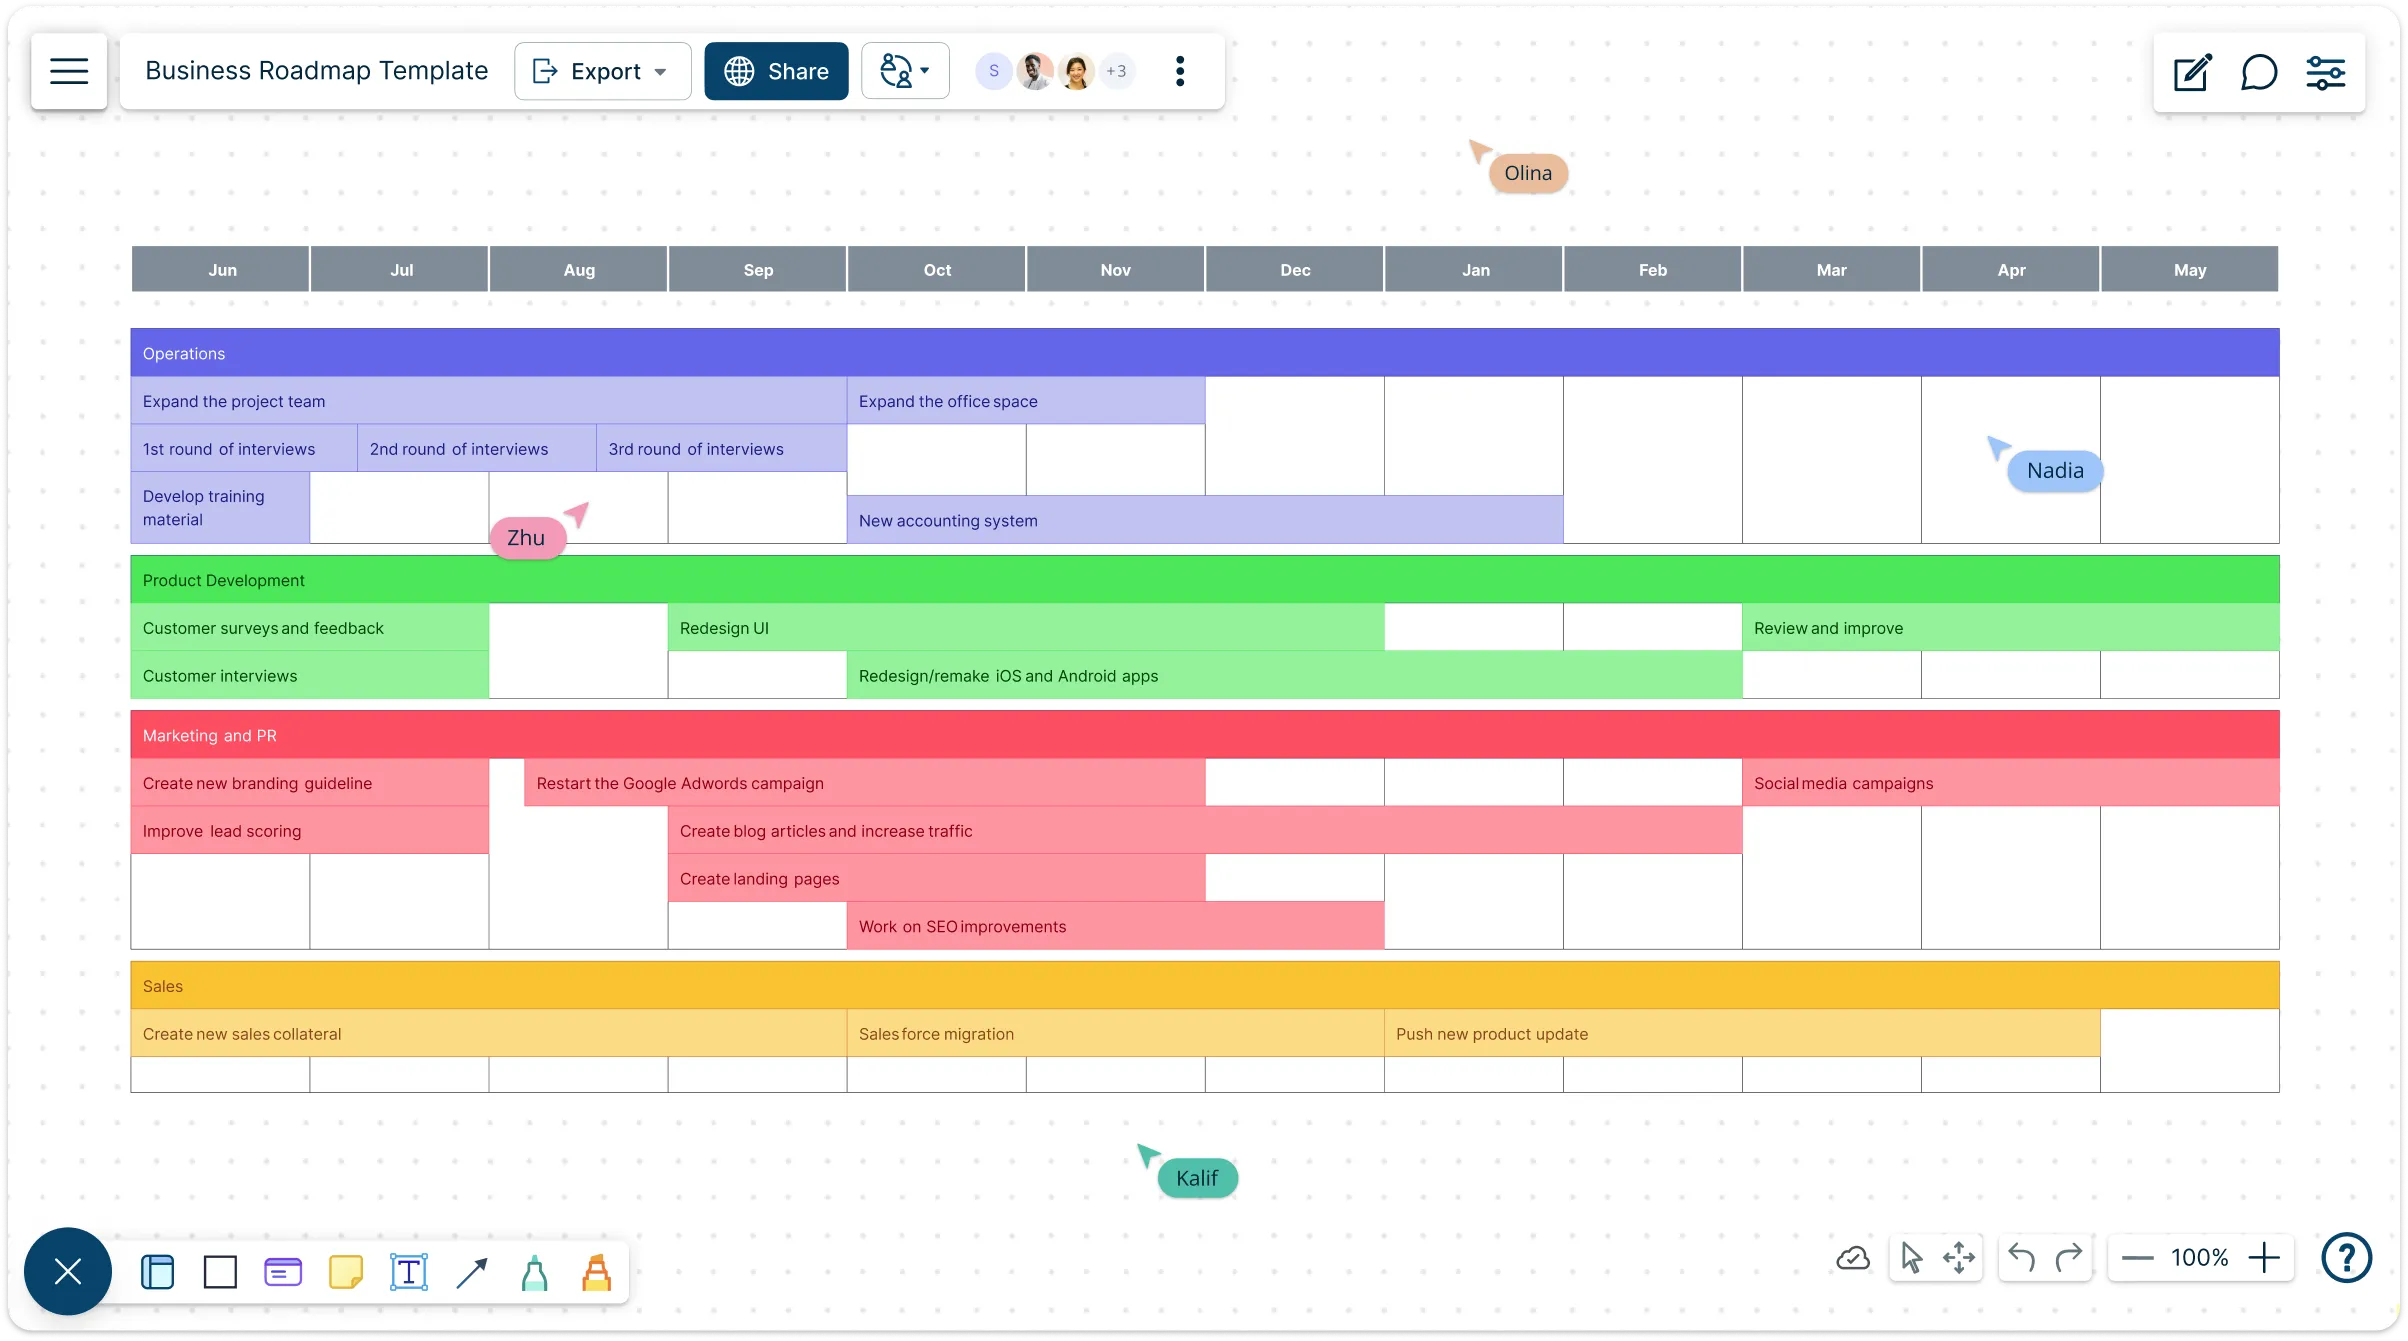
Use Creately's visual business roadmap creator to define goals, map strategic initiatives, and turn plans into clear, actionable steps teams can align on and execute together.
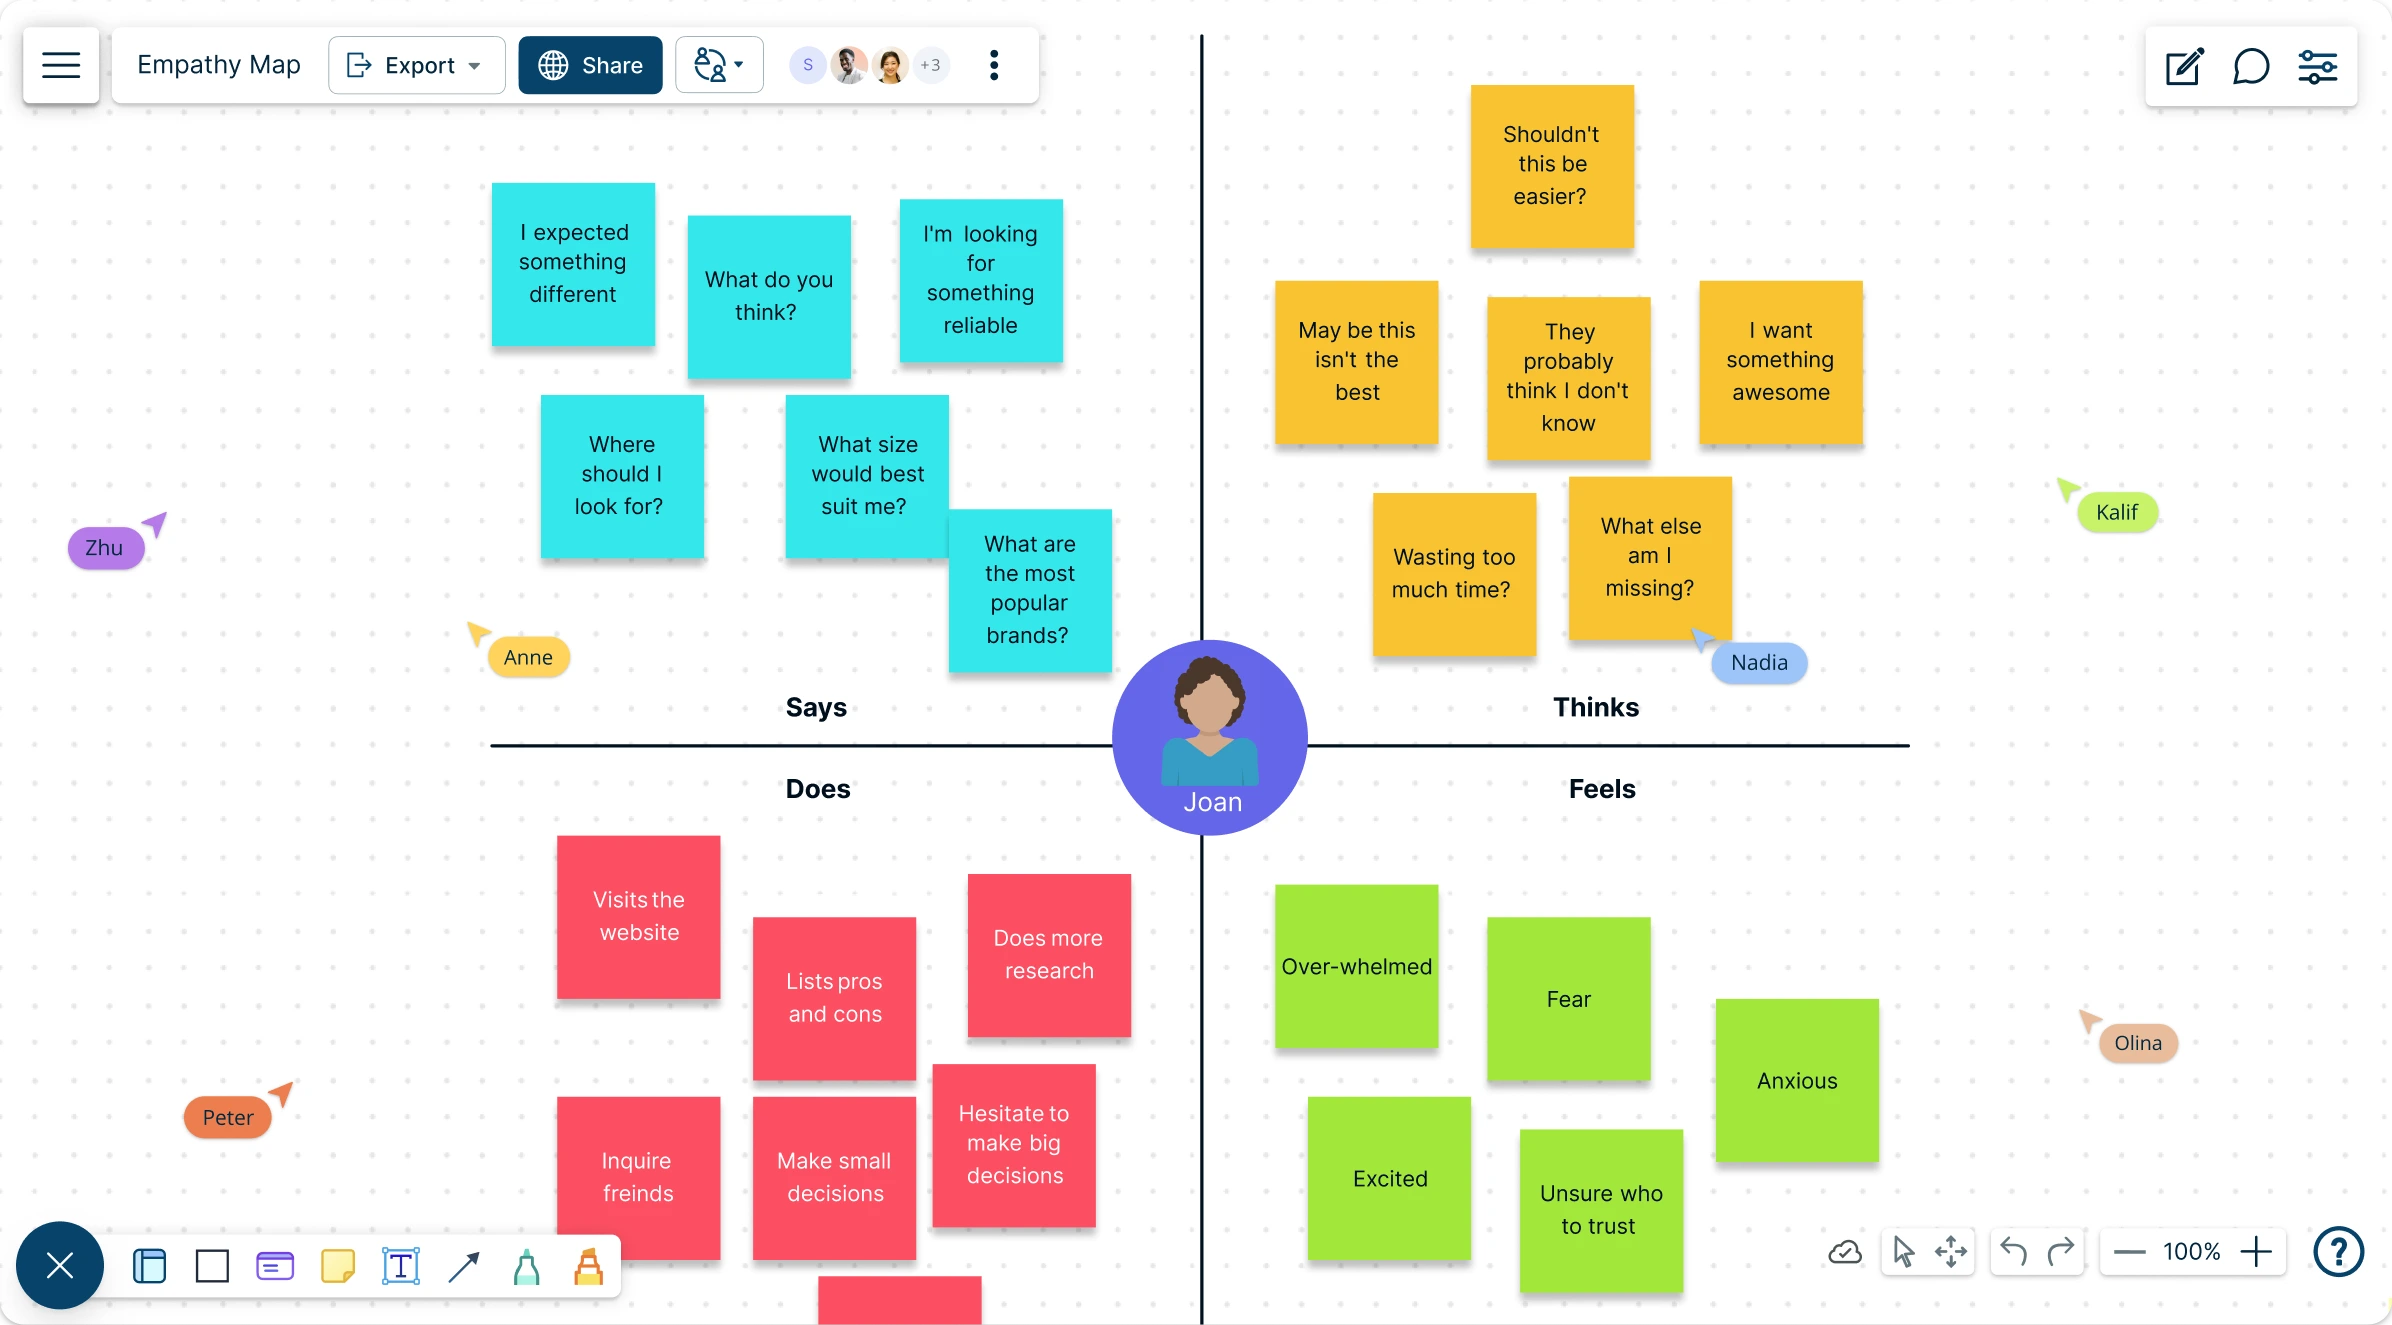
Use Creately’s empathy map maker to gain a deep understanding of the user attitudes, behaviour, experiences, and needs.
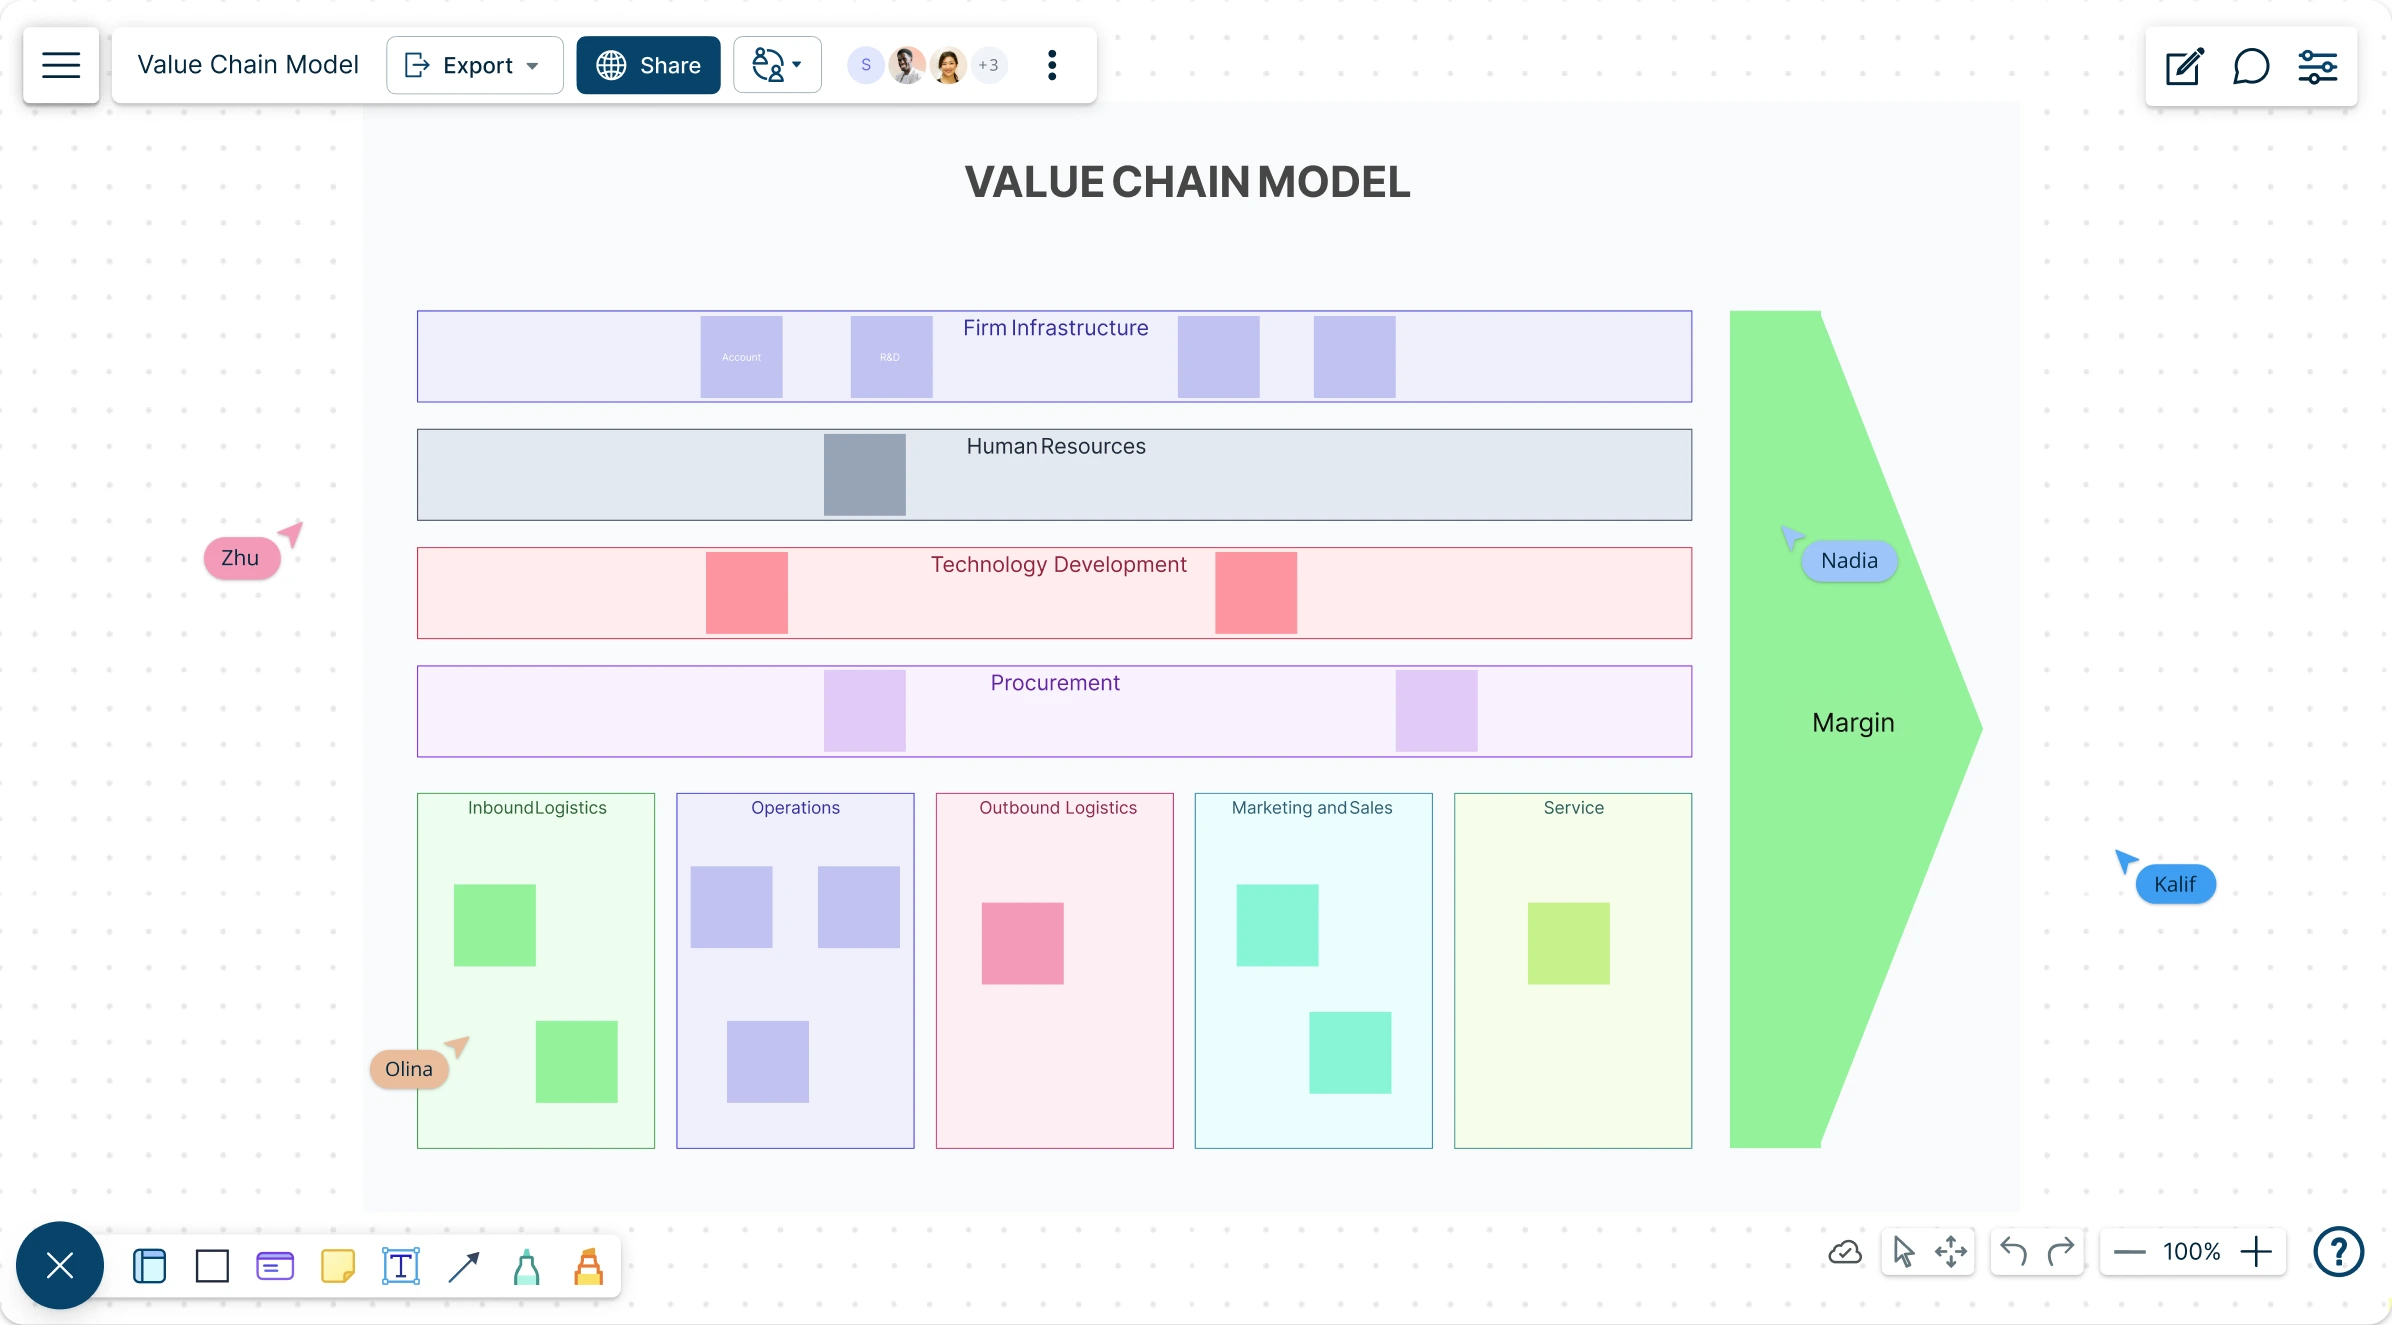
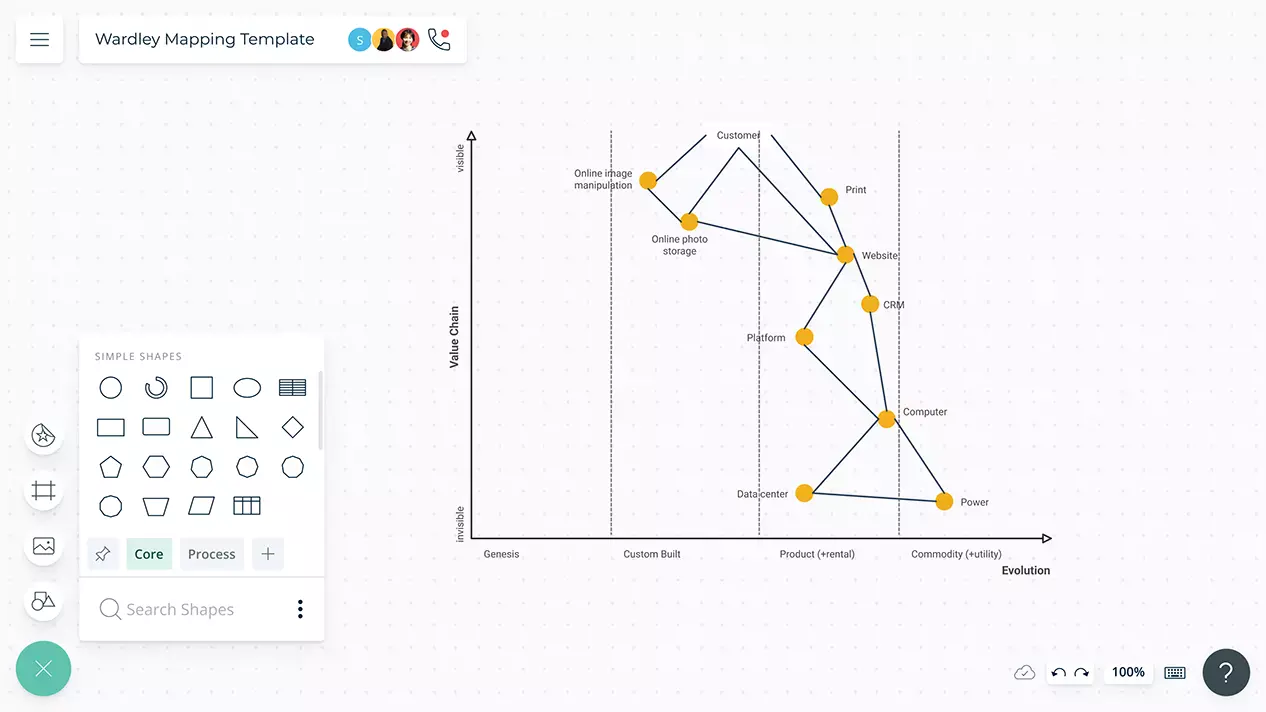
Map out your value chain easily to identify ways you can improve processes to add more value to your products & customers.
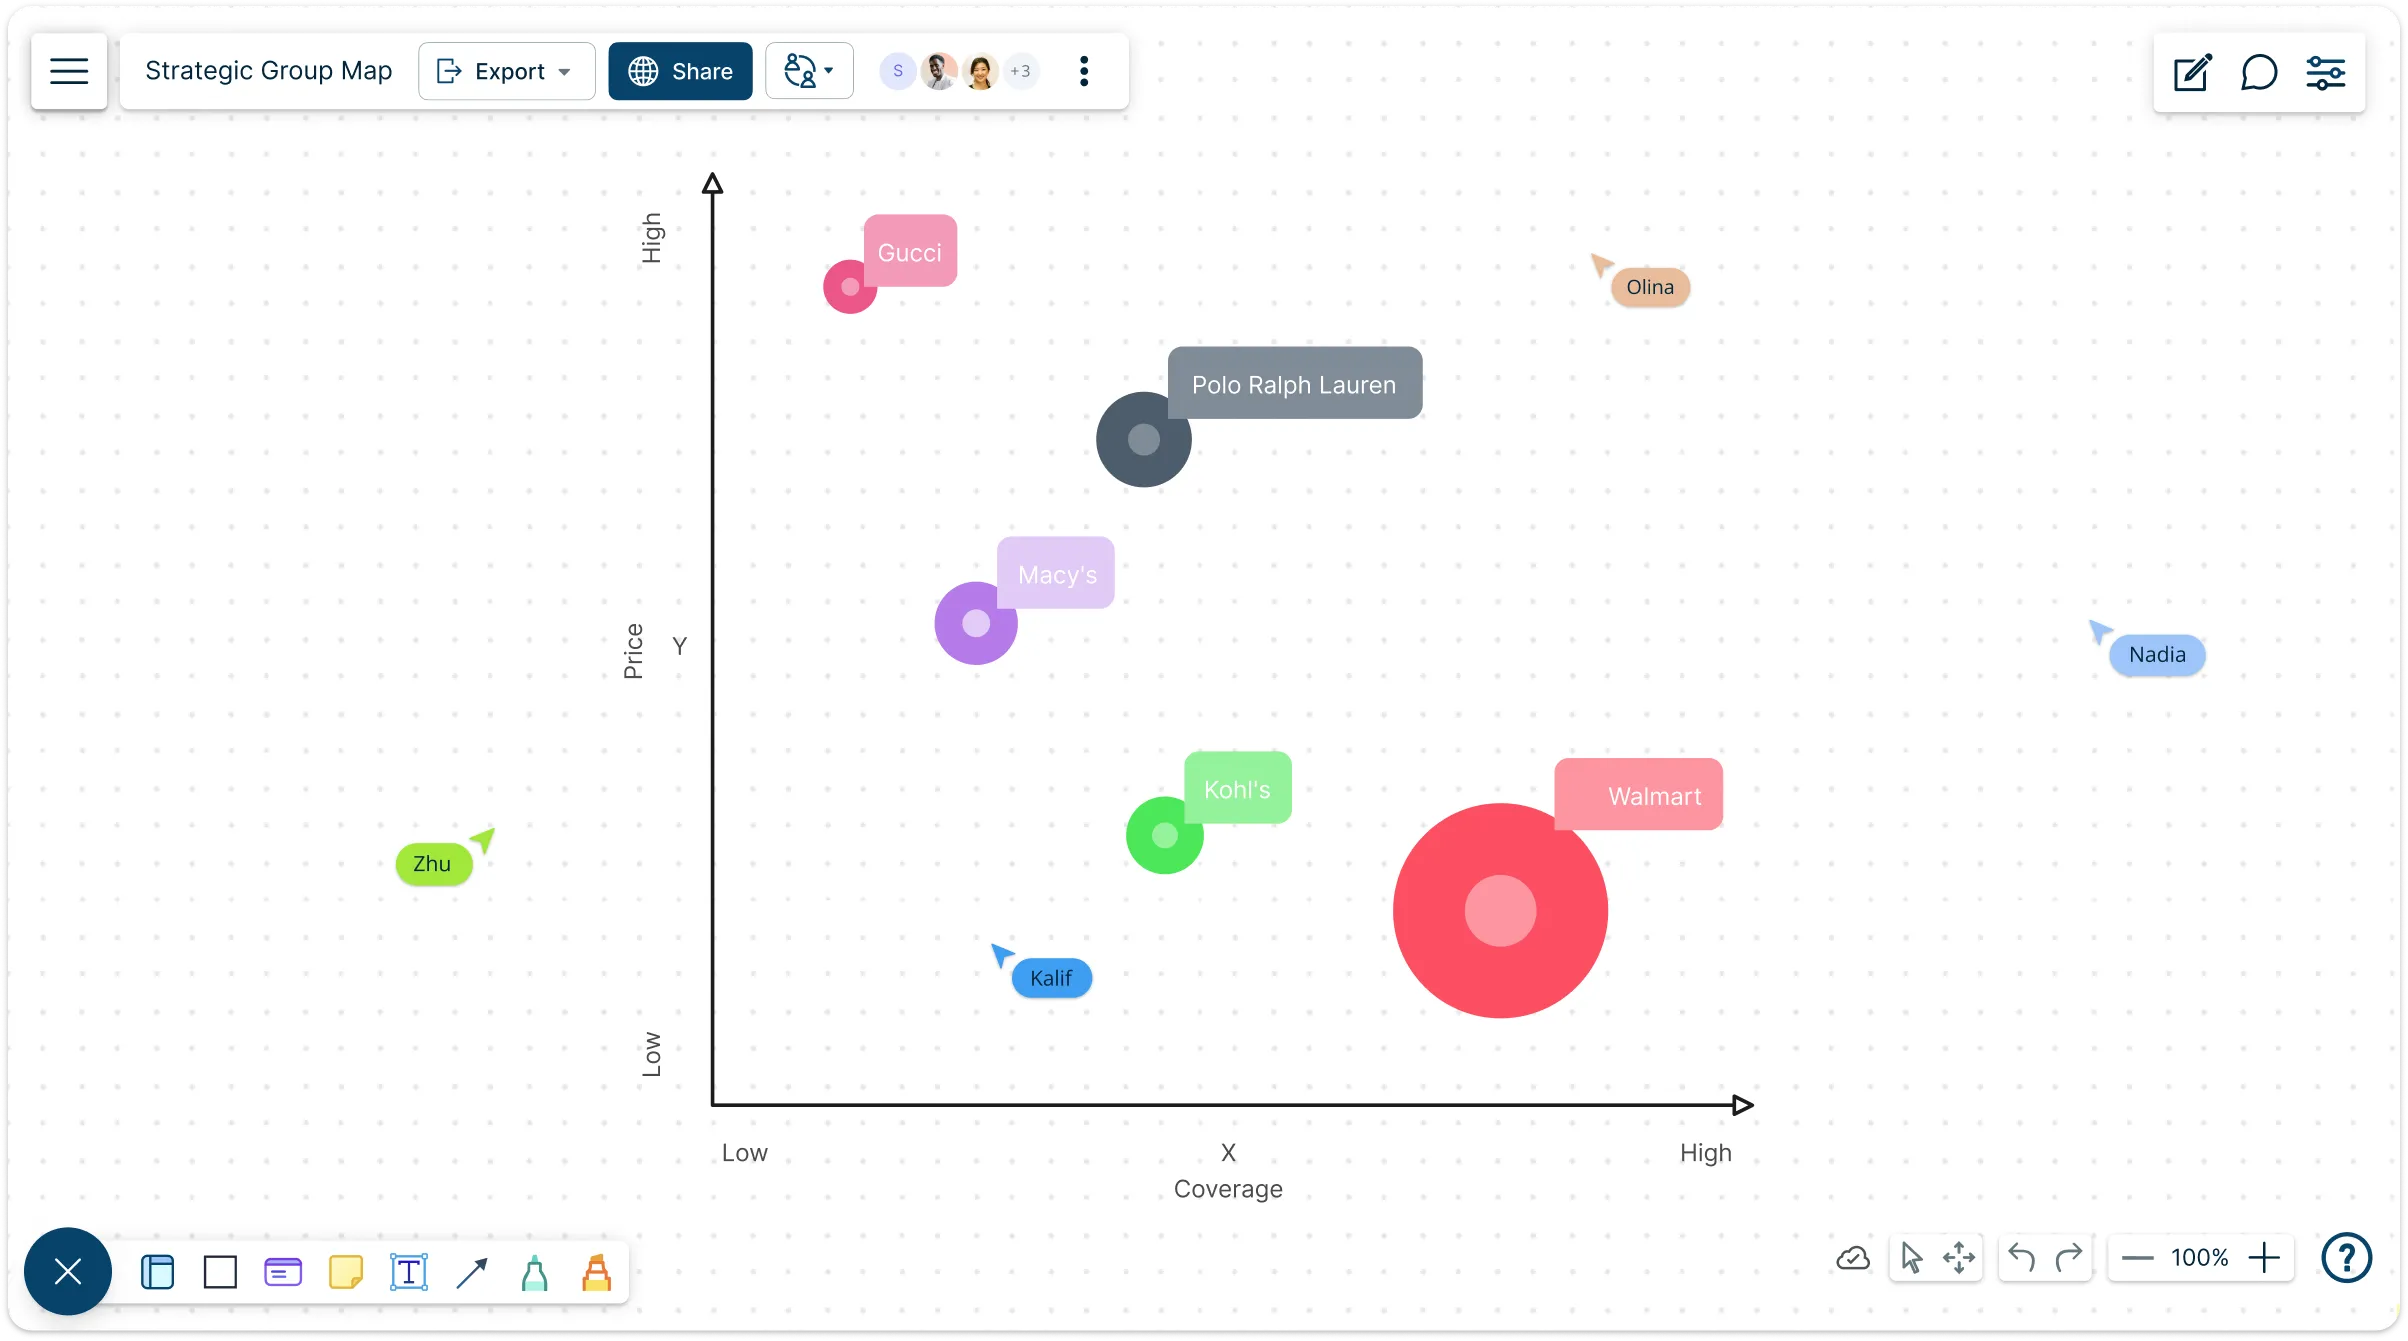
Unlock the power of visual strategic group mapping — see your industry from every angle, spot opportunities others miss, and align your team around action‑driving insights.
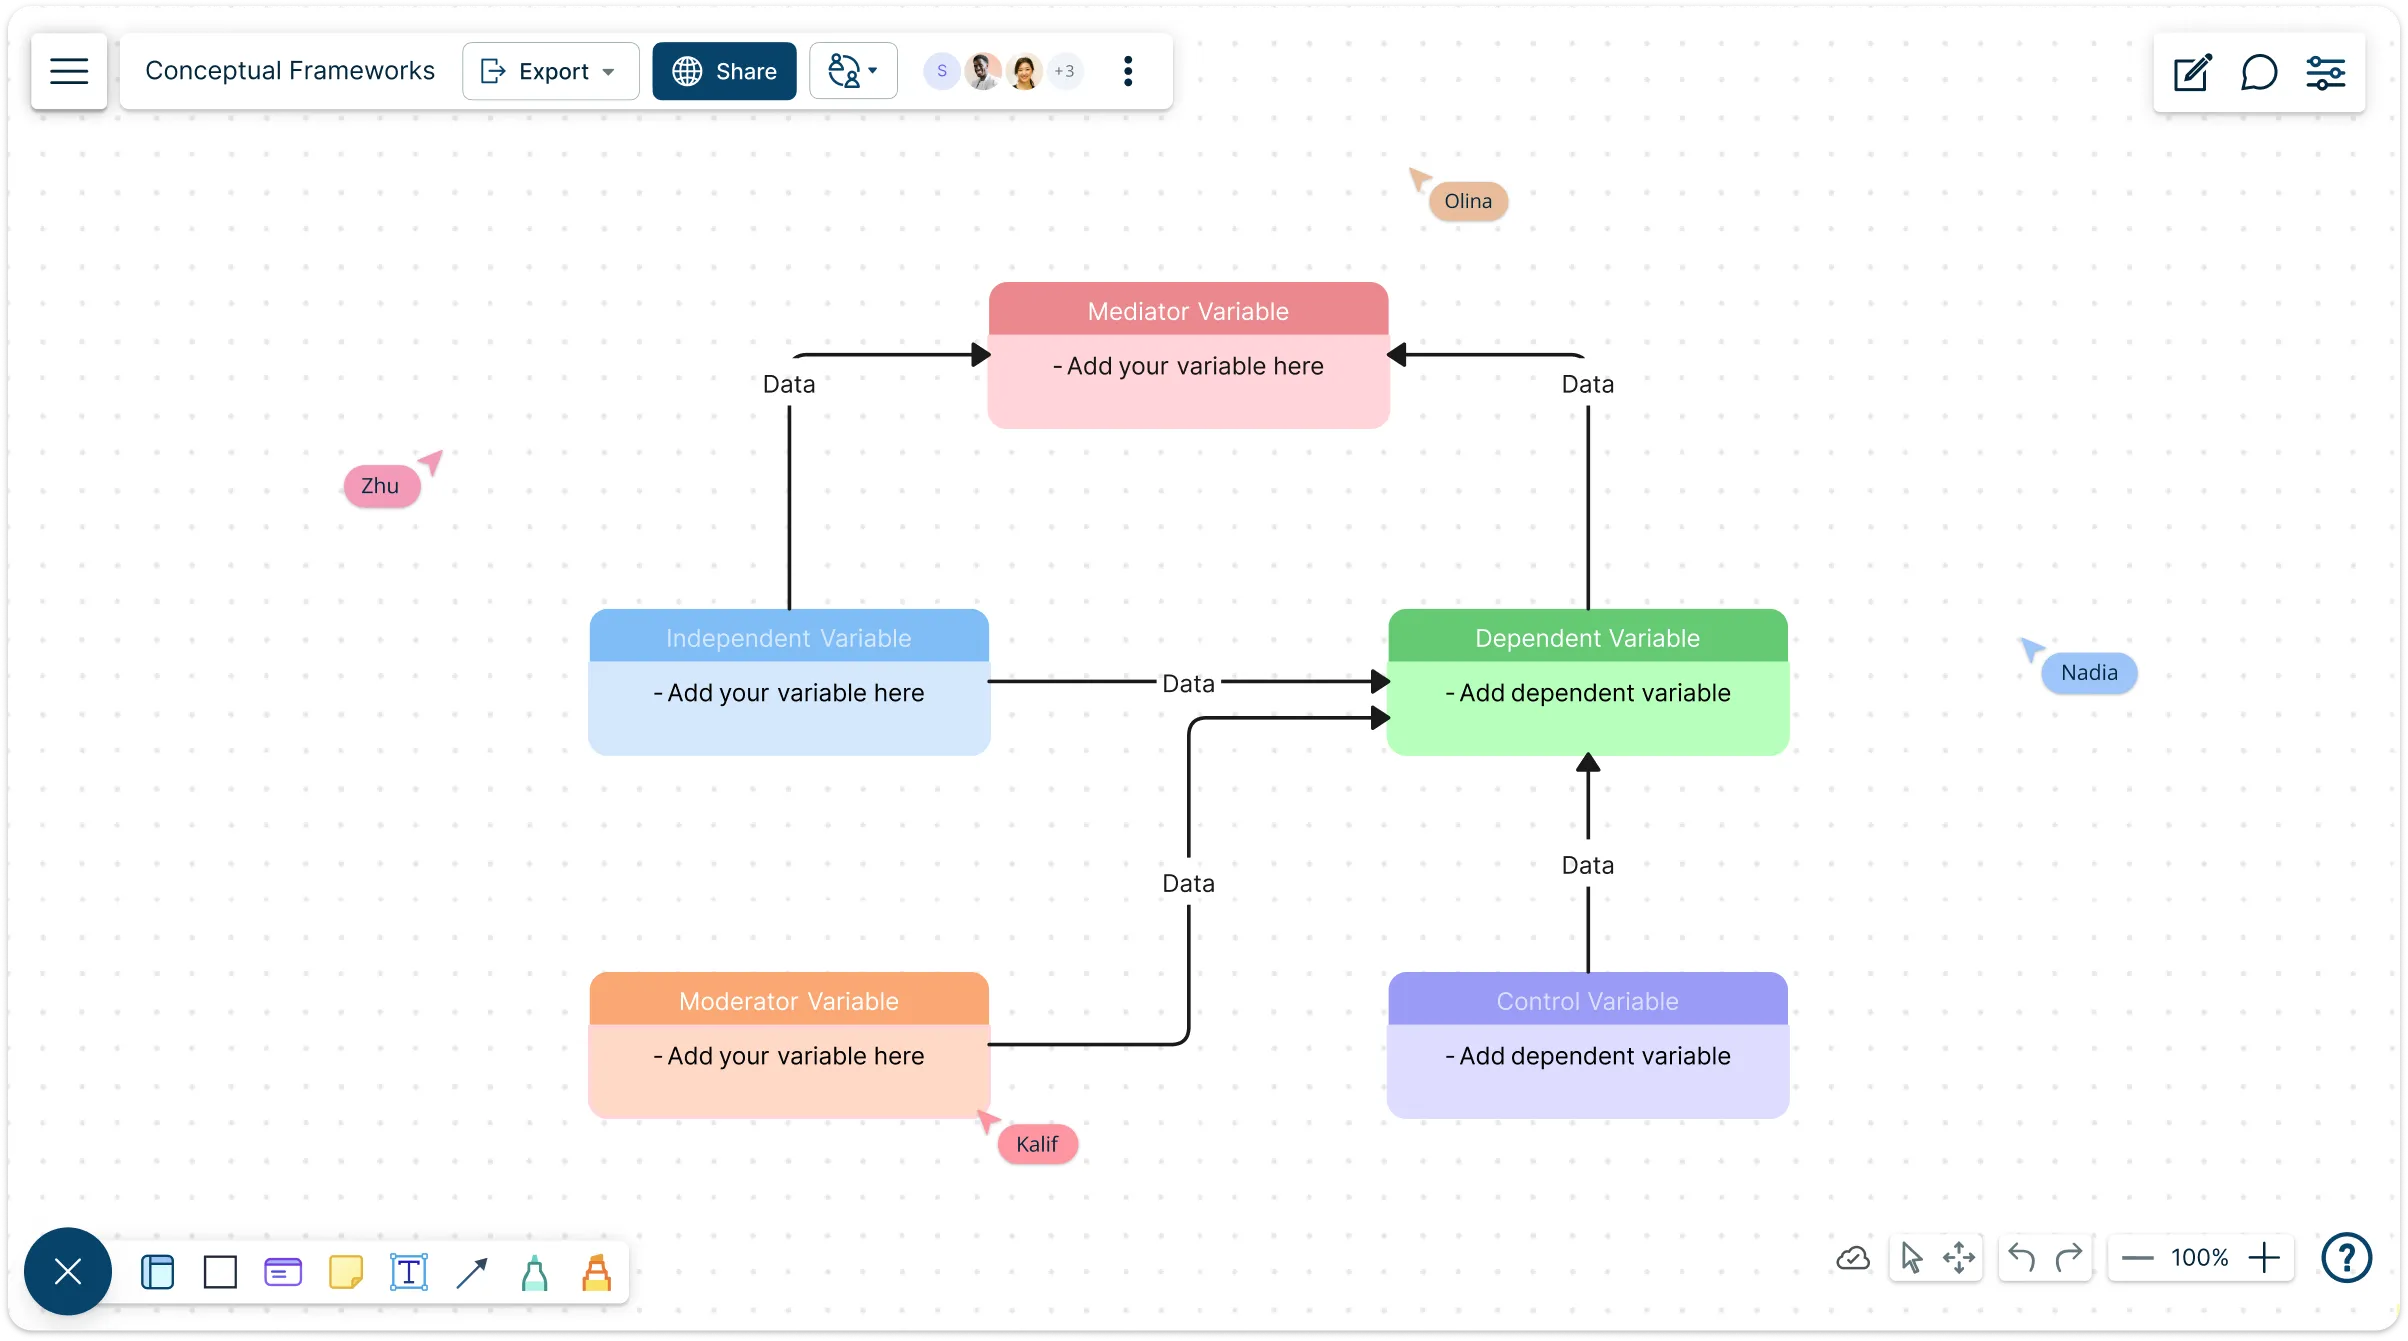
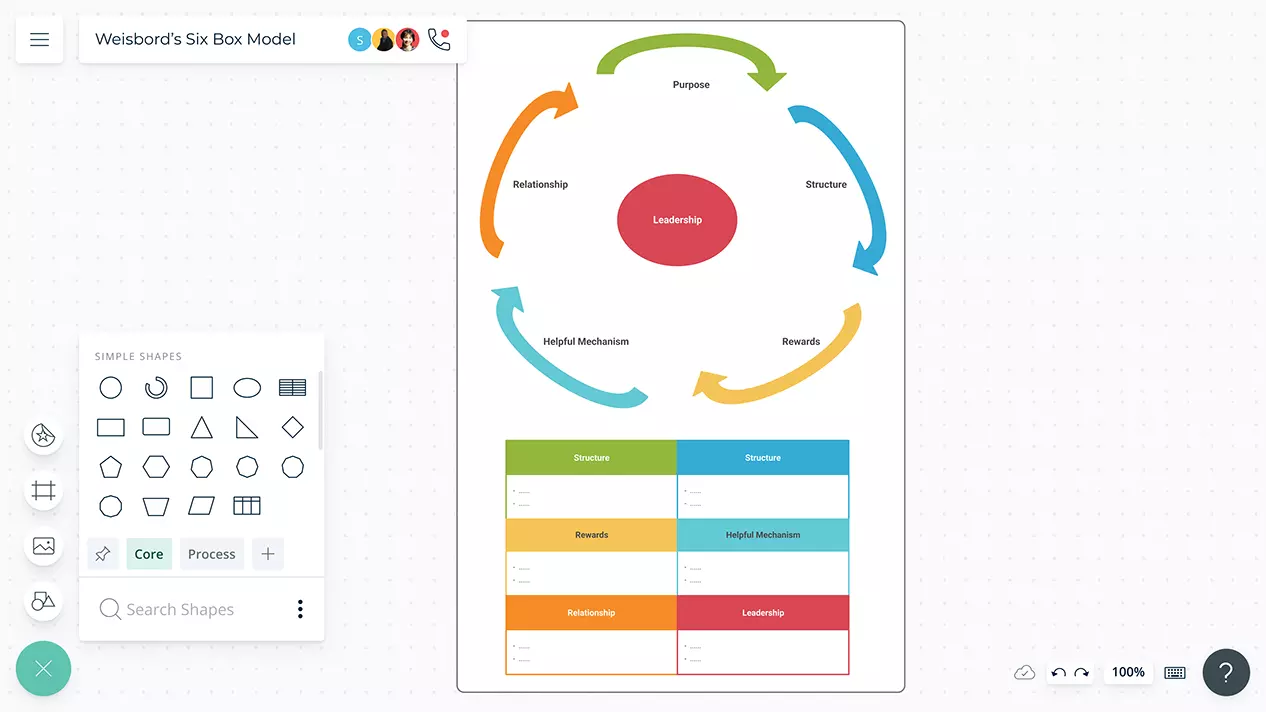
Quickly turn complex ideas into clear, visual frameworks. Easily map relationships, organize key concepts, and refine your thinking in one flexible workspace—so your framework is easy to build, easy to update, and easy for others to understand.
Quickly visualize and align your organization’s structure, processes, and capabilities with Creately’s interactive operating model canvas template.
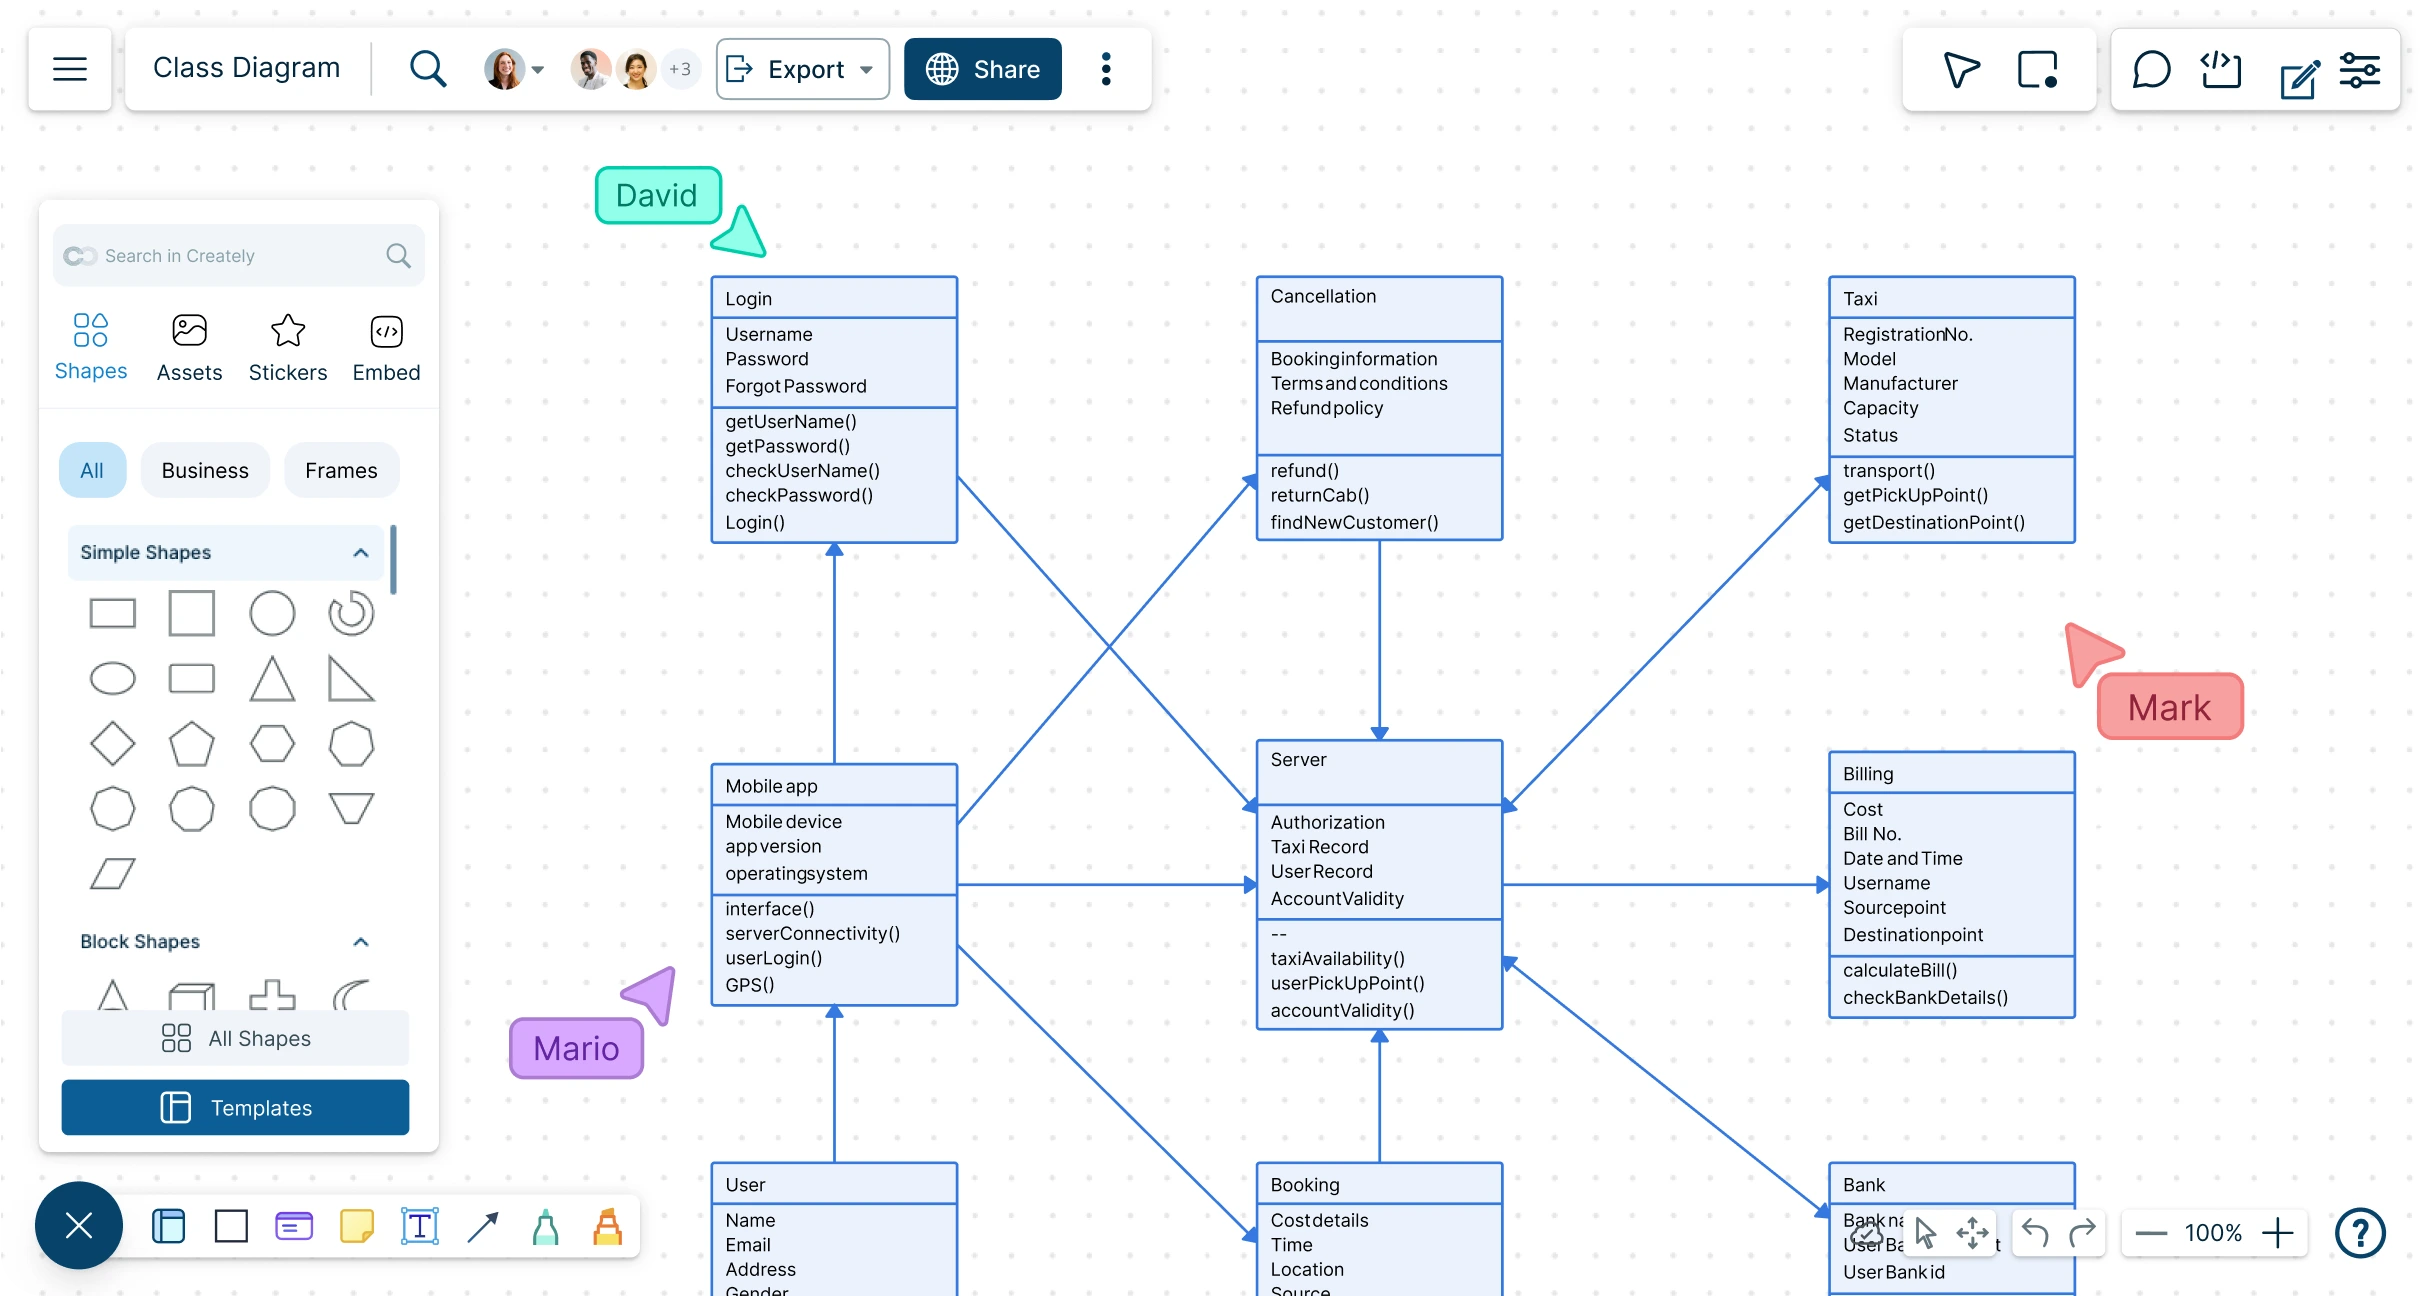
Quickly design and share class diagrams online to model system structures and relationships. Use Collaborate on your diagrams for efficient and accurate UML modeling.
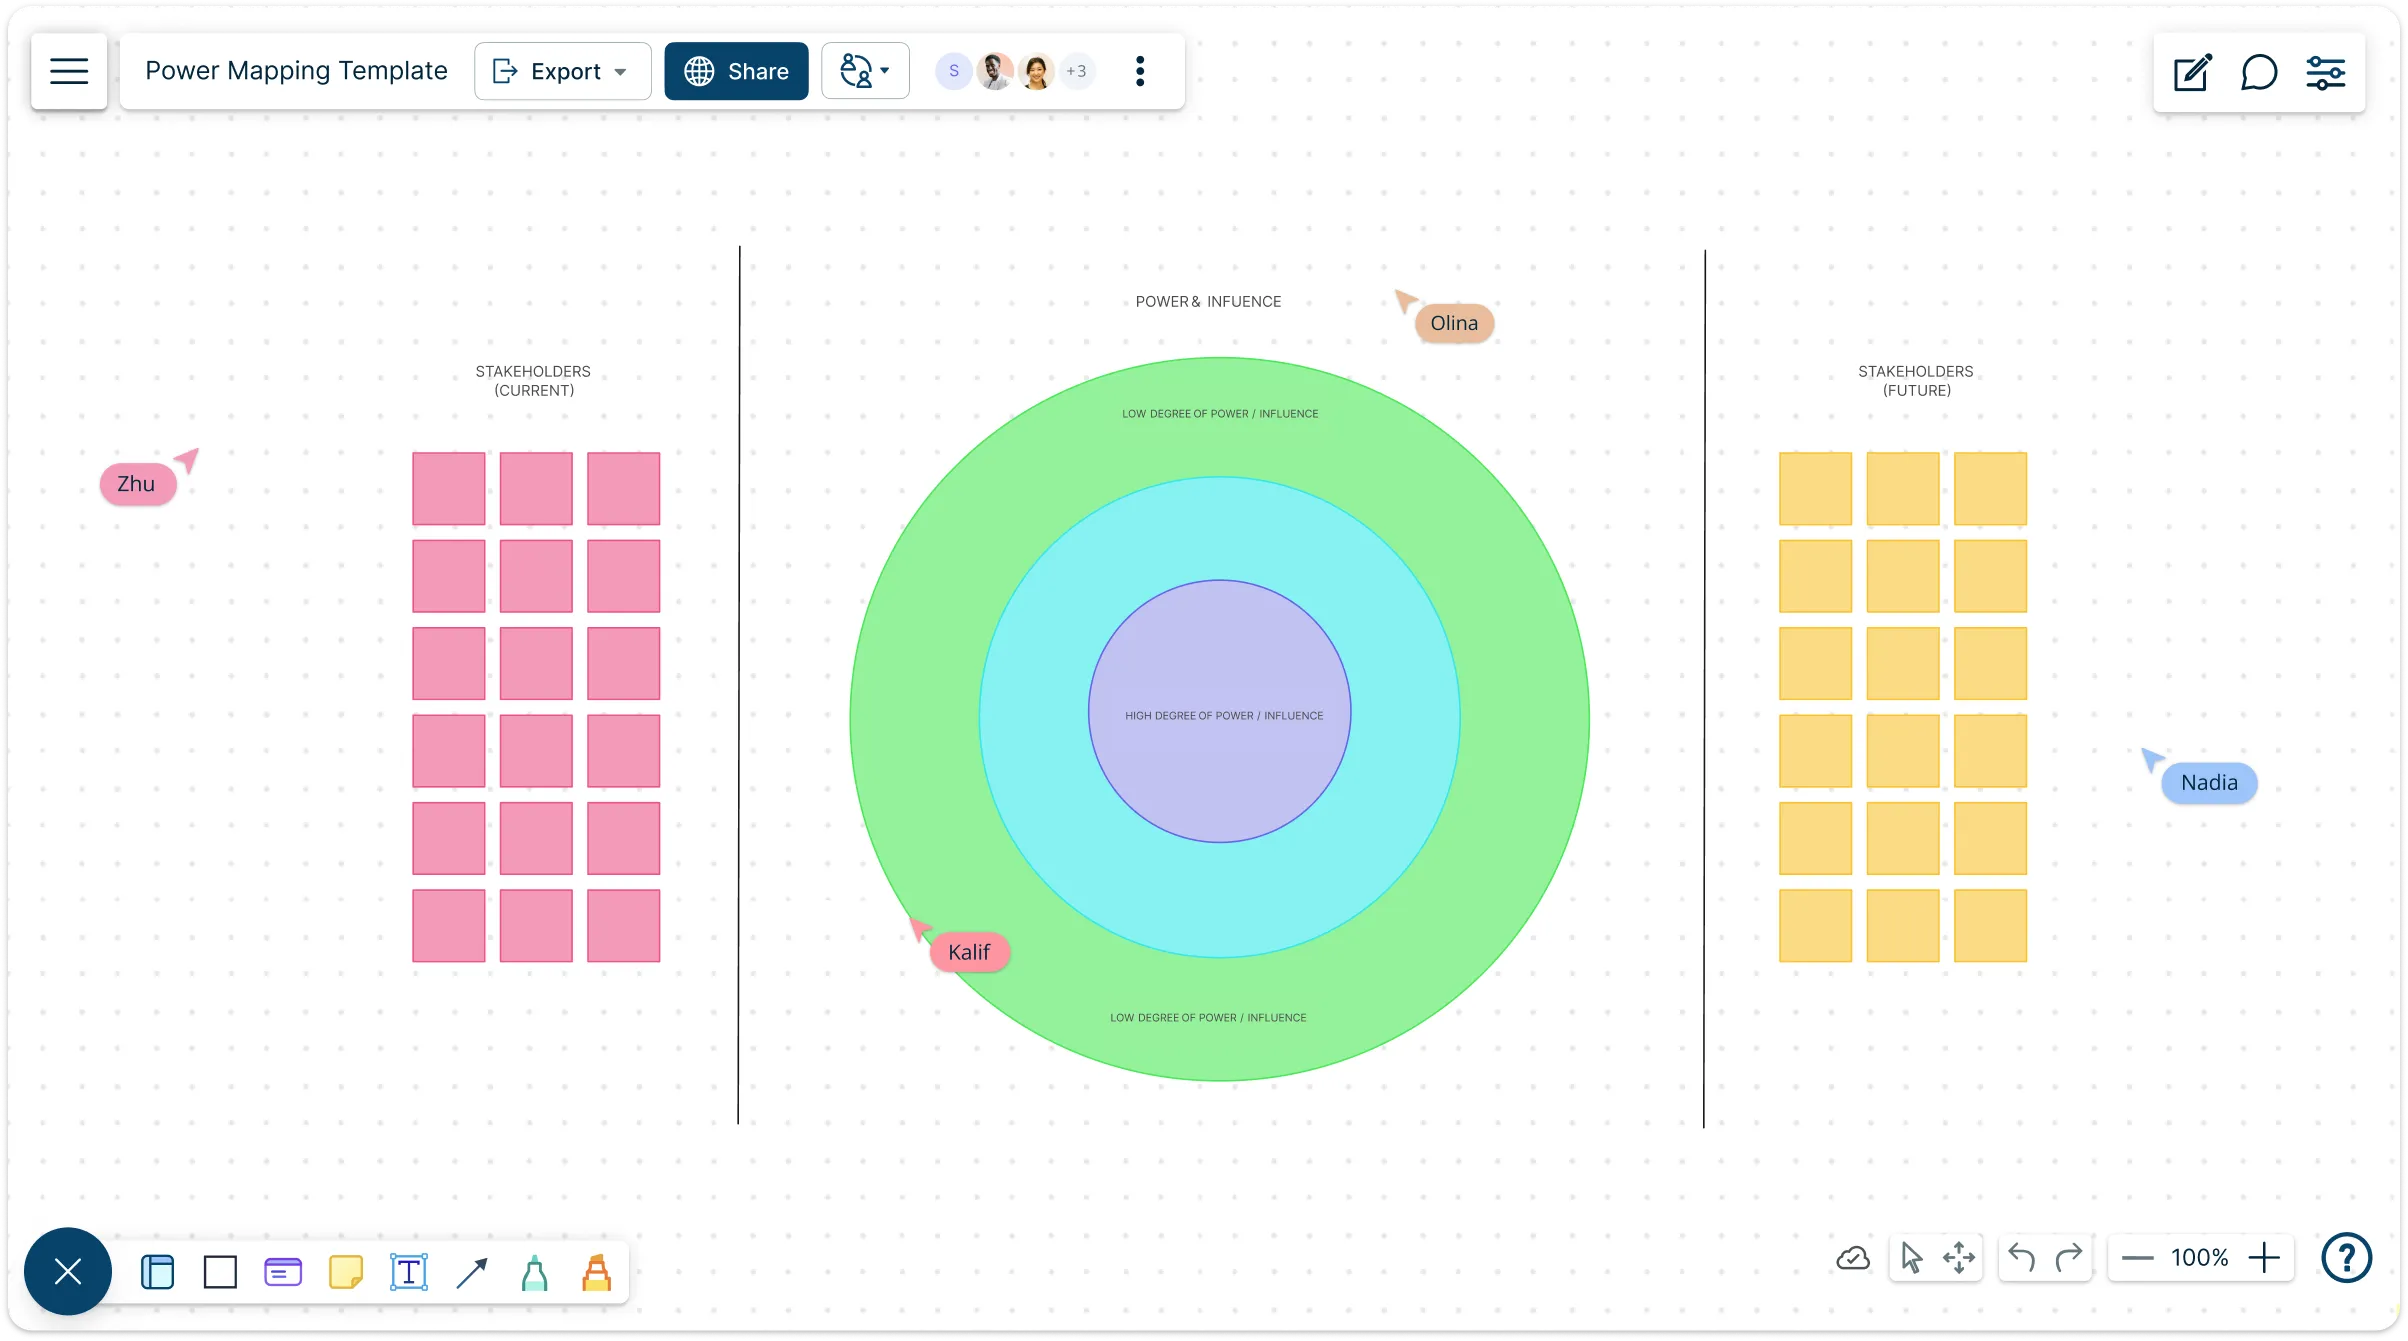
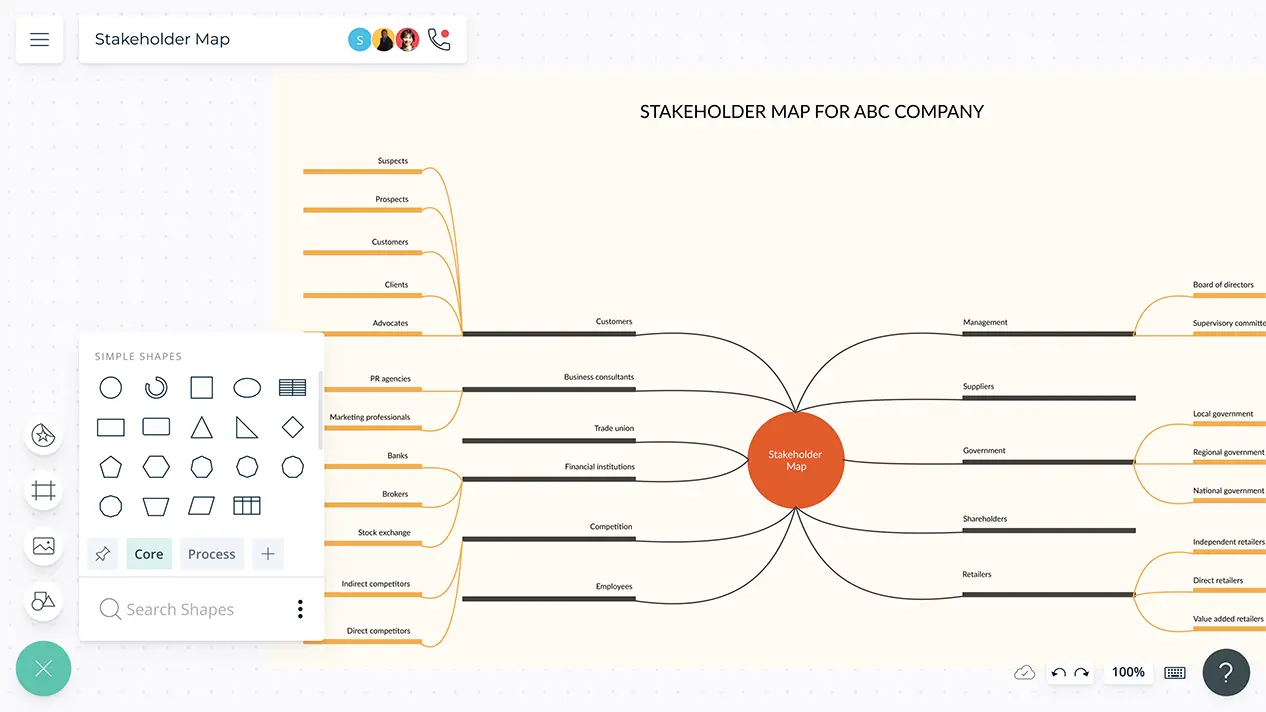
Understand who holds power, where they stand, and how to move them toward your goals. Use Creately’s power mapping template to visualize relationships, identify leverage points, and build a strategy that actually works in the real world.
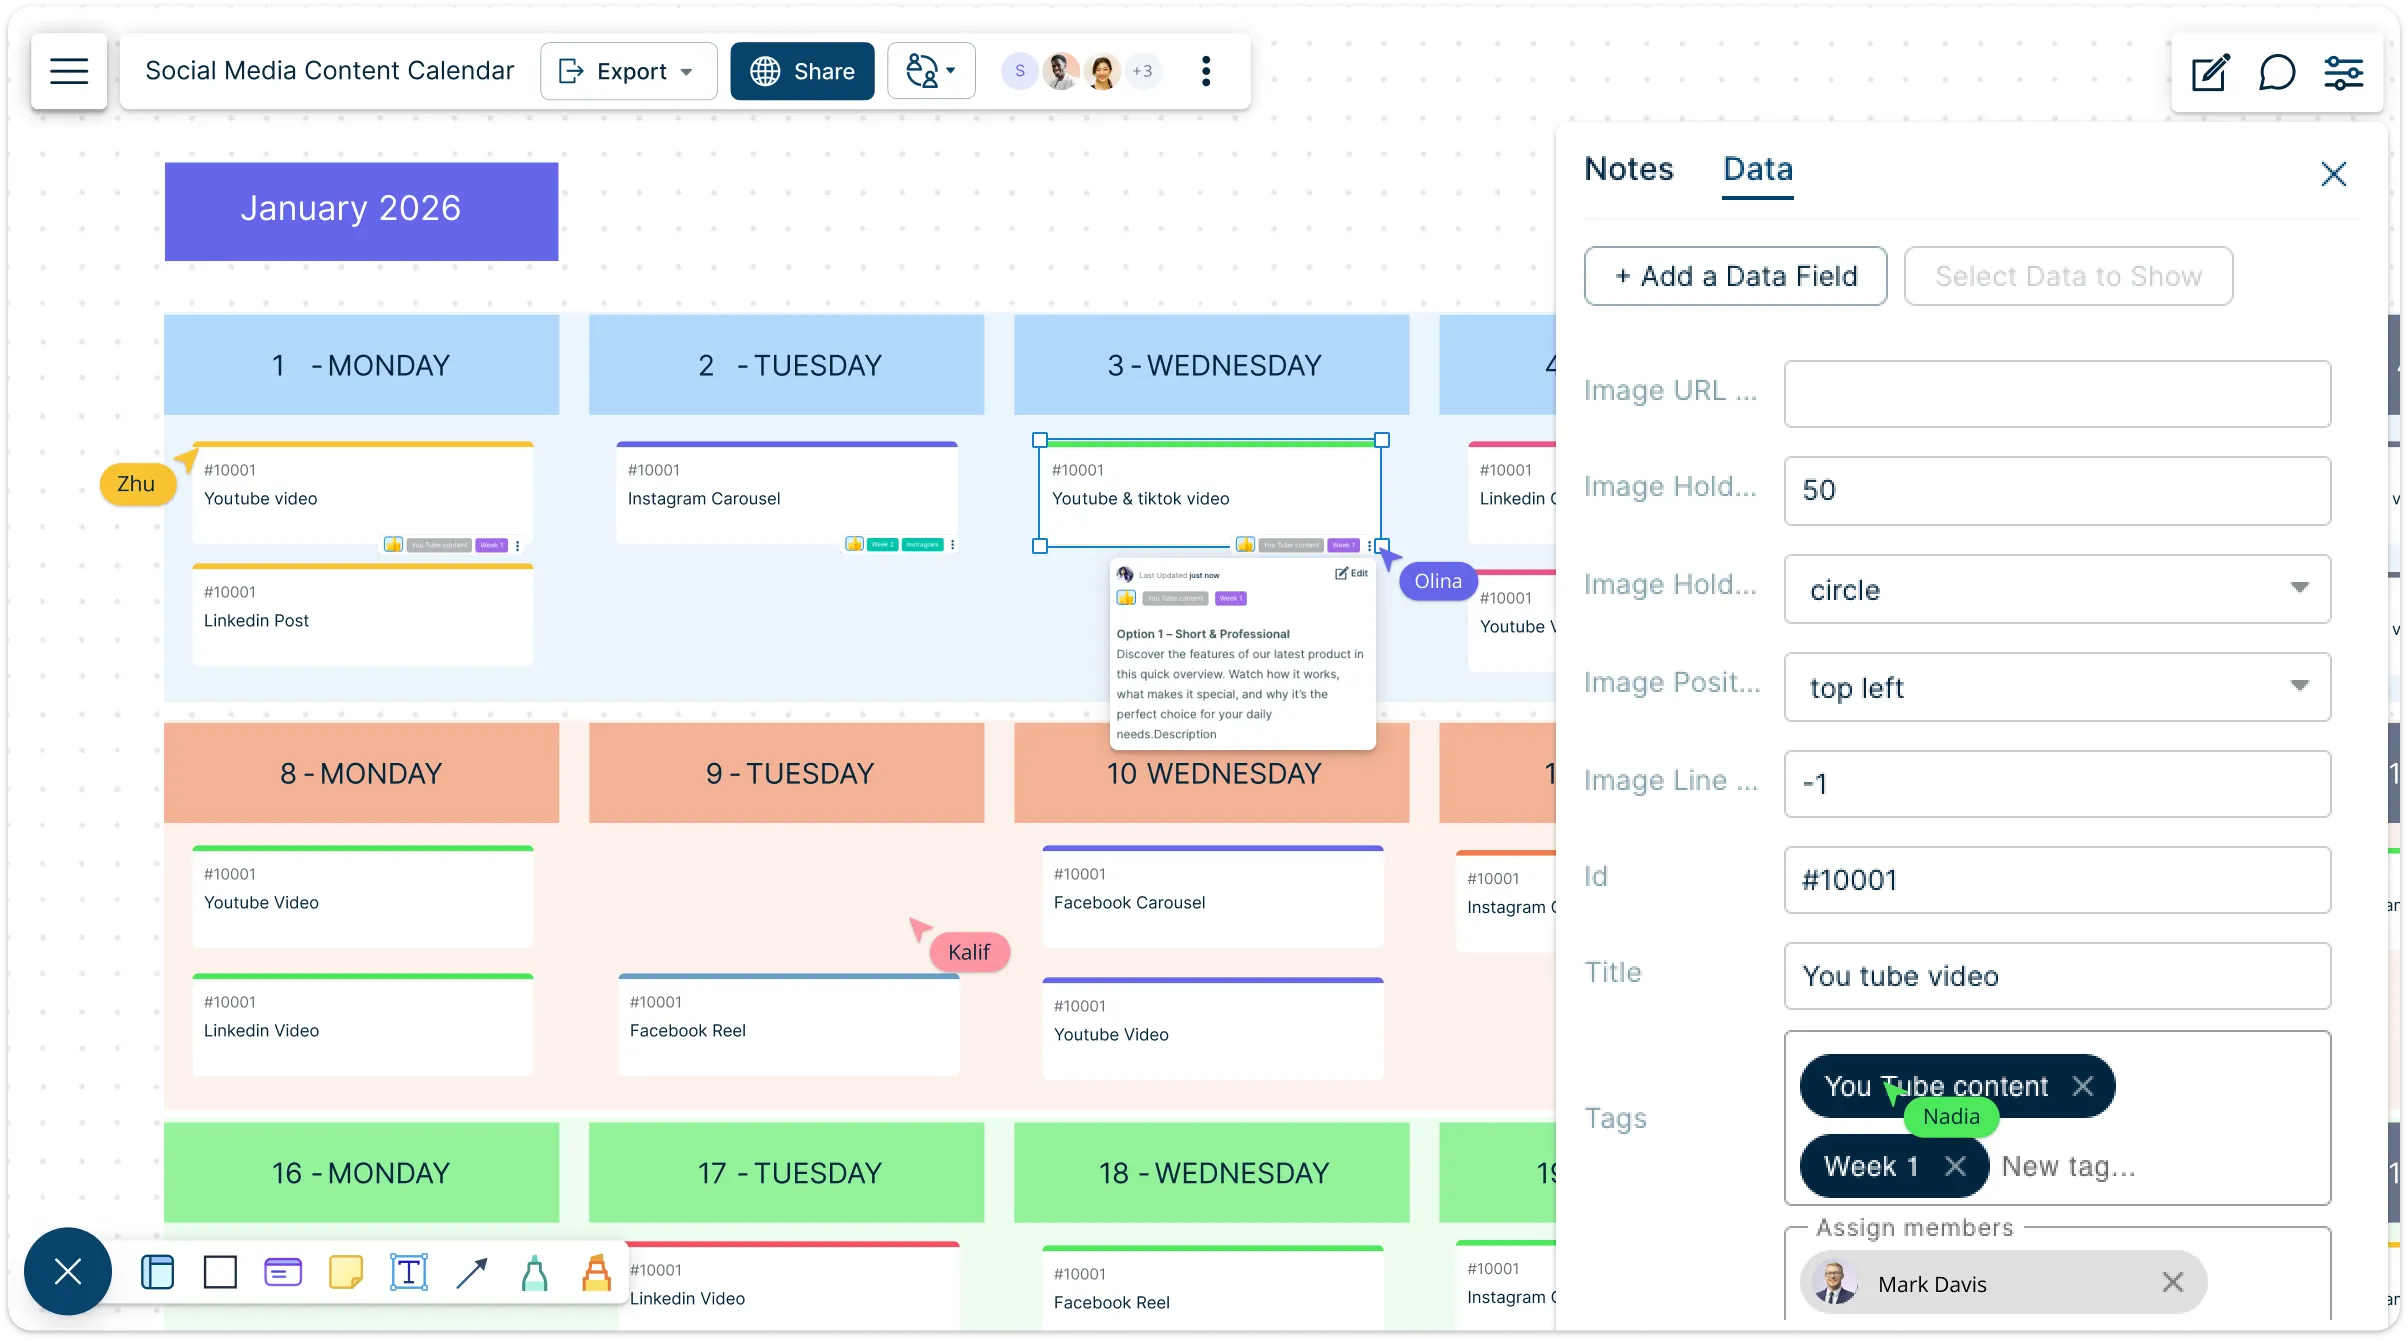
Brainstorm, plan, and execute your social media content in one visual, collaborative calendar. Track approvals, update statuses, add UTM fields, and roll up performance metrics while keeping assets, copy, and deadlines organized for consistent publishing across every channel.
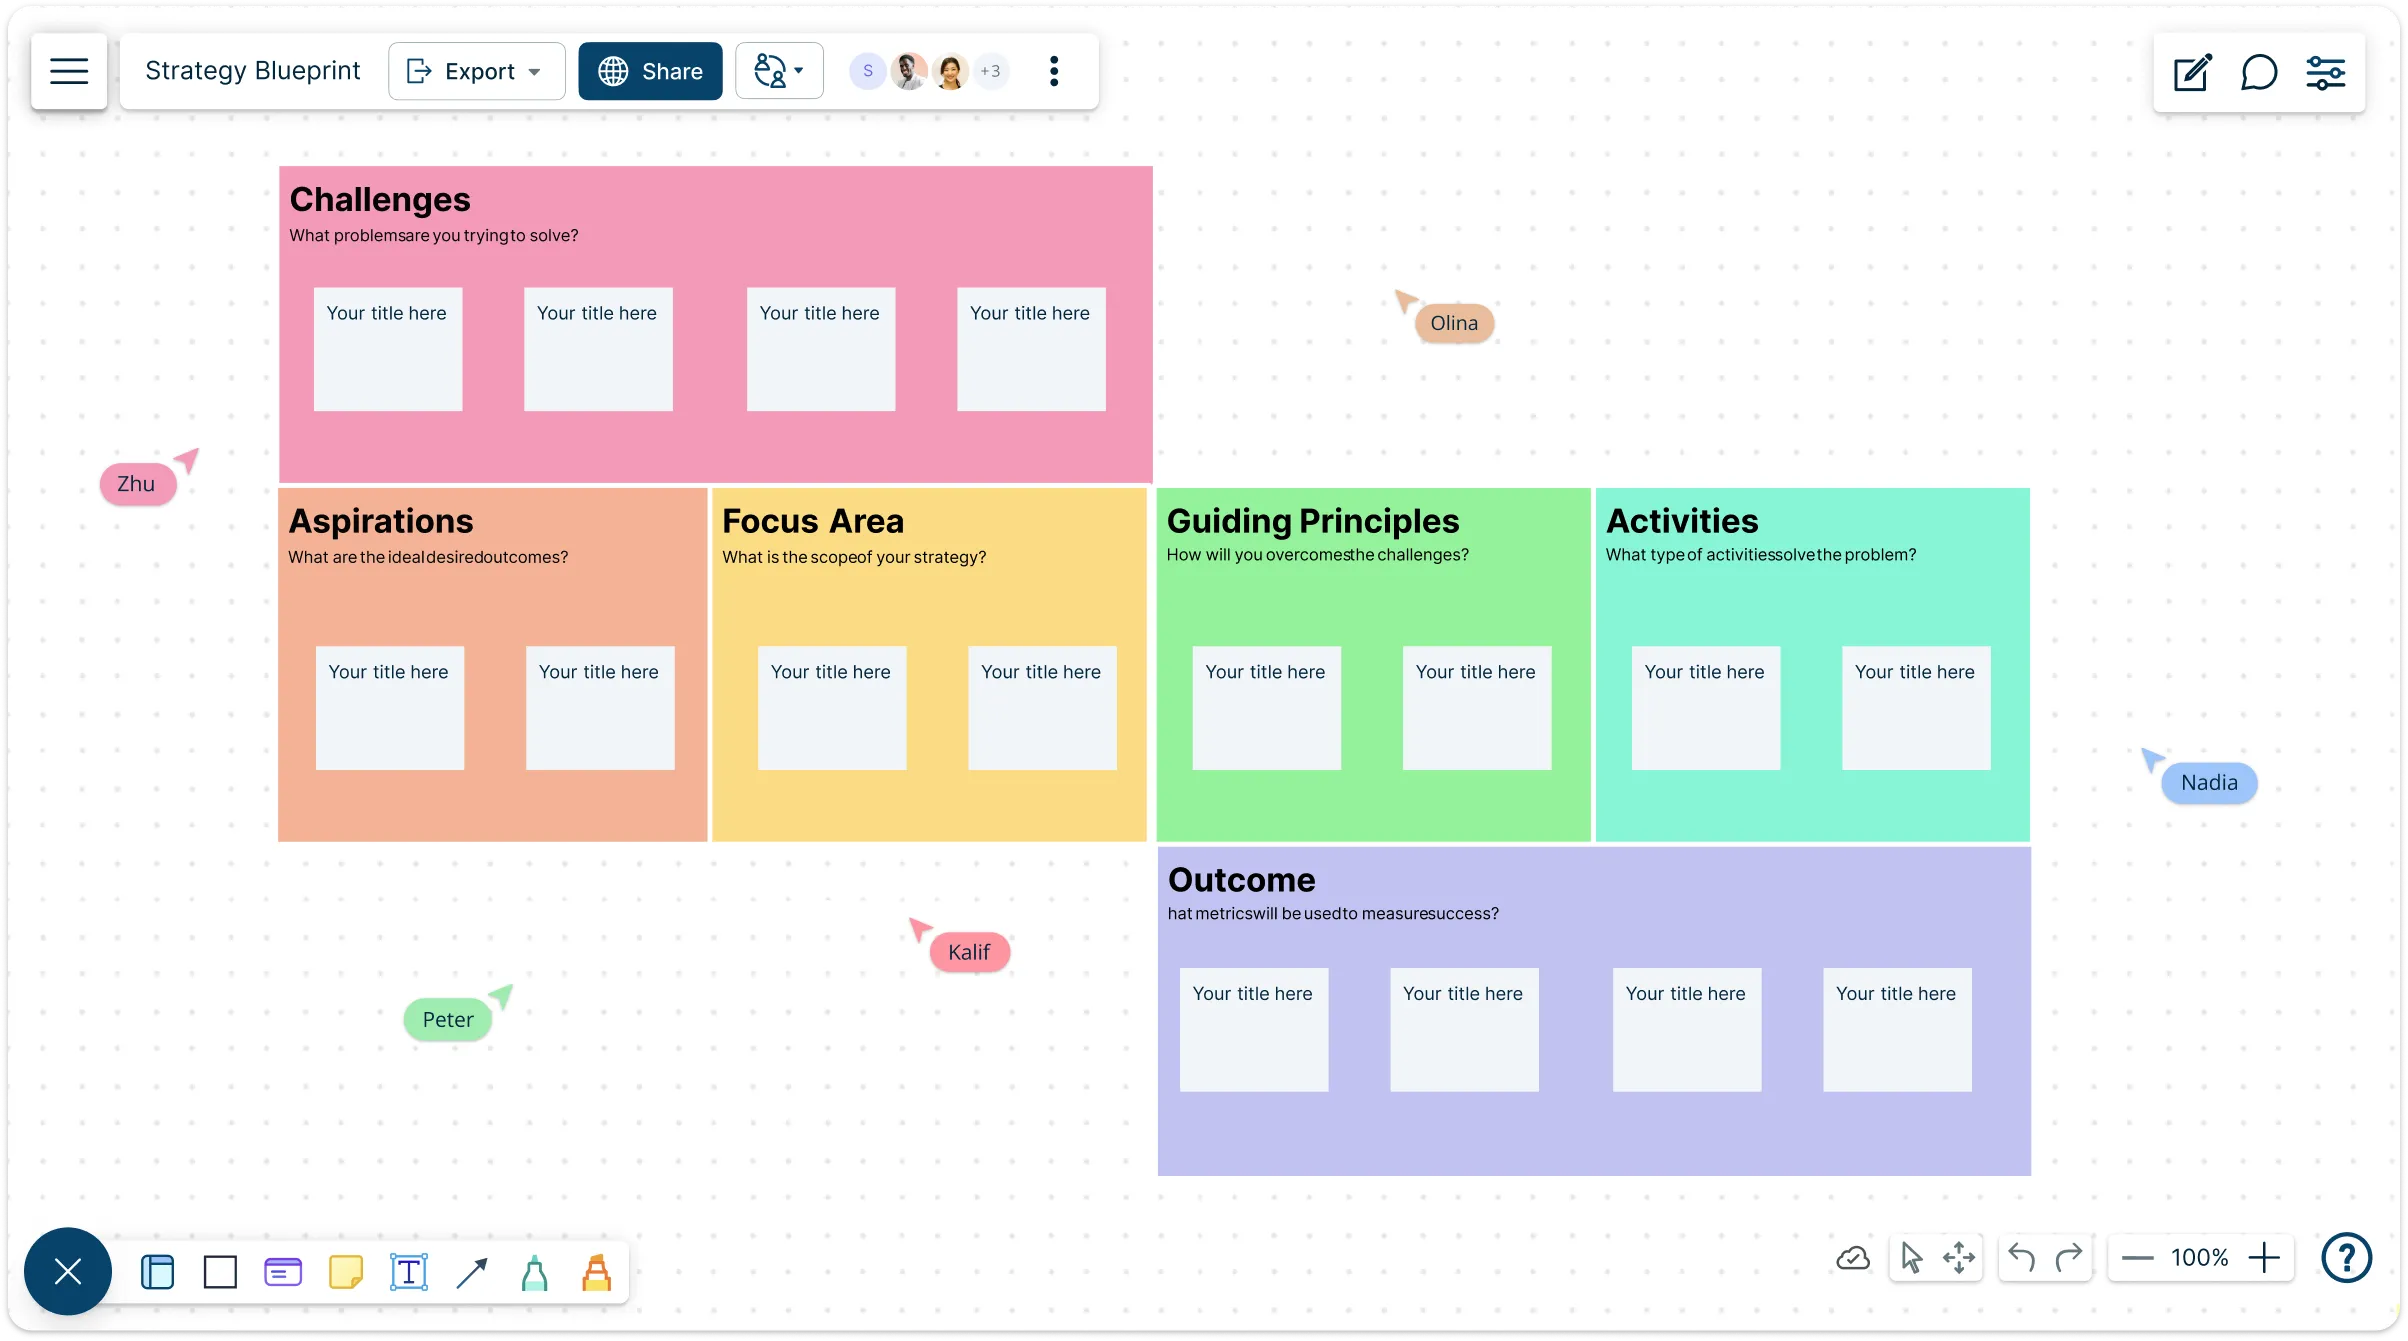
Bring ideas, research, decisions, and execution into one connected workspace. Align quickly, prioritize what matters, and turn strategic plans into measurable results—without juggling files, tools, or endless back-and-forth.
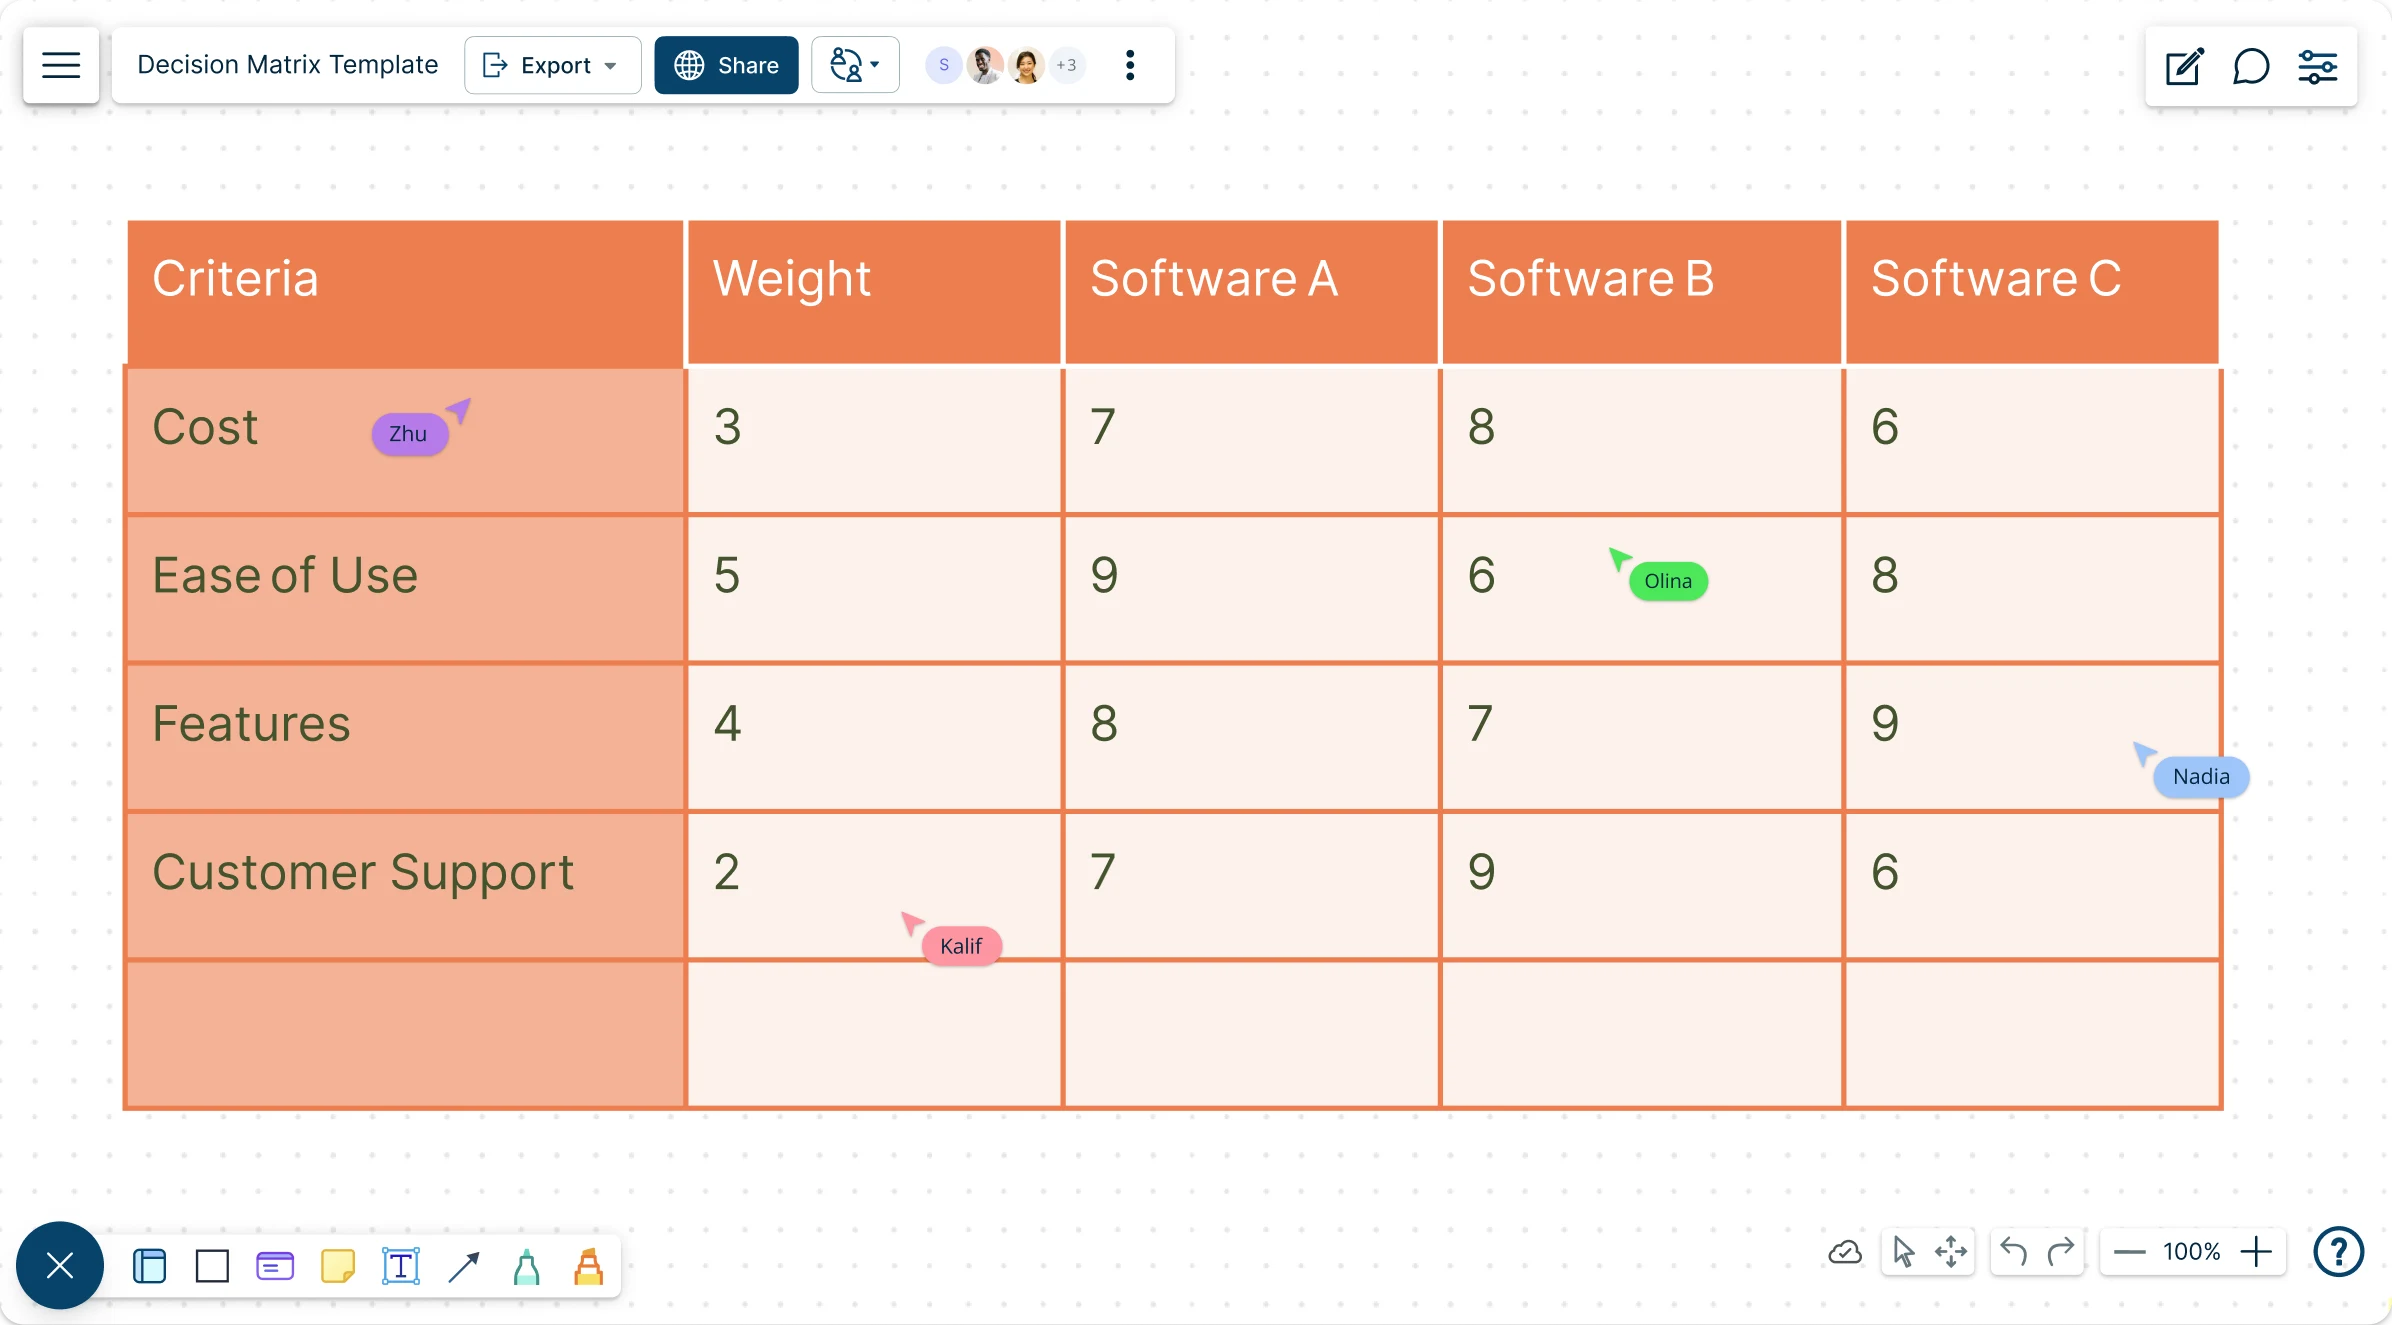
List your options, weigh what matters, and see the best choice at a glance. Collaborate in real time, make high-quality decisions quickly with the Decision Matrix Software.
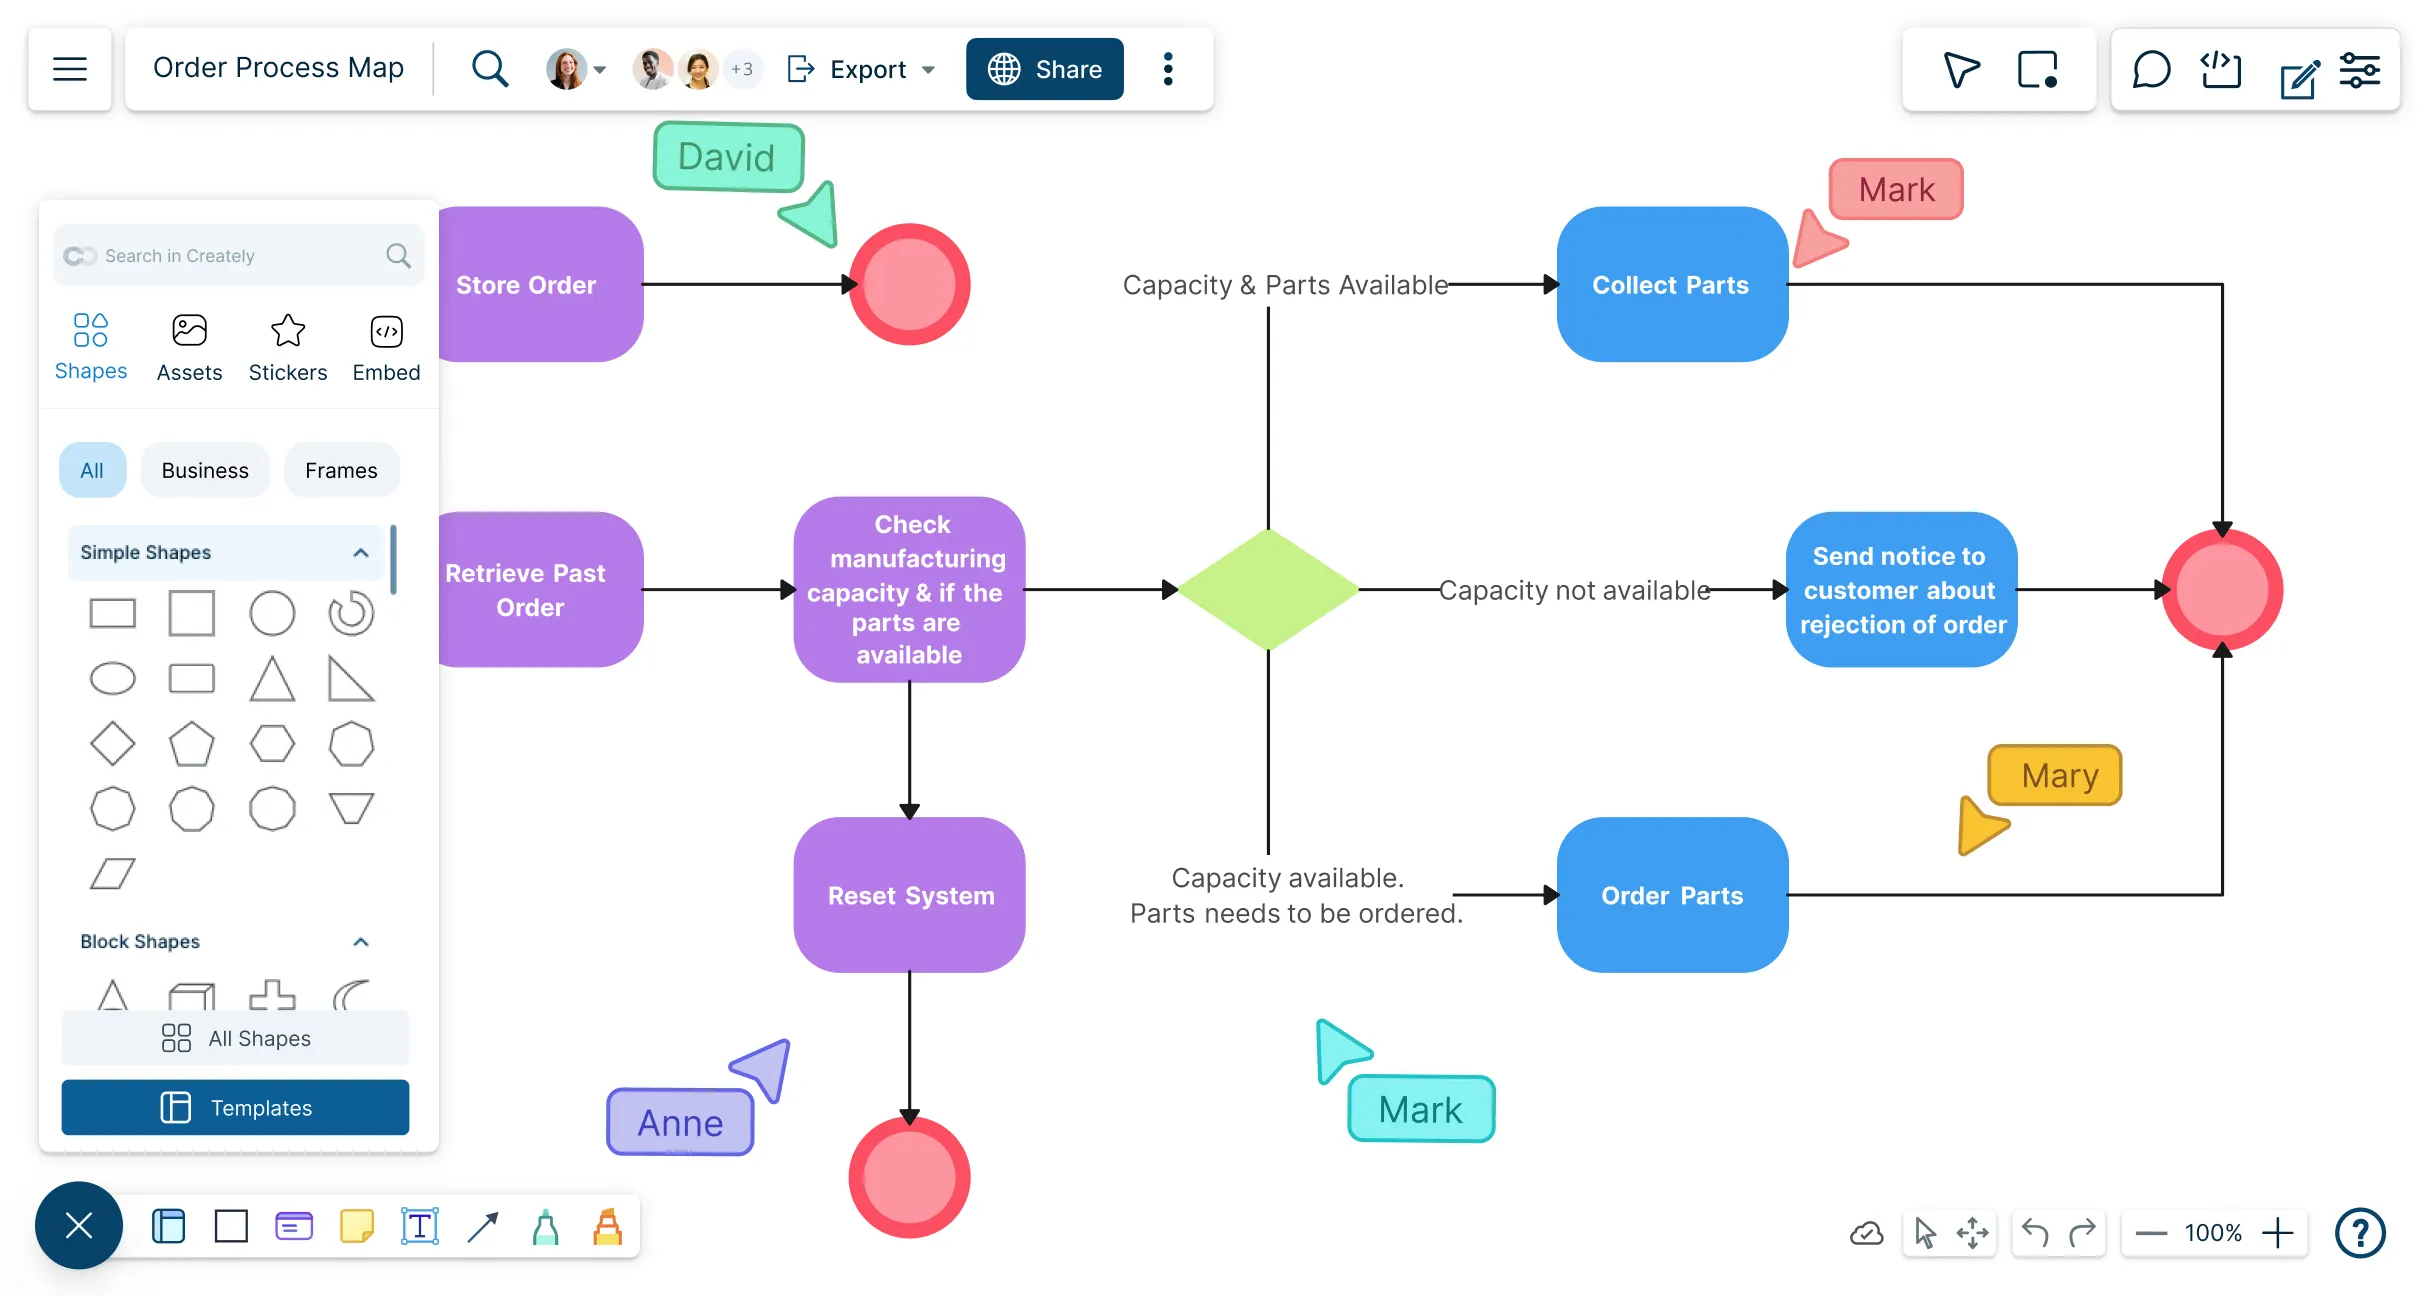
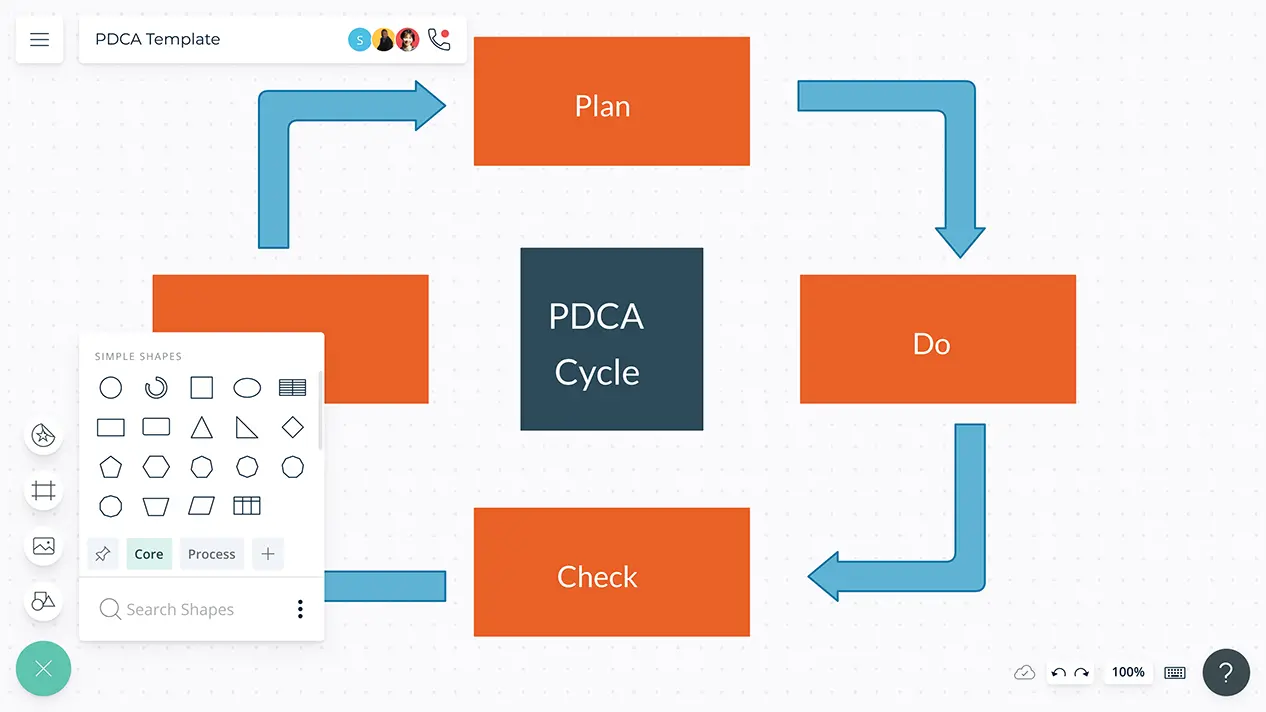
Use the process mapping tool to map workflows, identify gaps, and streamline your processes with clarity.
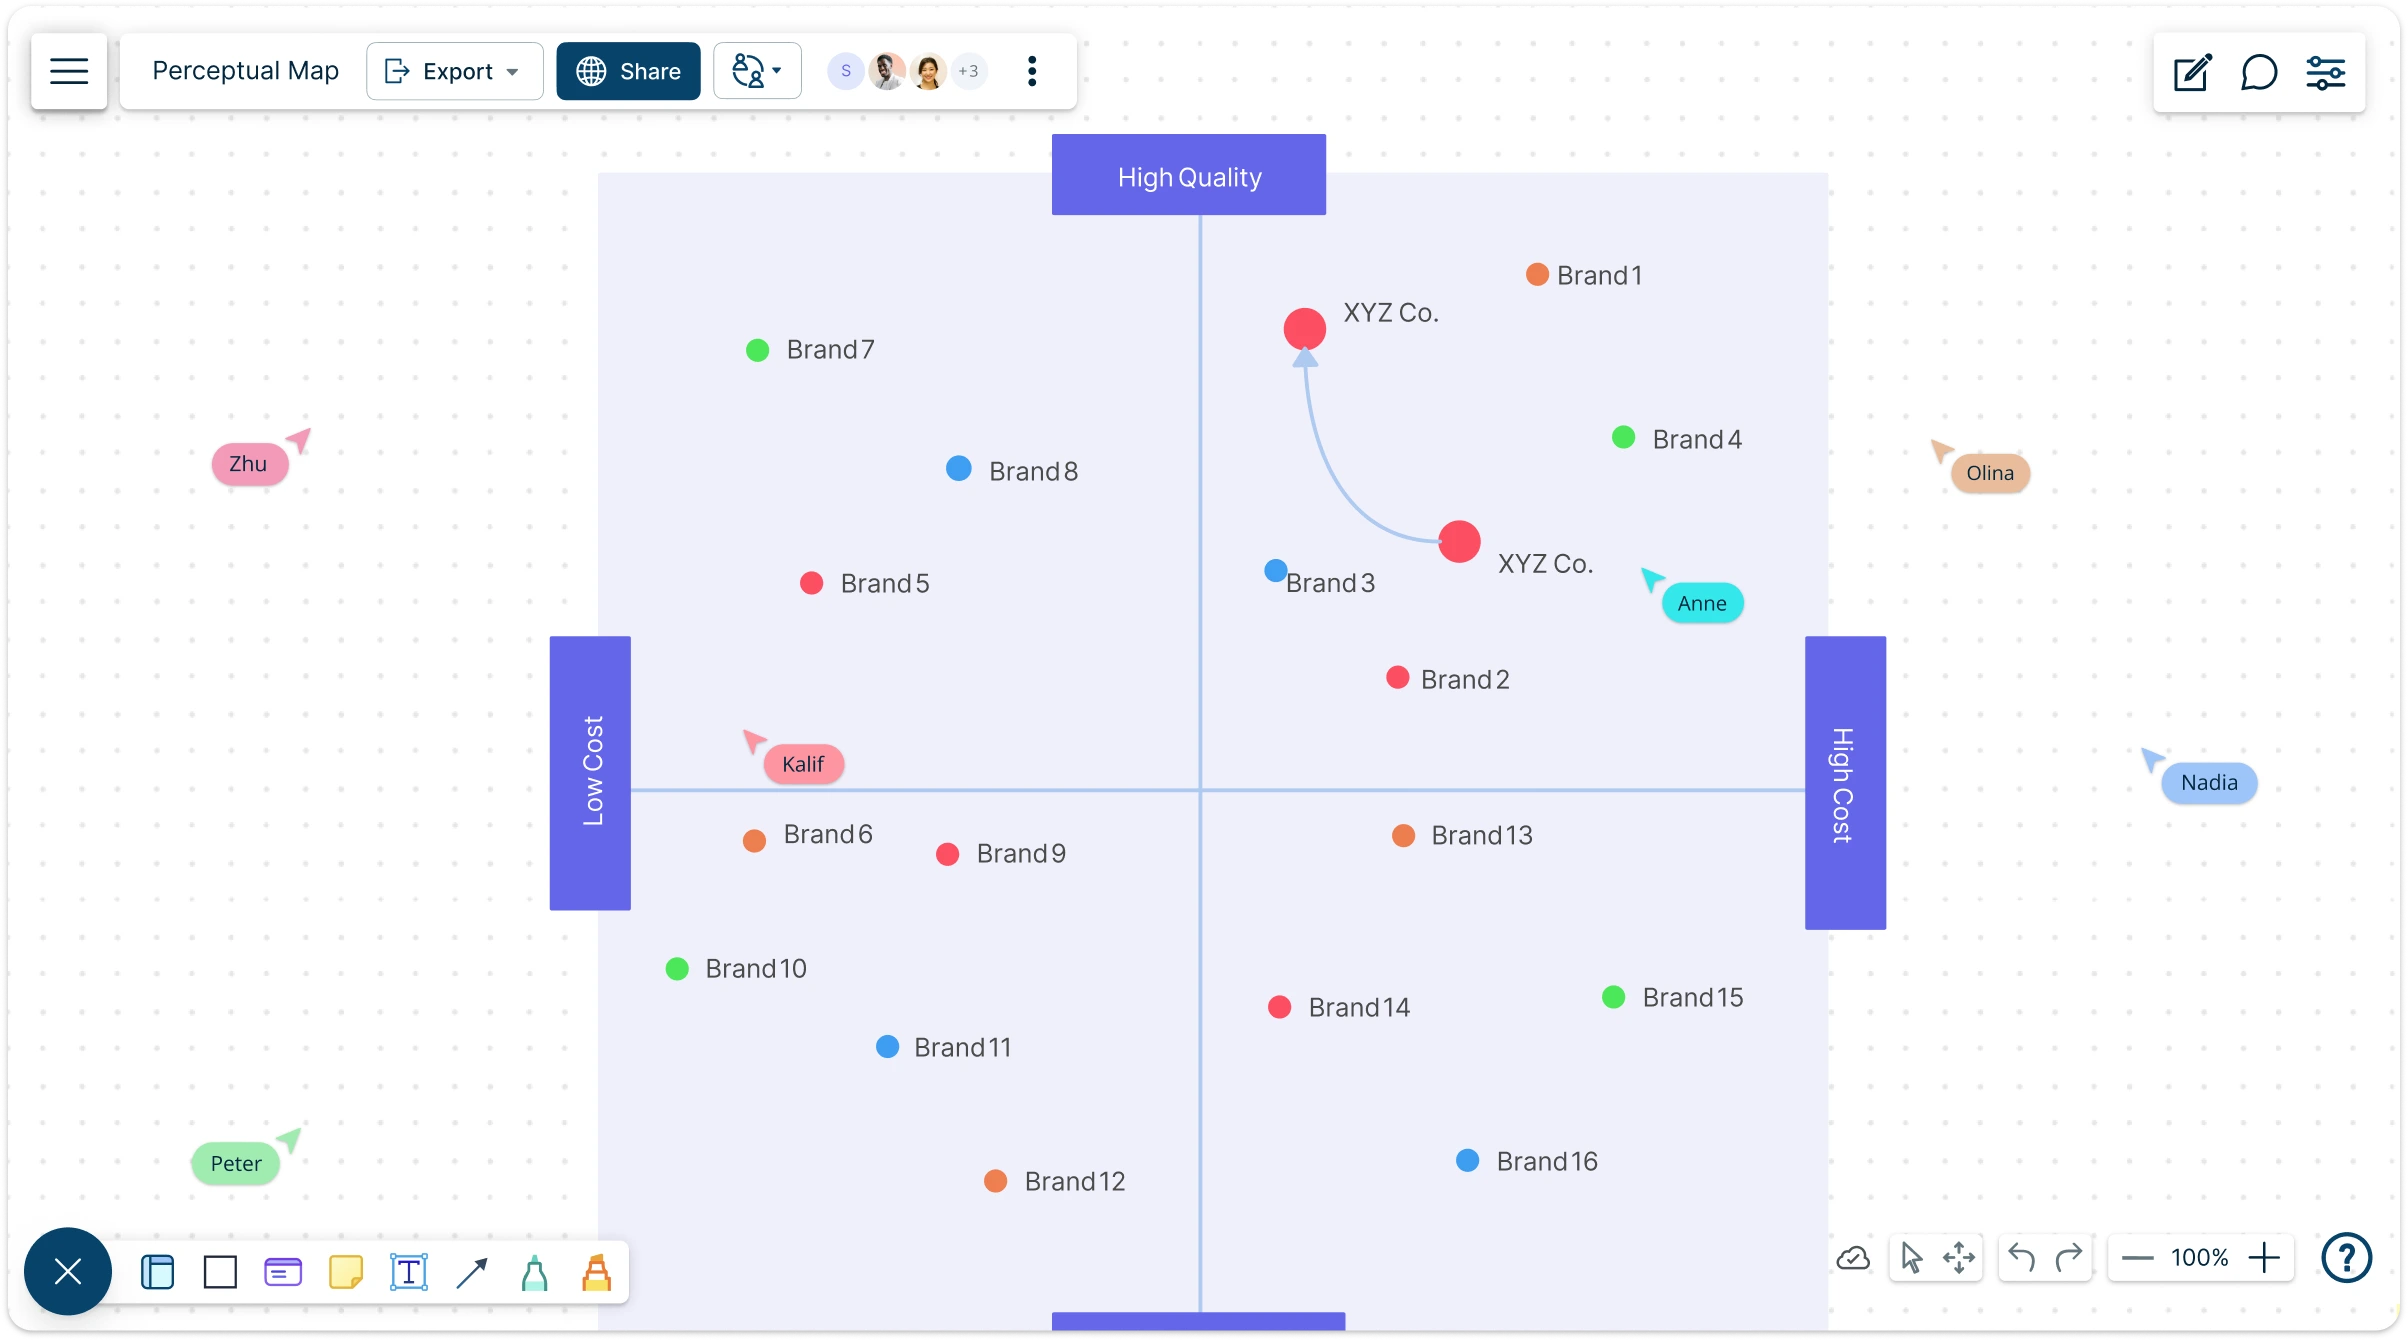
Online perceptual map tool built for marketers, product managers and brand strategists to help understand consumer perceptions and competitor positions at a glance and develop innovative strategies to compete better. Invite colleagues for discussions and brainstorming sessions to bring in multiple perspectives and determine optimal strategies.
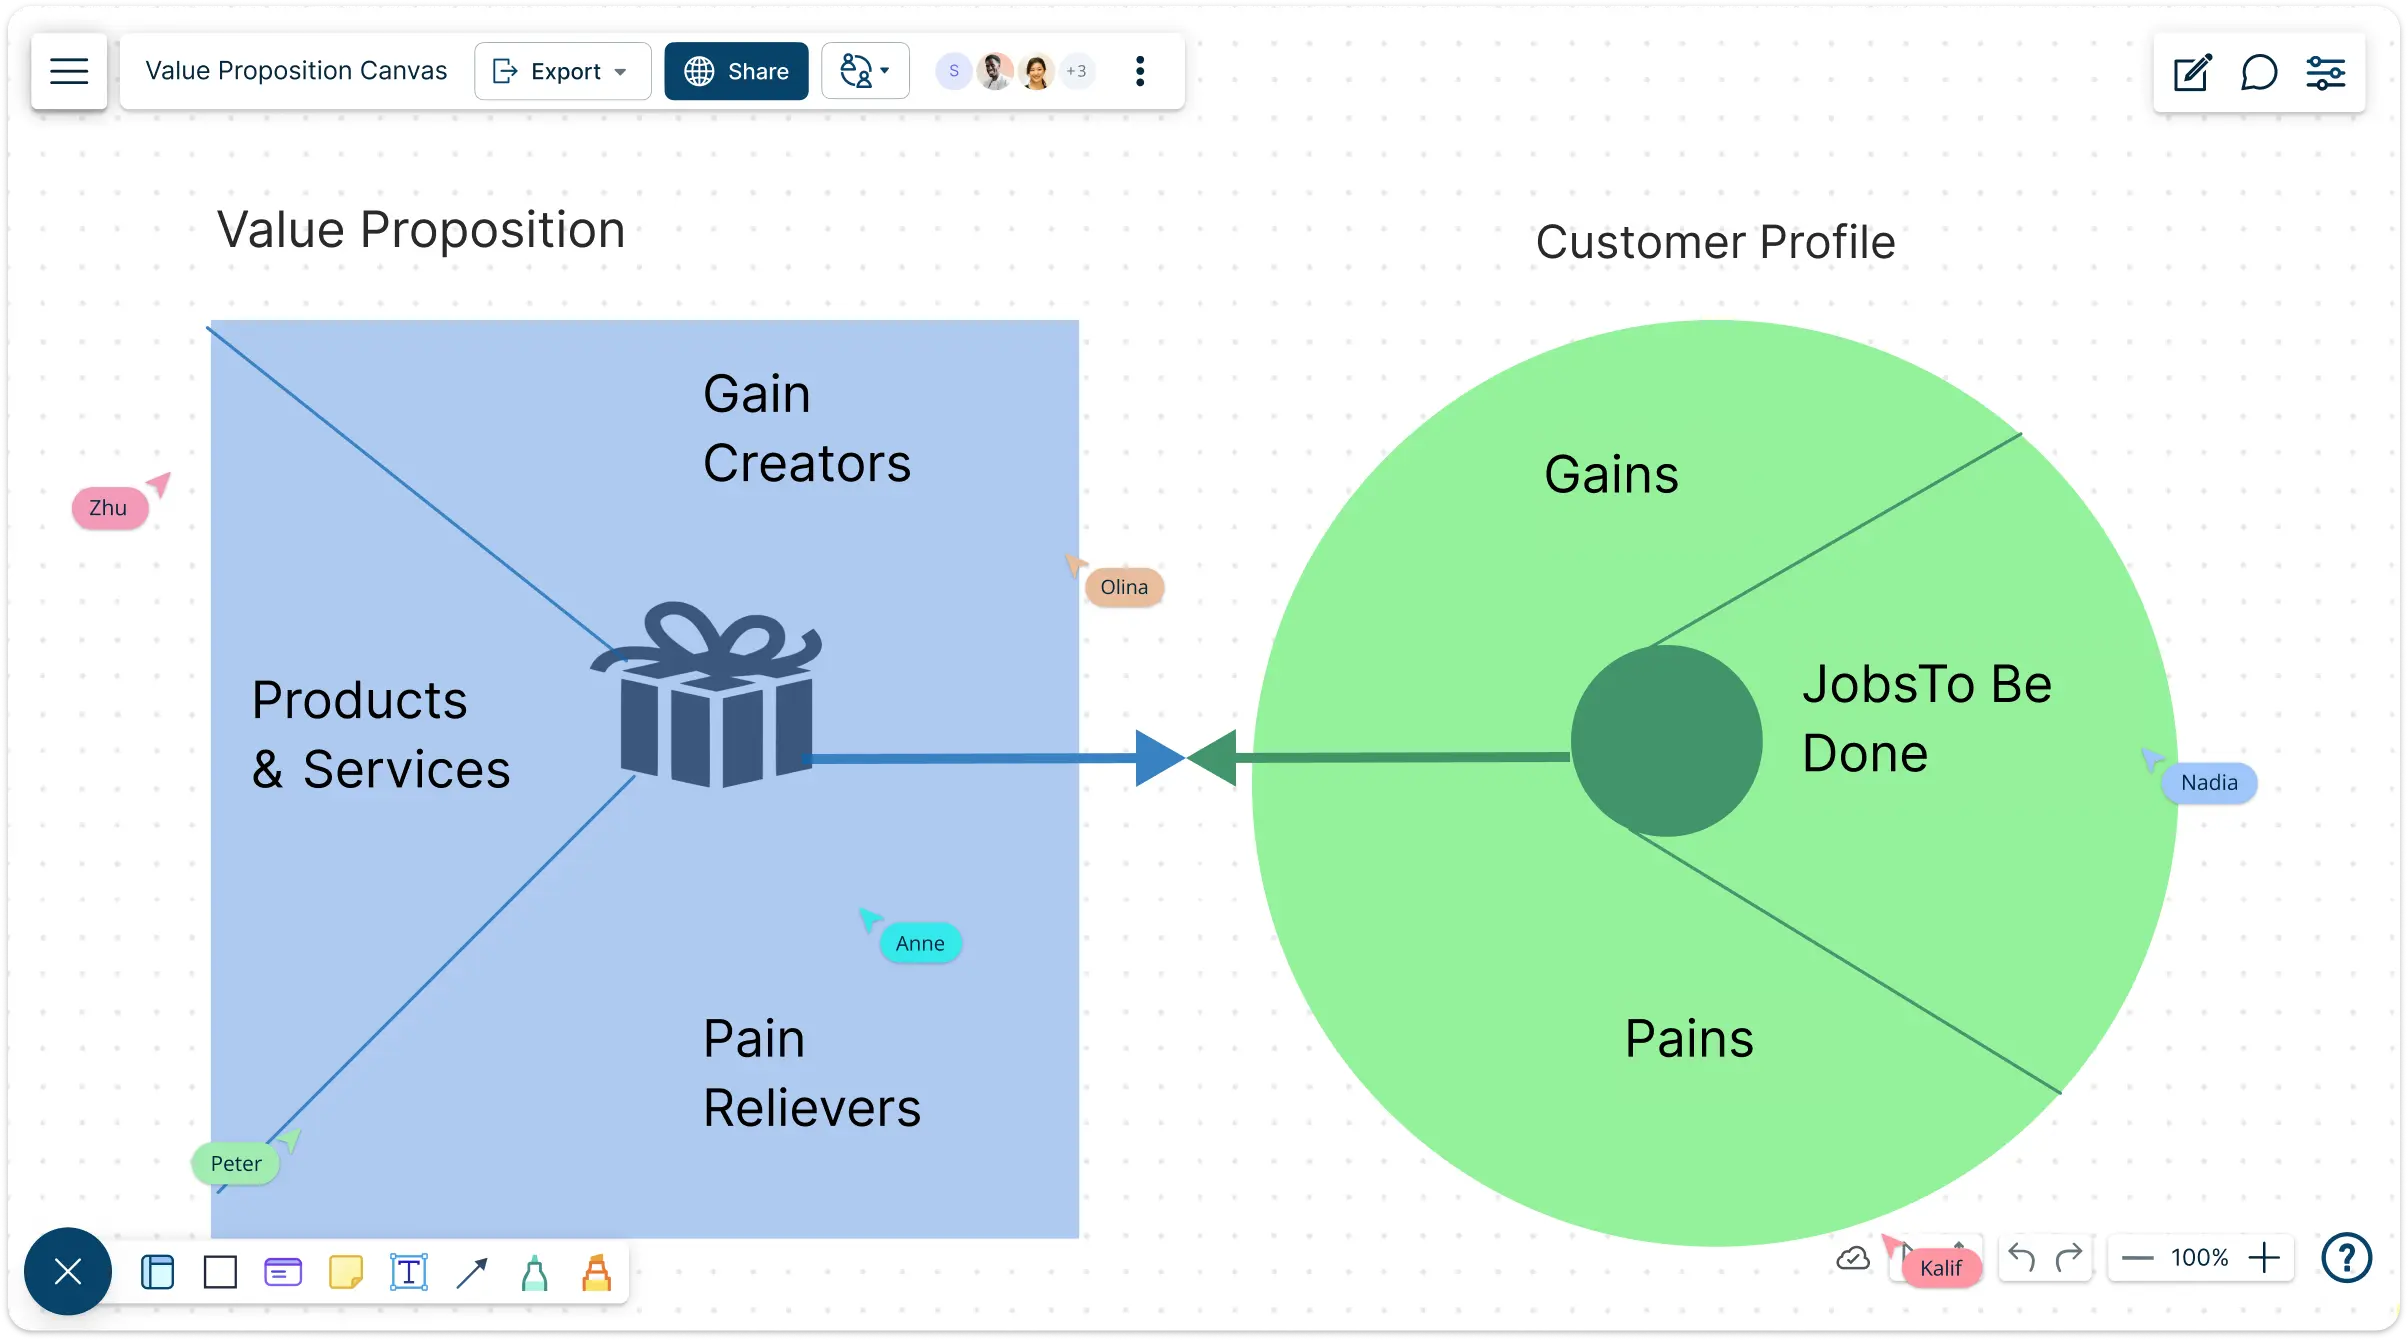
Map your customer needs and business offerings side by side. Explore how your products create real value through clear visualization and actionable insights; validate and refine your business strategy quickly.
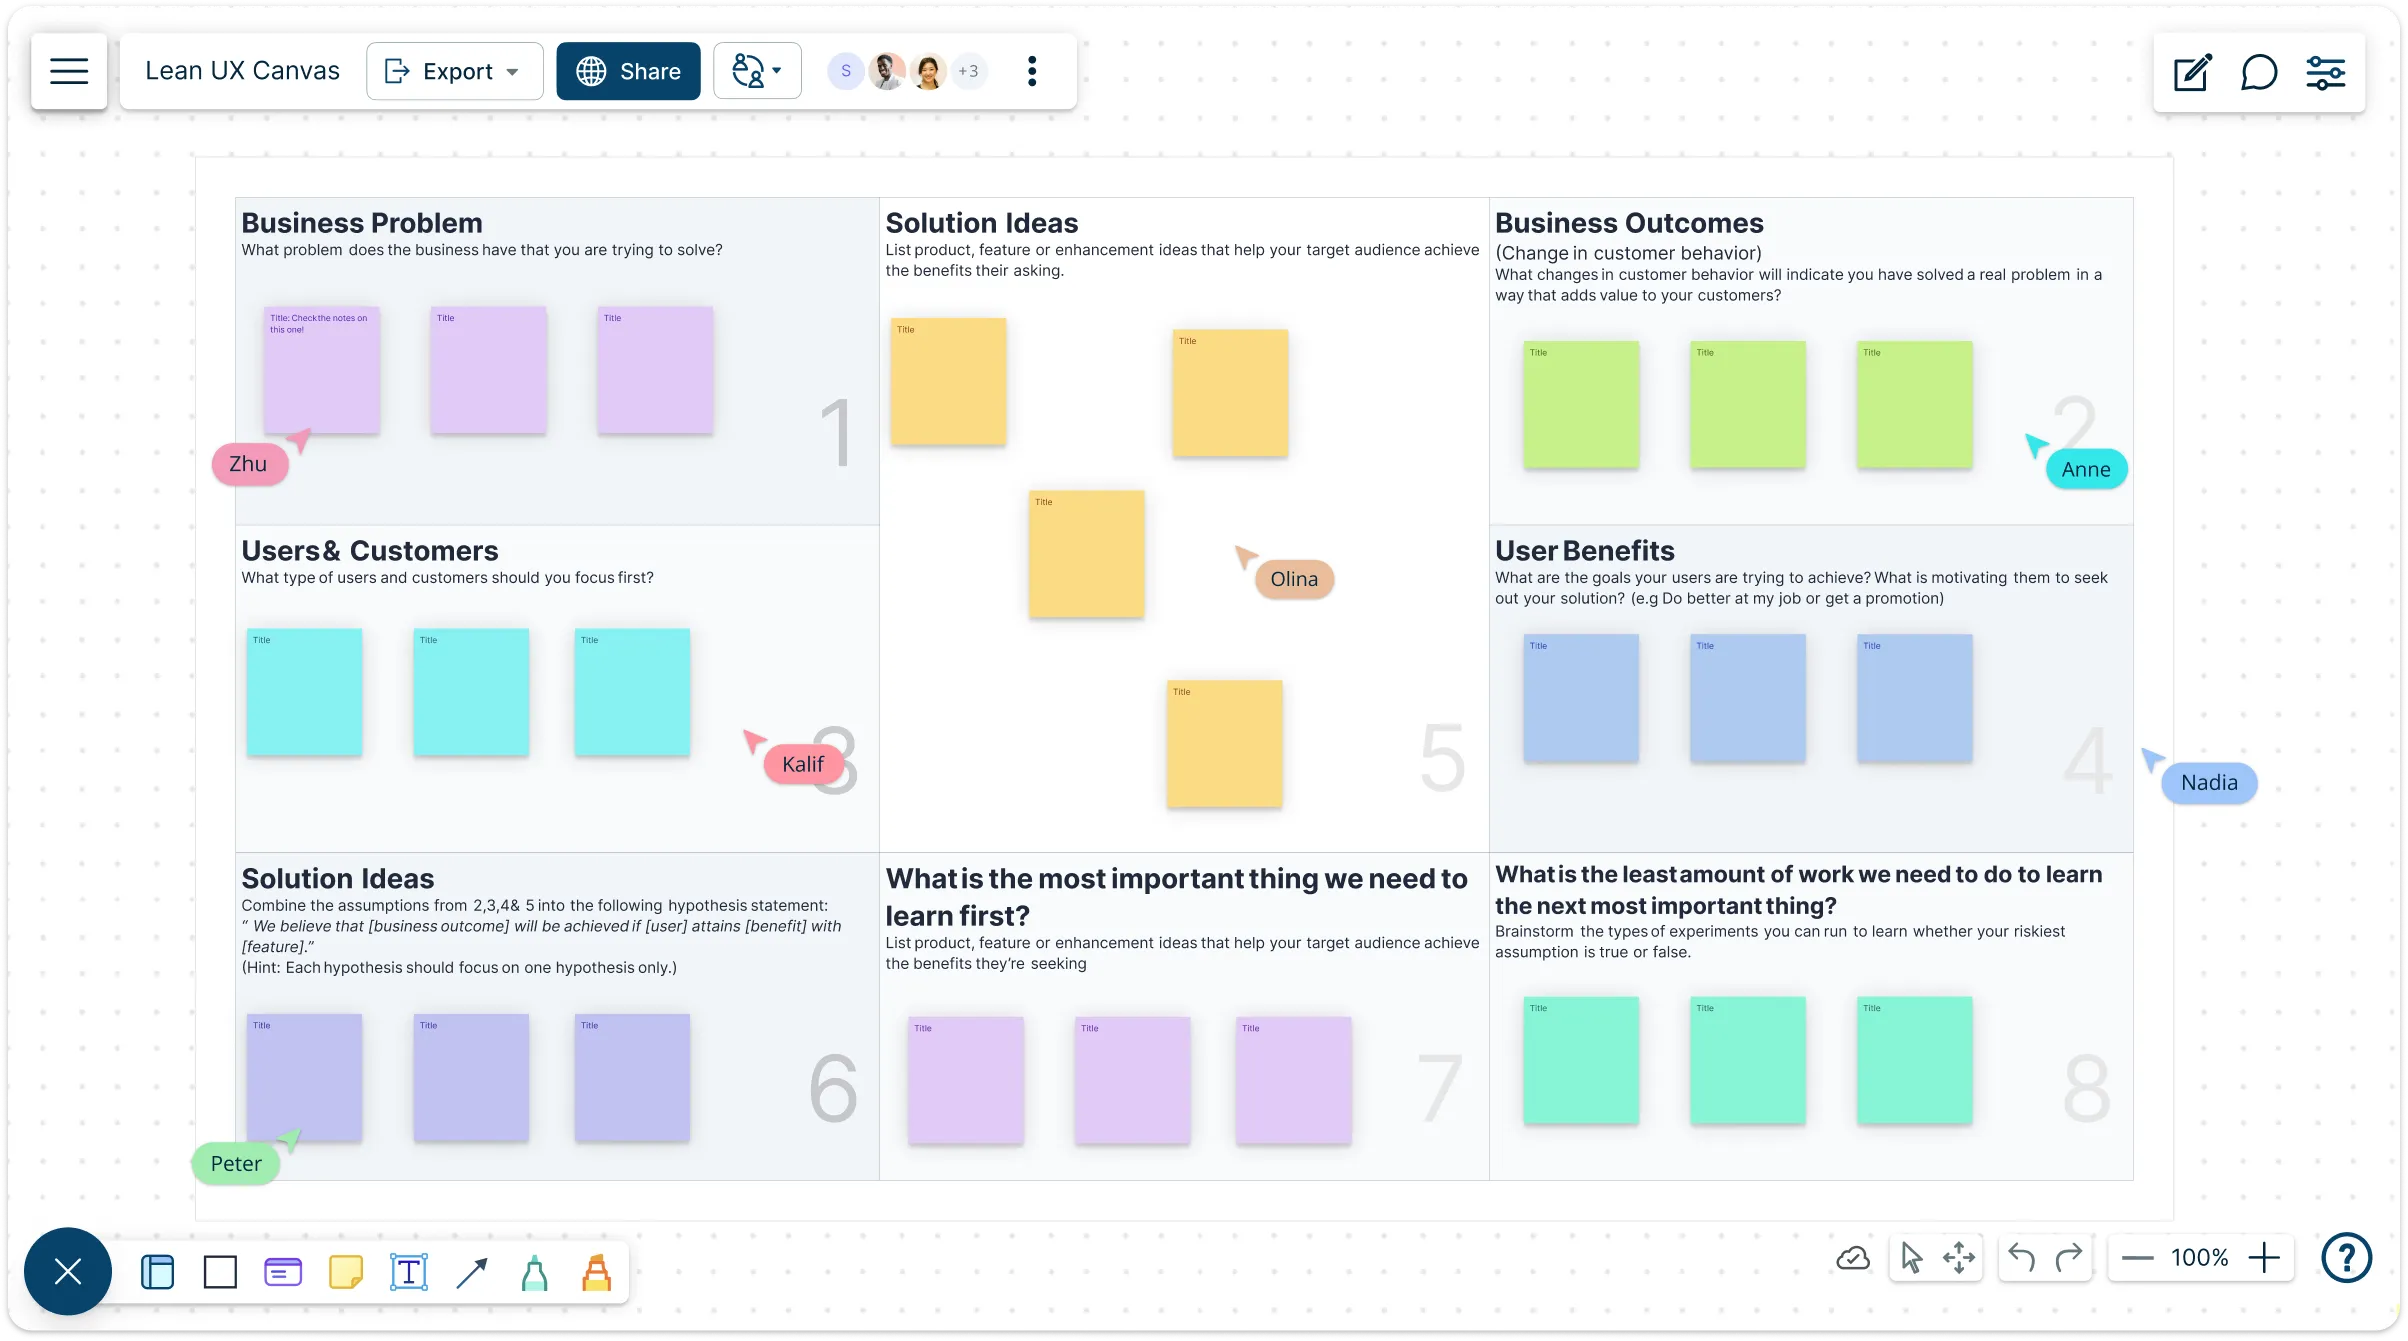
Build products that hit the mark. Use the Lean UX Canvas template to help teams align on real customer problems, validate ideas before coding, and turn insights into proven solutions—reducing wasted effort and accelerating product success.
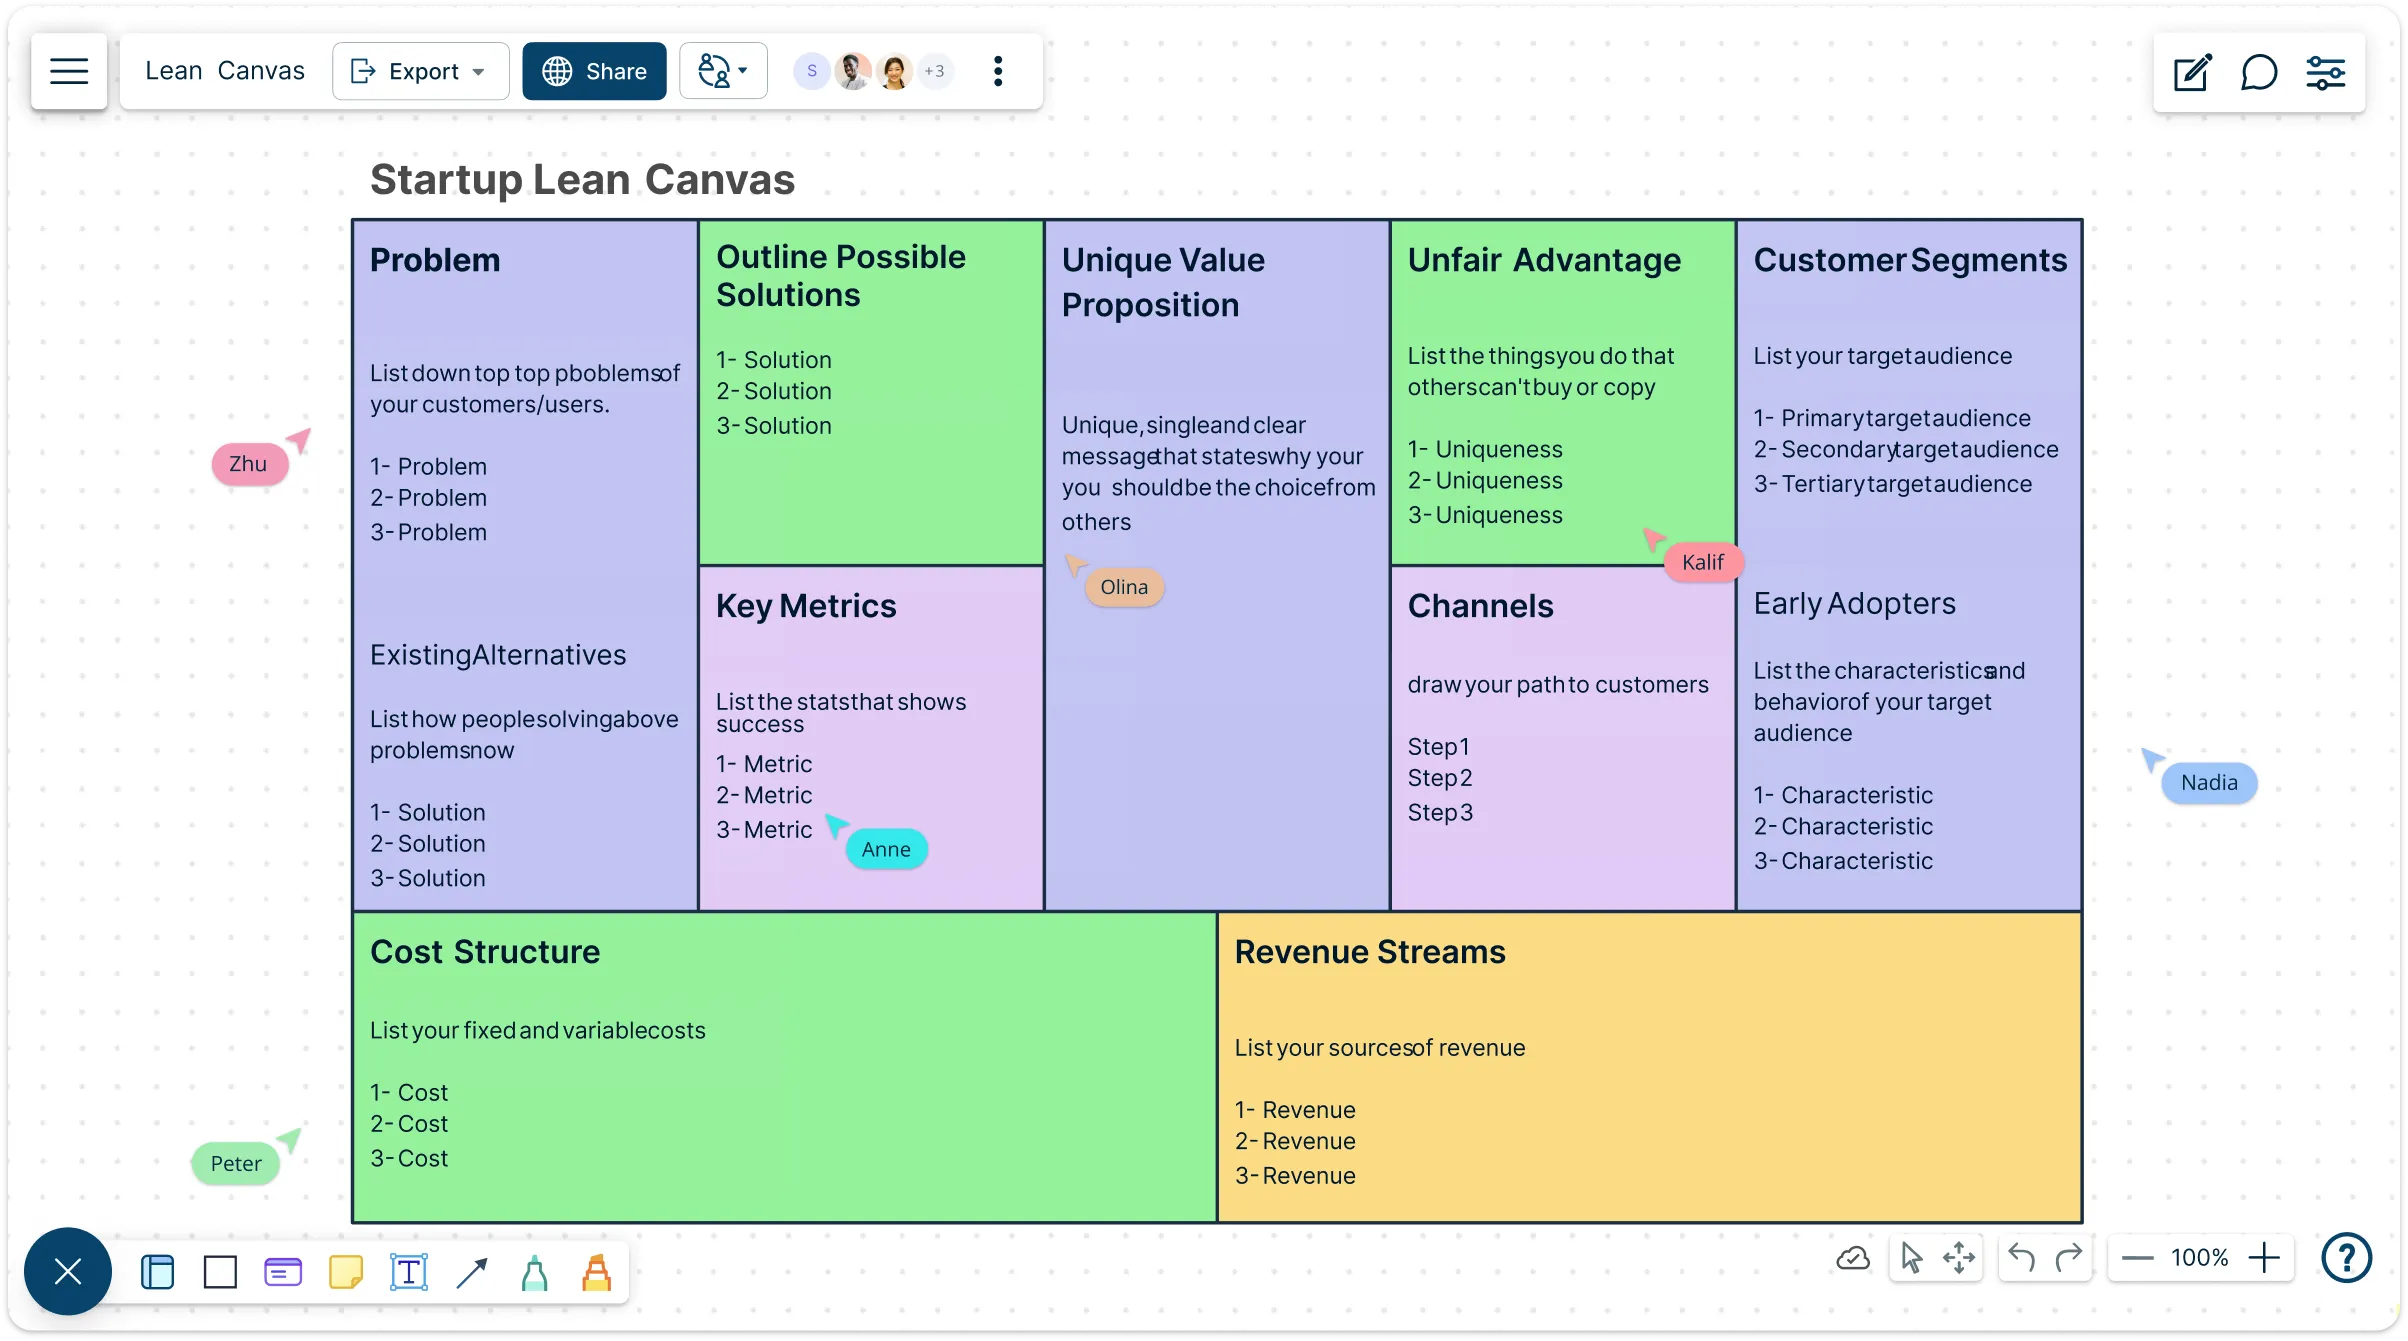
Plan, test, and refine your business model visually. With Creately’s Lean Canvas Template, your team can brainstorm ideas, validate assumptions, and turn them into actionable plans — all in one connected workspace.
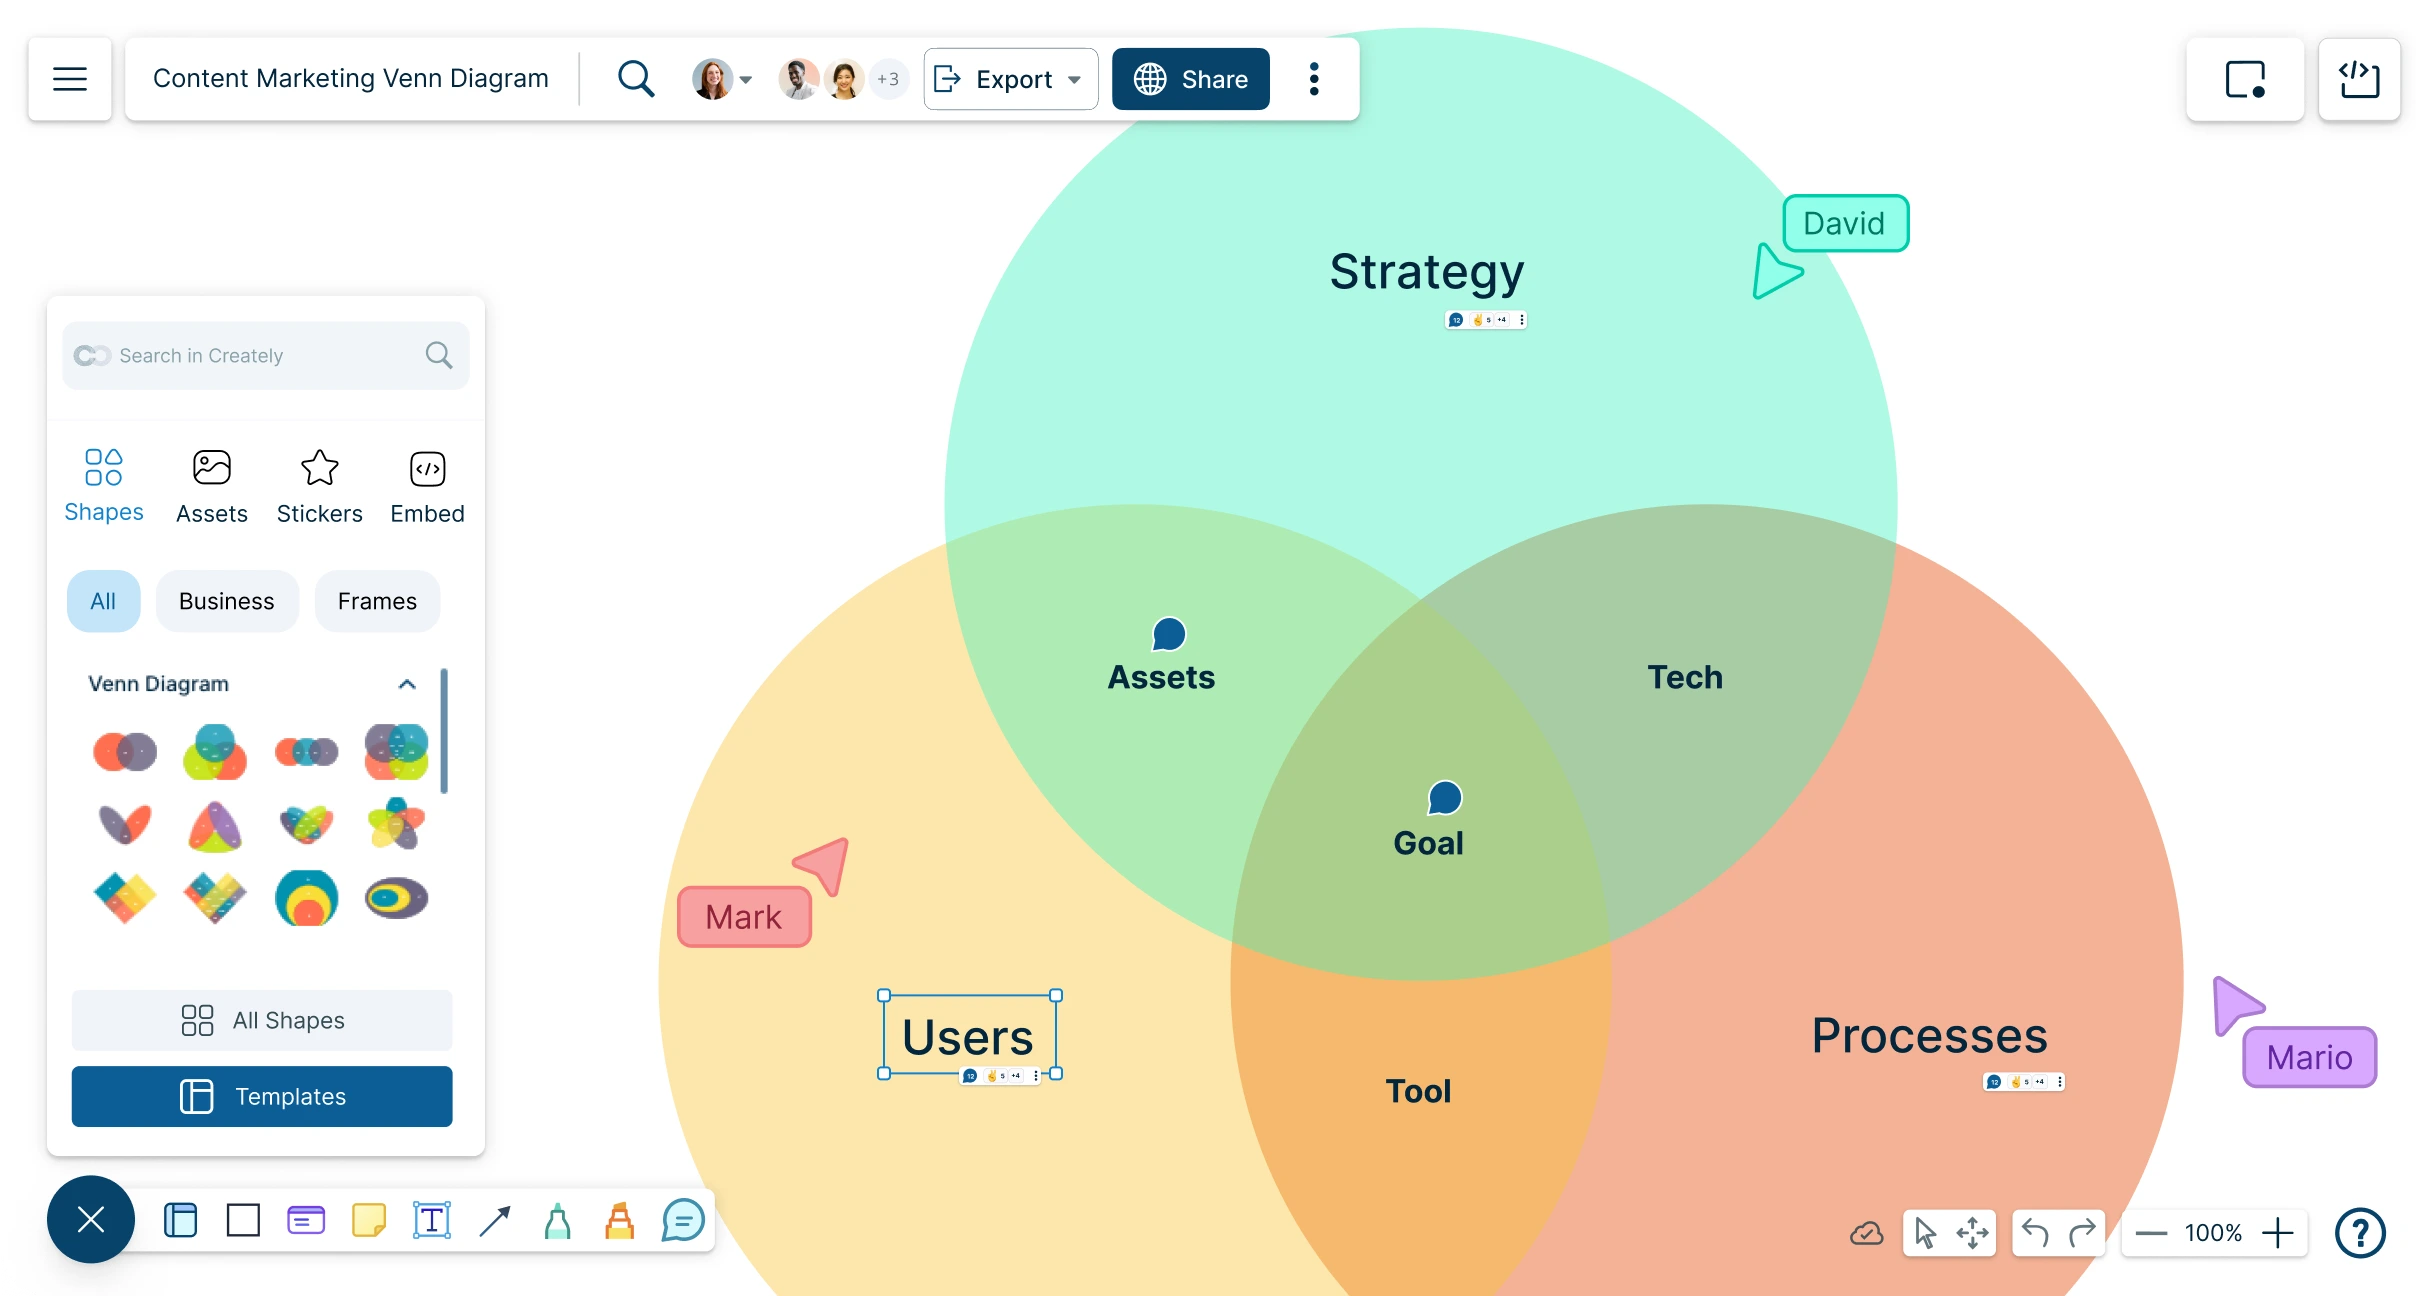
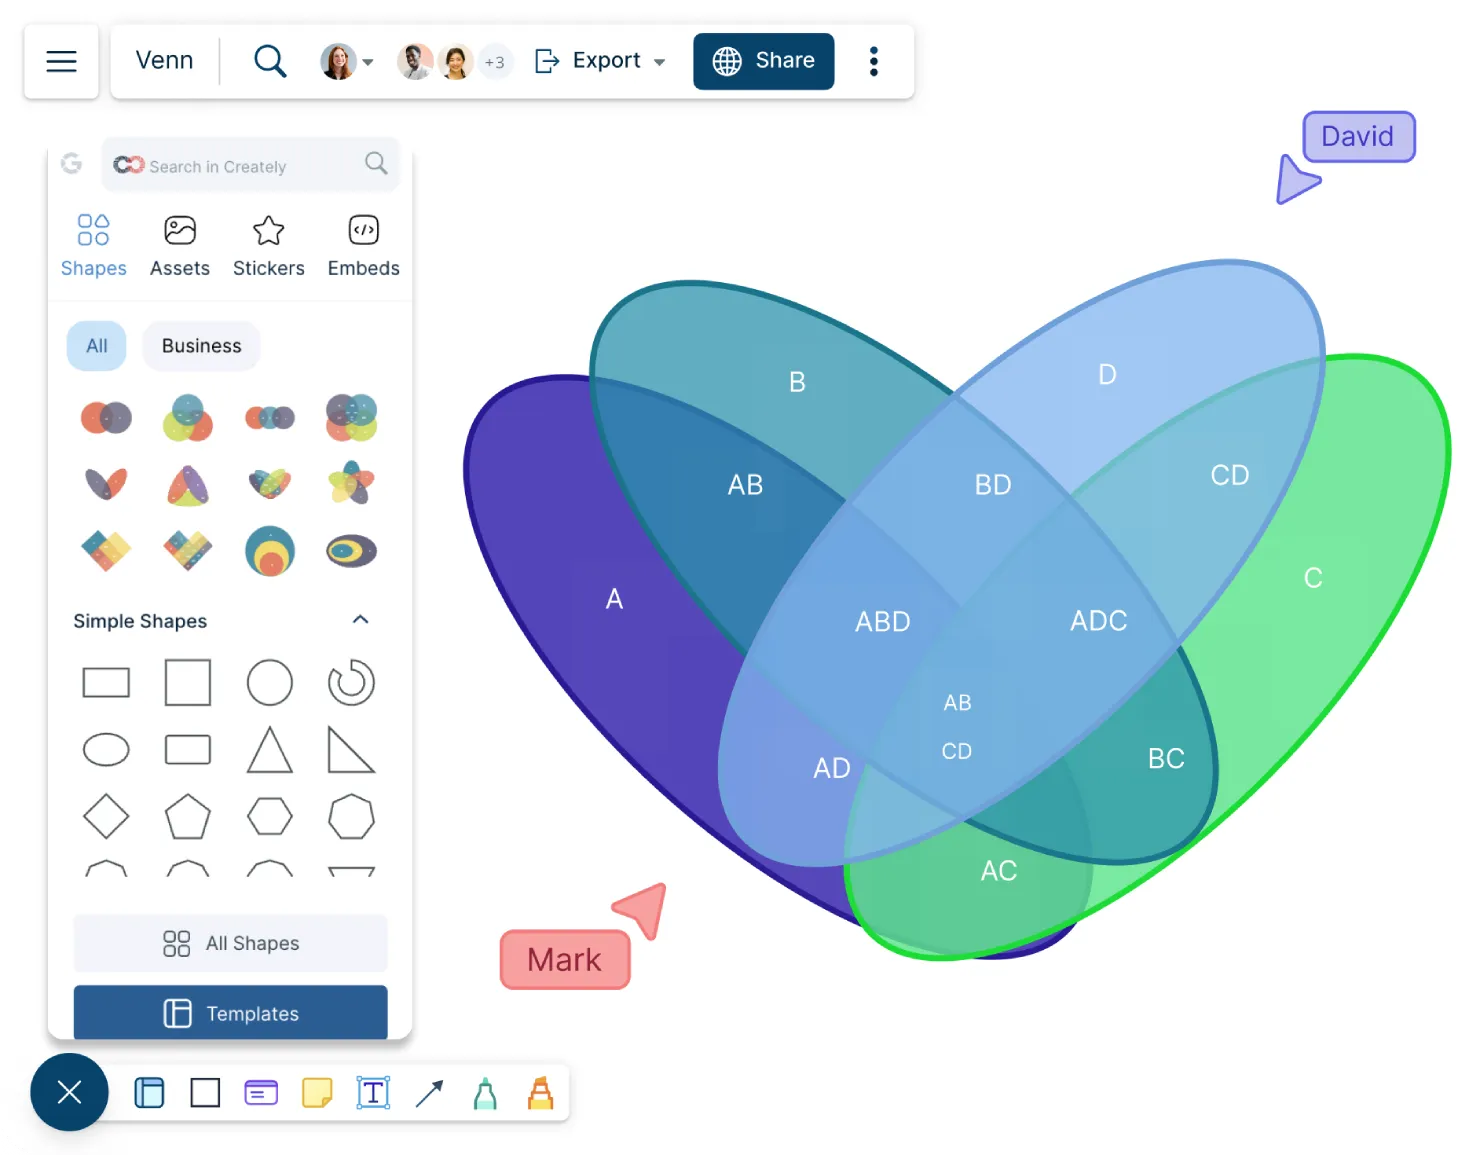
Better understand and represent data with our free Venn diagram tool. Visually represent information with our shape library and simple drag-and-drop tools.
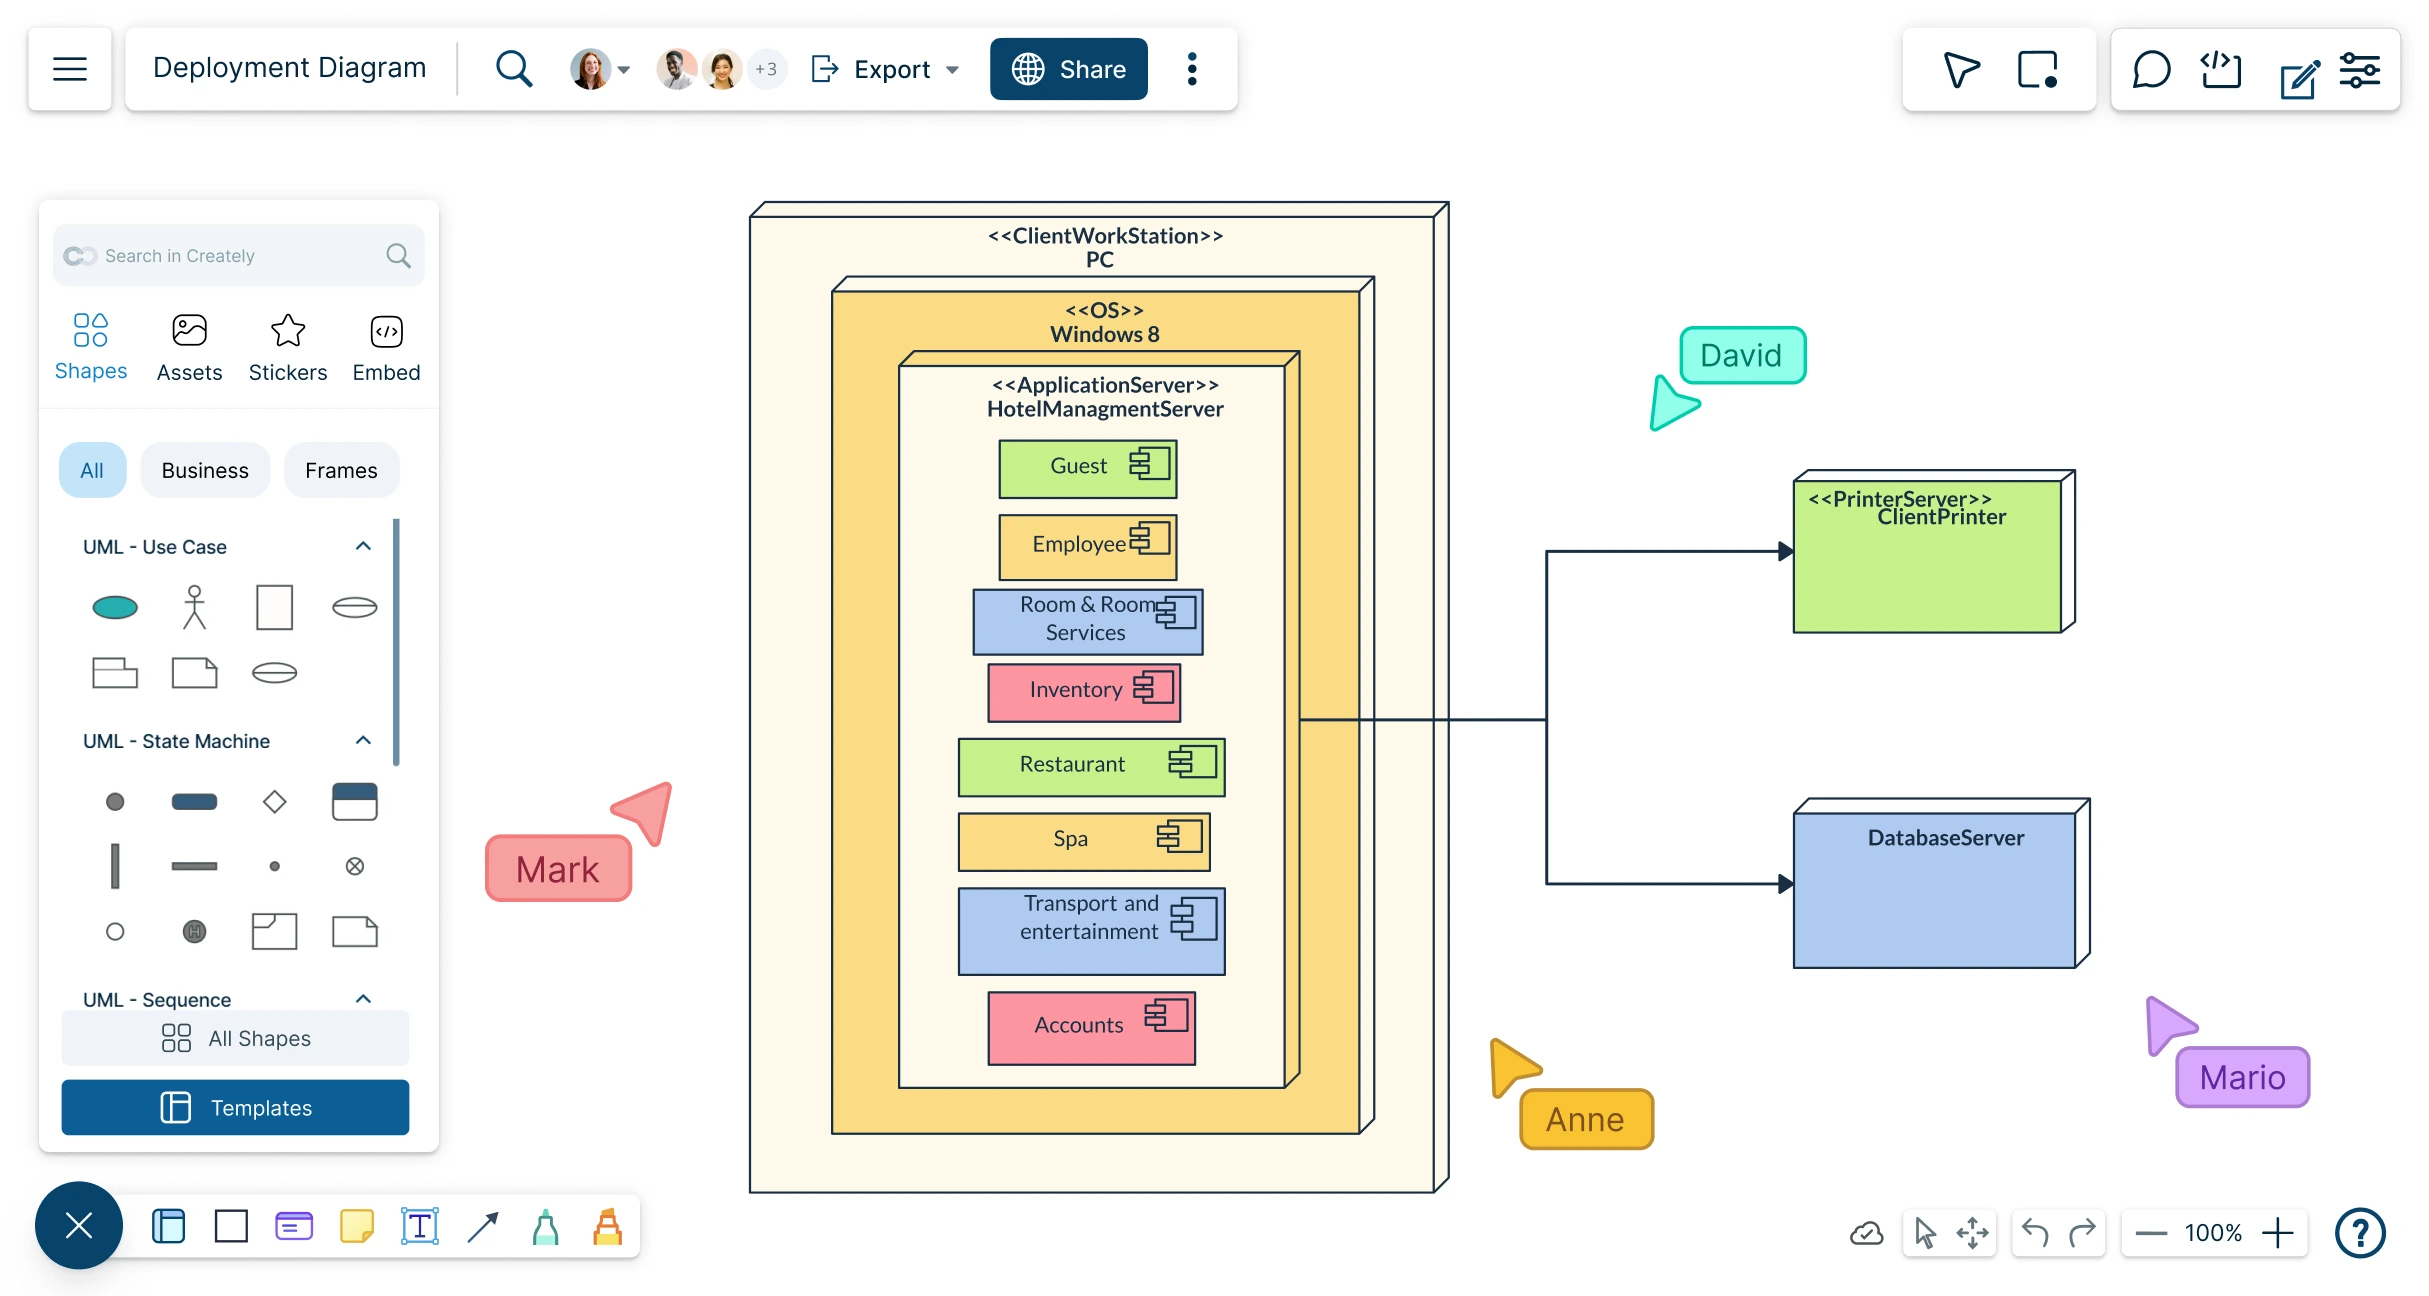
Quickly design and share deployment diagrams online to map hardware topologies, dependencies, and system architecture. Use Creately’s UML deployment diagram software as a collaborative Deployment Diagram Maker for accurate modeling.
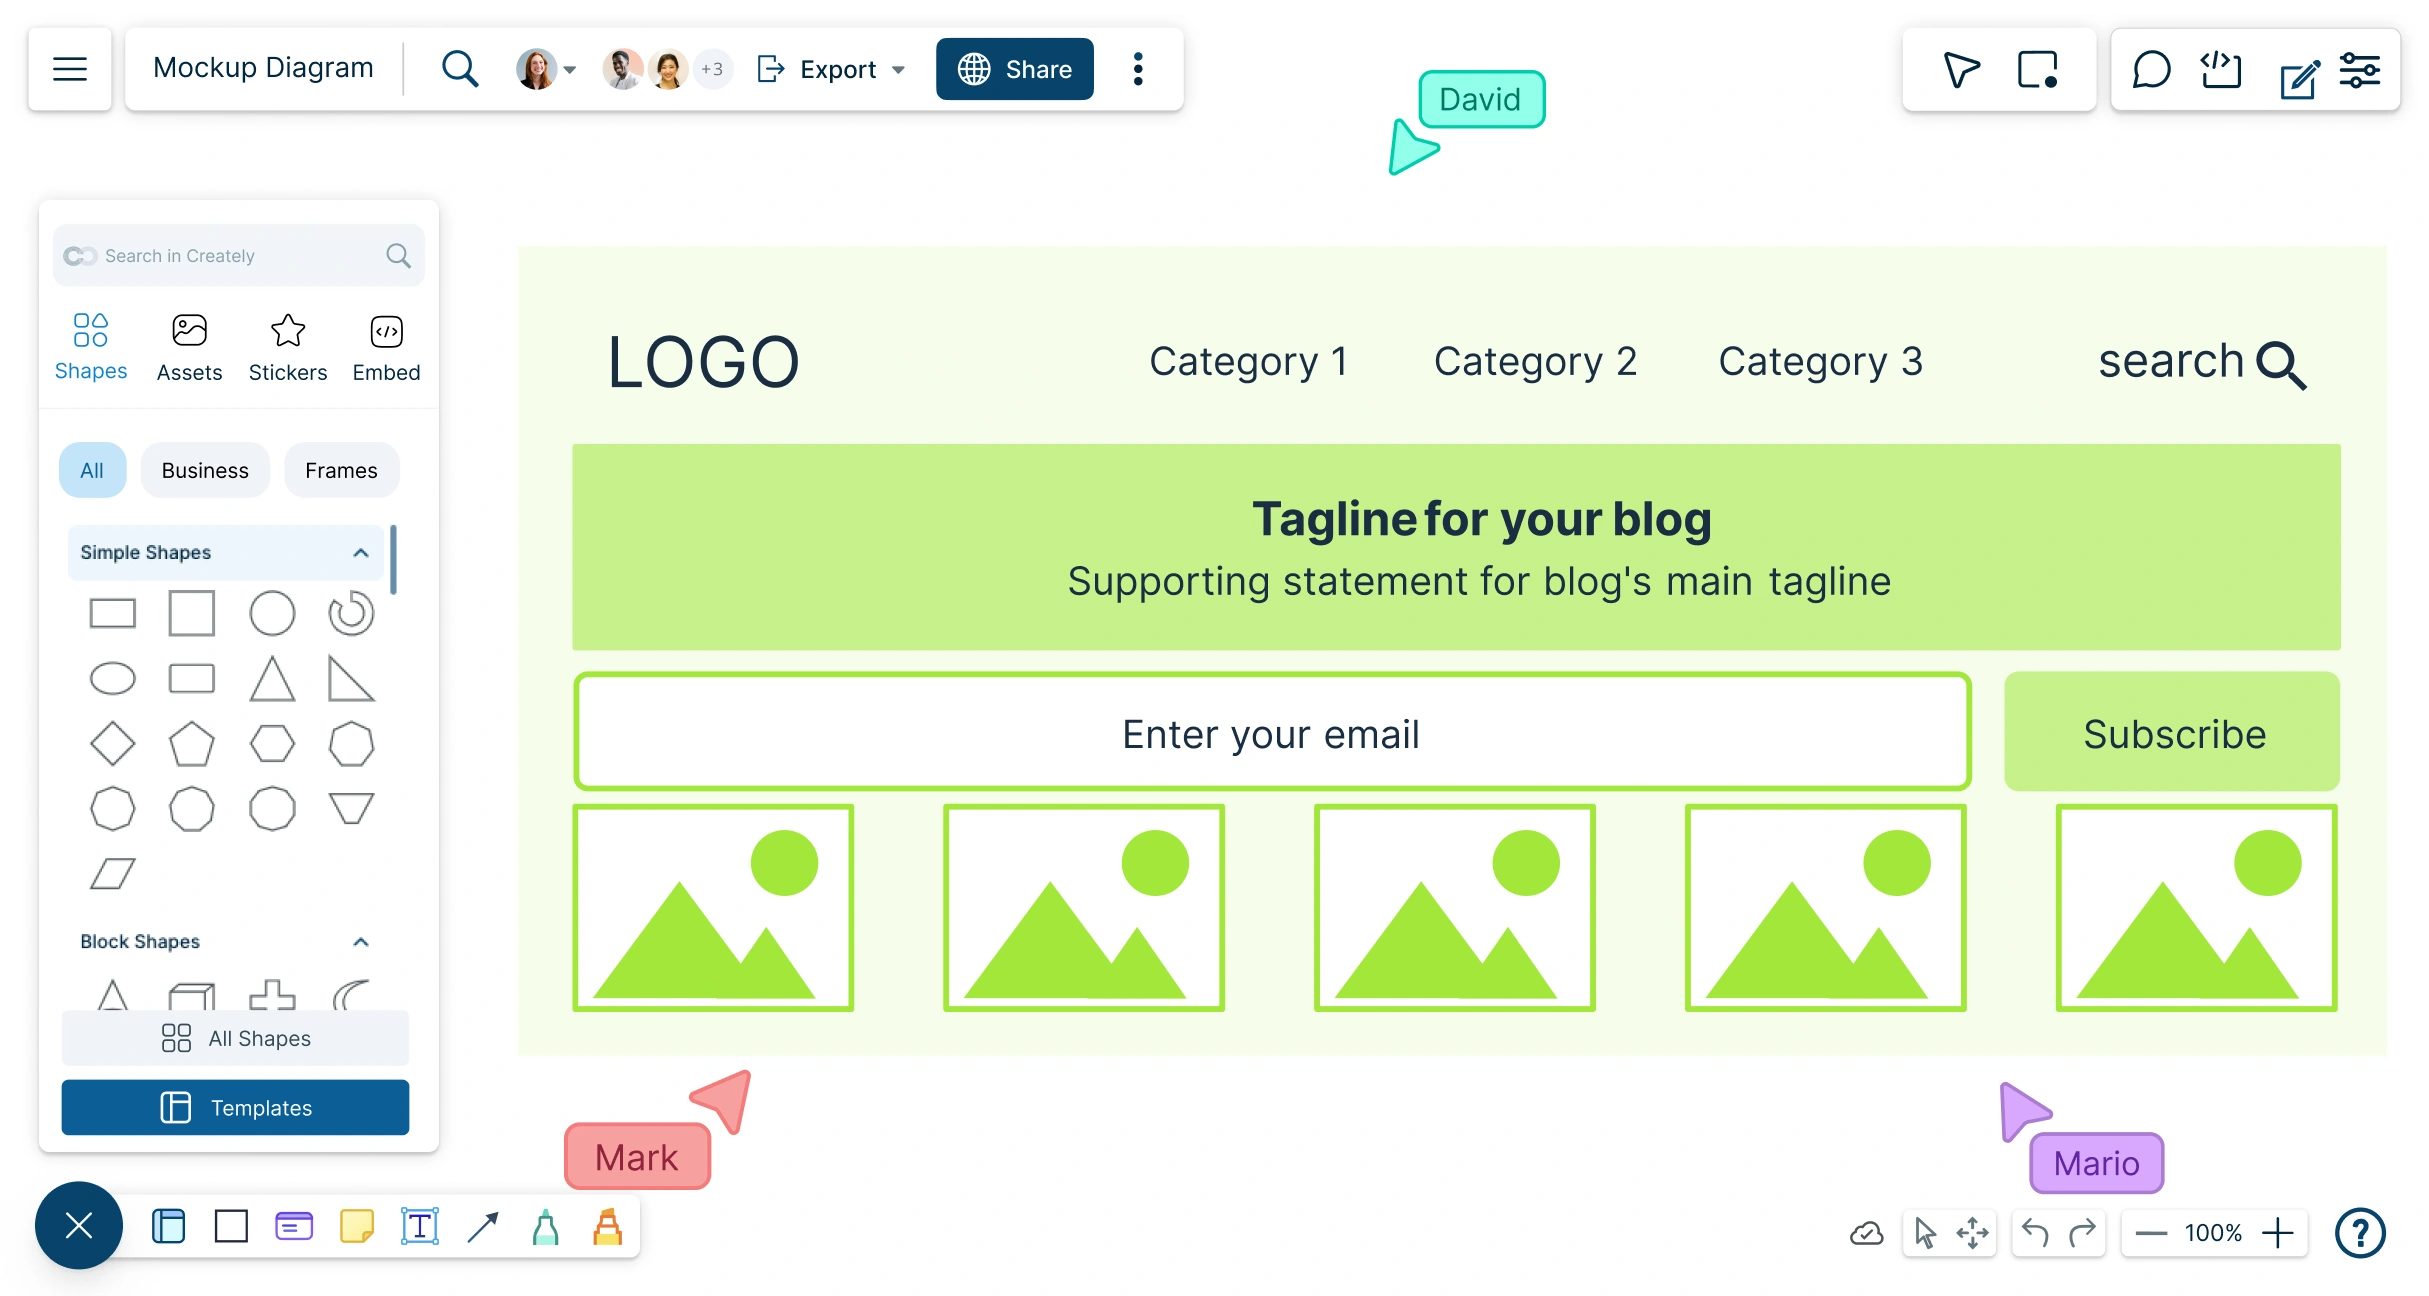
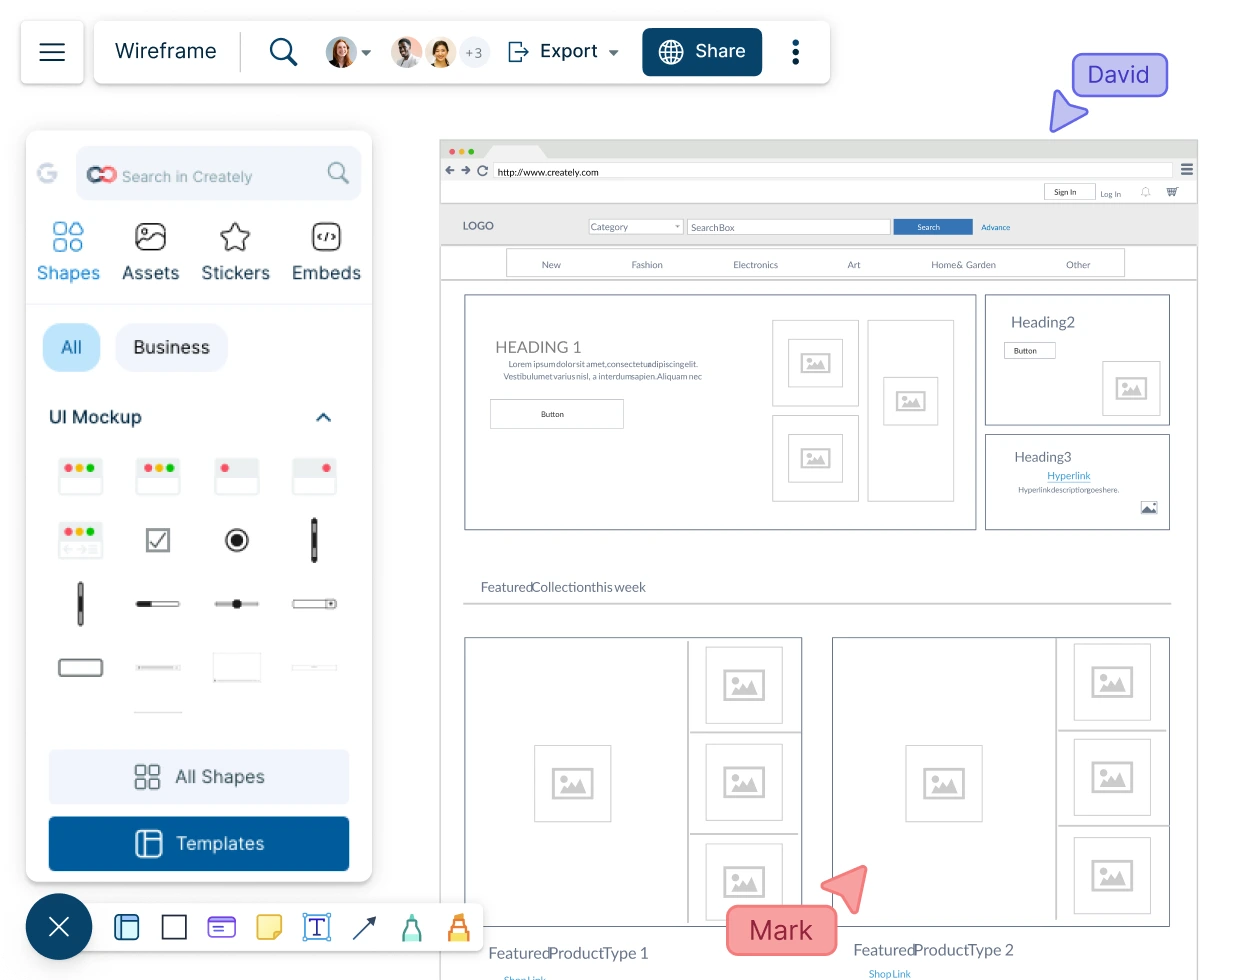
Create high-quality designs and user flows in real time with Creately's versatile online mockup generator. Quickly convert images into realistic visuals and design professional layouts effortlessly.
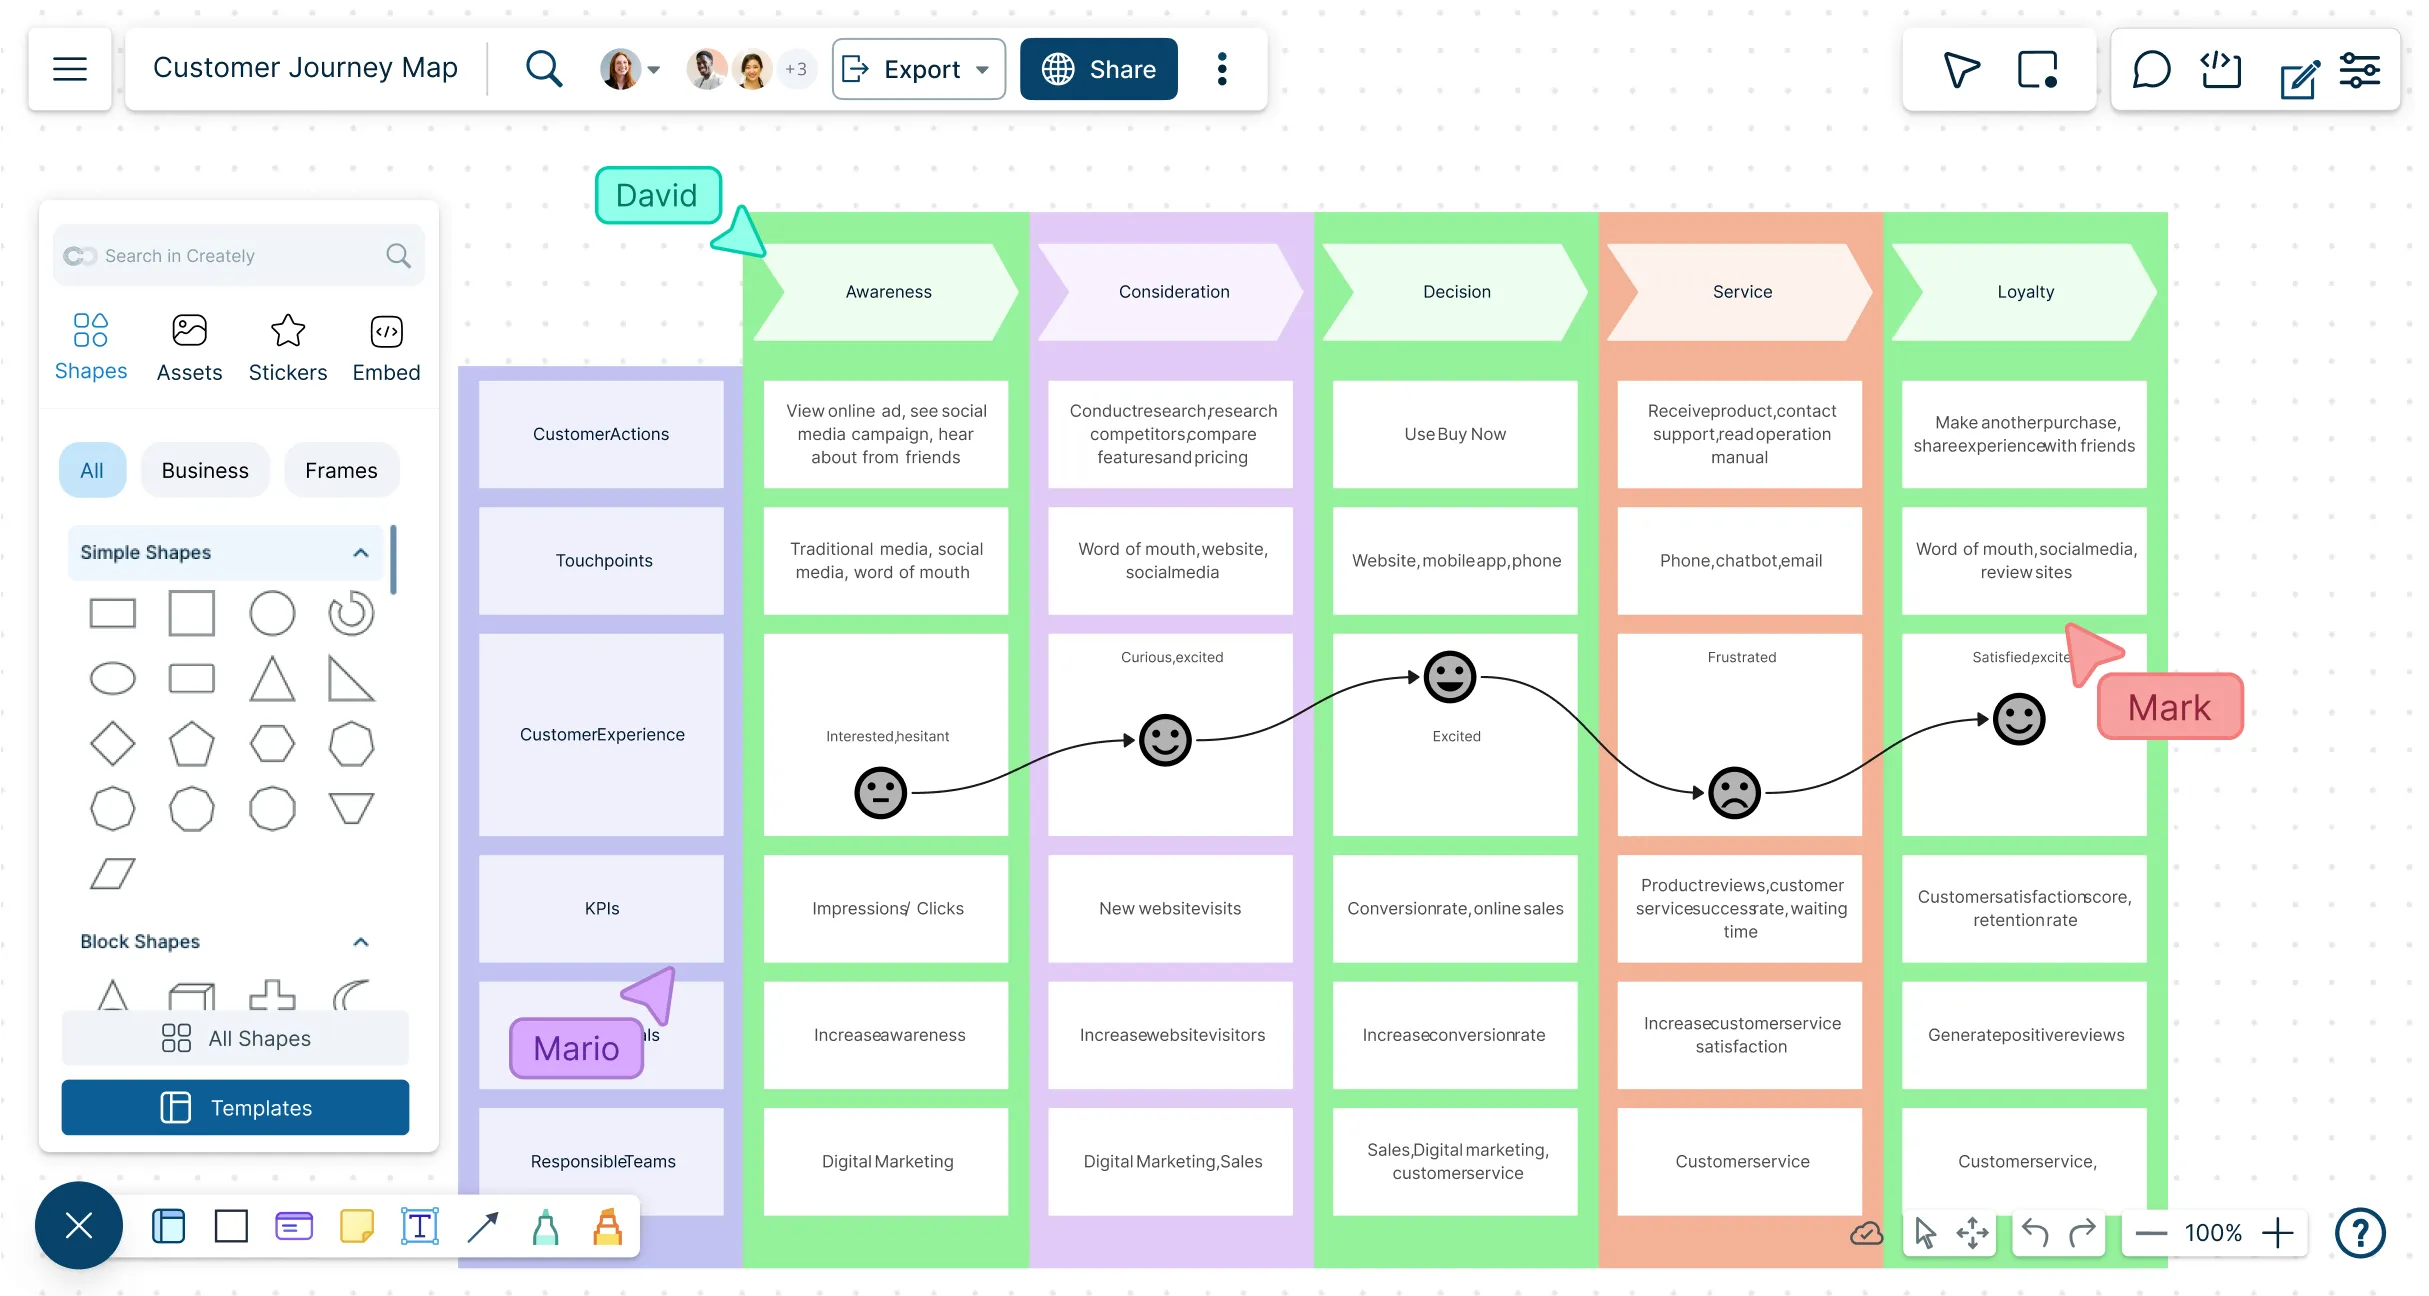
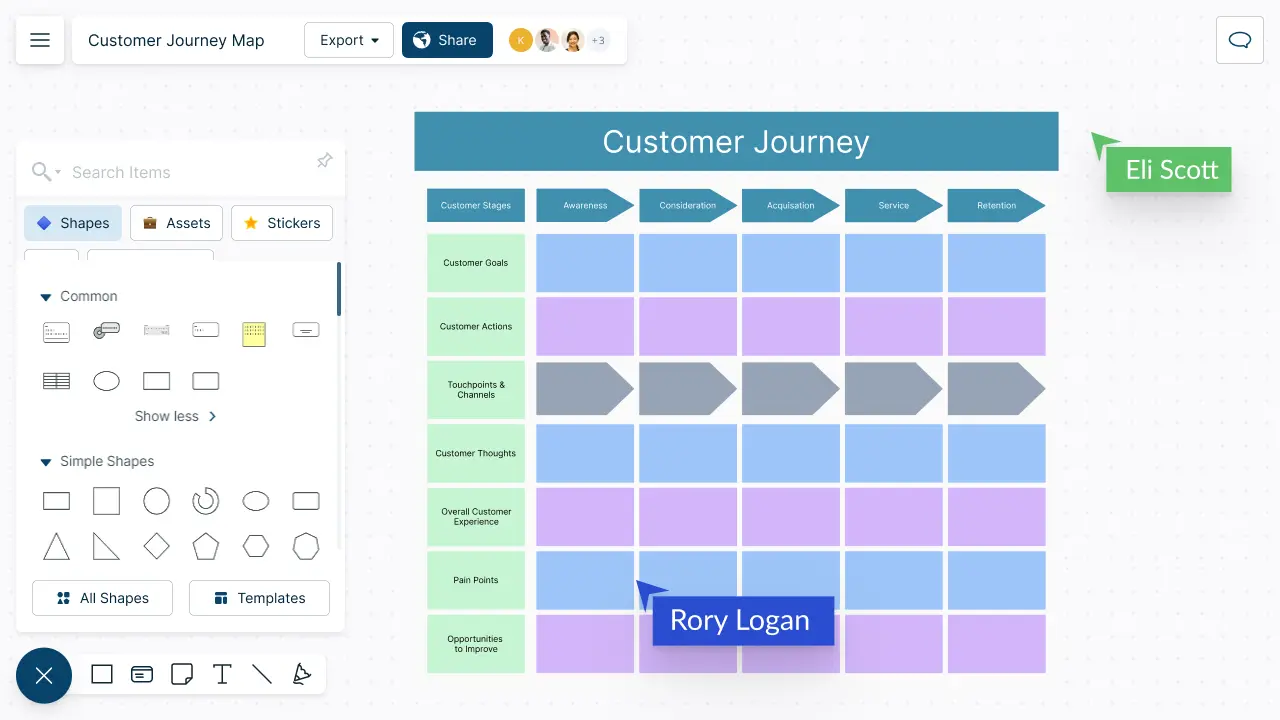
Understand your customers’ interactions, identify pain points, and turn insights into actionable strategies—all with an intuitive, collaborative platform.
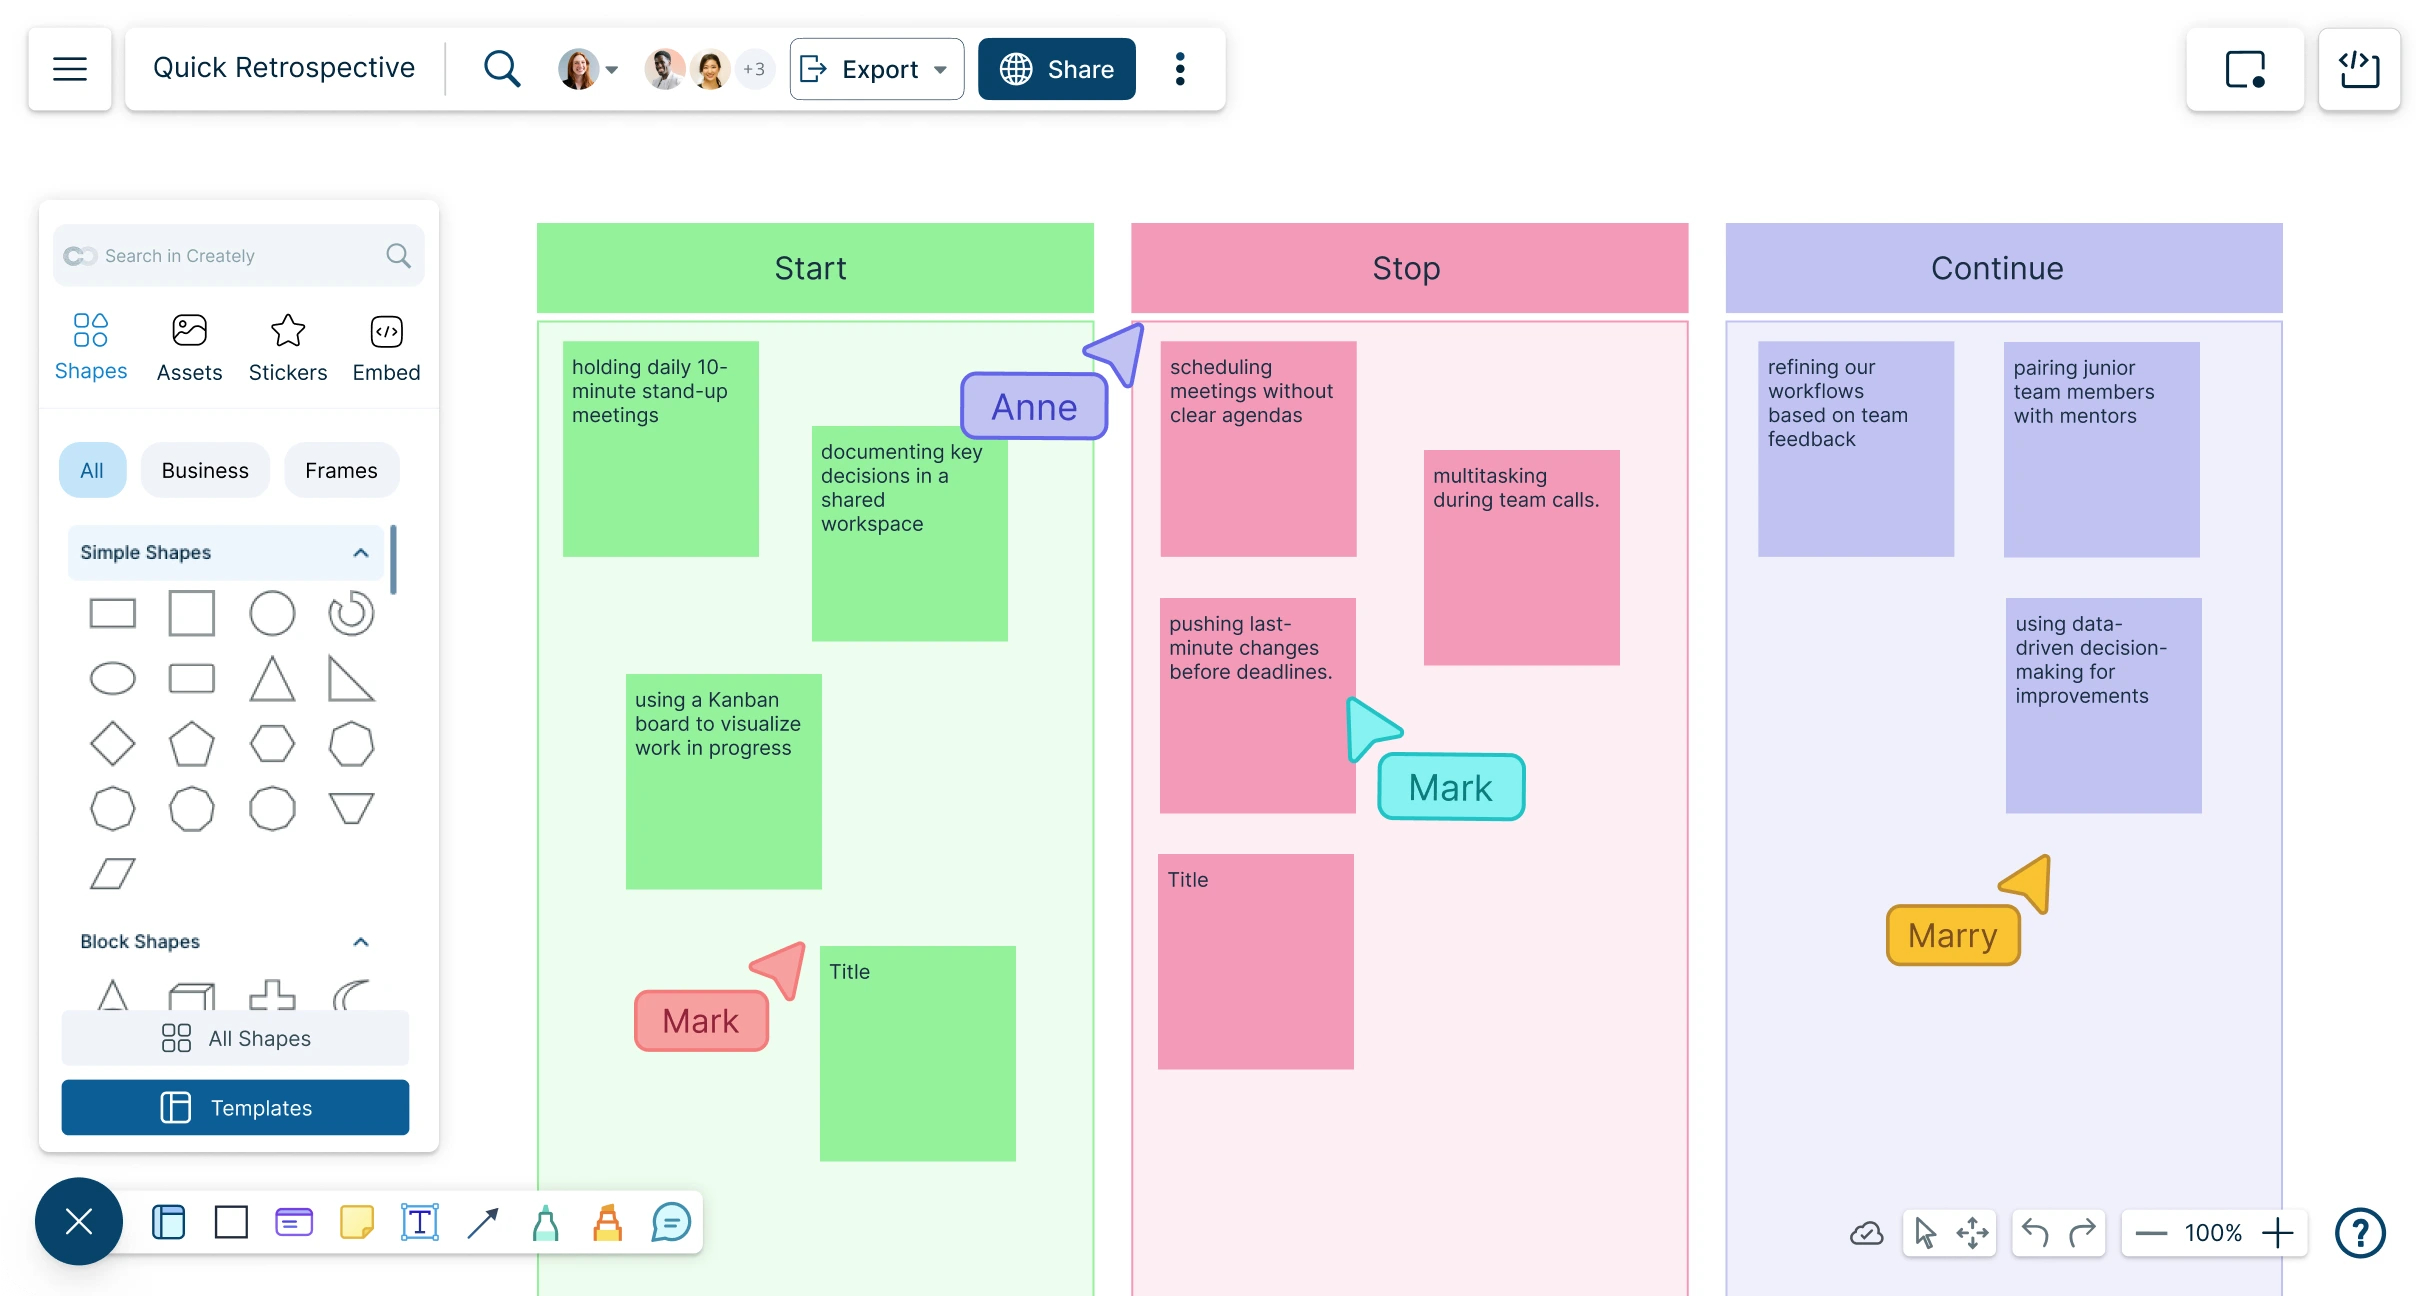
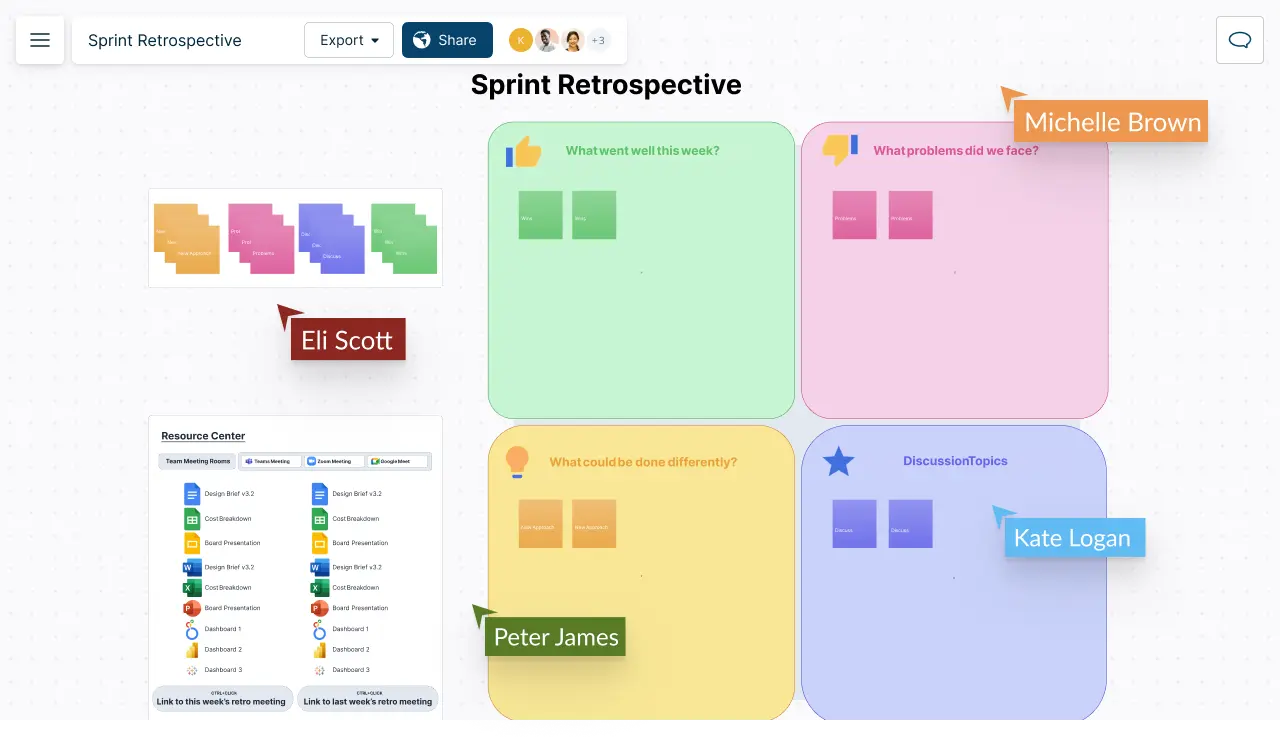
Make sprint retrospectives more collaborative and effective with Creately’s AI-powered retrospective generator.
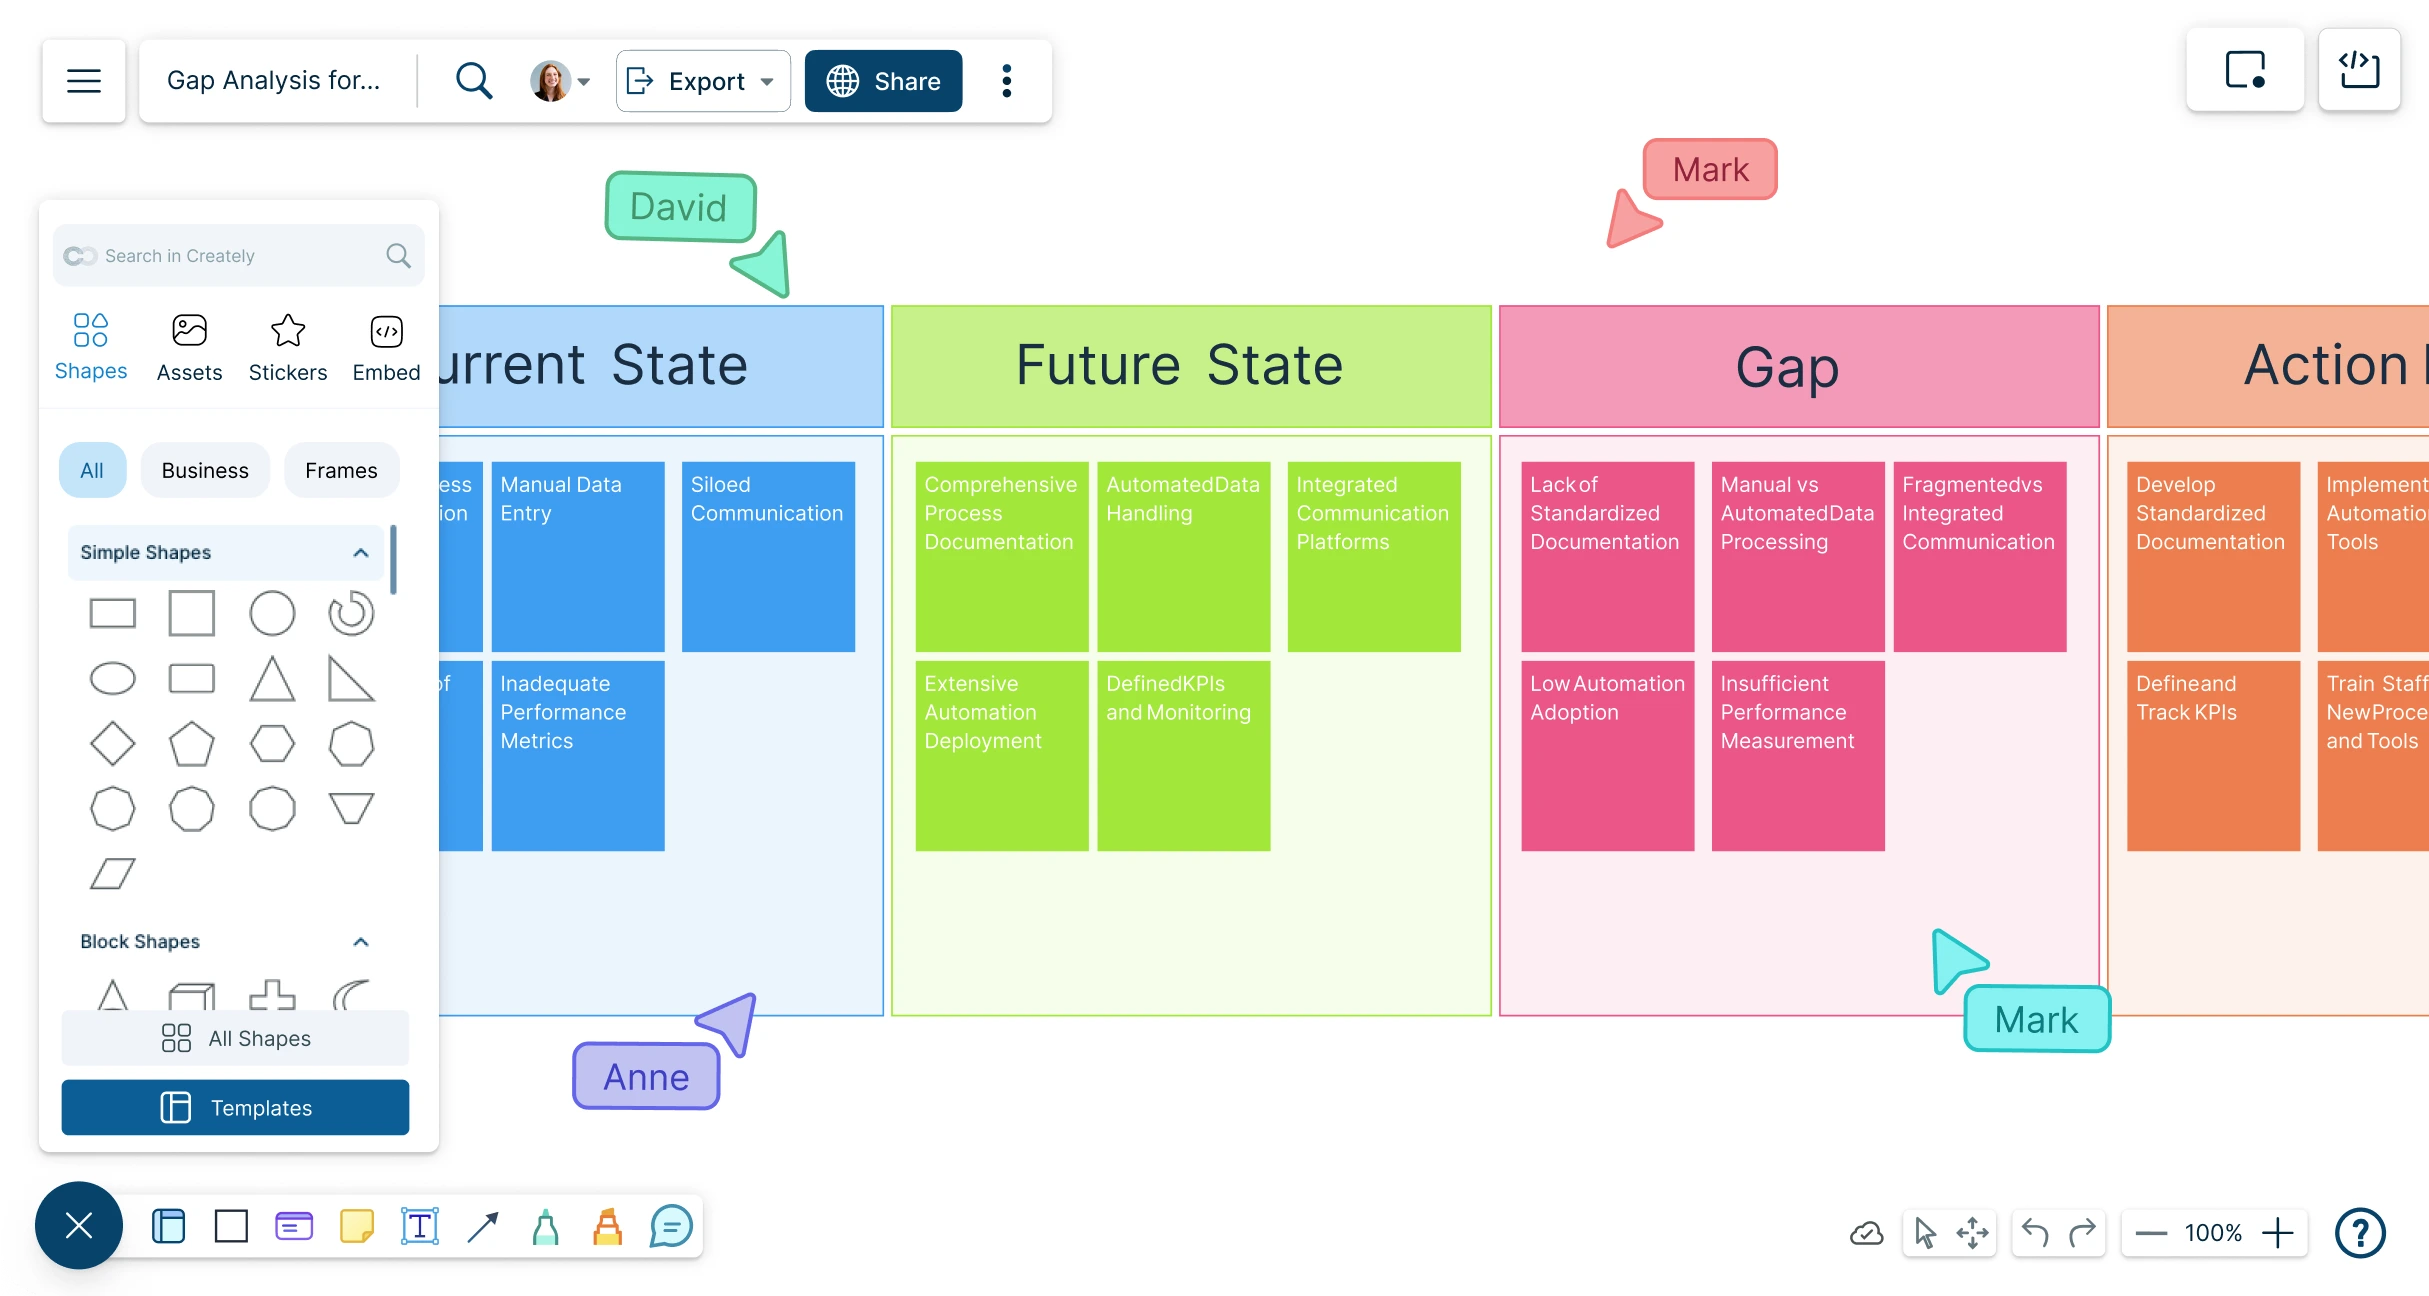
Quickly map your current vs. target state, identify gaps, and align teams on a clear path forward with Creately’s visual and collaborative gap analysis tool.
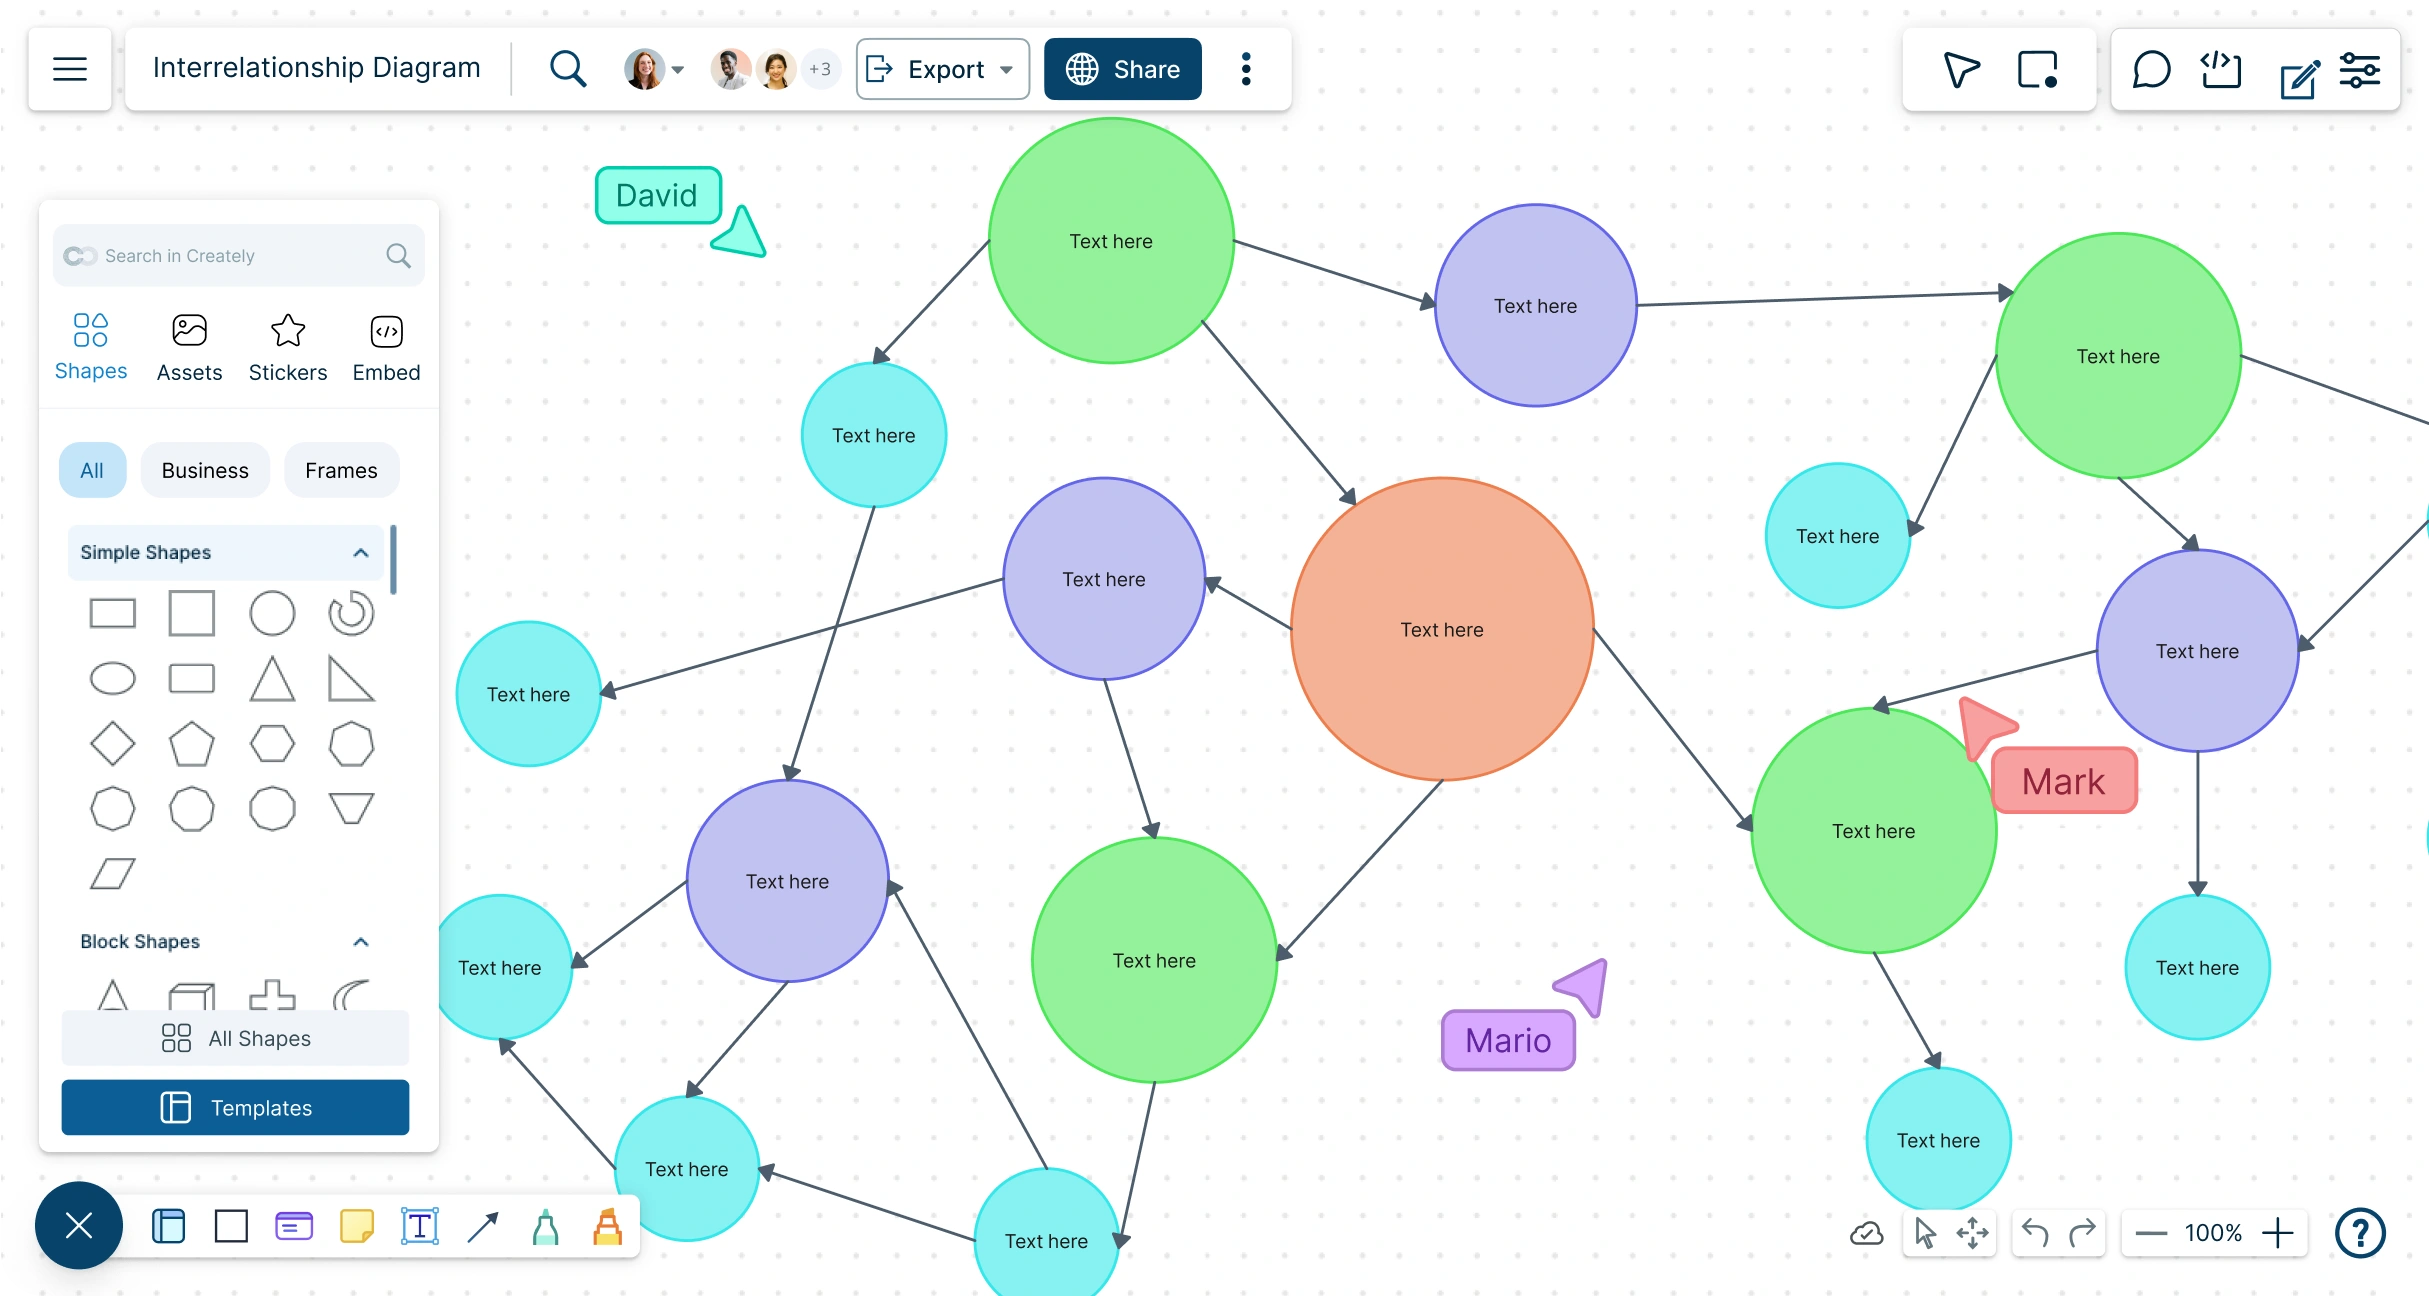
Evaluate cause-and-effect relationships of critical issues with our online Interrelationship Diagram tool. Use customizable templates to identify solutions faster and make informed decisions with the best online diagram tool.
Collaboratively map processes and workflows with Creately’s flowchart software for Mac, delivering a smooth, optimized experience on Safari, Chrome, and other macOS browsers.
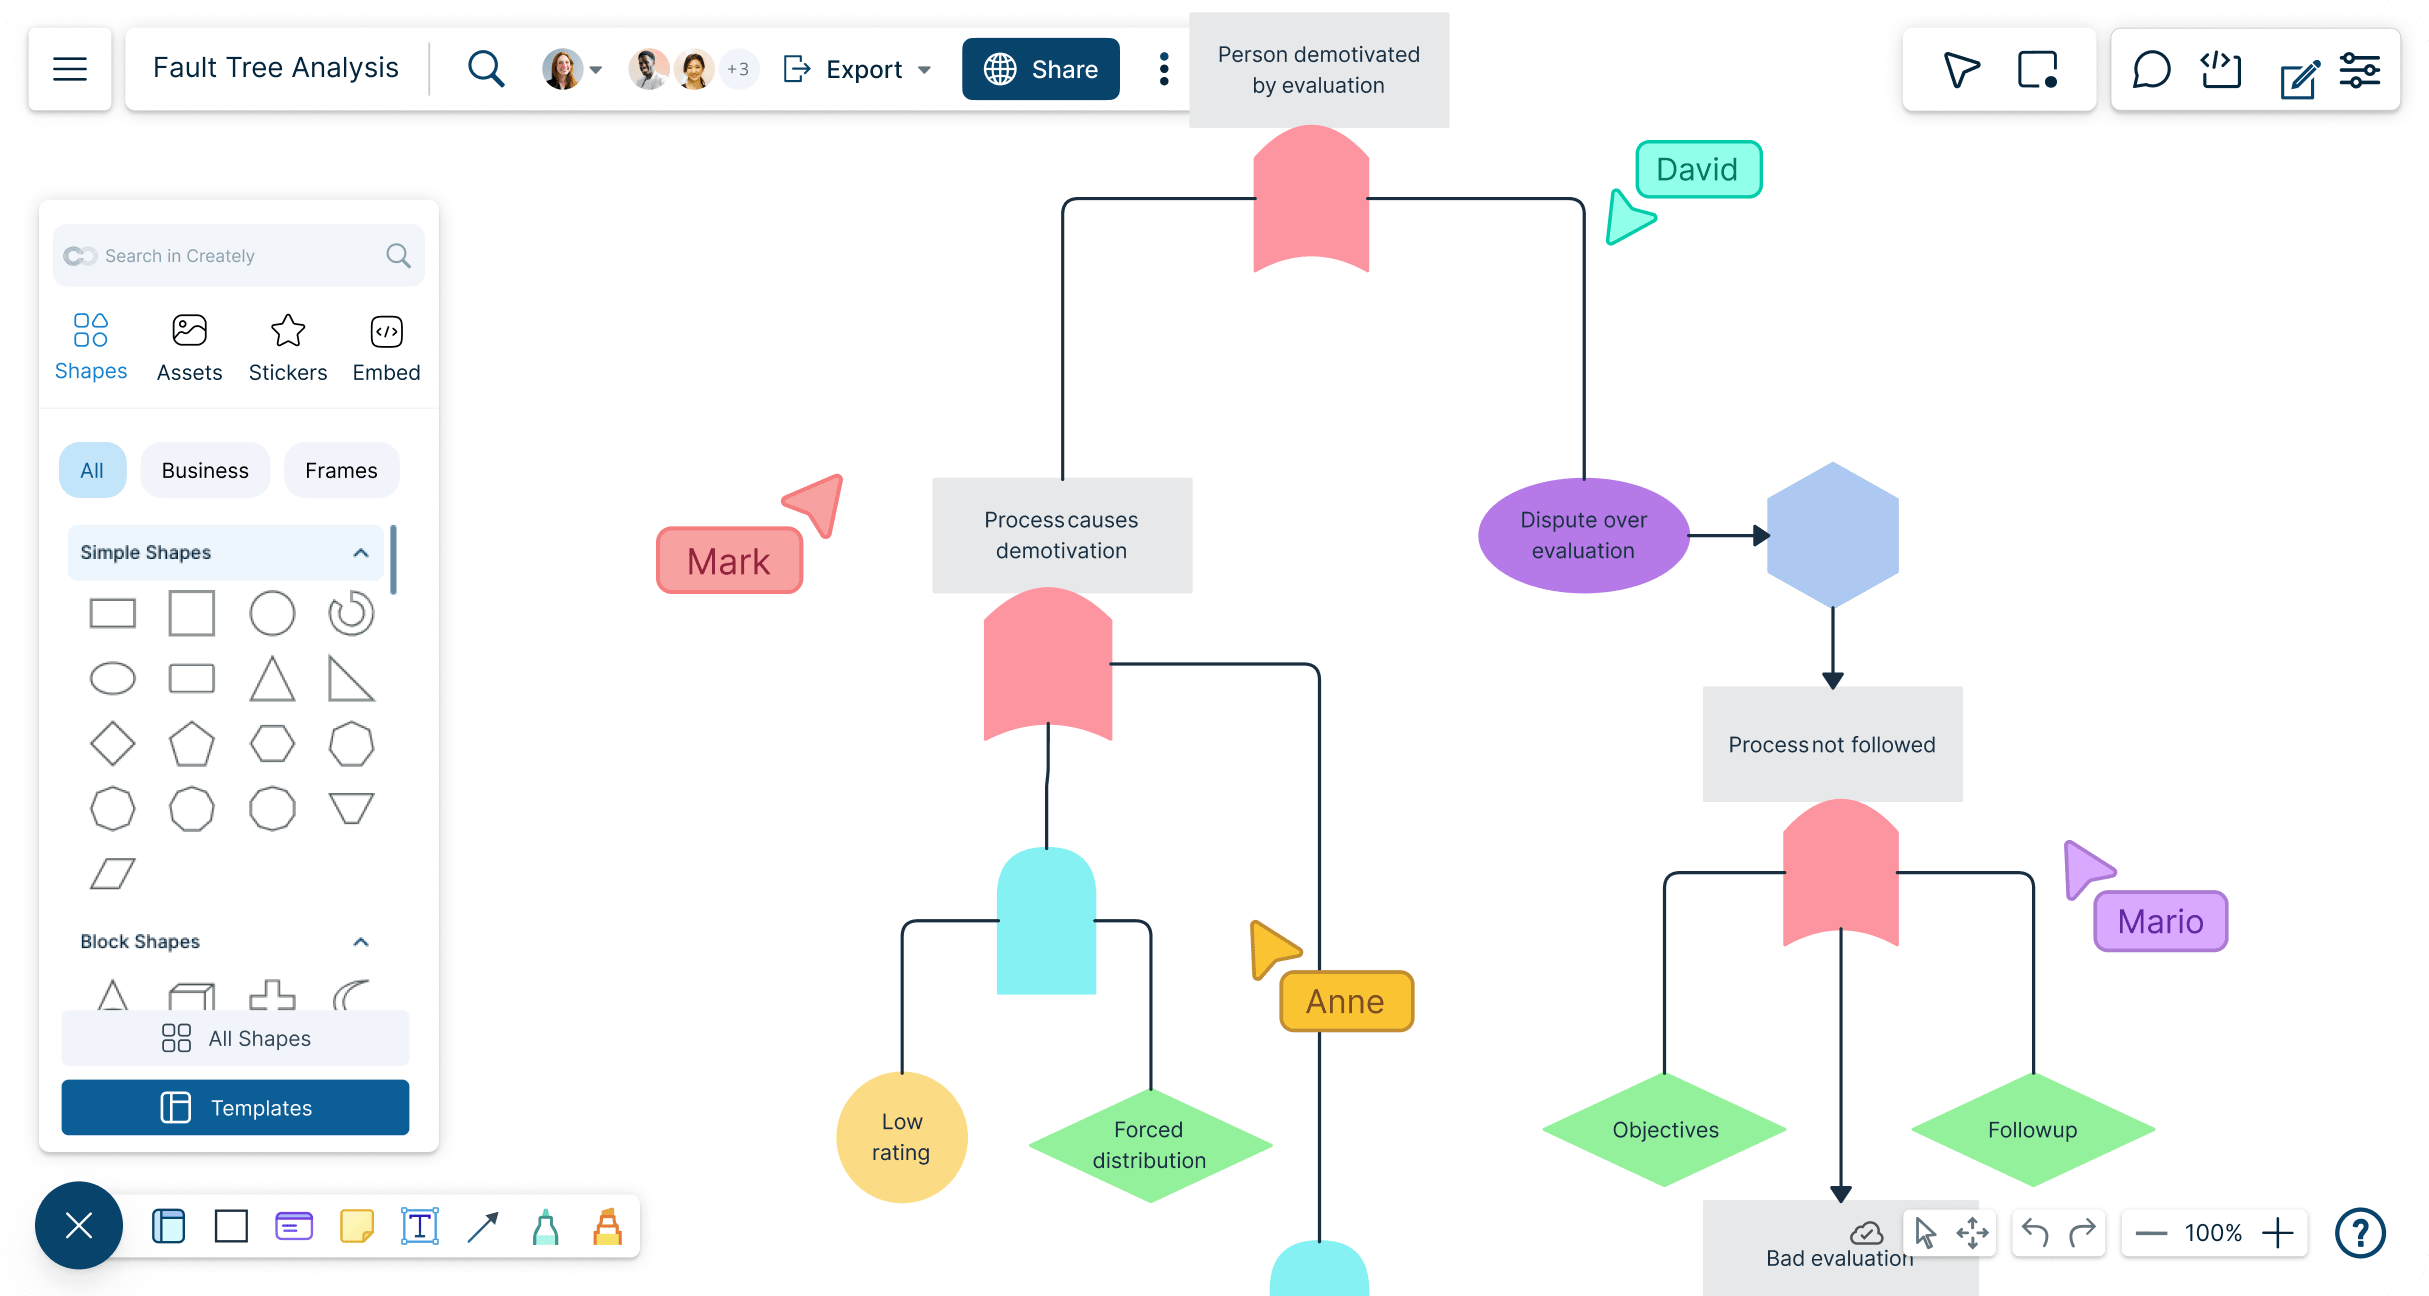
Creately’s Fault Tree Diagram Software helps you map causes of system failures, visualize complex event relationships, and create clear, professional fault tree diagrams in minutes.
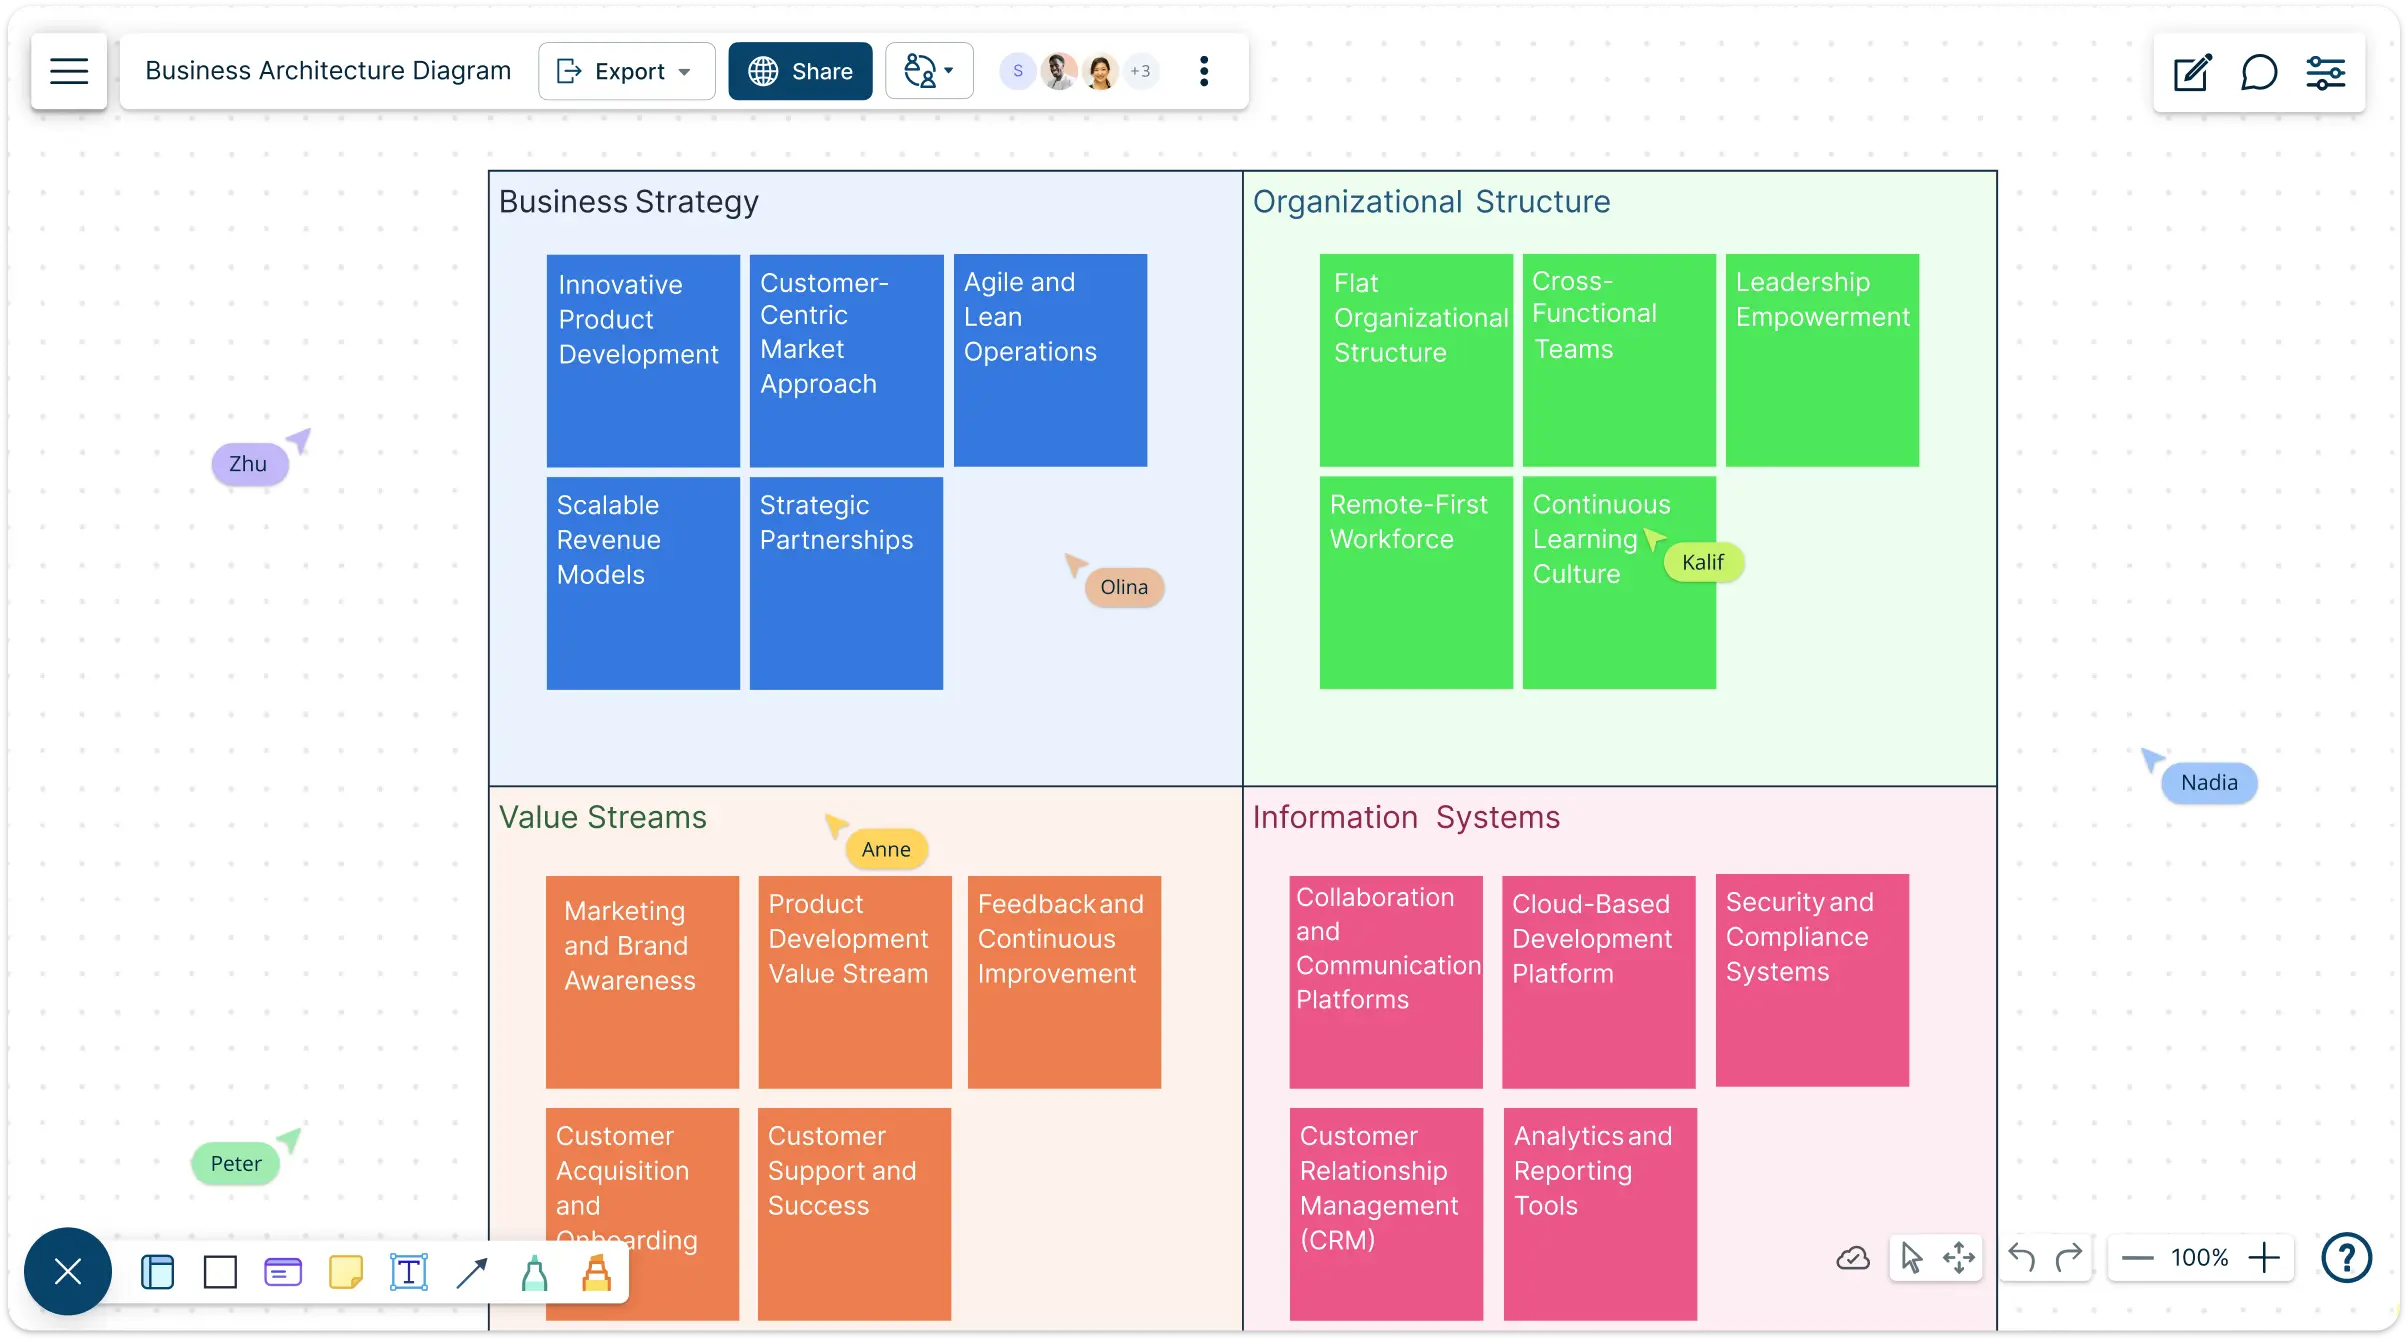
Create clear business architecture frameworks to visualize your corporate footprint, map strategy, processes, & systems while connecting business principles with execution.
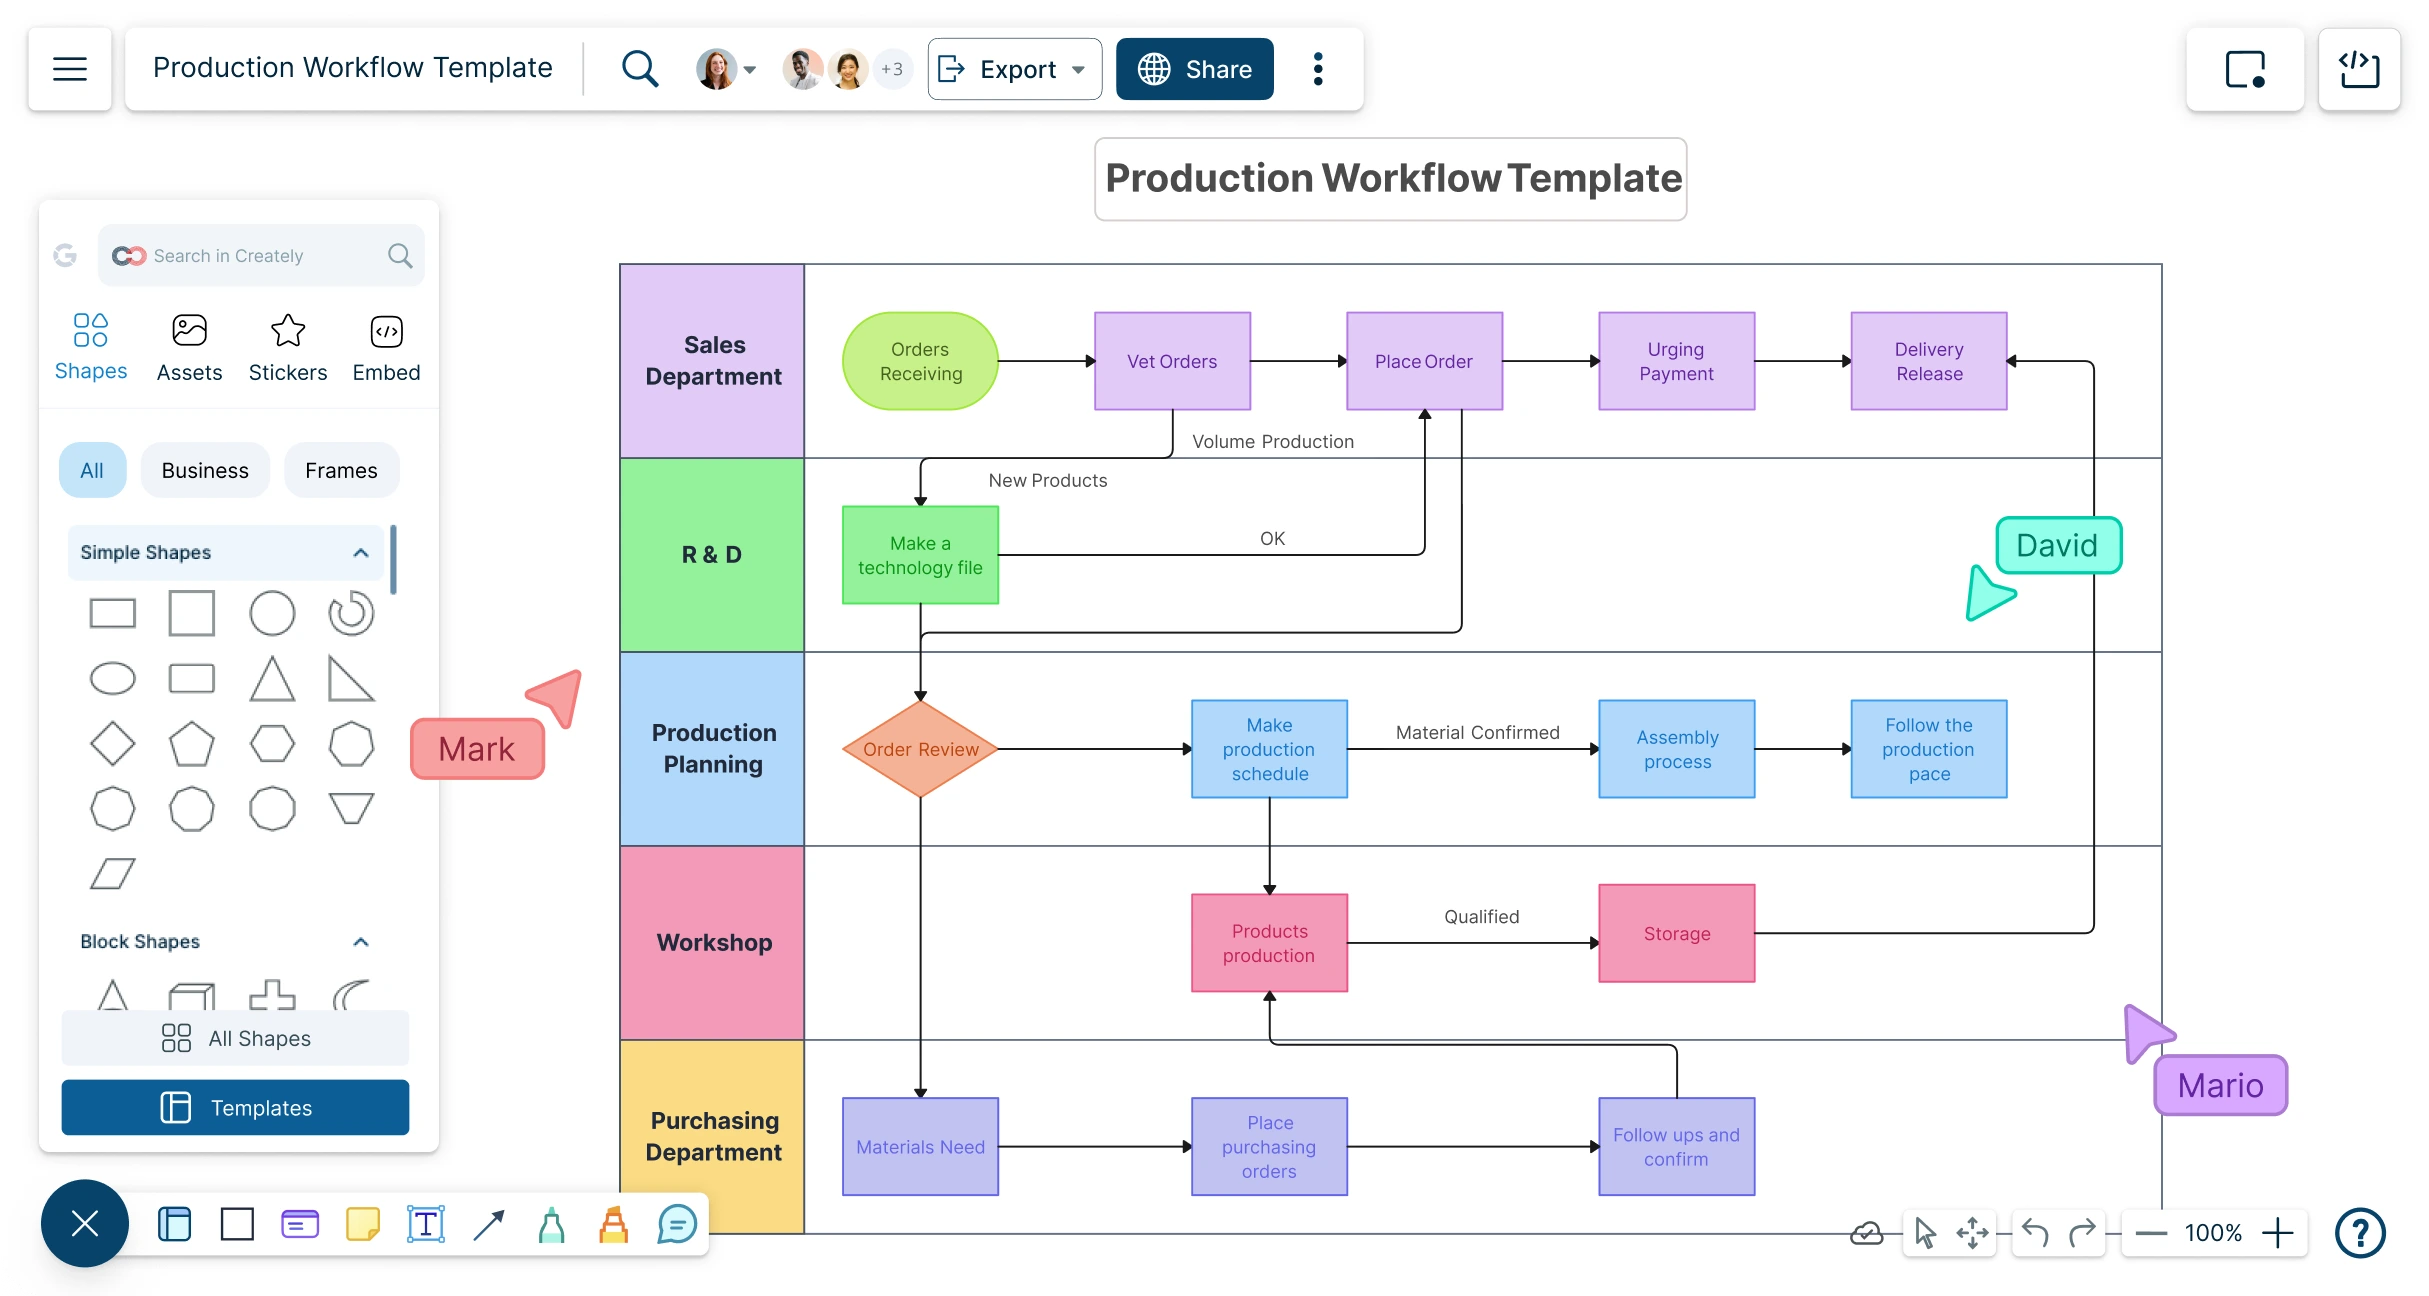
Create clear workflow diagrams in minutes — map processes, assign owners, and turn diagrams into action-ready playbooks that your team can follow and improve.
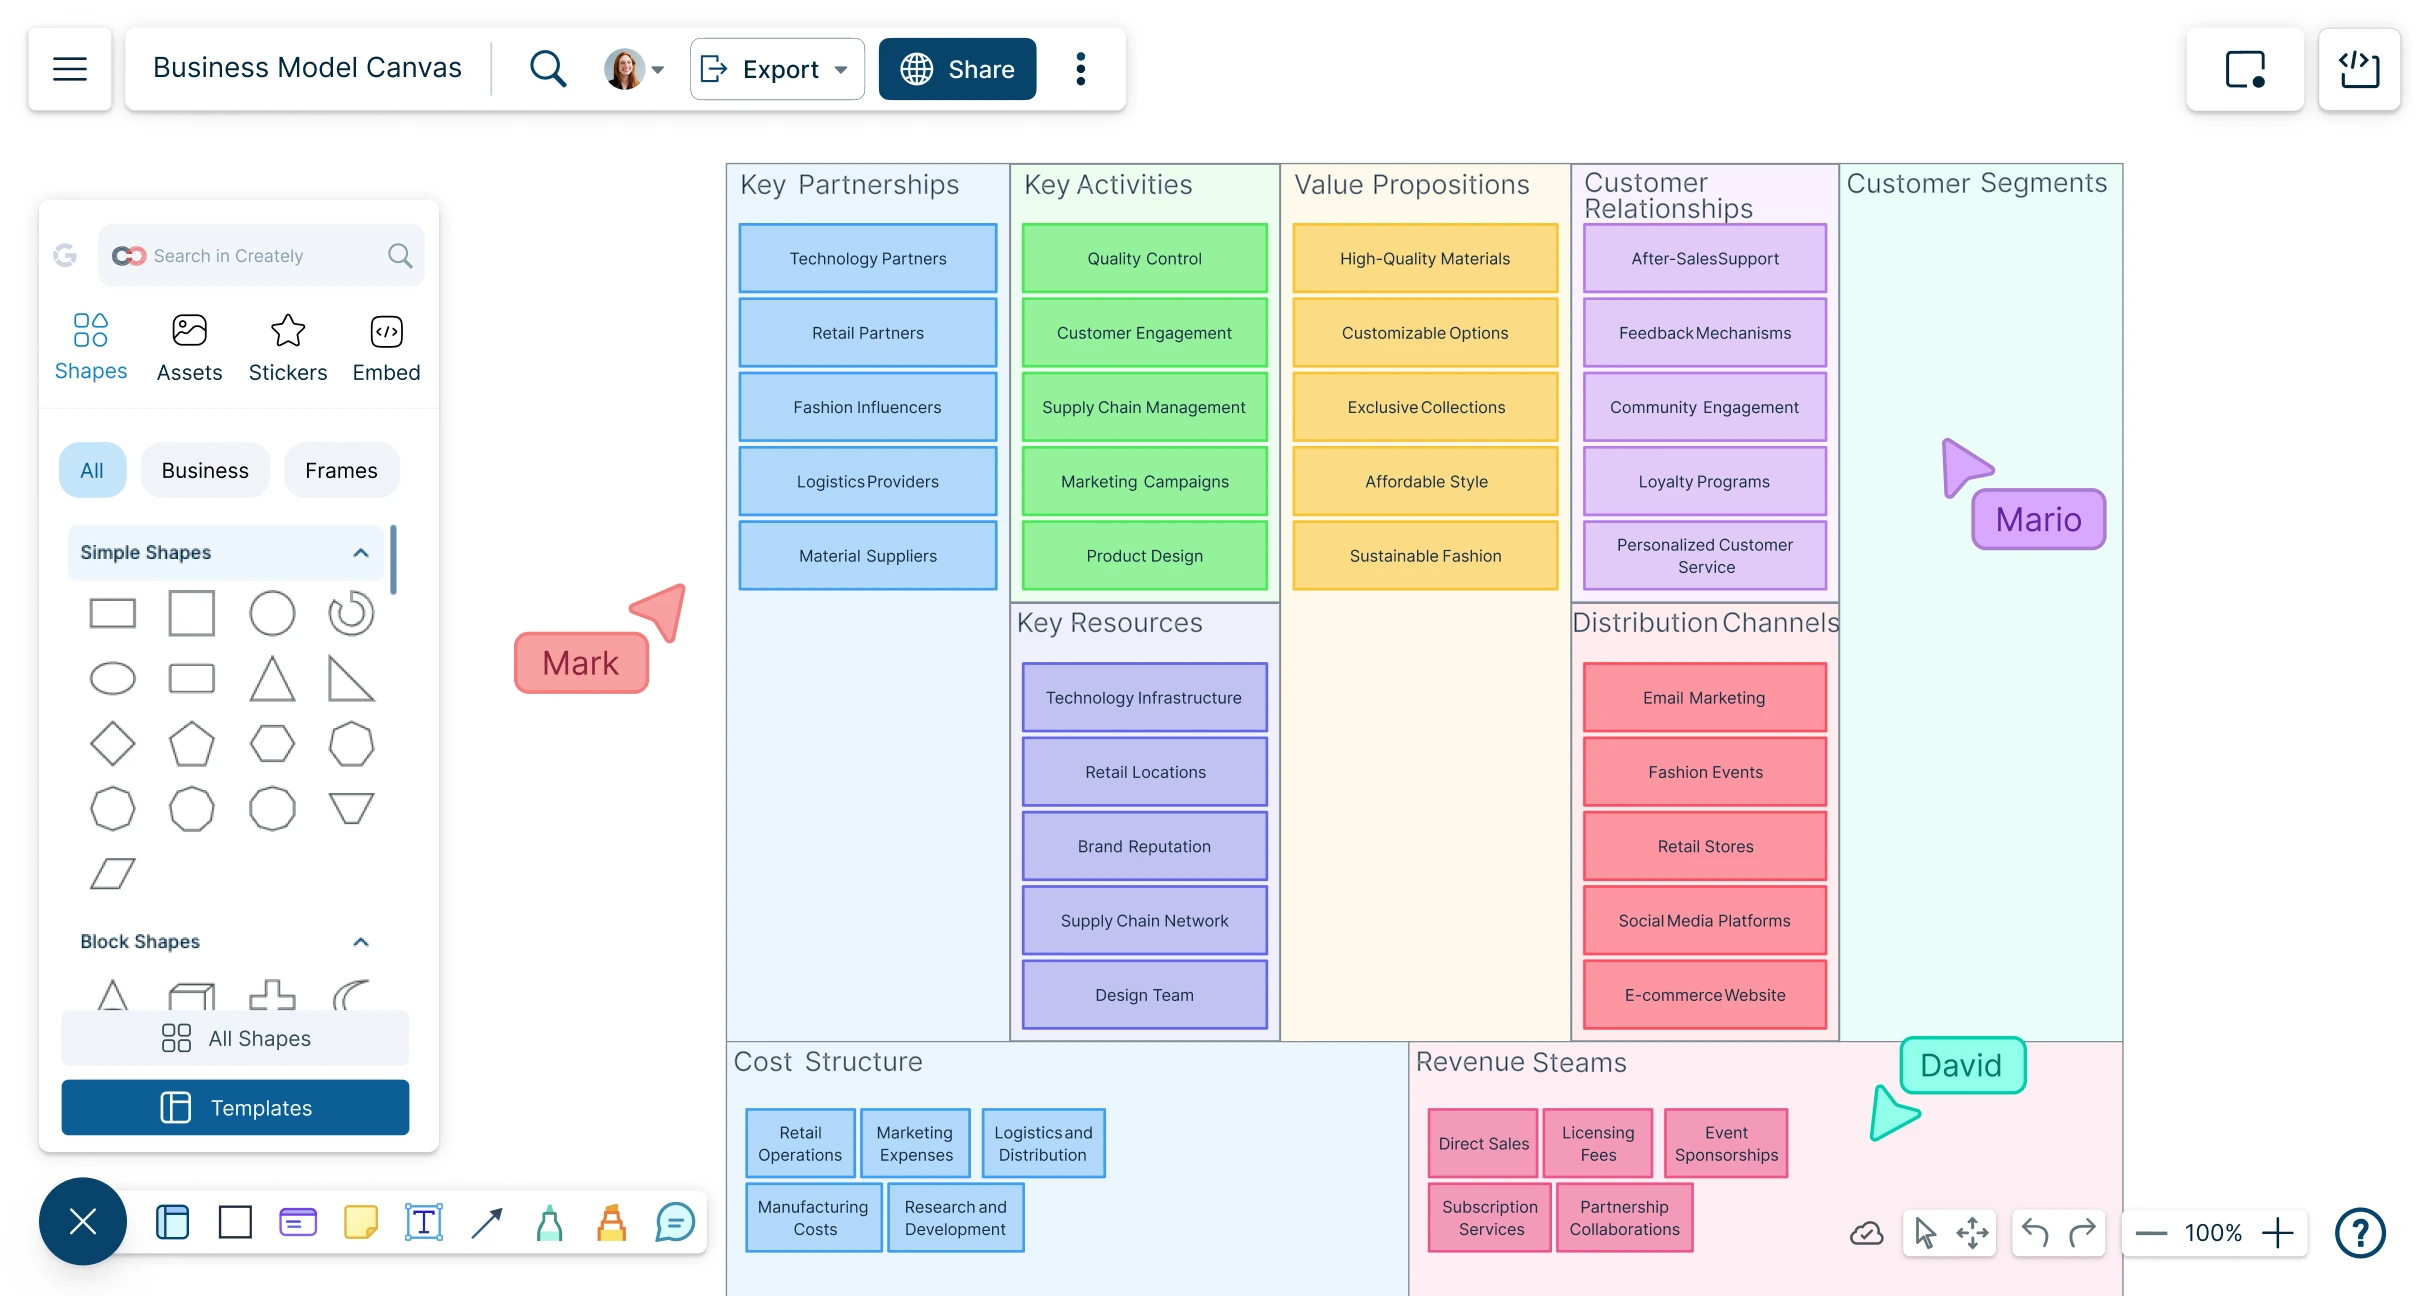
Easily transform business planning with Creately’s Business Model Canvas Generator — ideal for quickly creating, refining, and collaborating on business models.
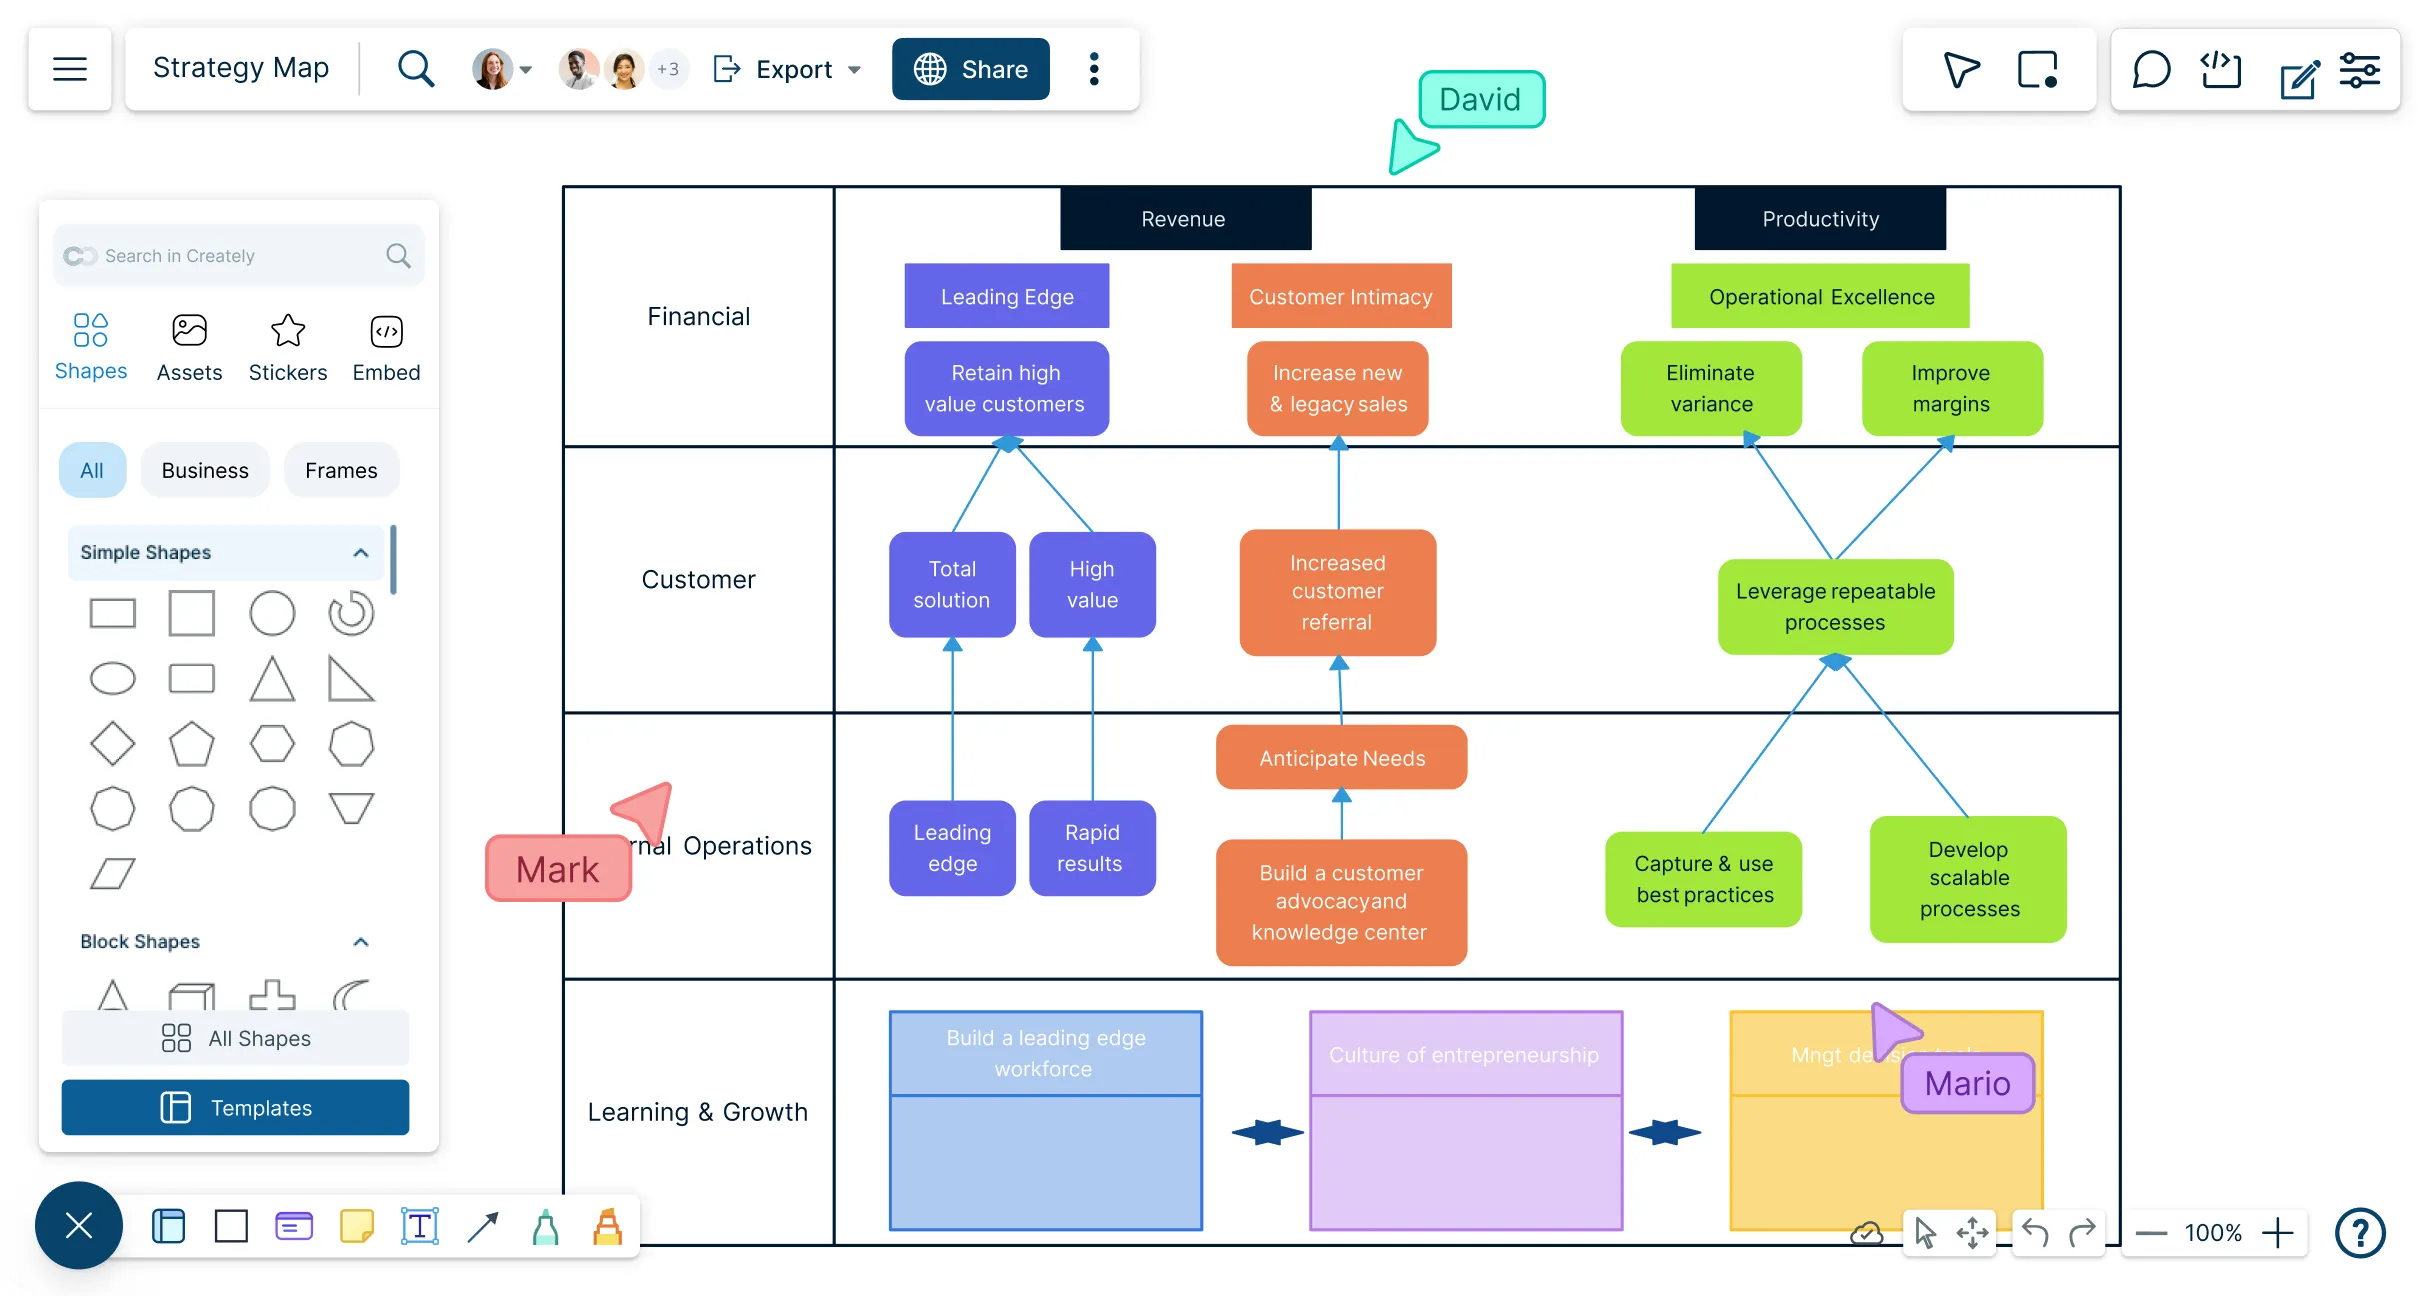
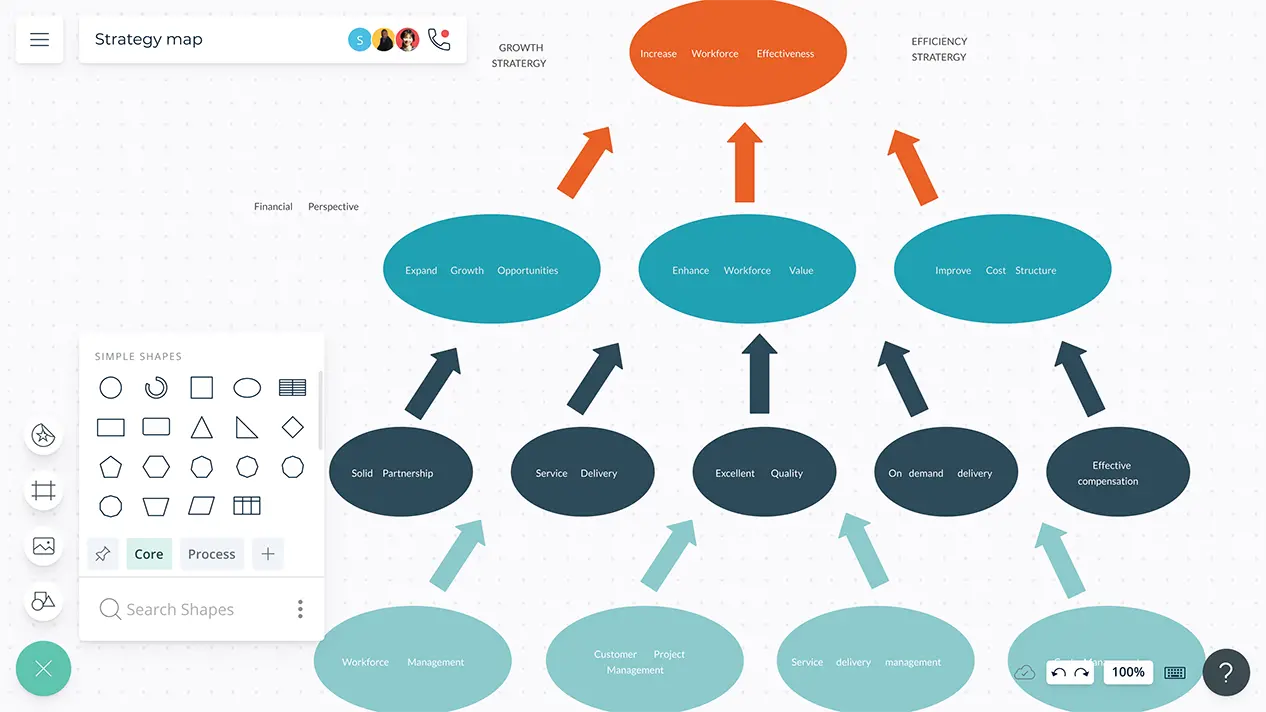
Transform your strategic planning process with Creately’s dynamic strategy mapping tool. Build maps that grow with your business—align stakeholders, track what matters and pivot when it counts.
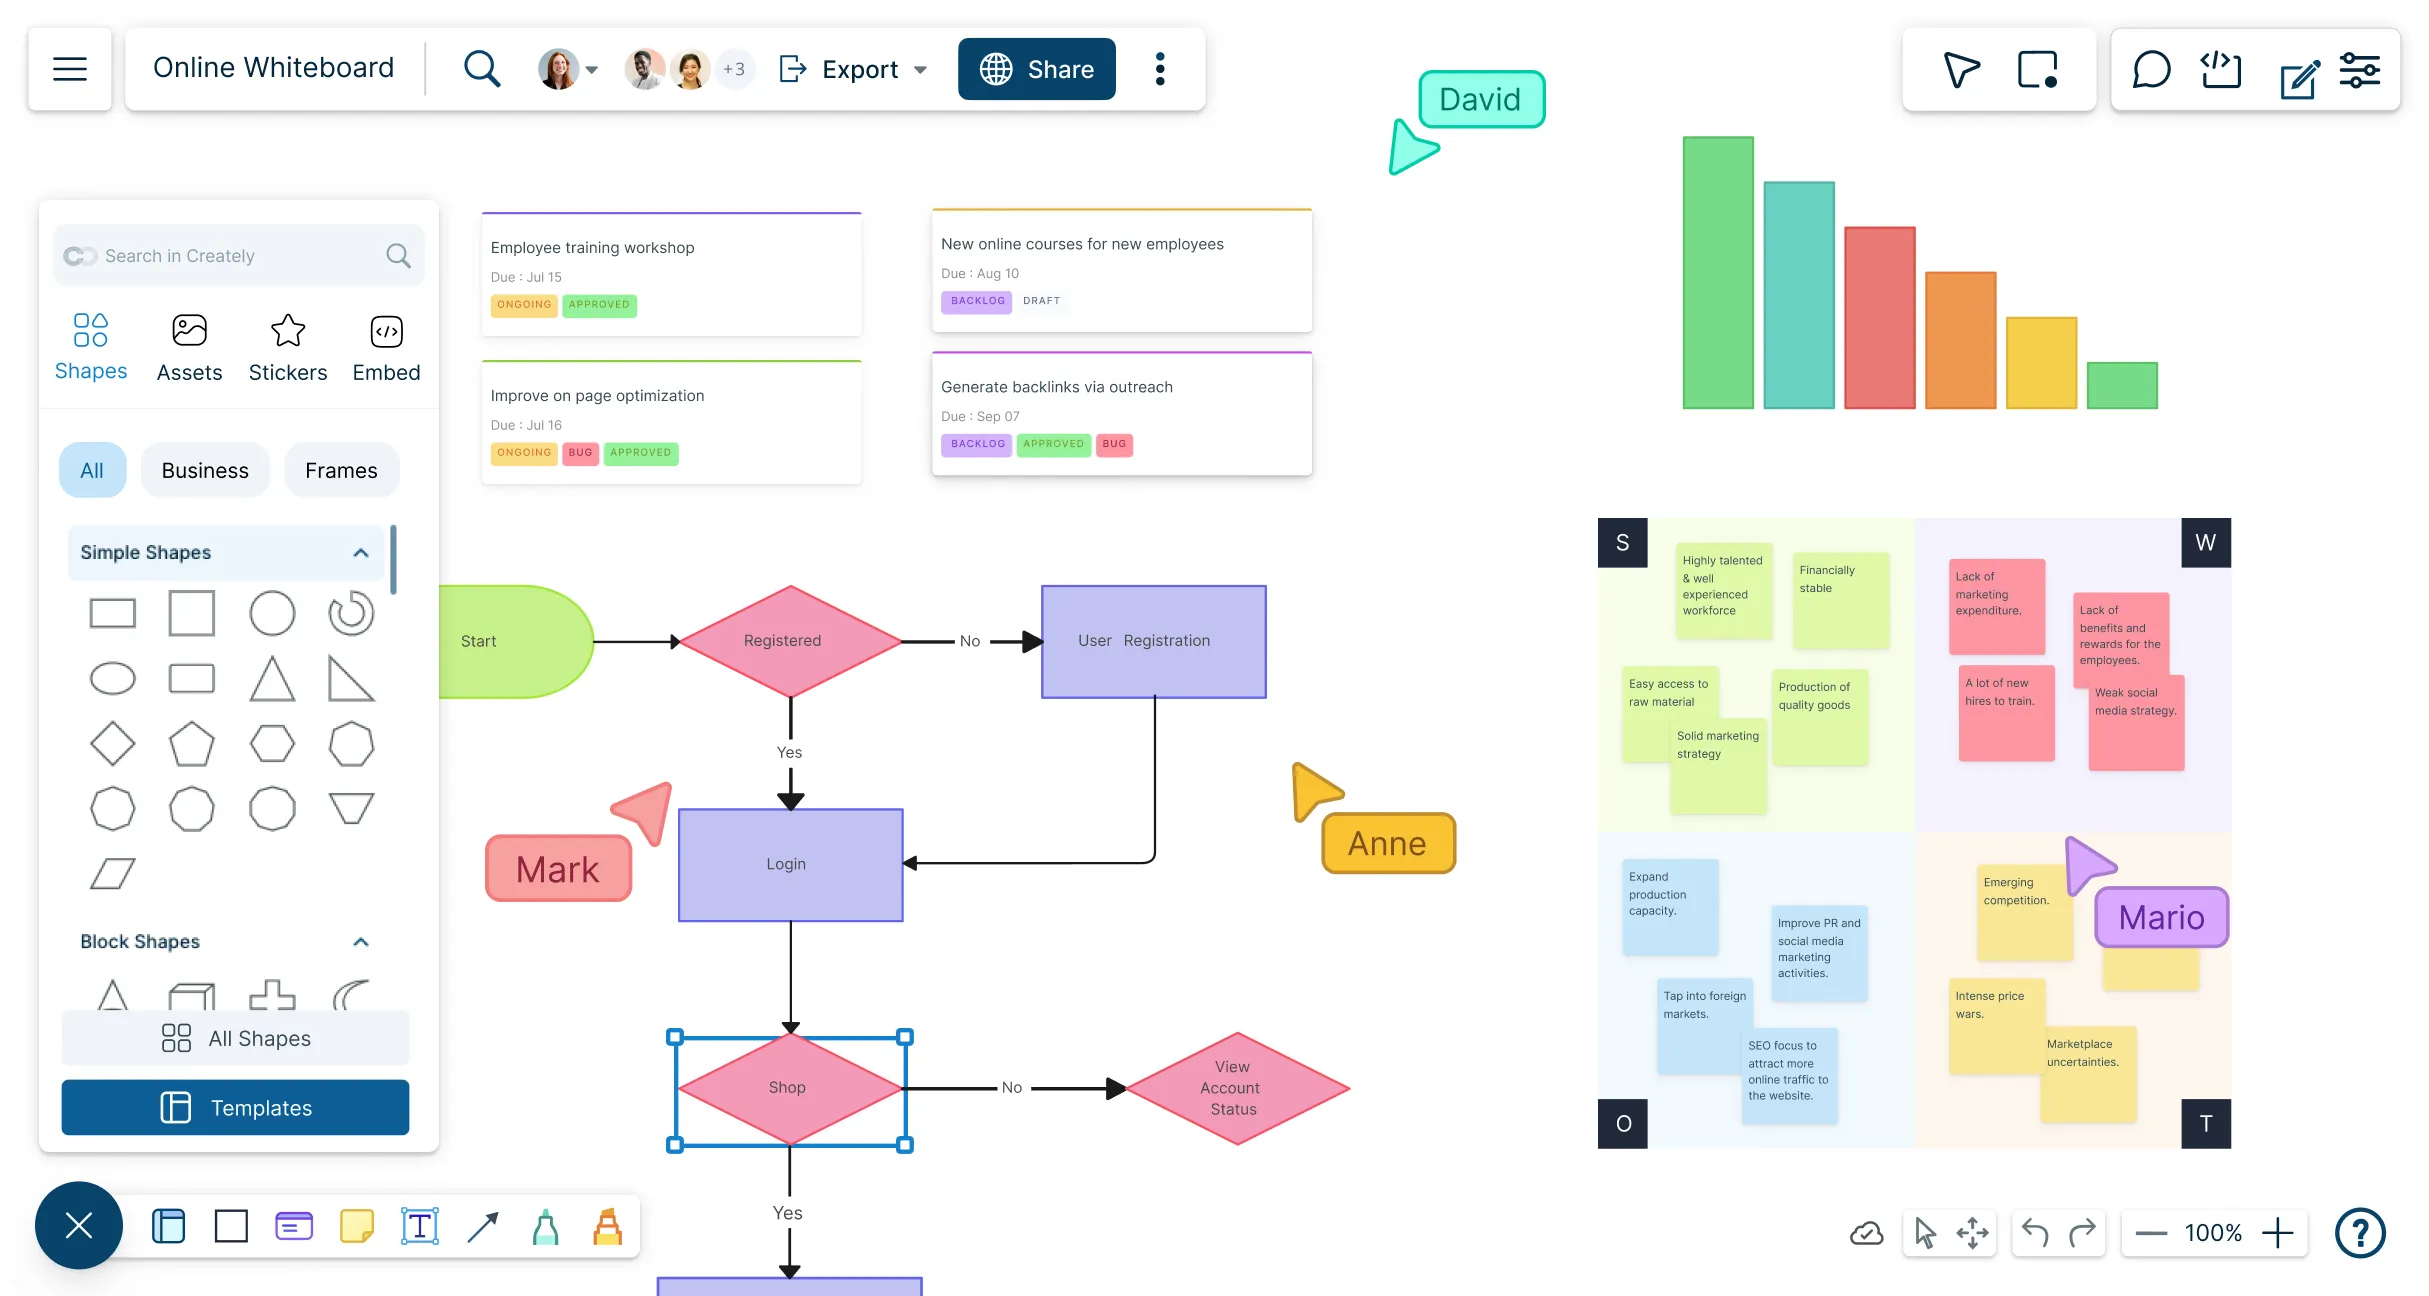
Brainstorm, plan, and visualize ideas together—whether in class, at work, or remotely—with our intuitive, unlimited-space virtual whiteboard.
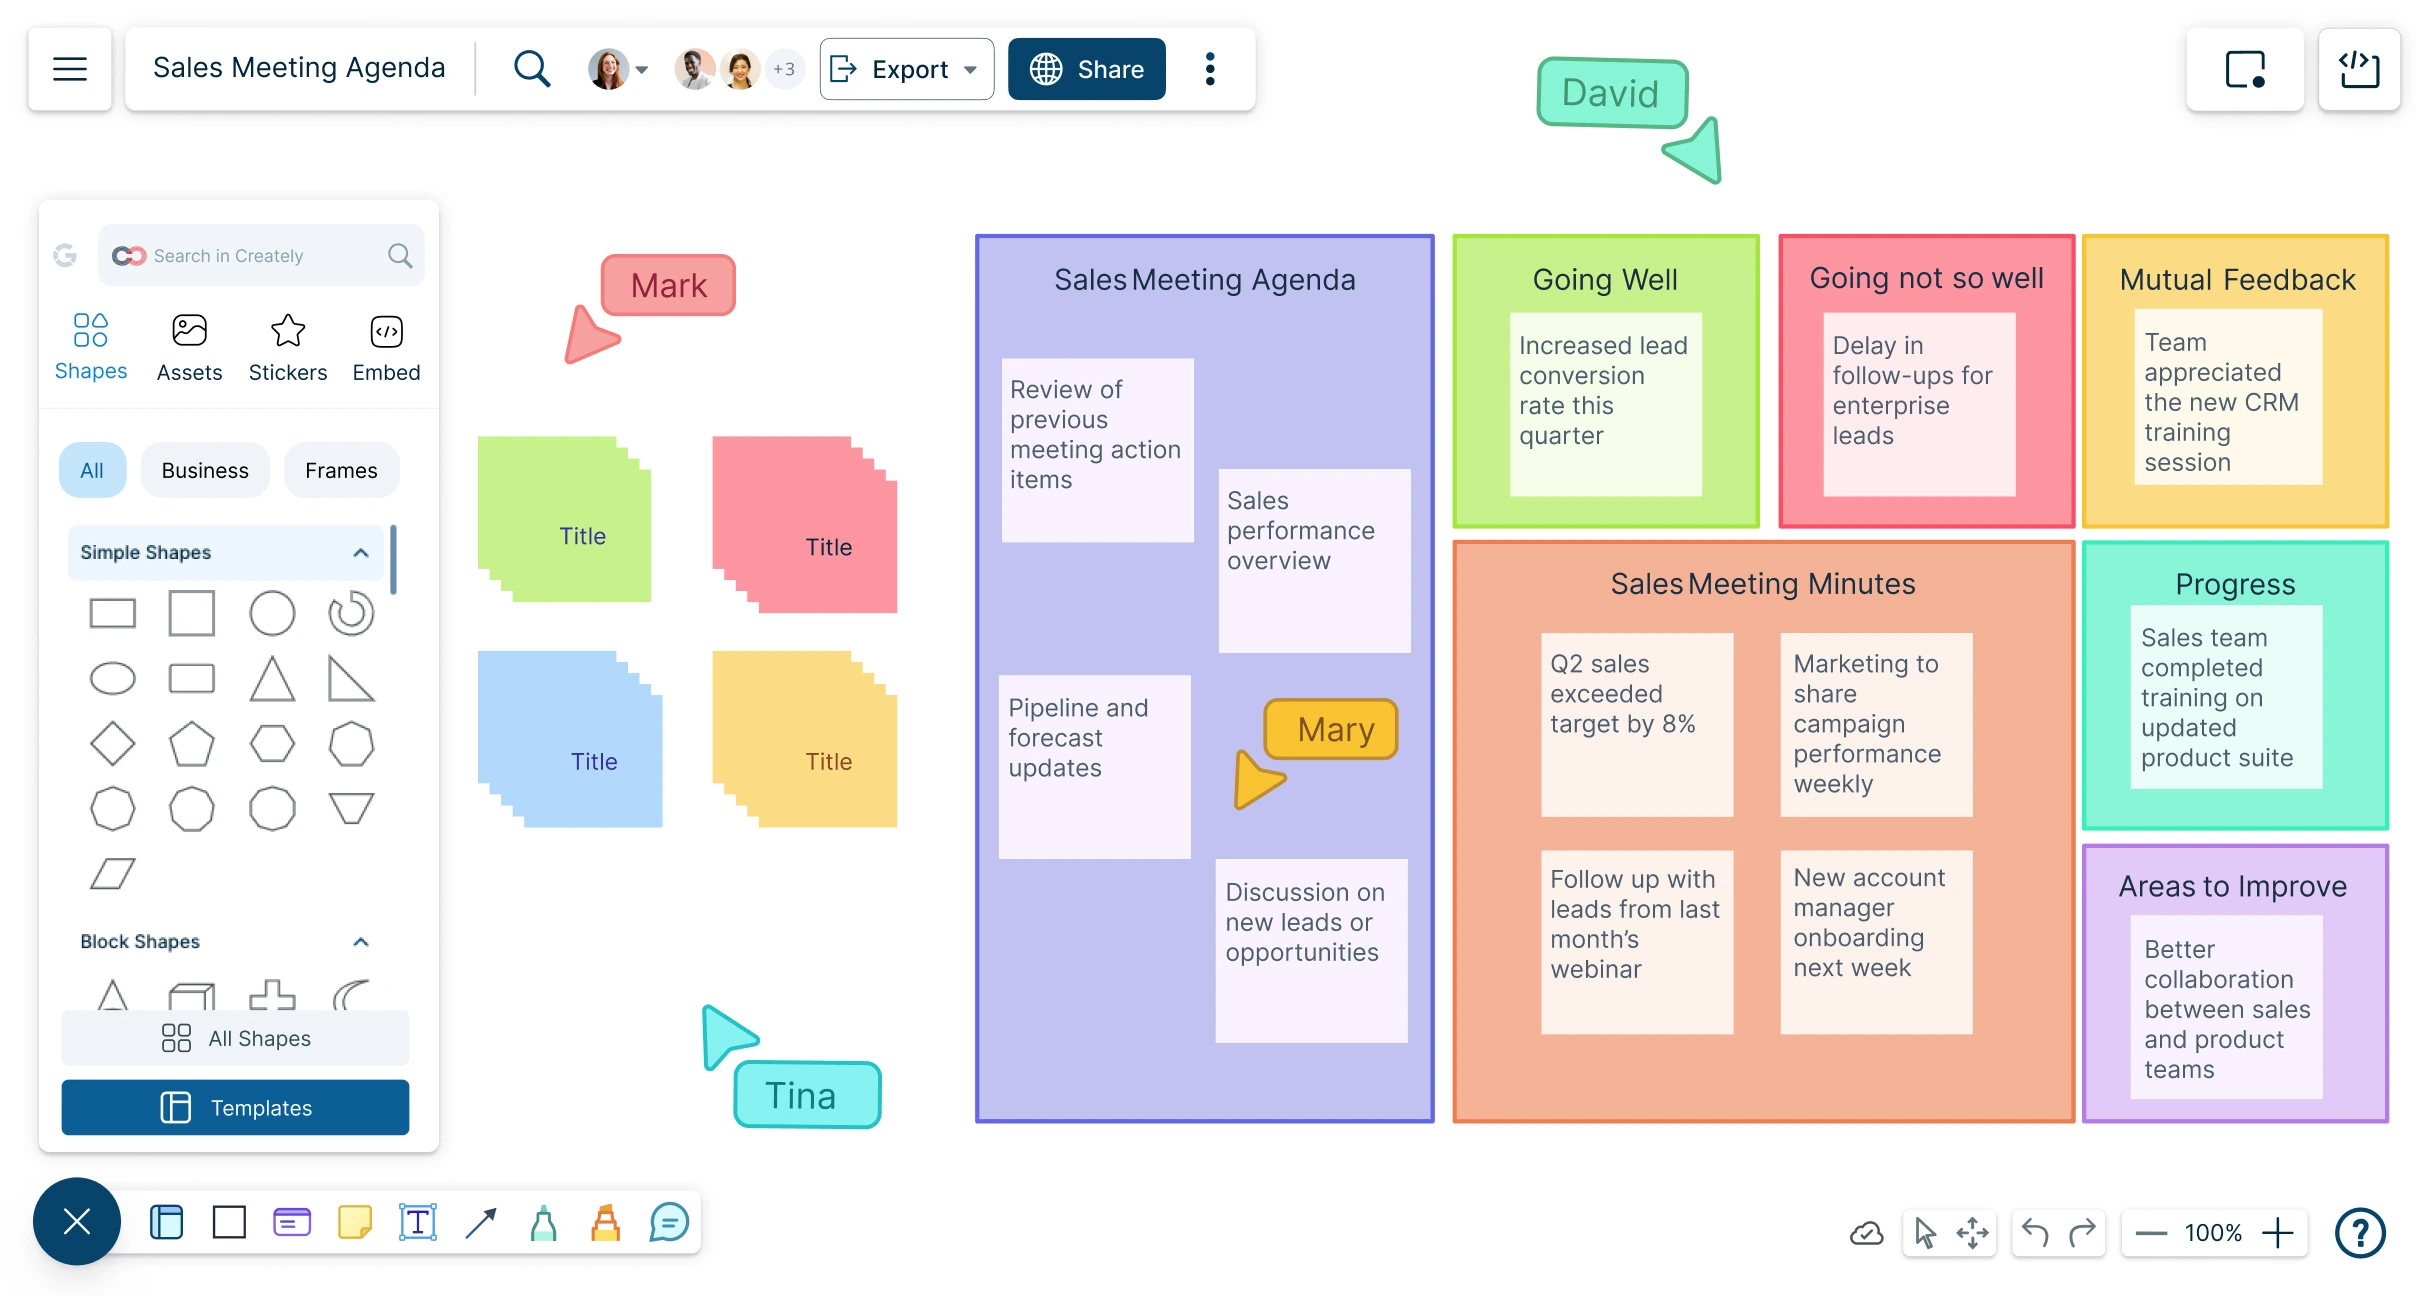
Plan with precision, stay on track, and turn discussions into actionable outcomes using customizable, collaborative meeting agendas.
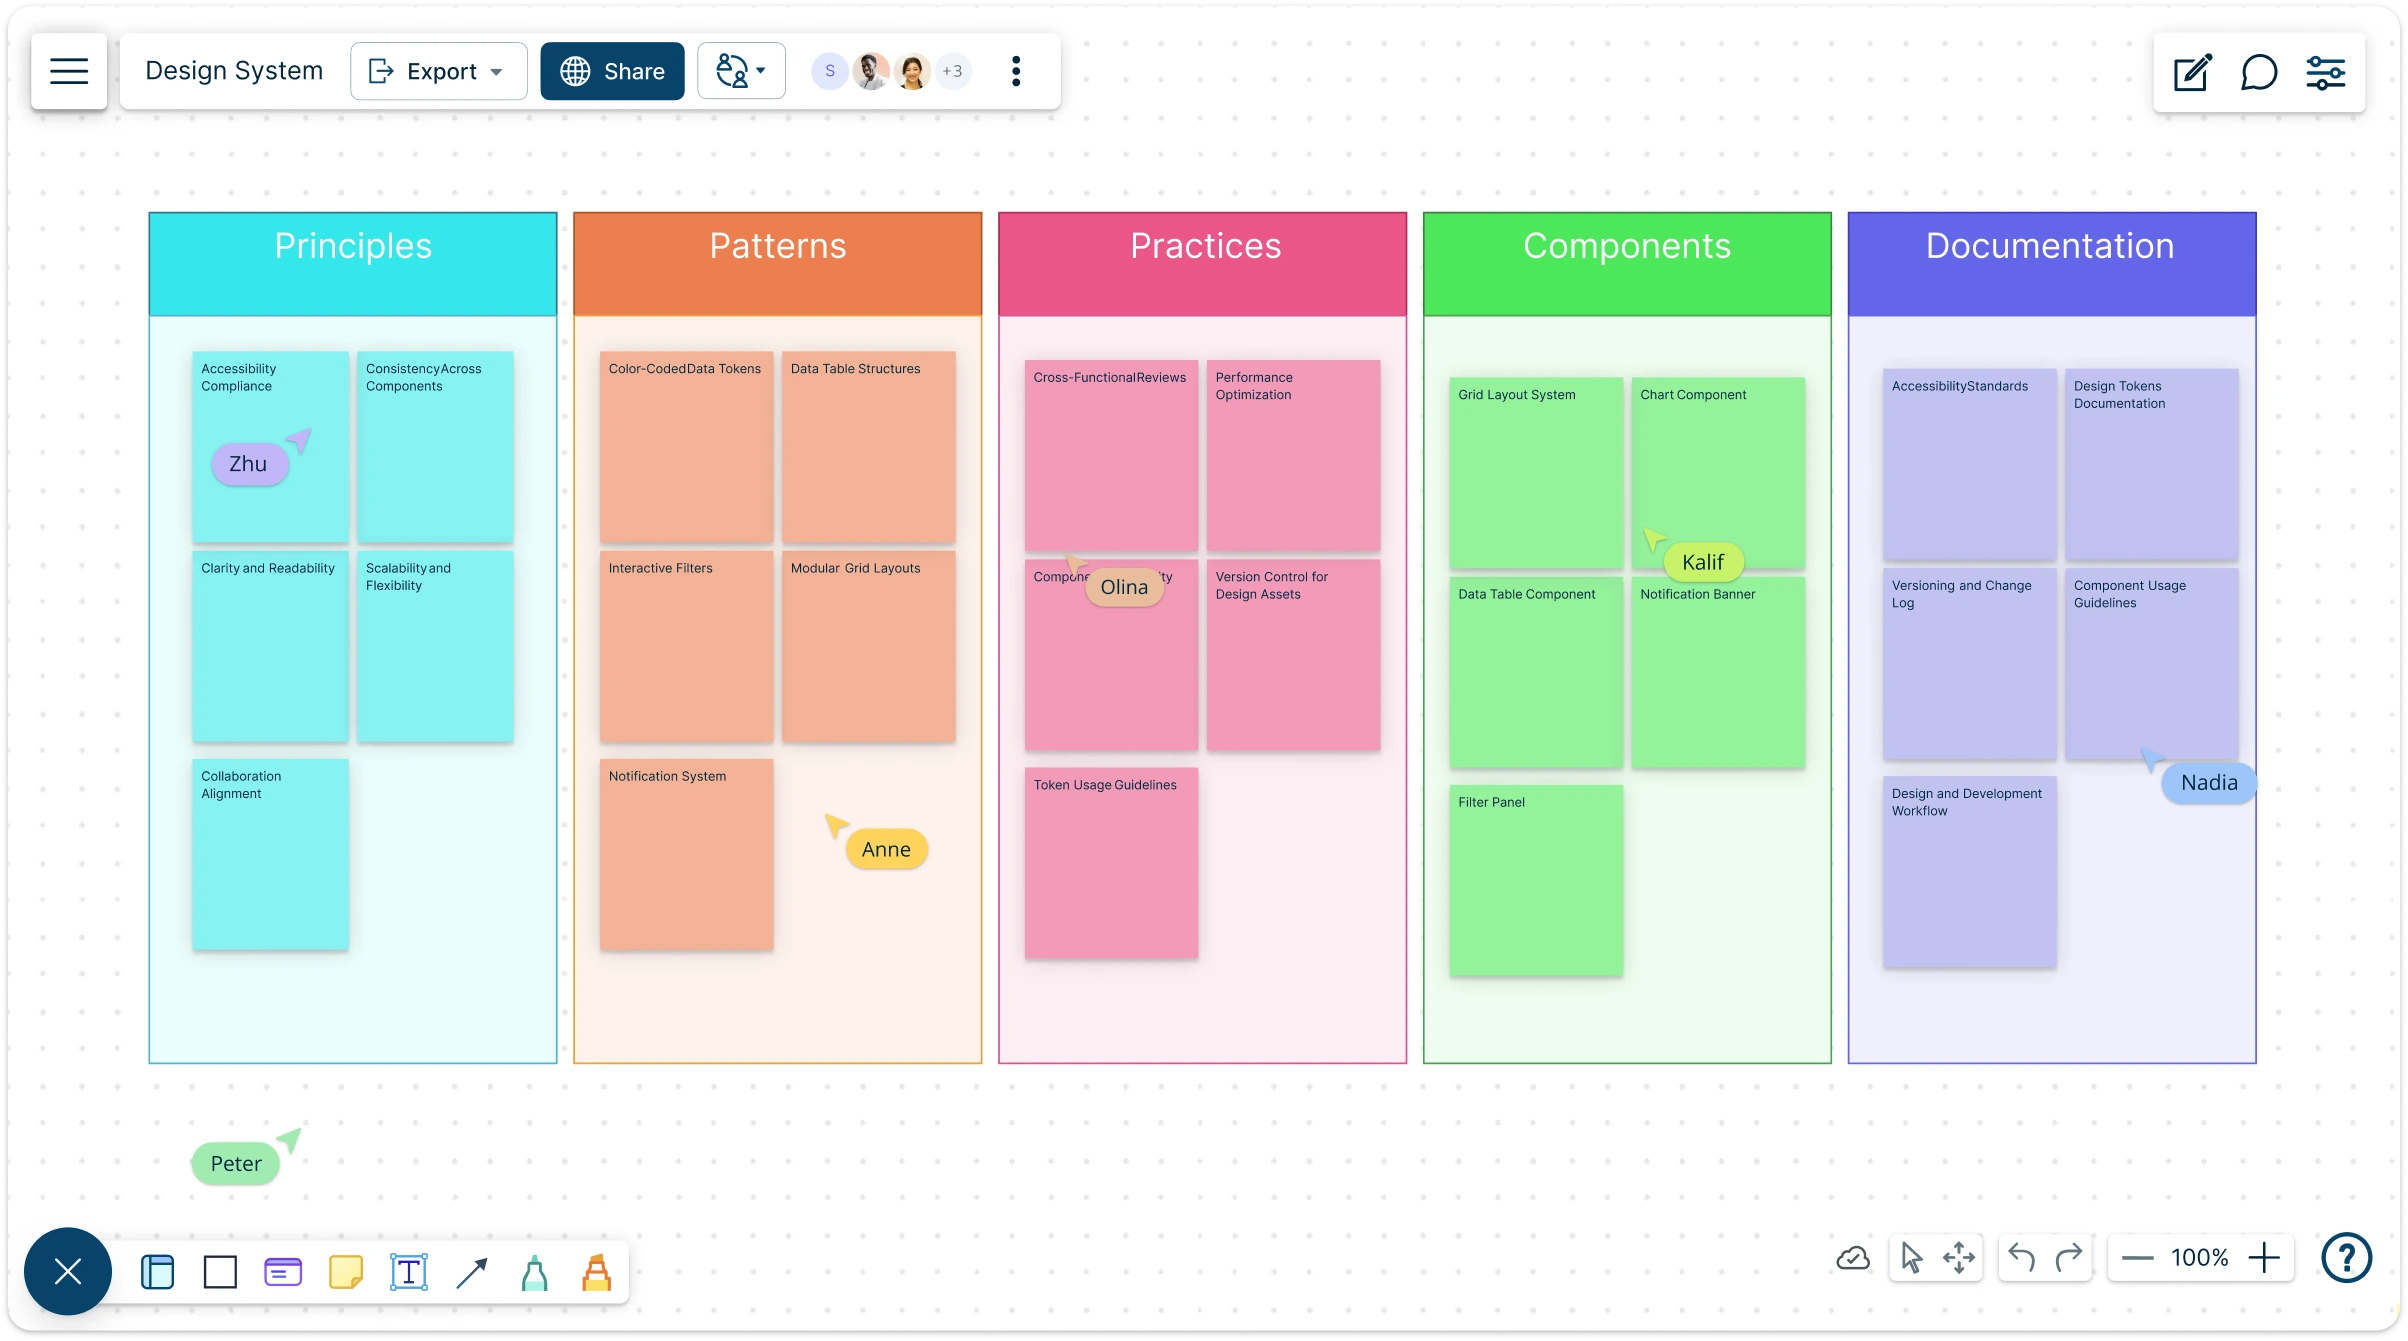
Build your own design system template to unify brand identity, streamline UI/UX, and accelerate workflows. Explore ready-made design system examples, libraries, and tools to guide your team from concept to launch.
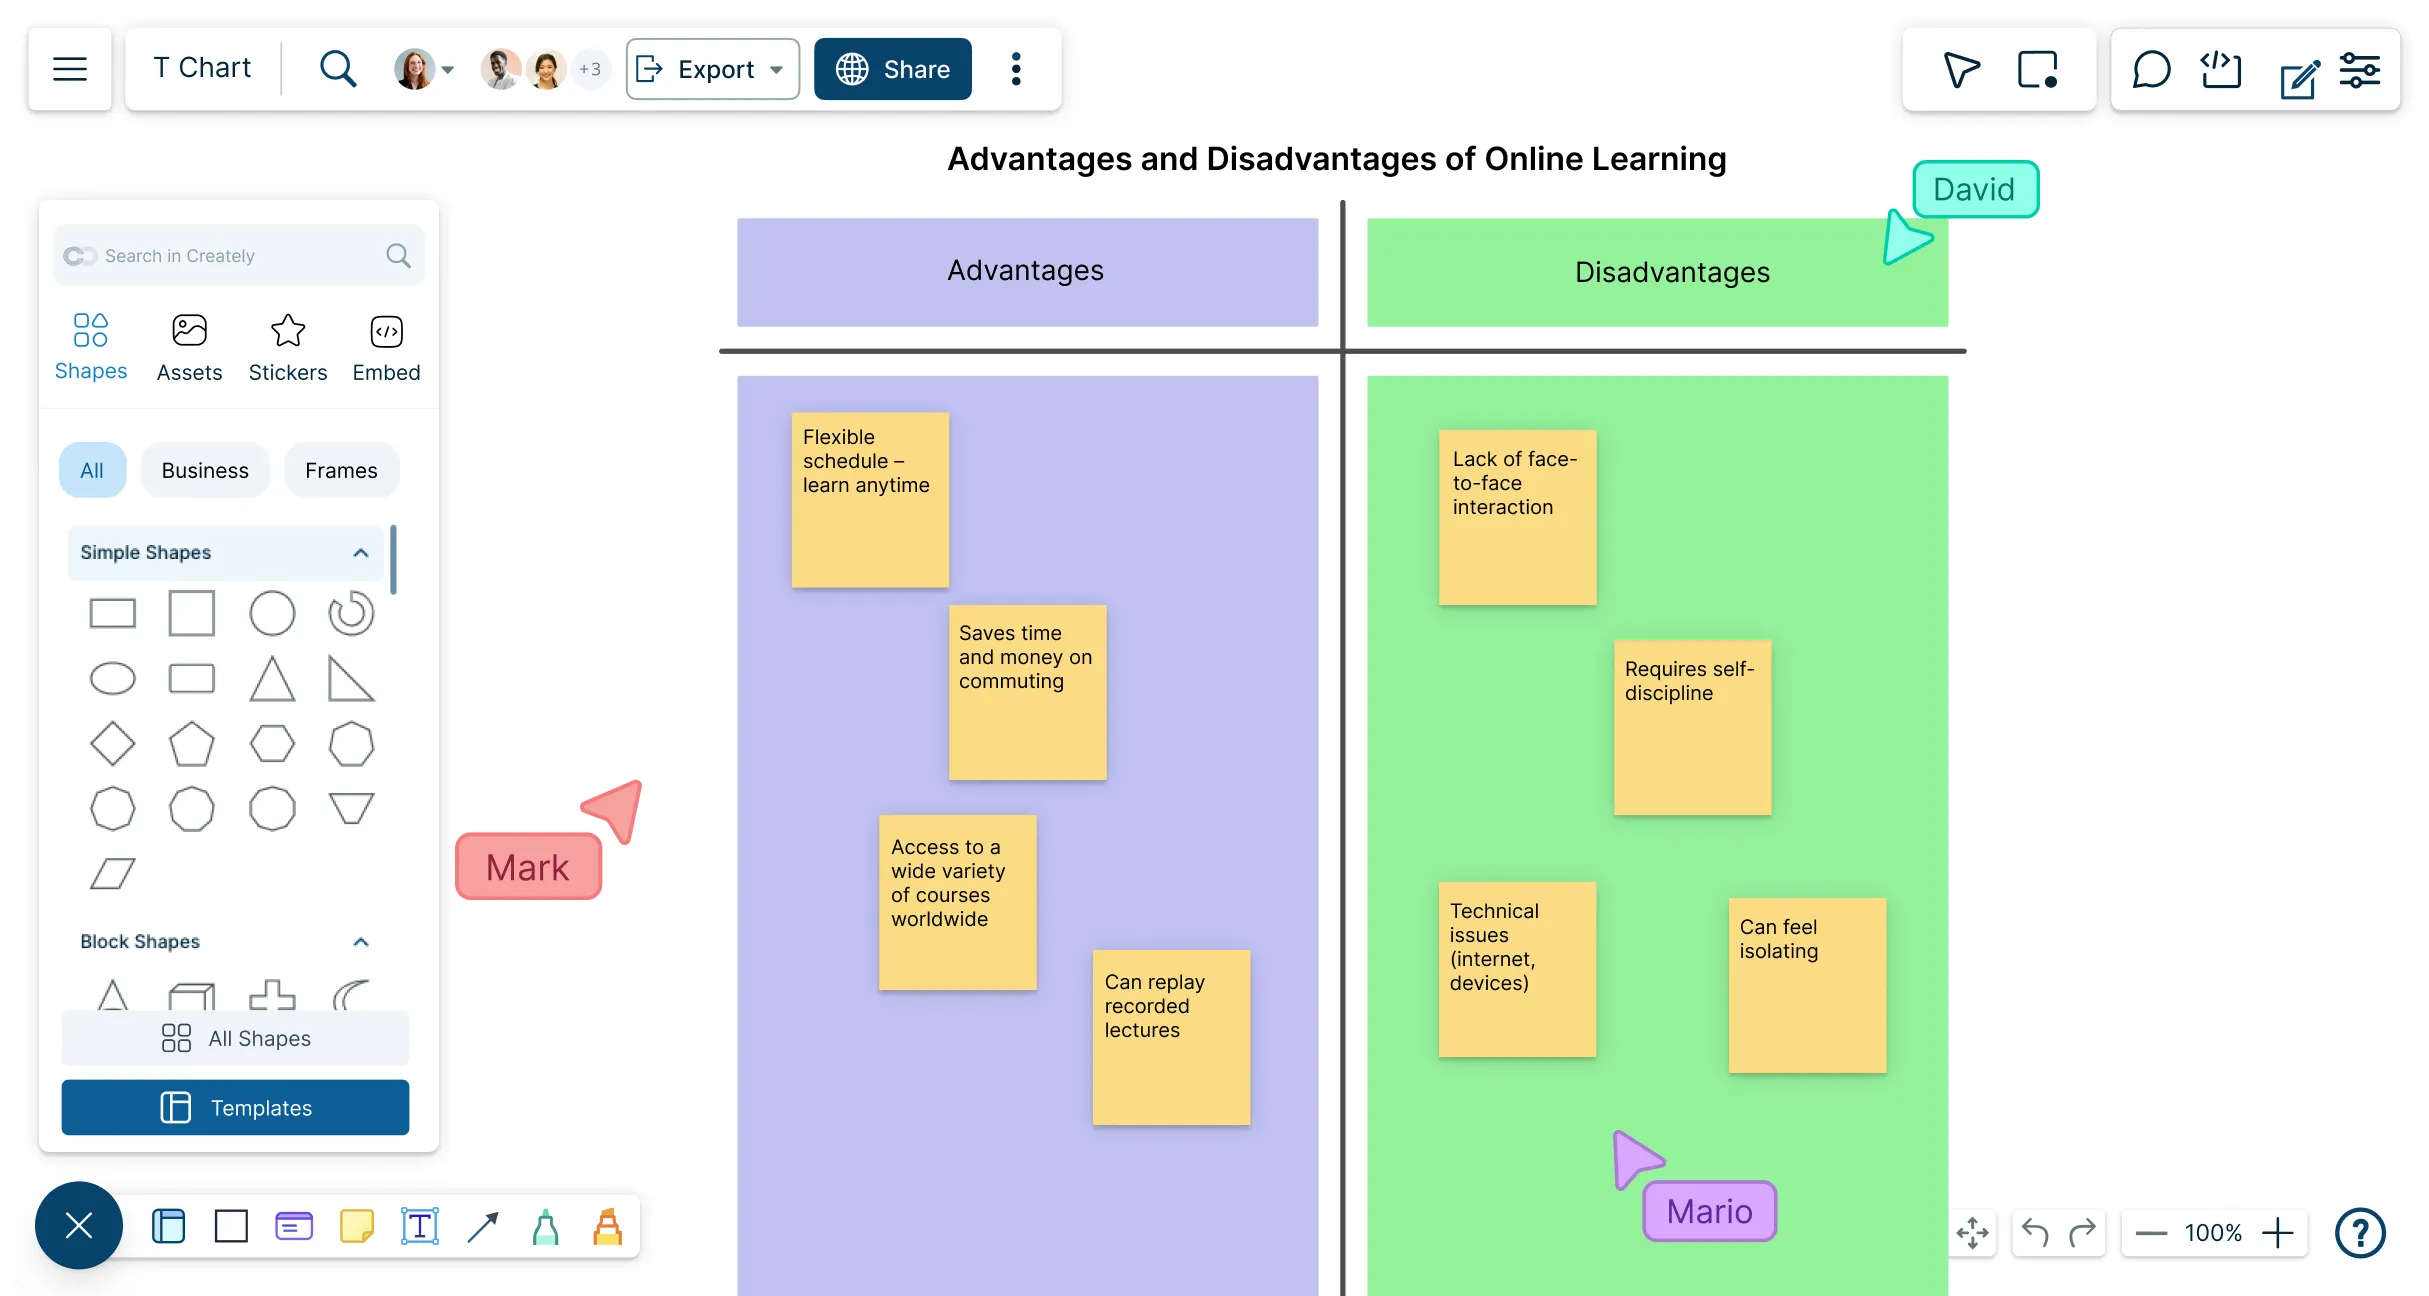
Compare and contrast opposing views, including facts vs. opinions, advantages vs. disadvantages or strengths vs. weaknesses, with our free intuitive T chart creator.
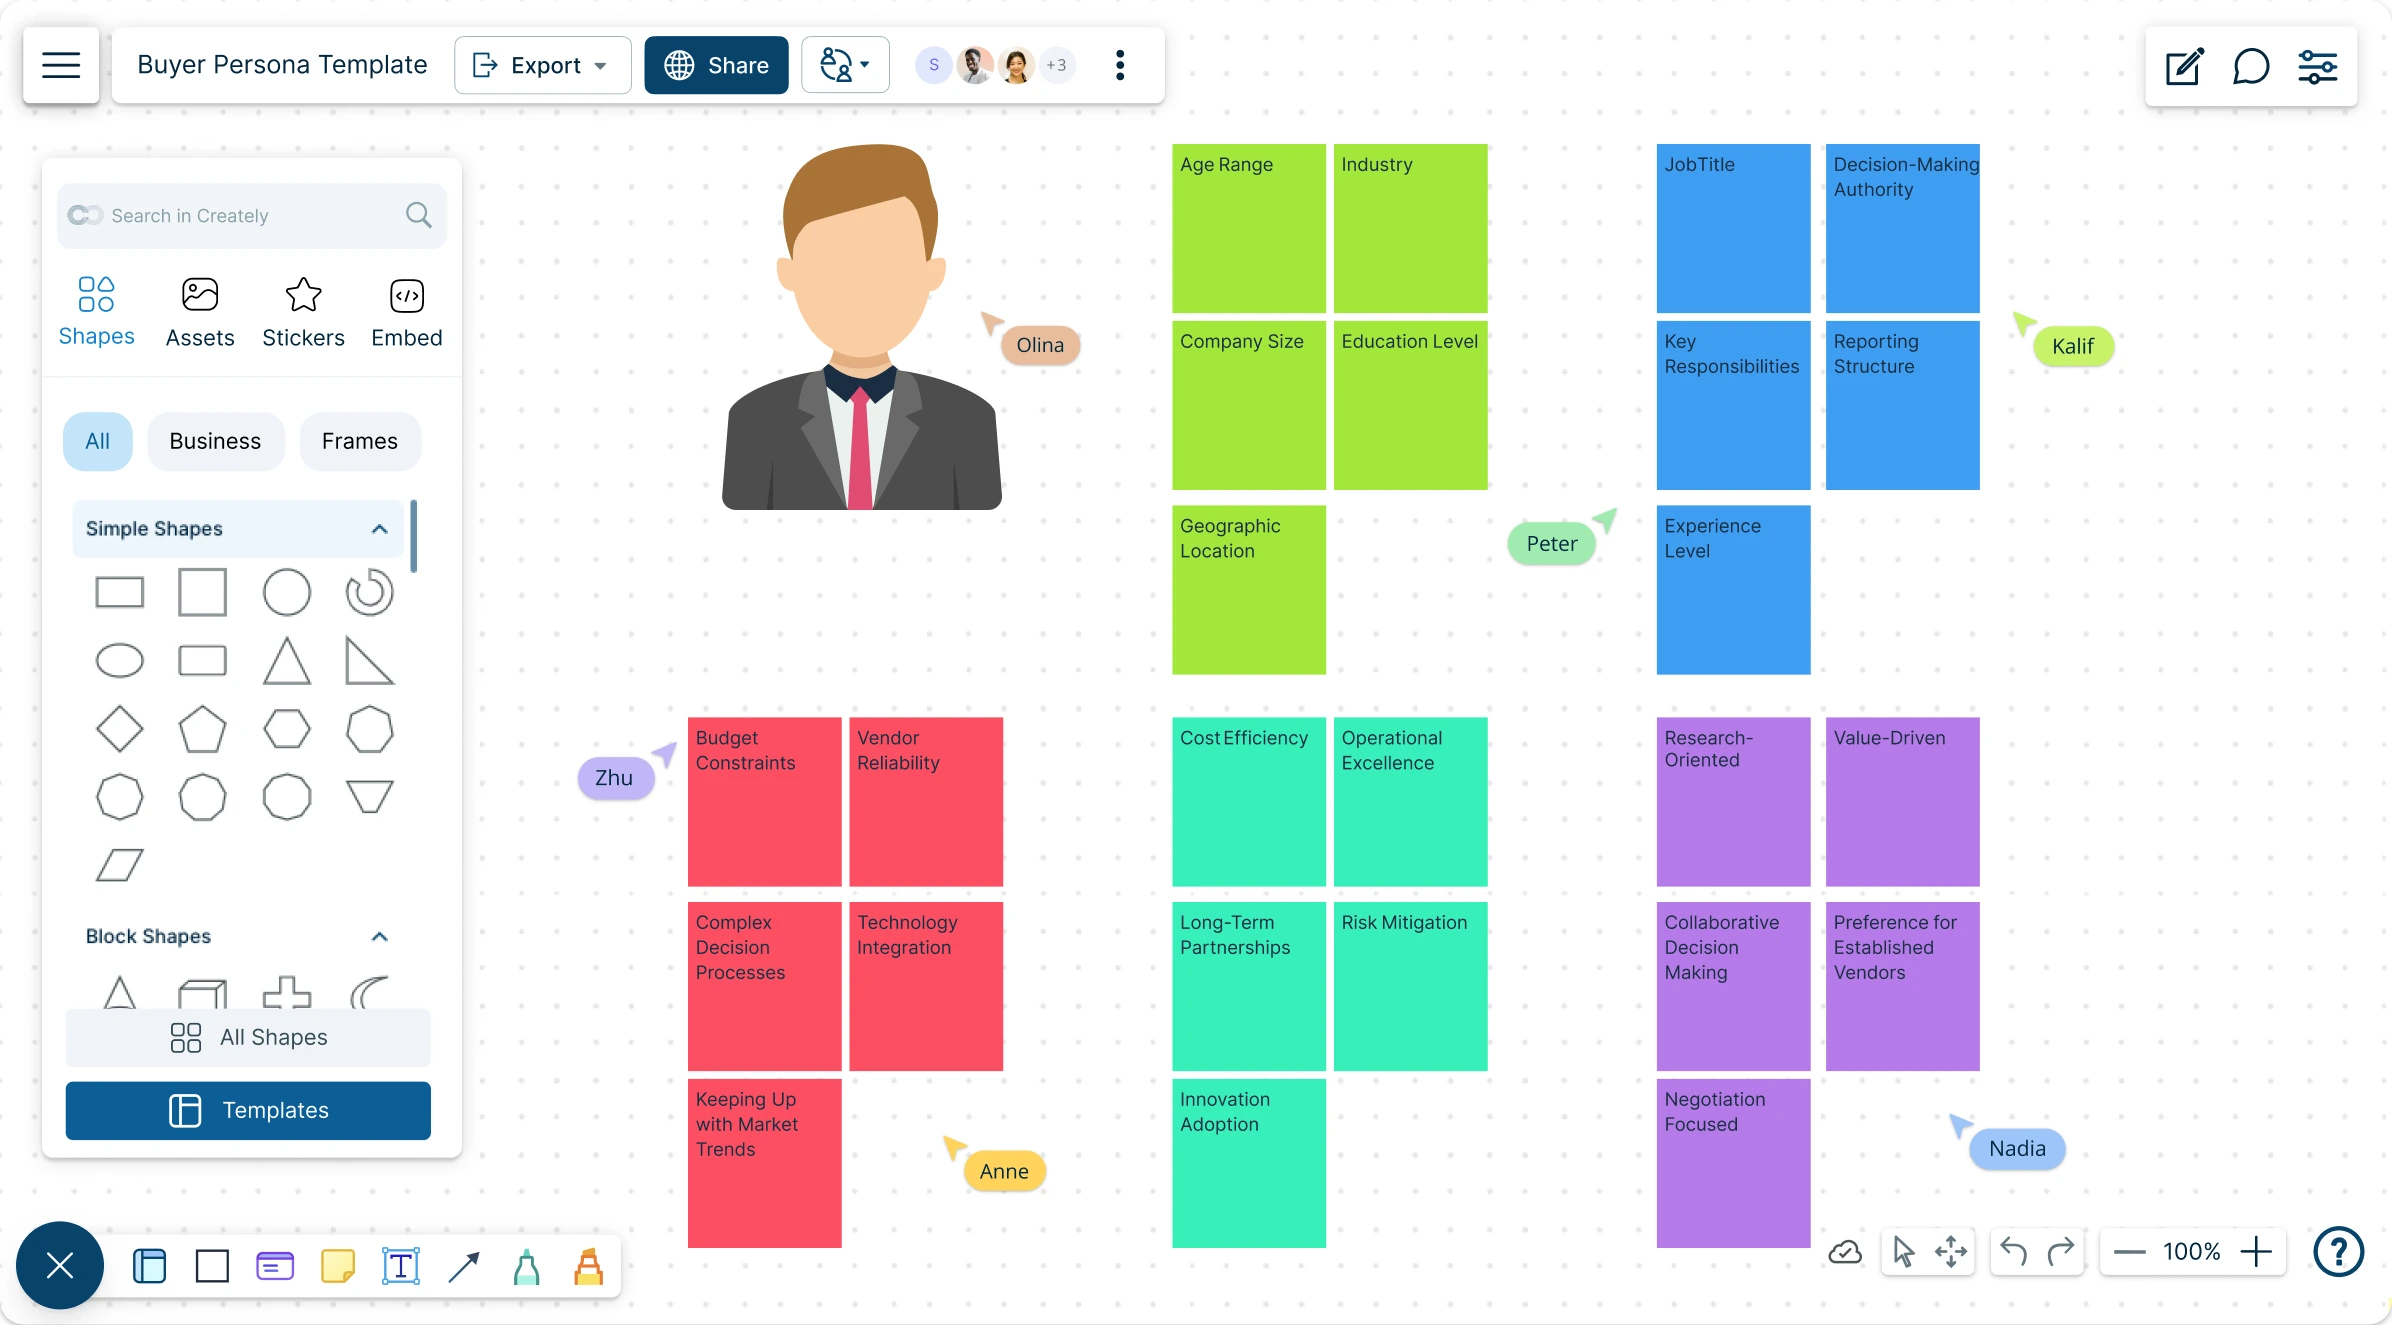
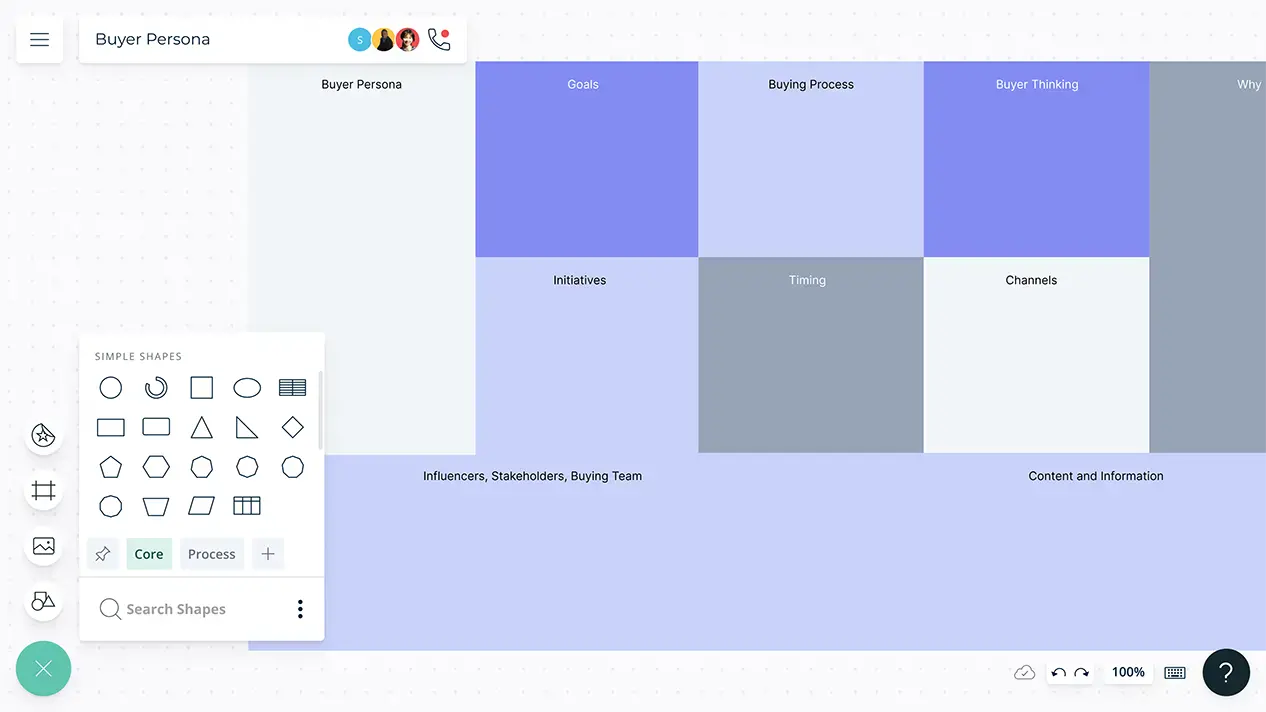
Build detailed buyer personas with ready-to-use templates to understand your ideal customers and align teams.
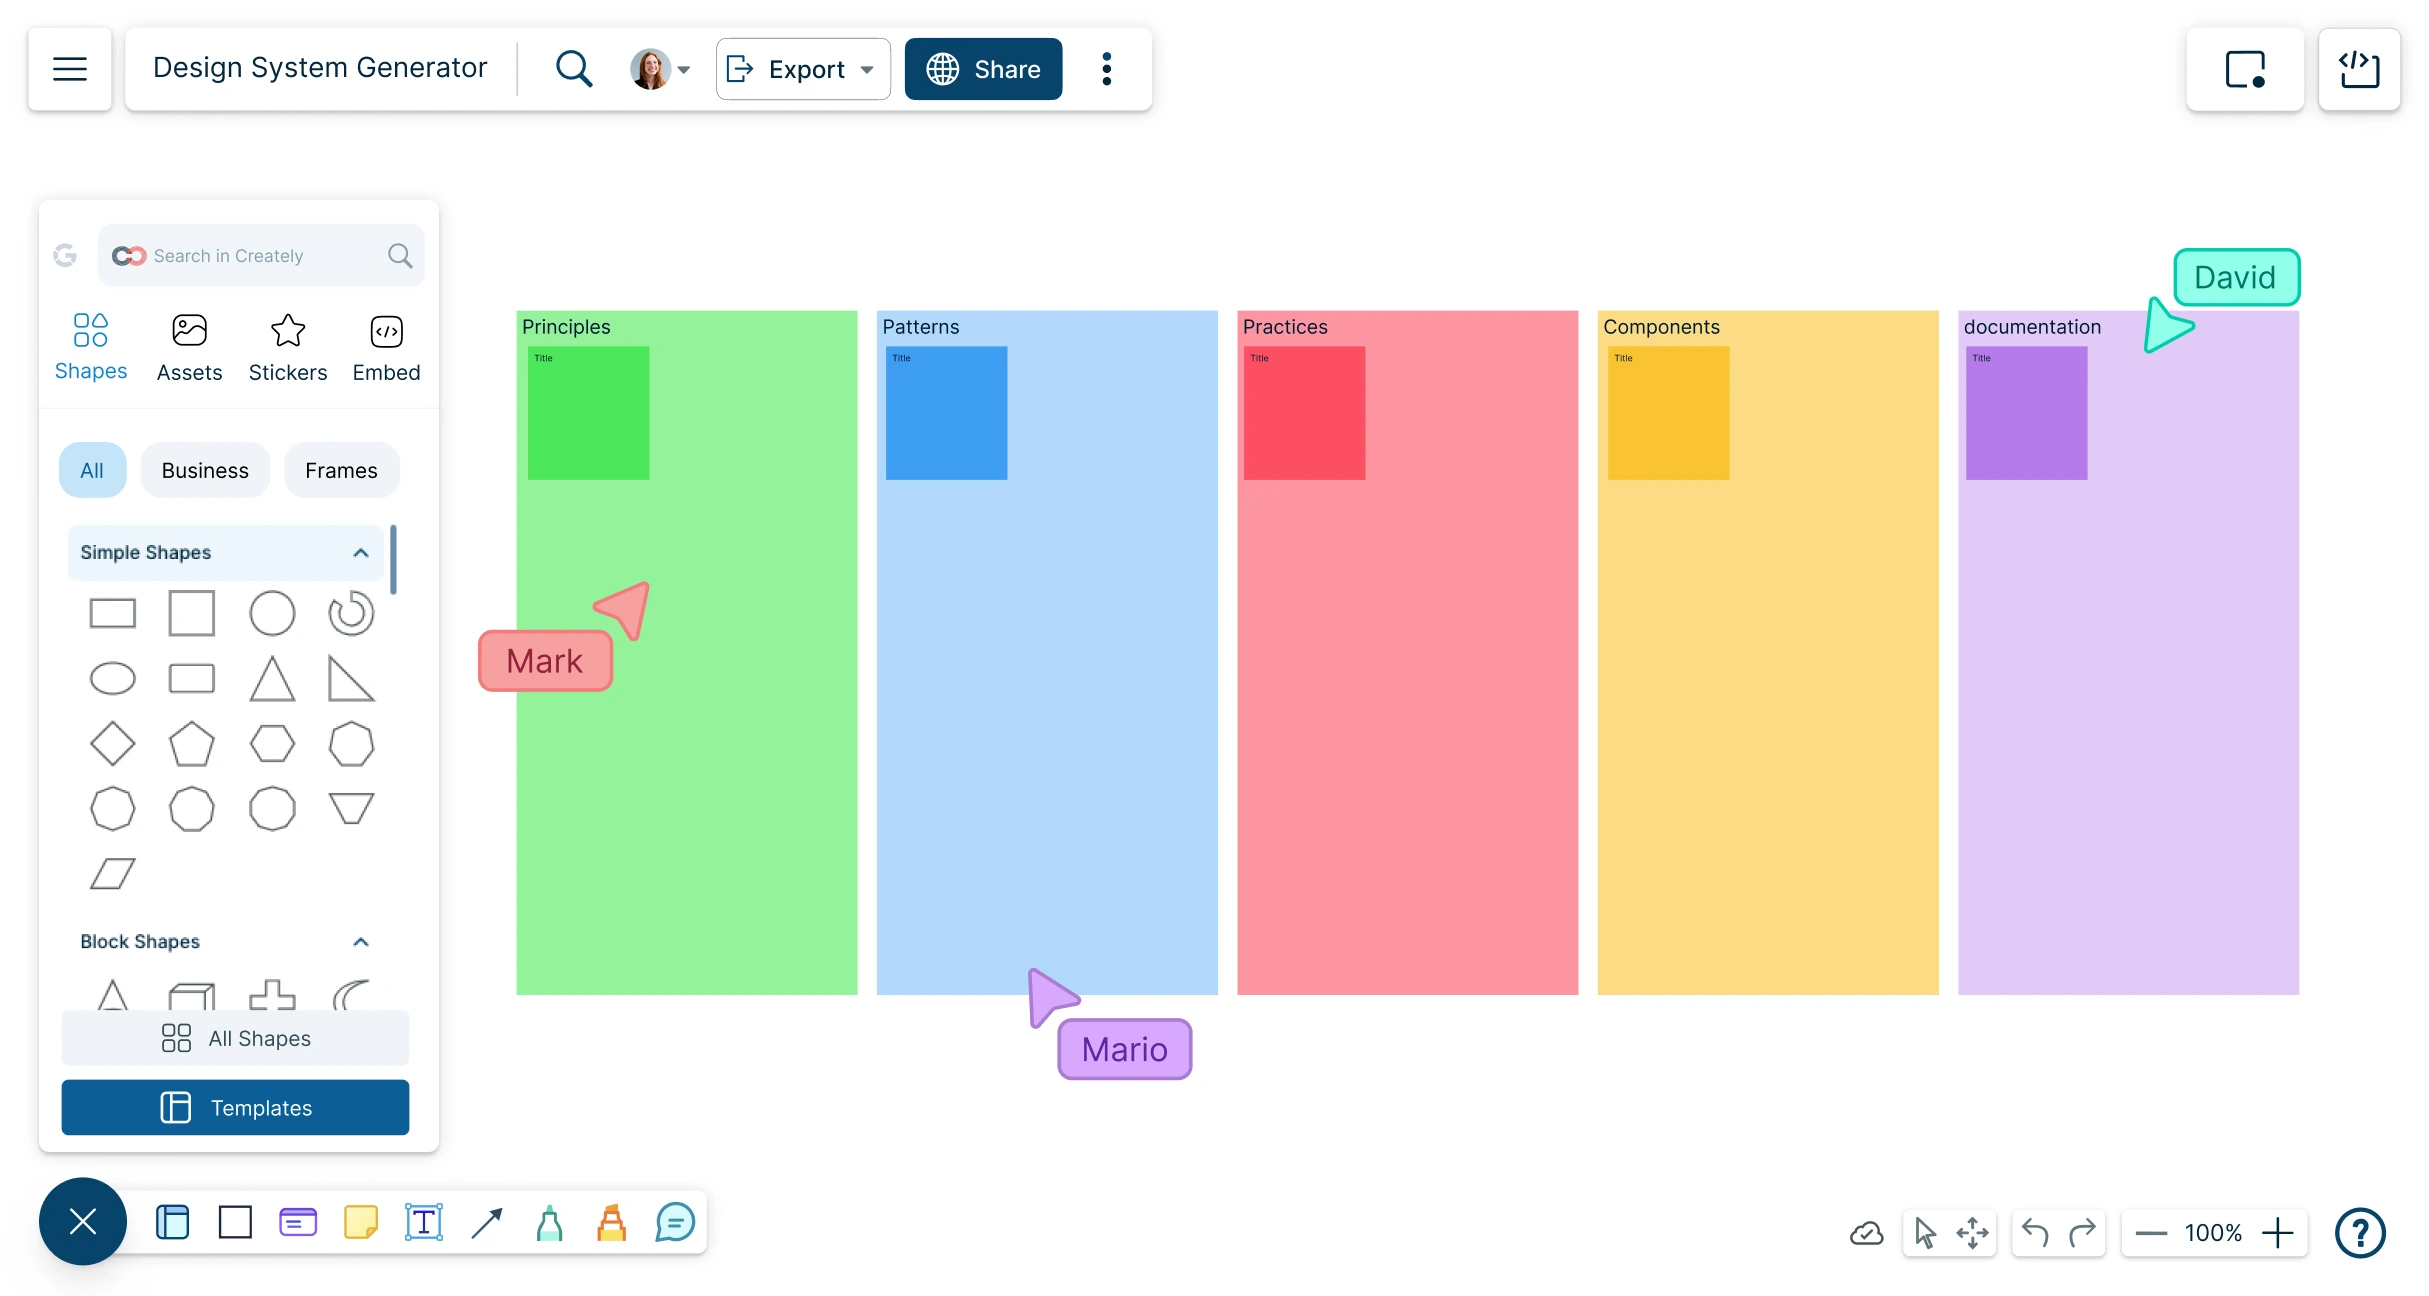
Powerful visual design system generator to create, manage, and scale design tokens, UI components, and documentation—all in one responsive collaborative workspace.
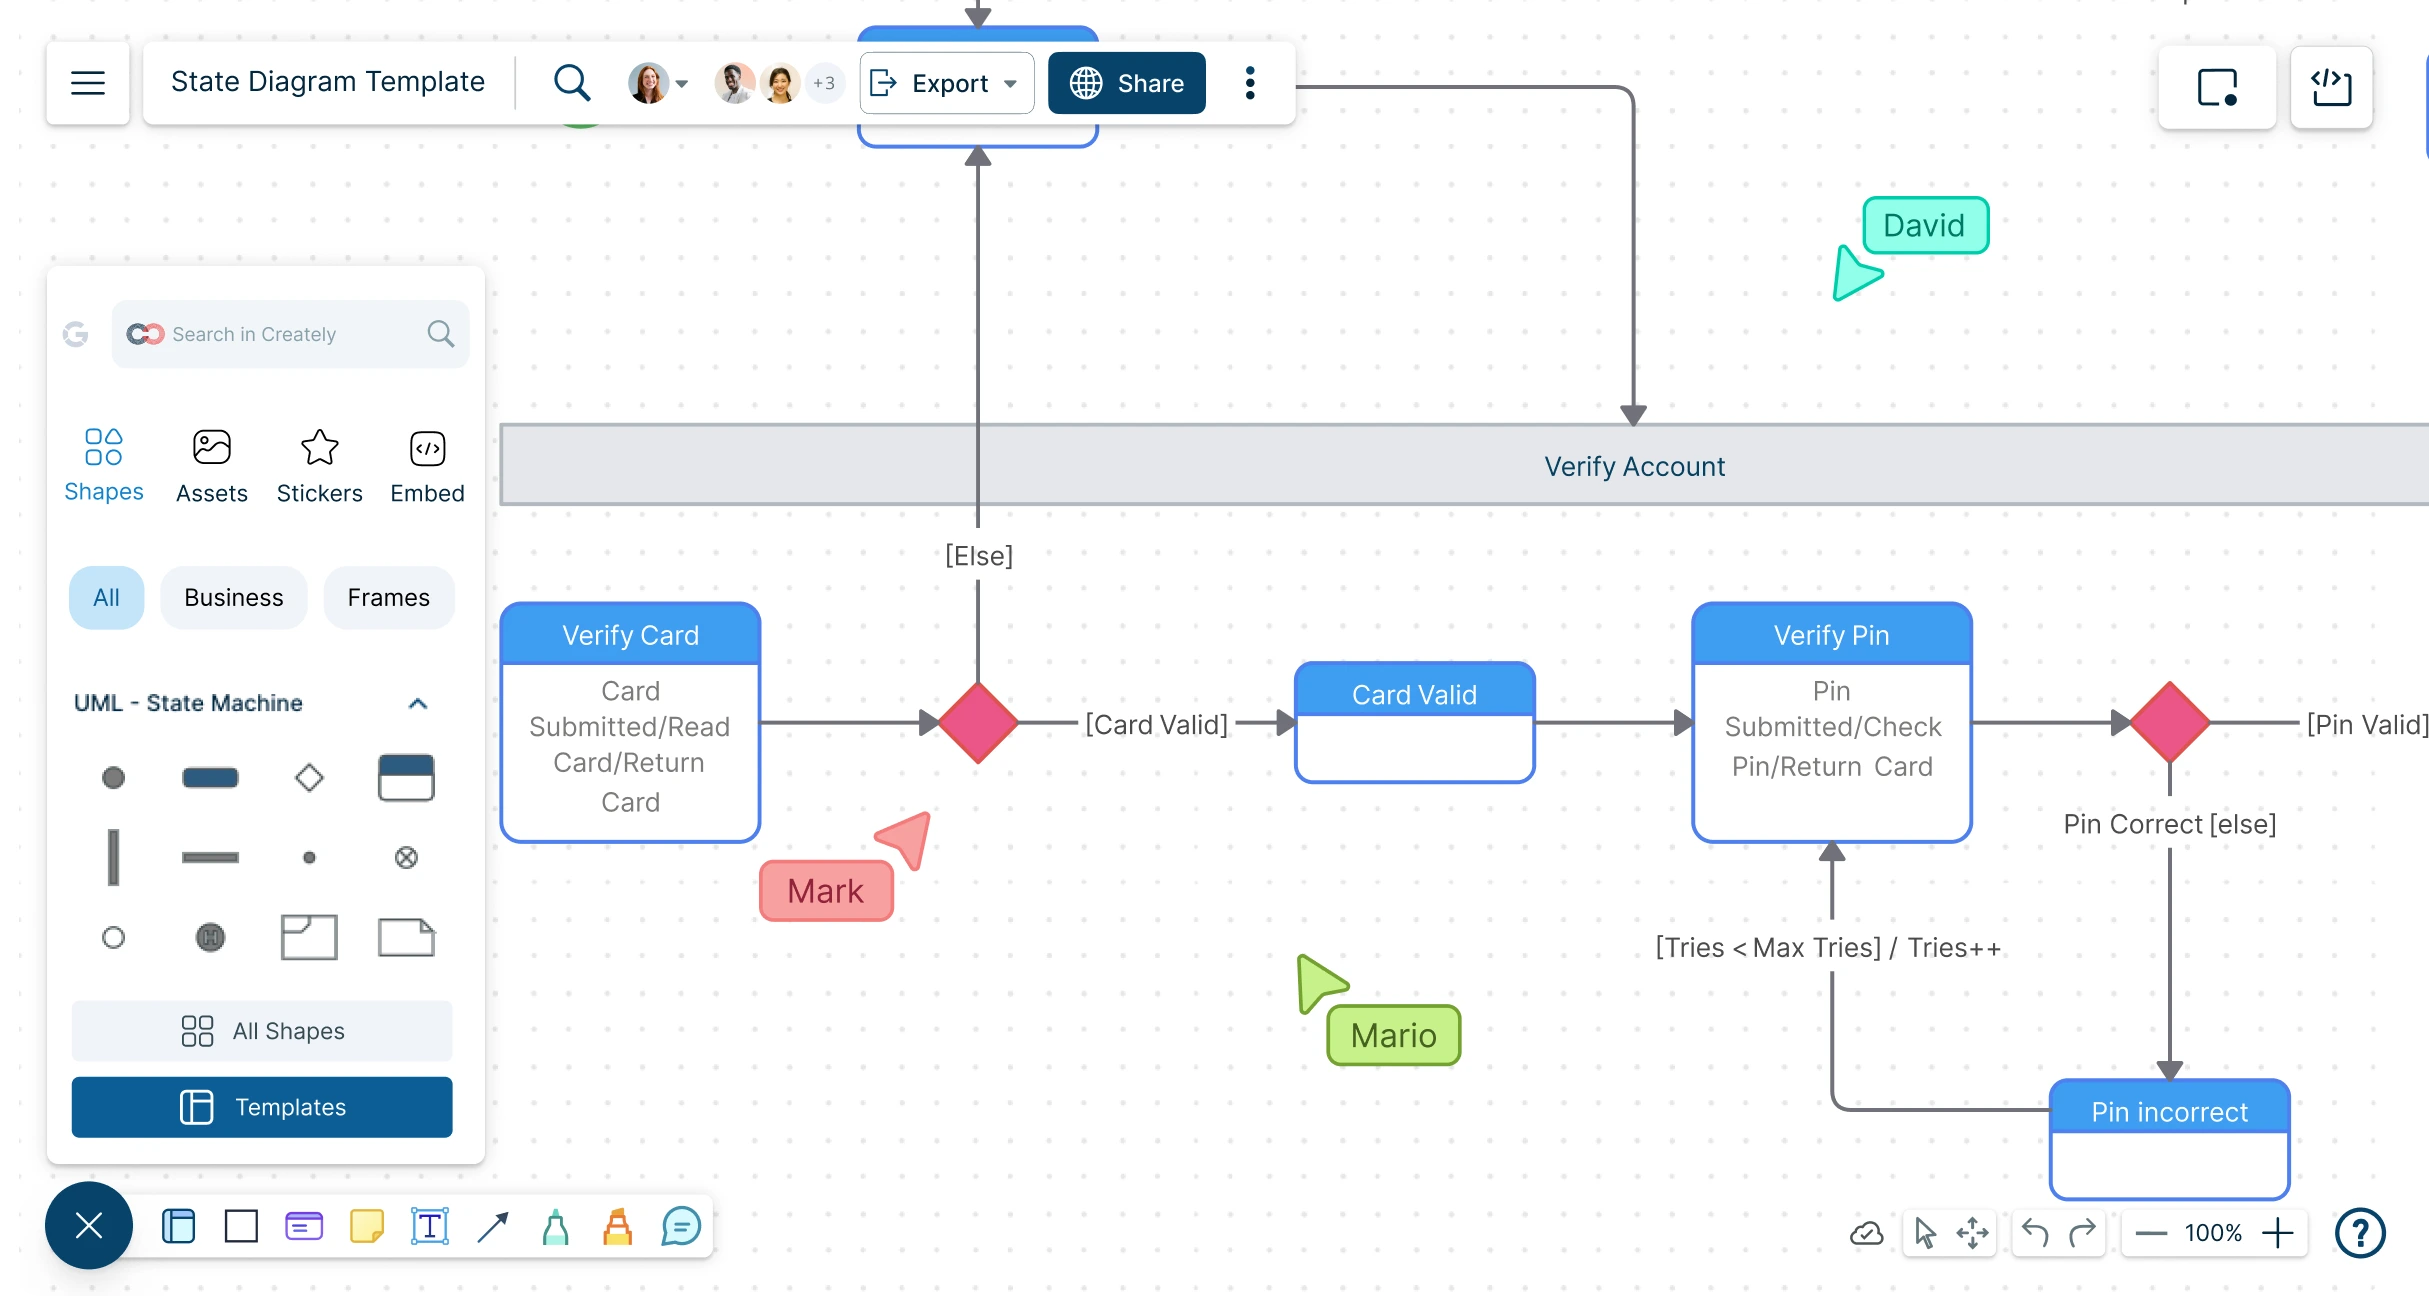
Easily illustrate the dynamic states of any complex system in just a few clicks. Create the best state diagrams online to convey an object’s responses to various events and the influence of its past states. Ideal state machine diagram generator supporting accurate modeling of real-world systems.
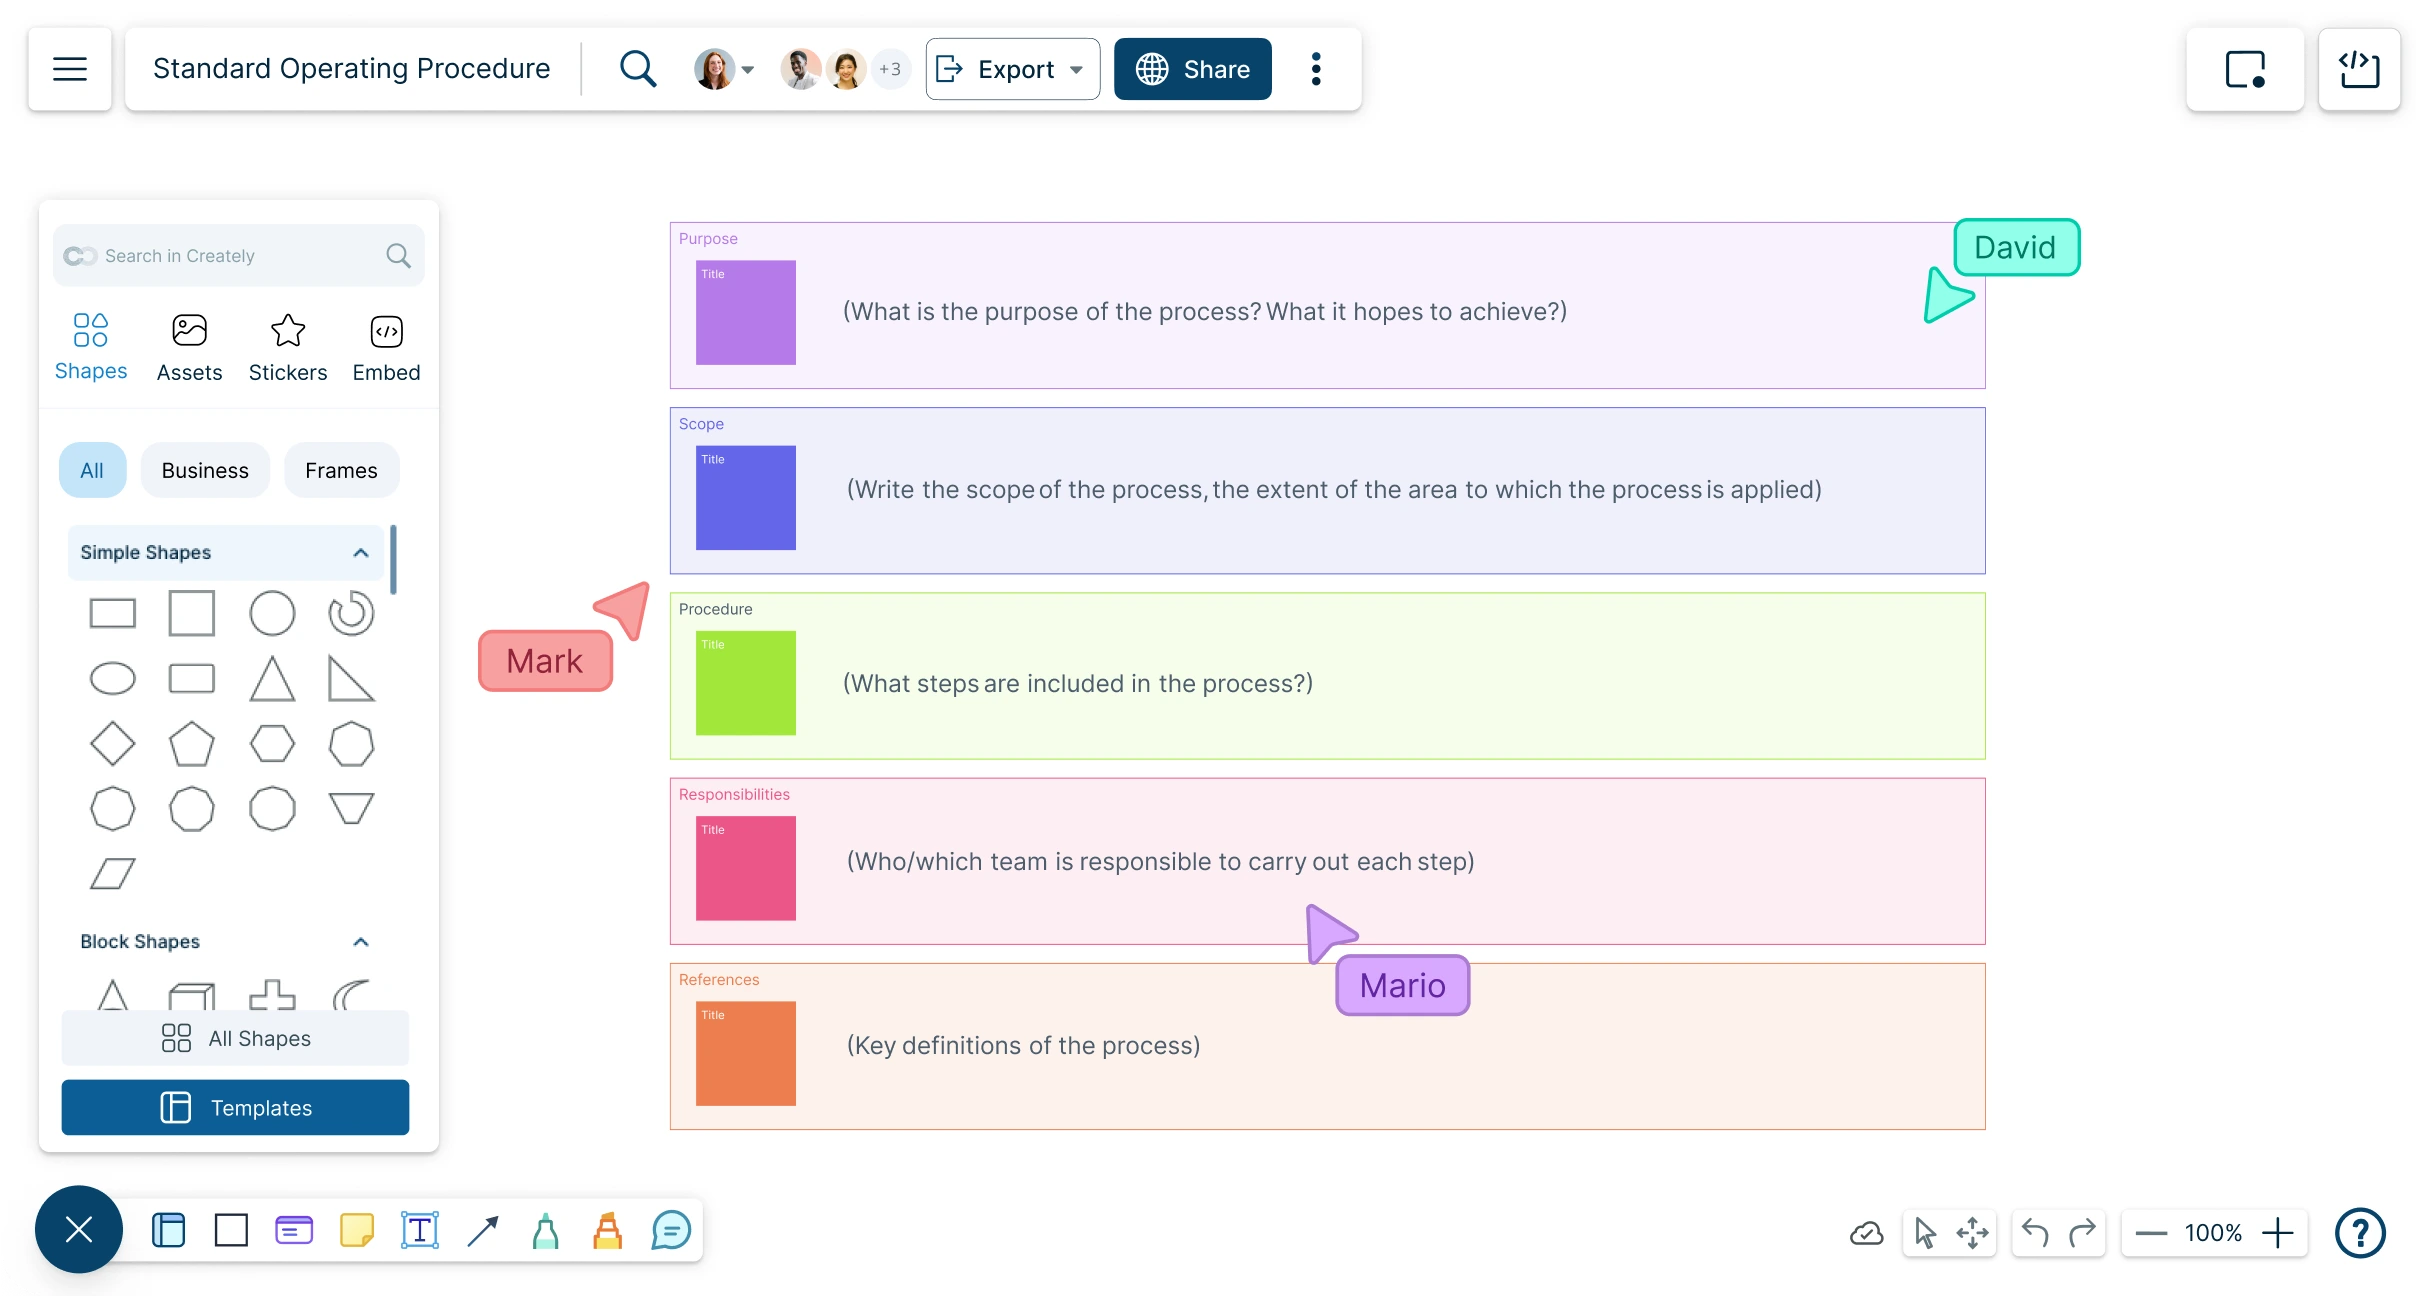
Create structured, ready-to-use standard operating procedures effortlessly with Creately’s AI Powered SOP generator.
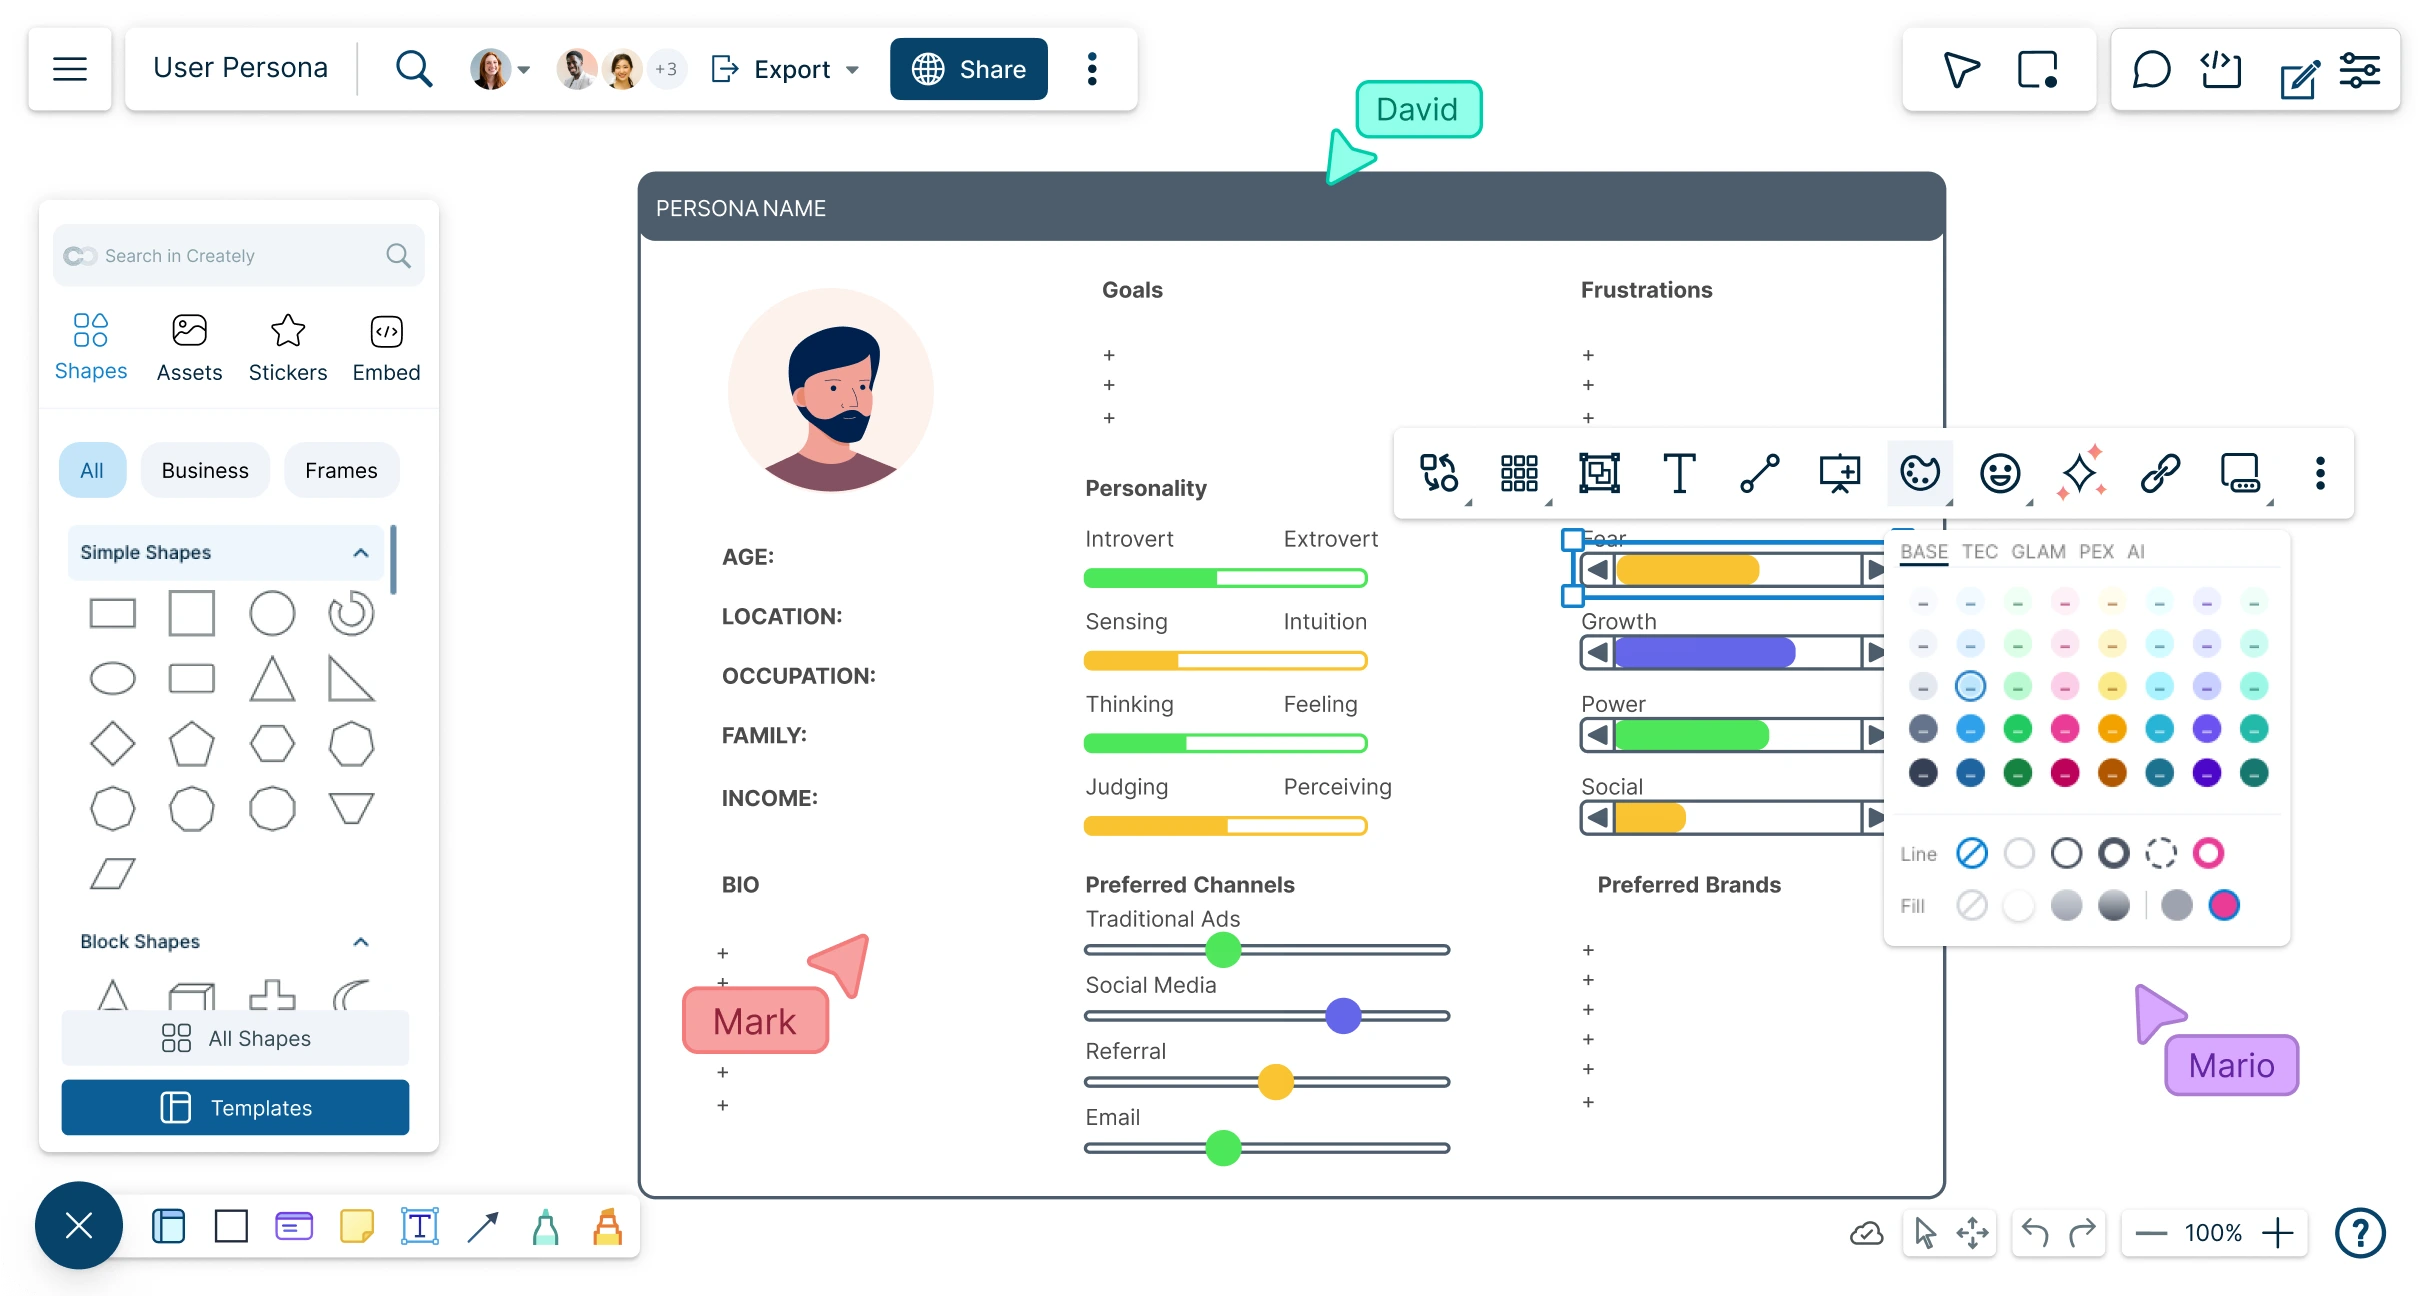
Visually represent customer archetypes and uncover behaviors, goals, and pain points with Creately’s user persona builder.
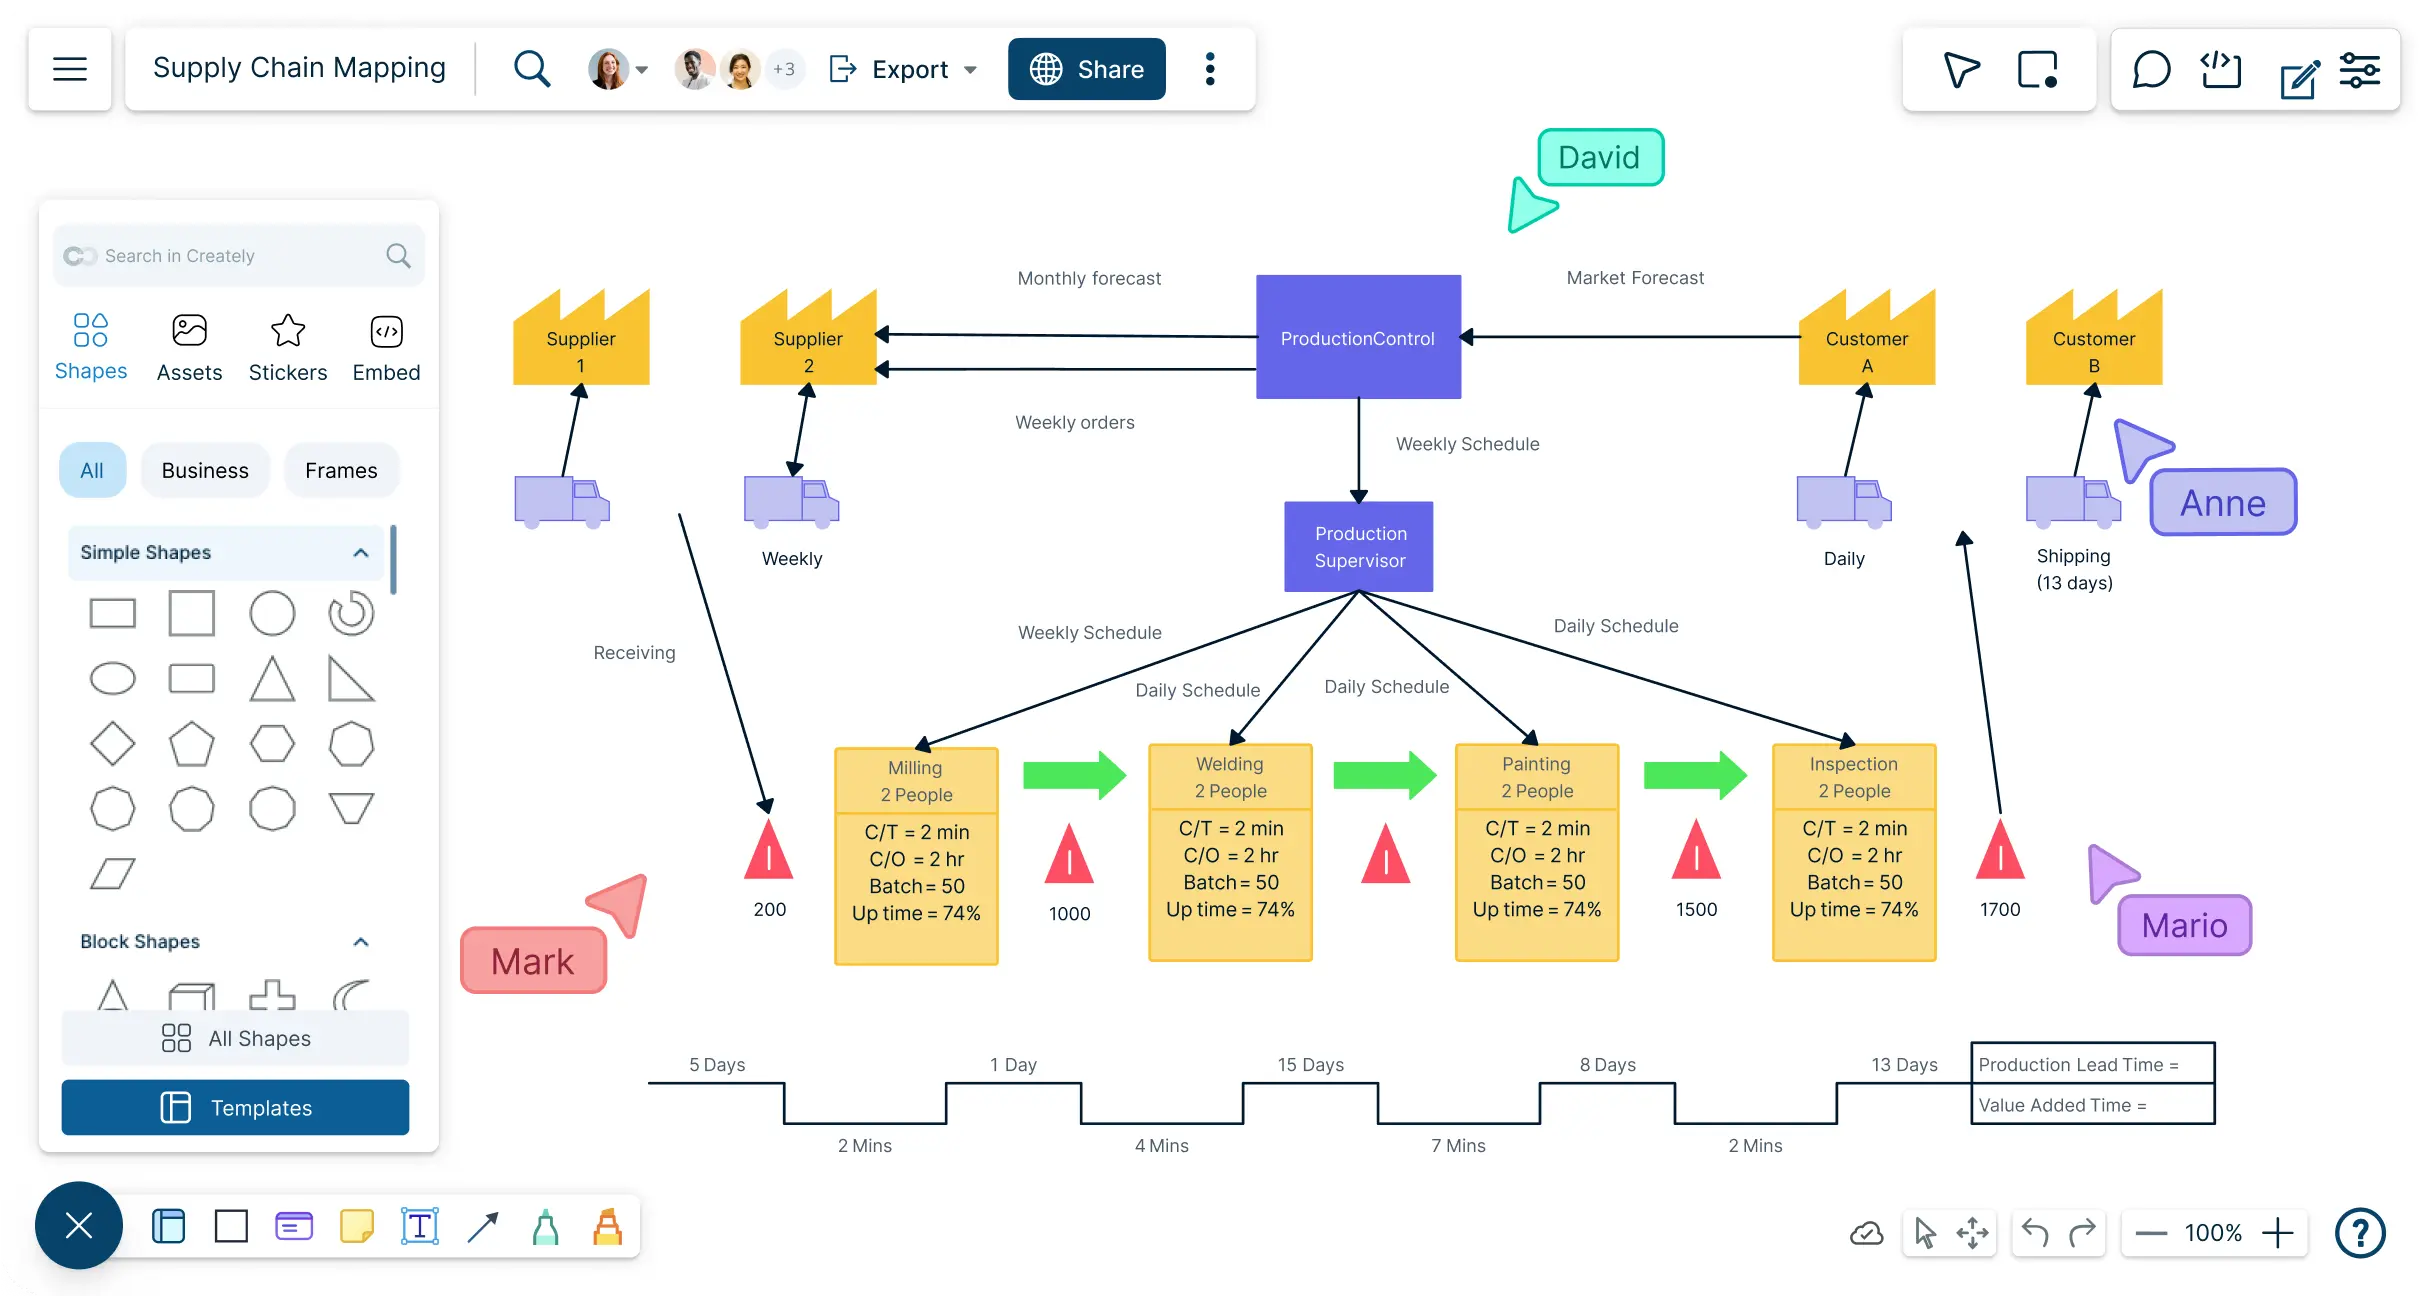
Map, analyze, and optimize your supply chain to identify inefficiencies, collaborate, and create charts that drive smarter decisions.
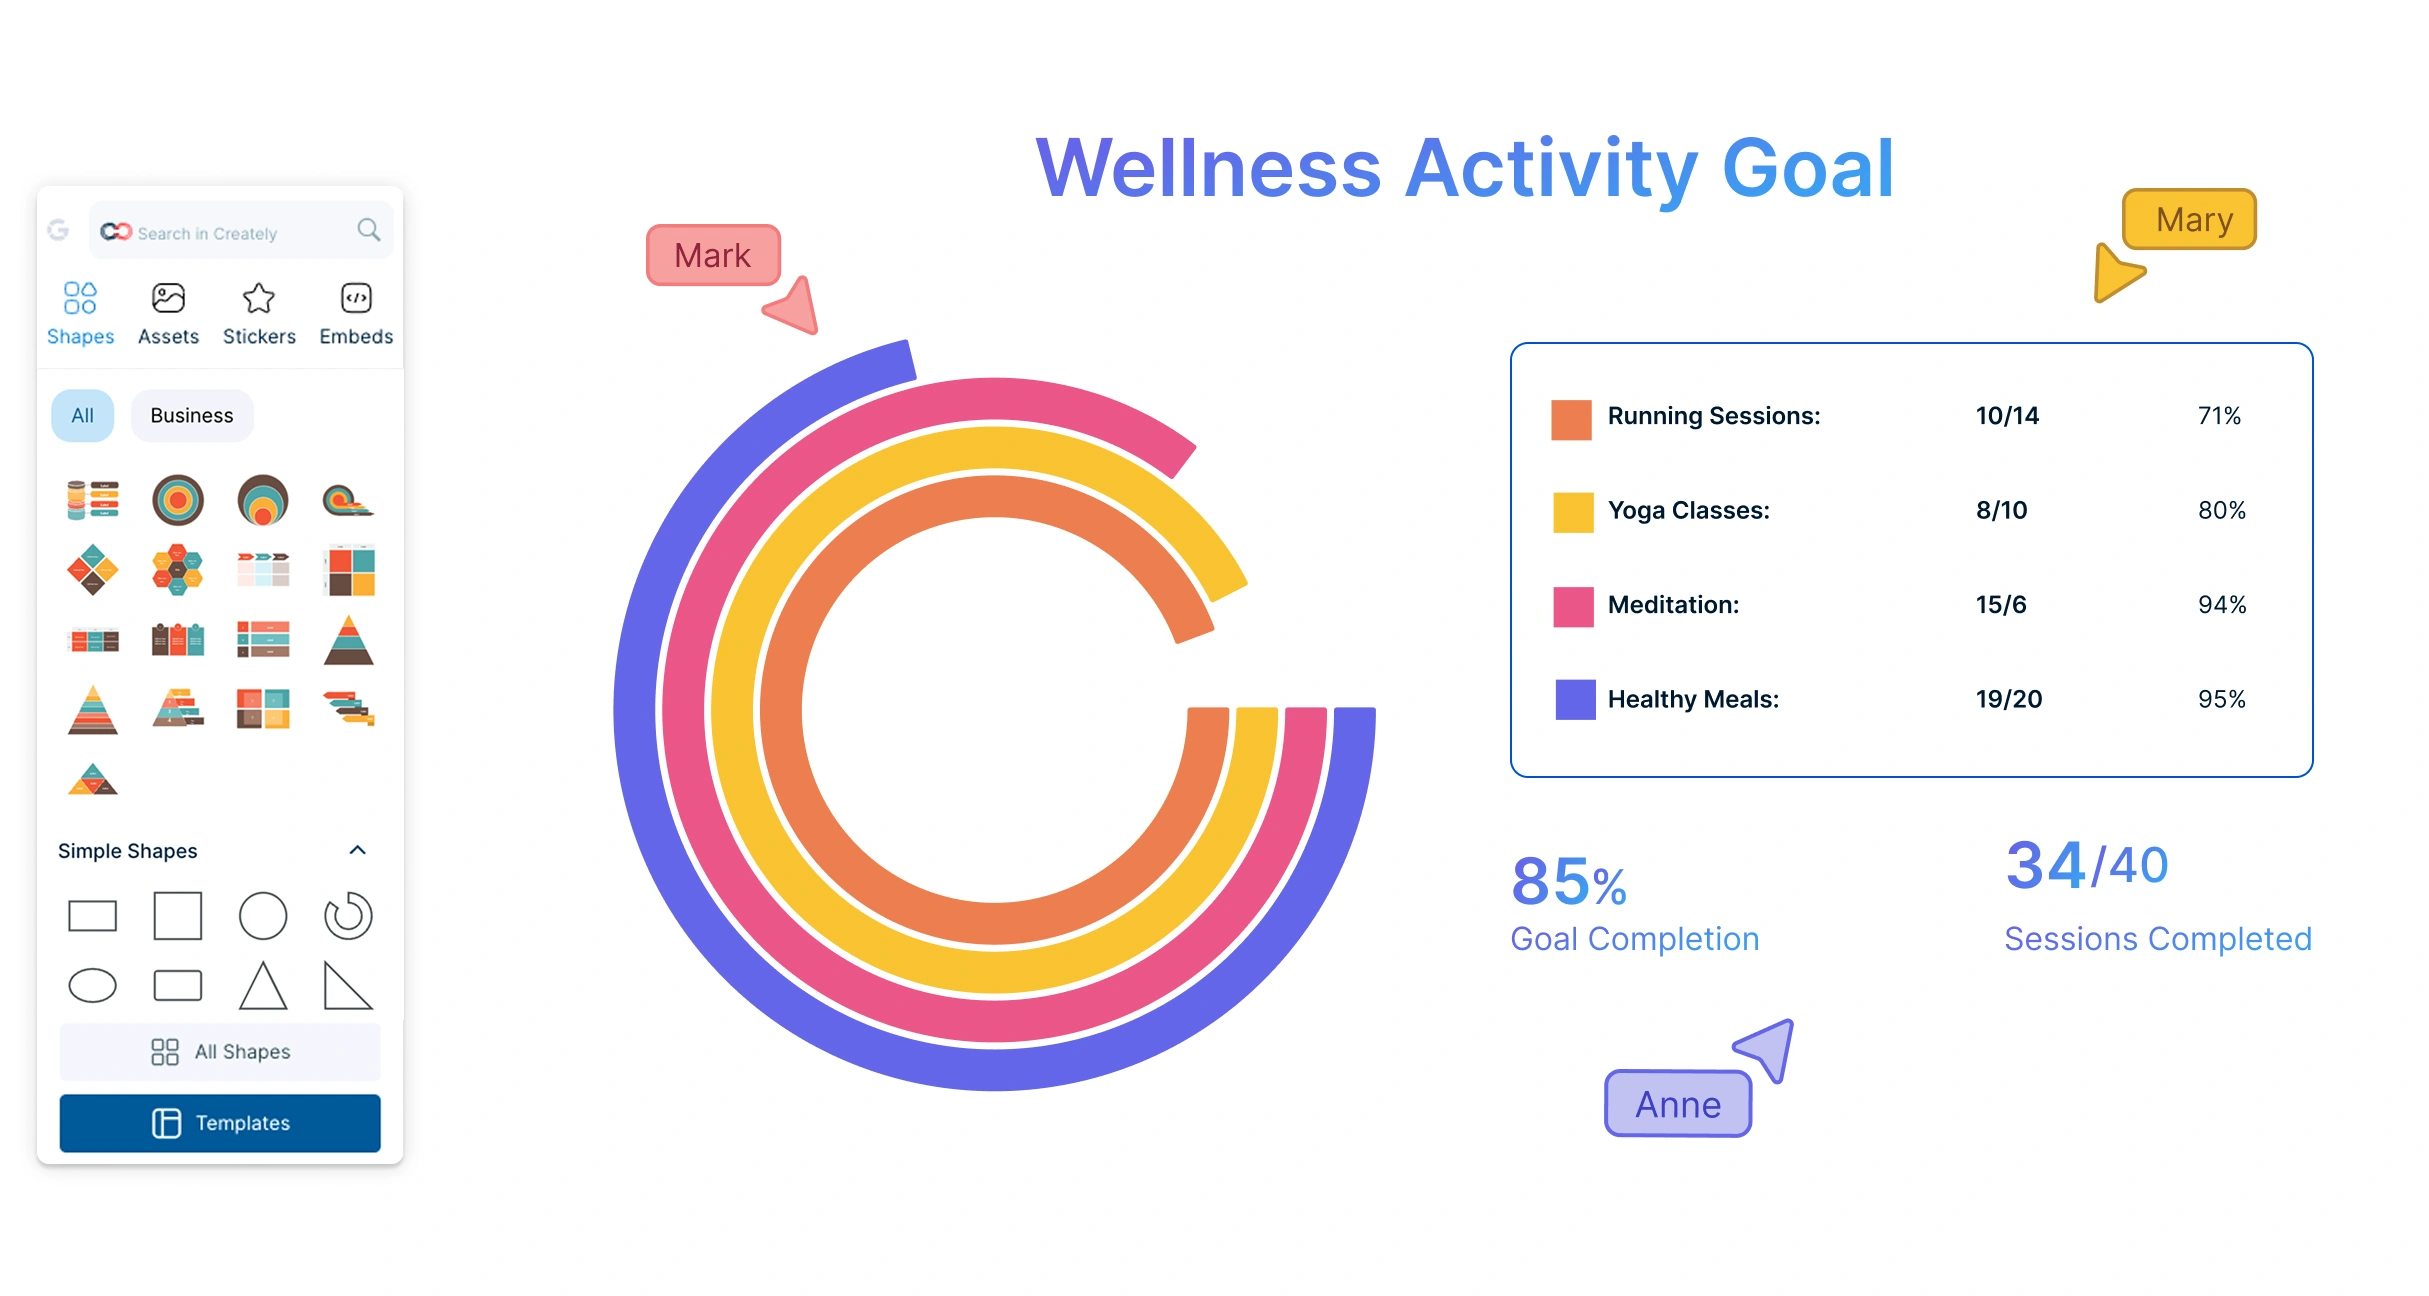
Effortlessly transform your data into visually engaging donut charts. Visualize sales data, project progress, or survey insights with clarity.
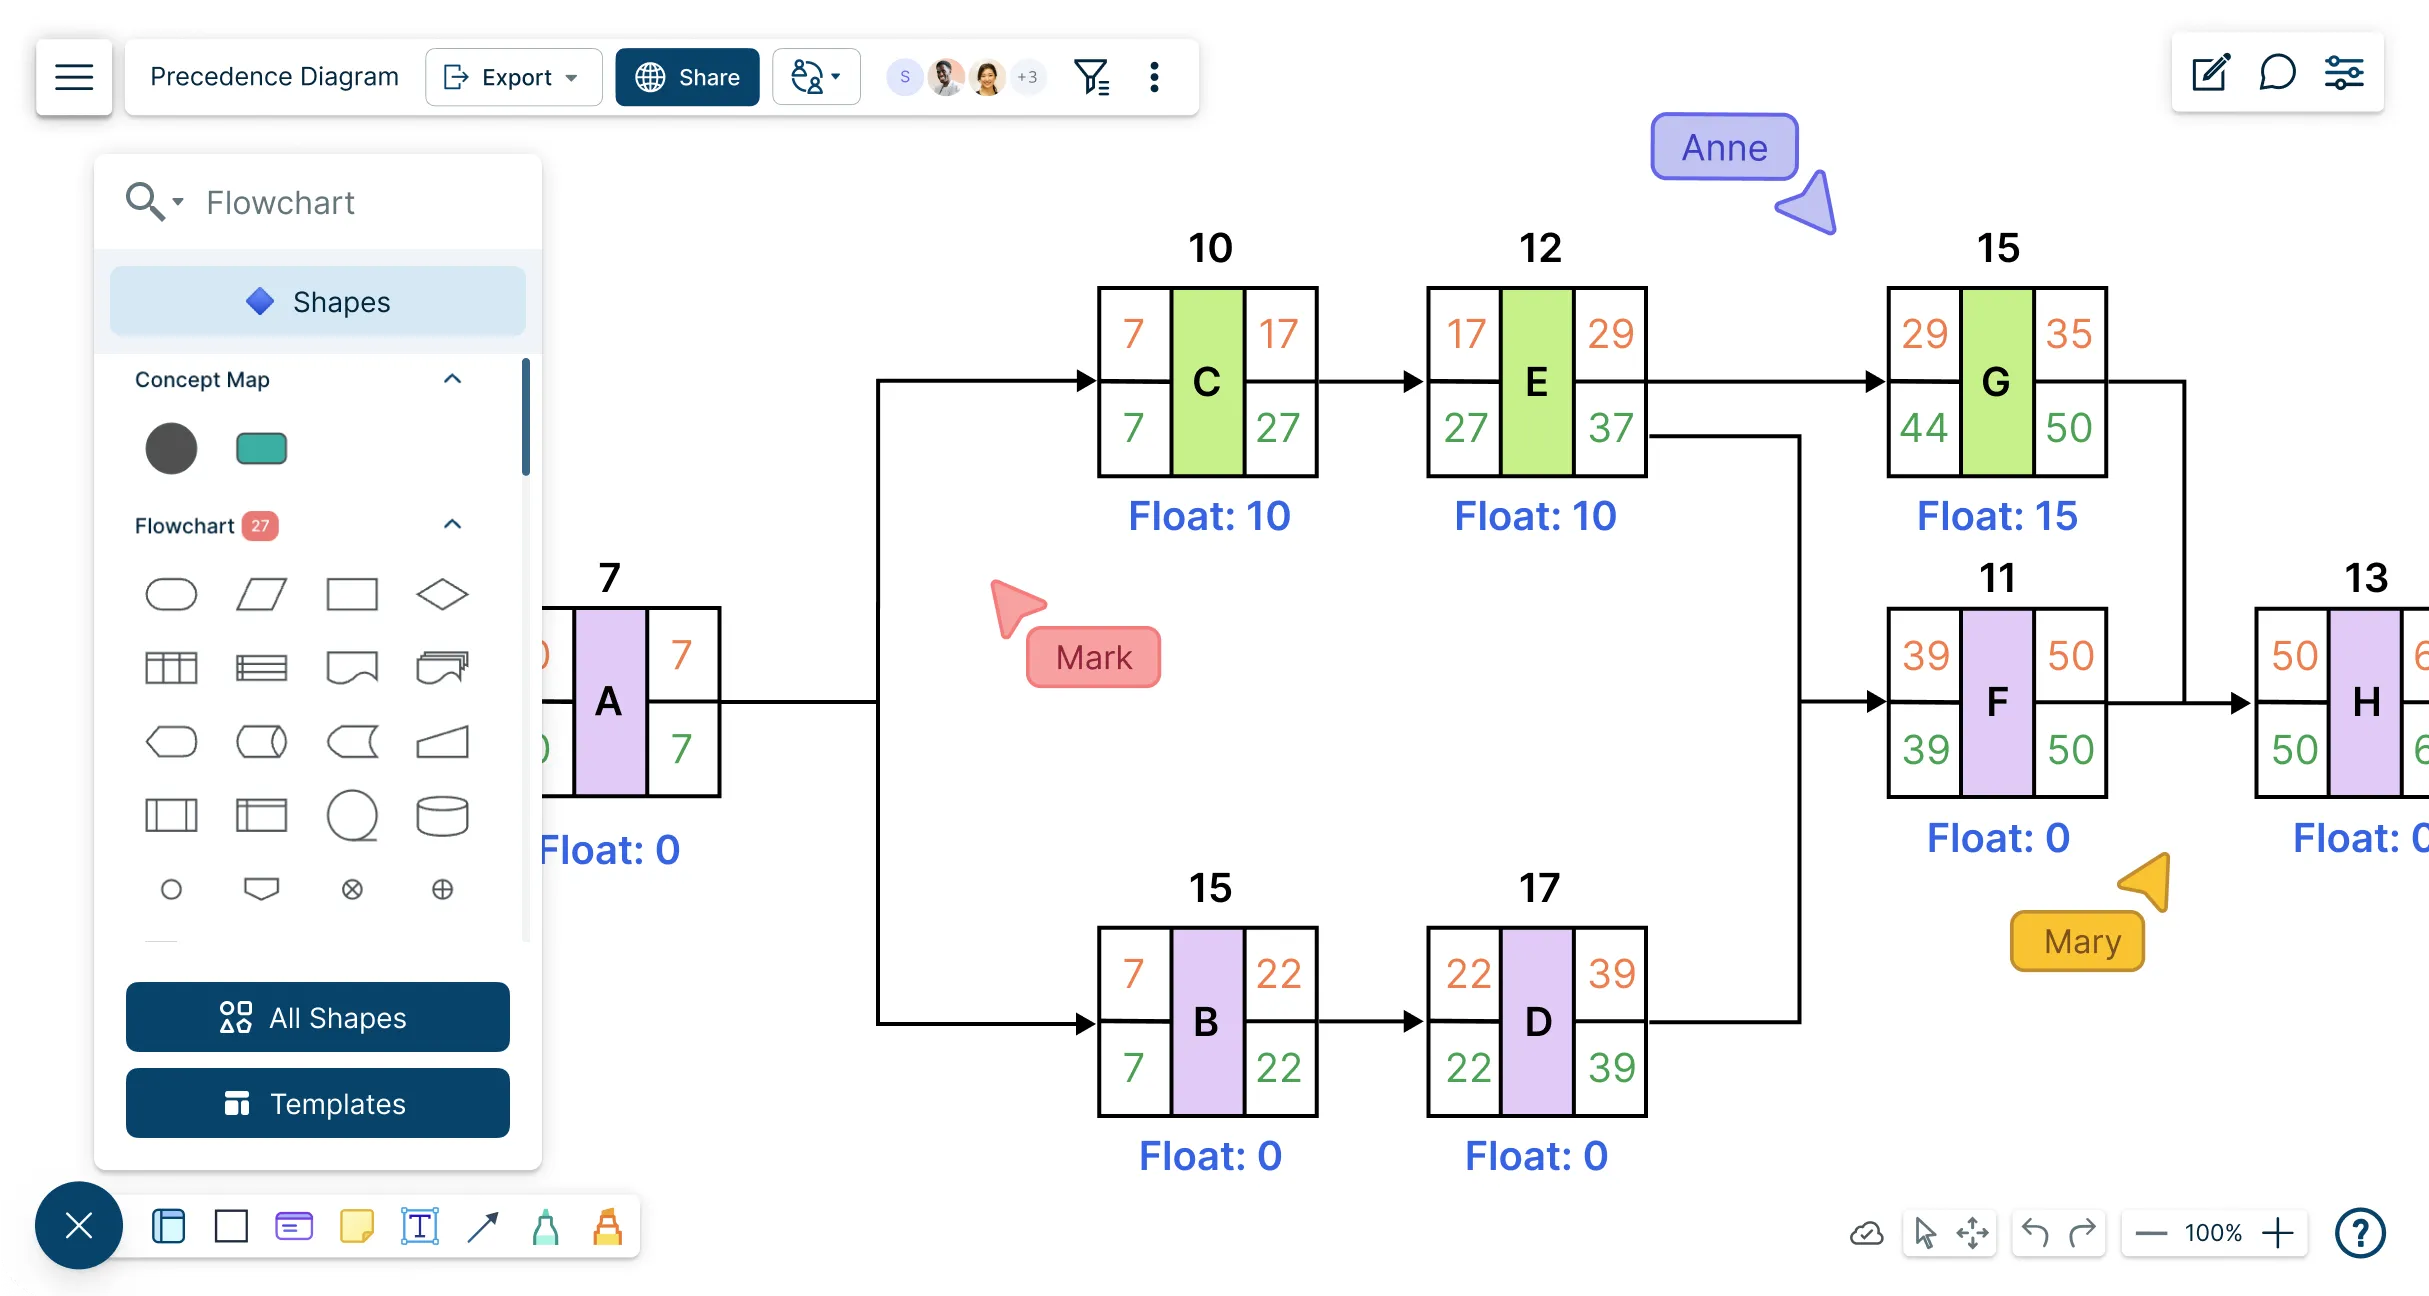
Visually represent project plans, note dependencies and better manage their execution with Creately’s precedence diagram maker.
Easily map tasks, dependencies, and timelines—create, collaborate, and share arrow diagrams in minutes.
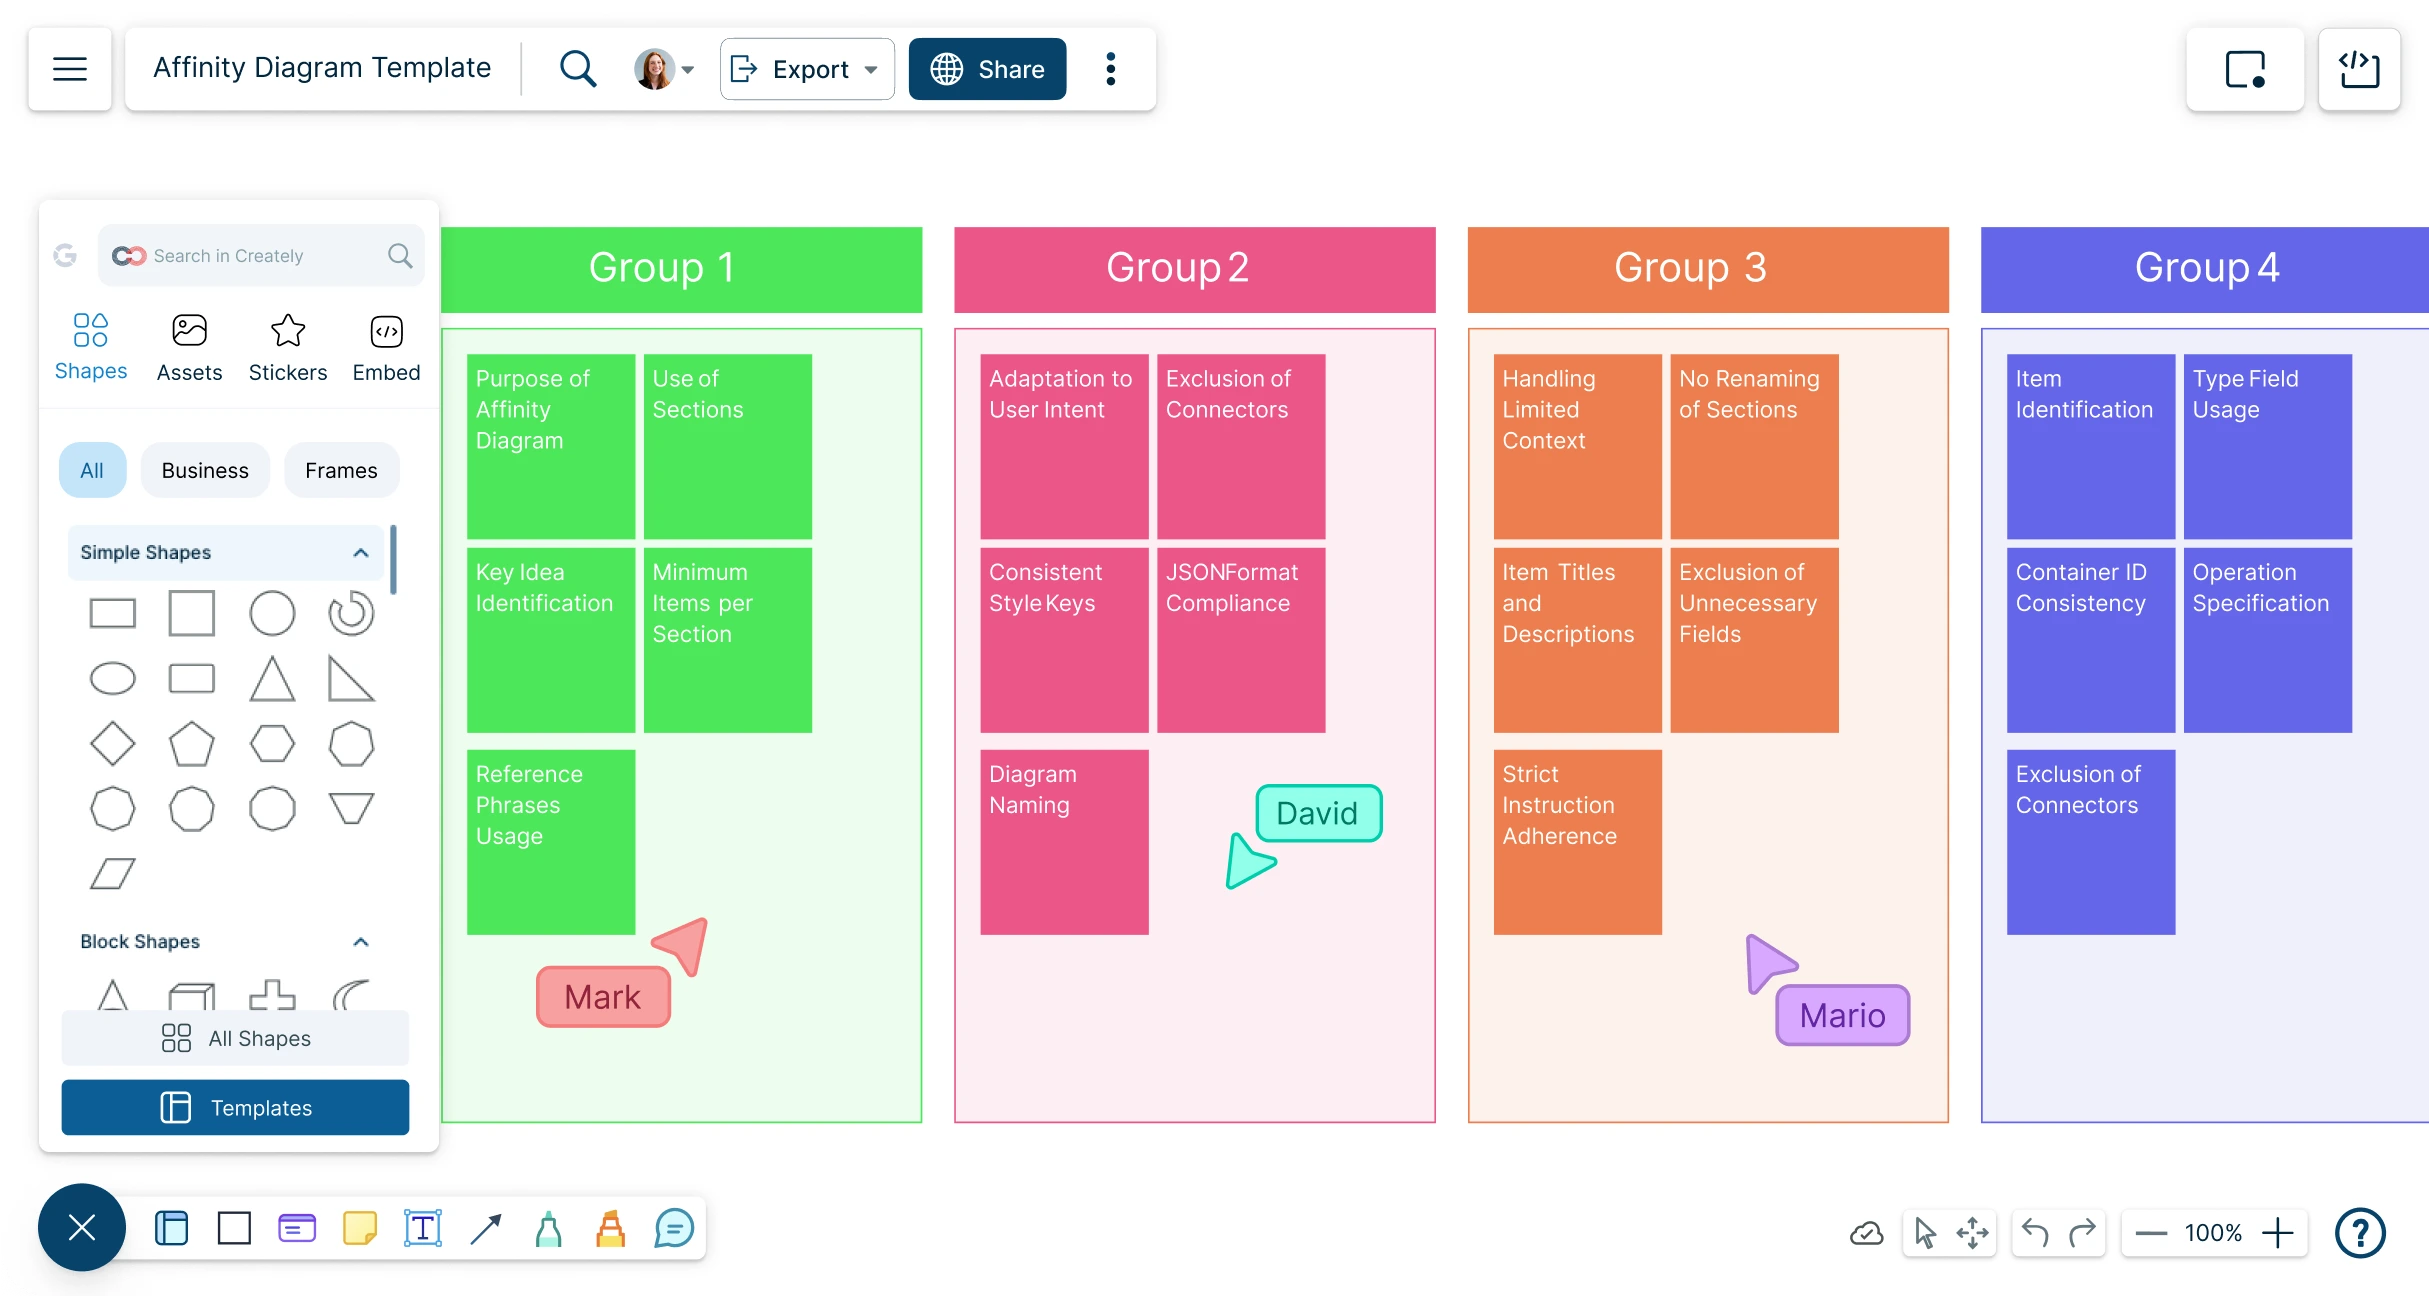
Intuitive affinity diagram tool to visually organize & group large volumes of data, streamline idea clustering, and analysis to support powerful decision-making.
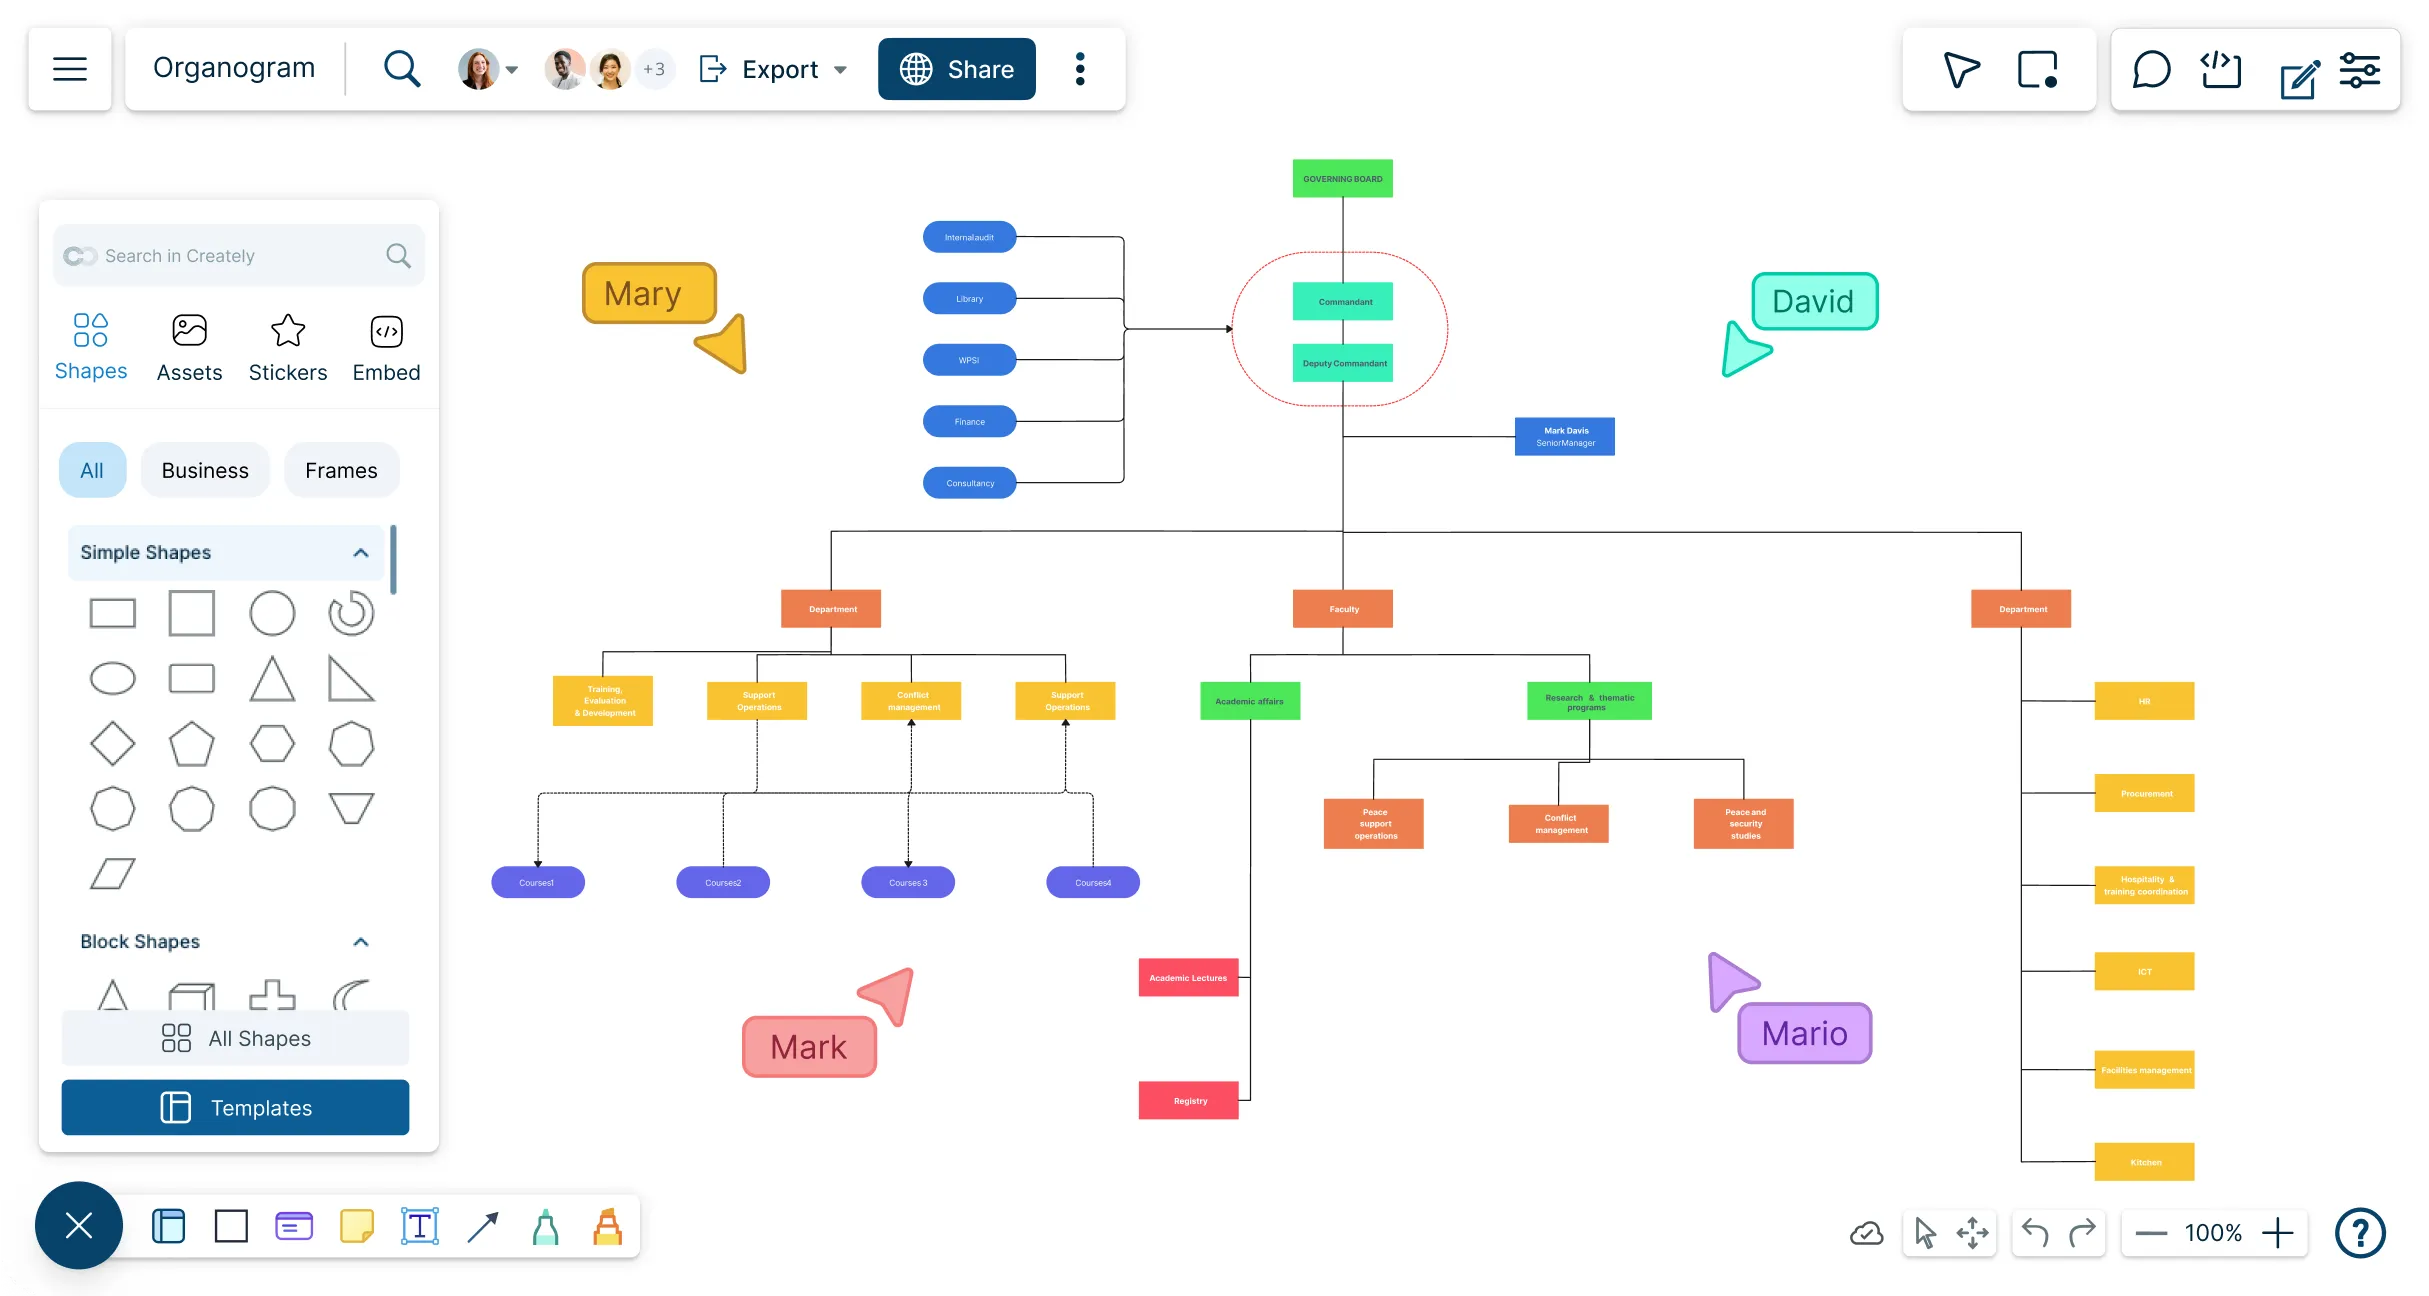
Creately's intuitive and powerful organogram maker to create organograms online. Visualize organizational hierarchies, clarify responsibilities, & manage employee information effectively.
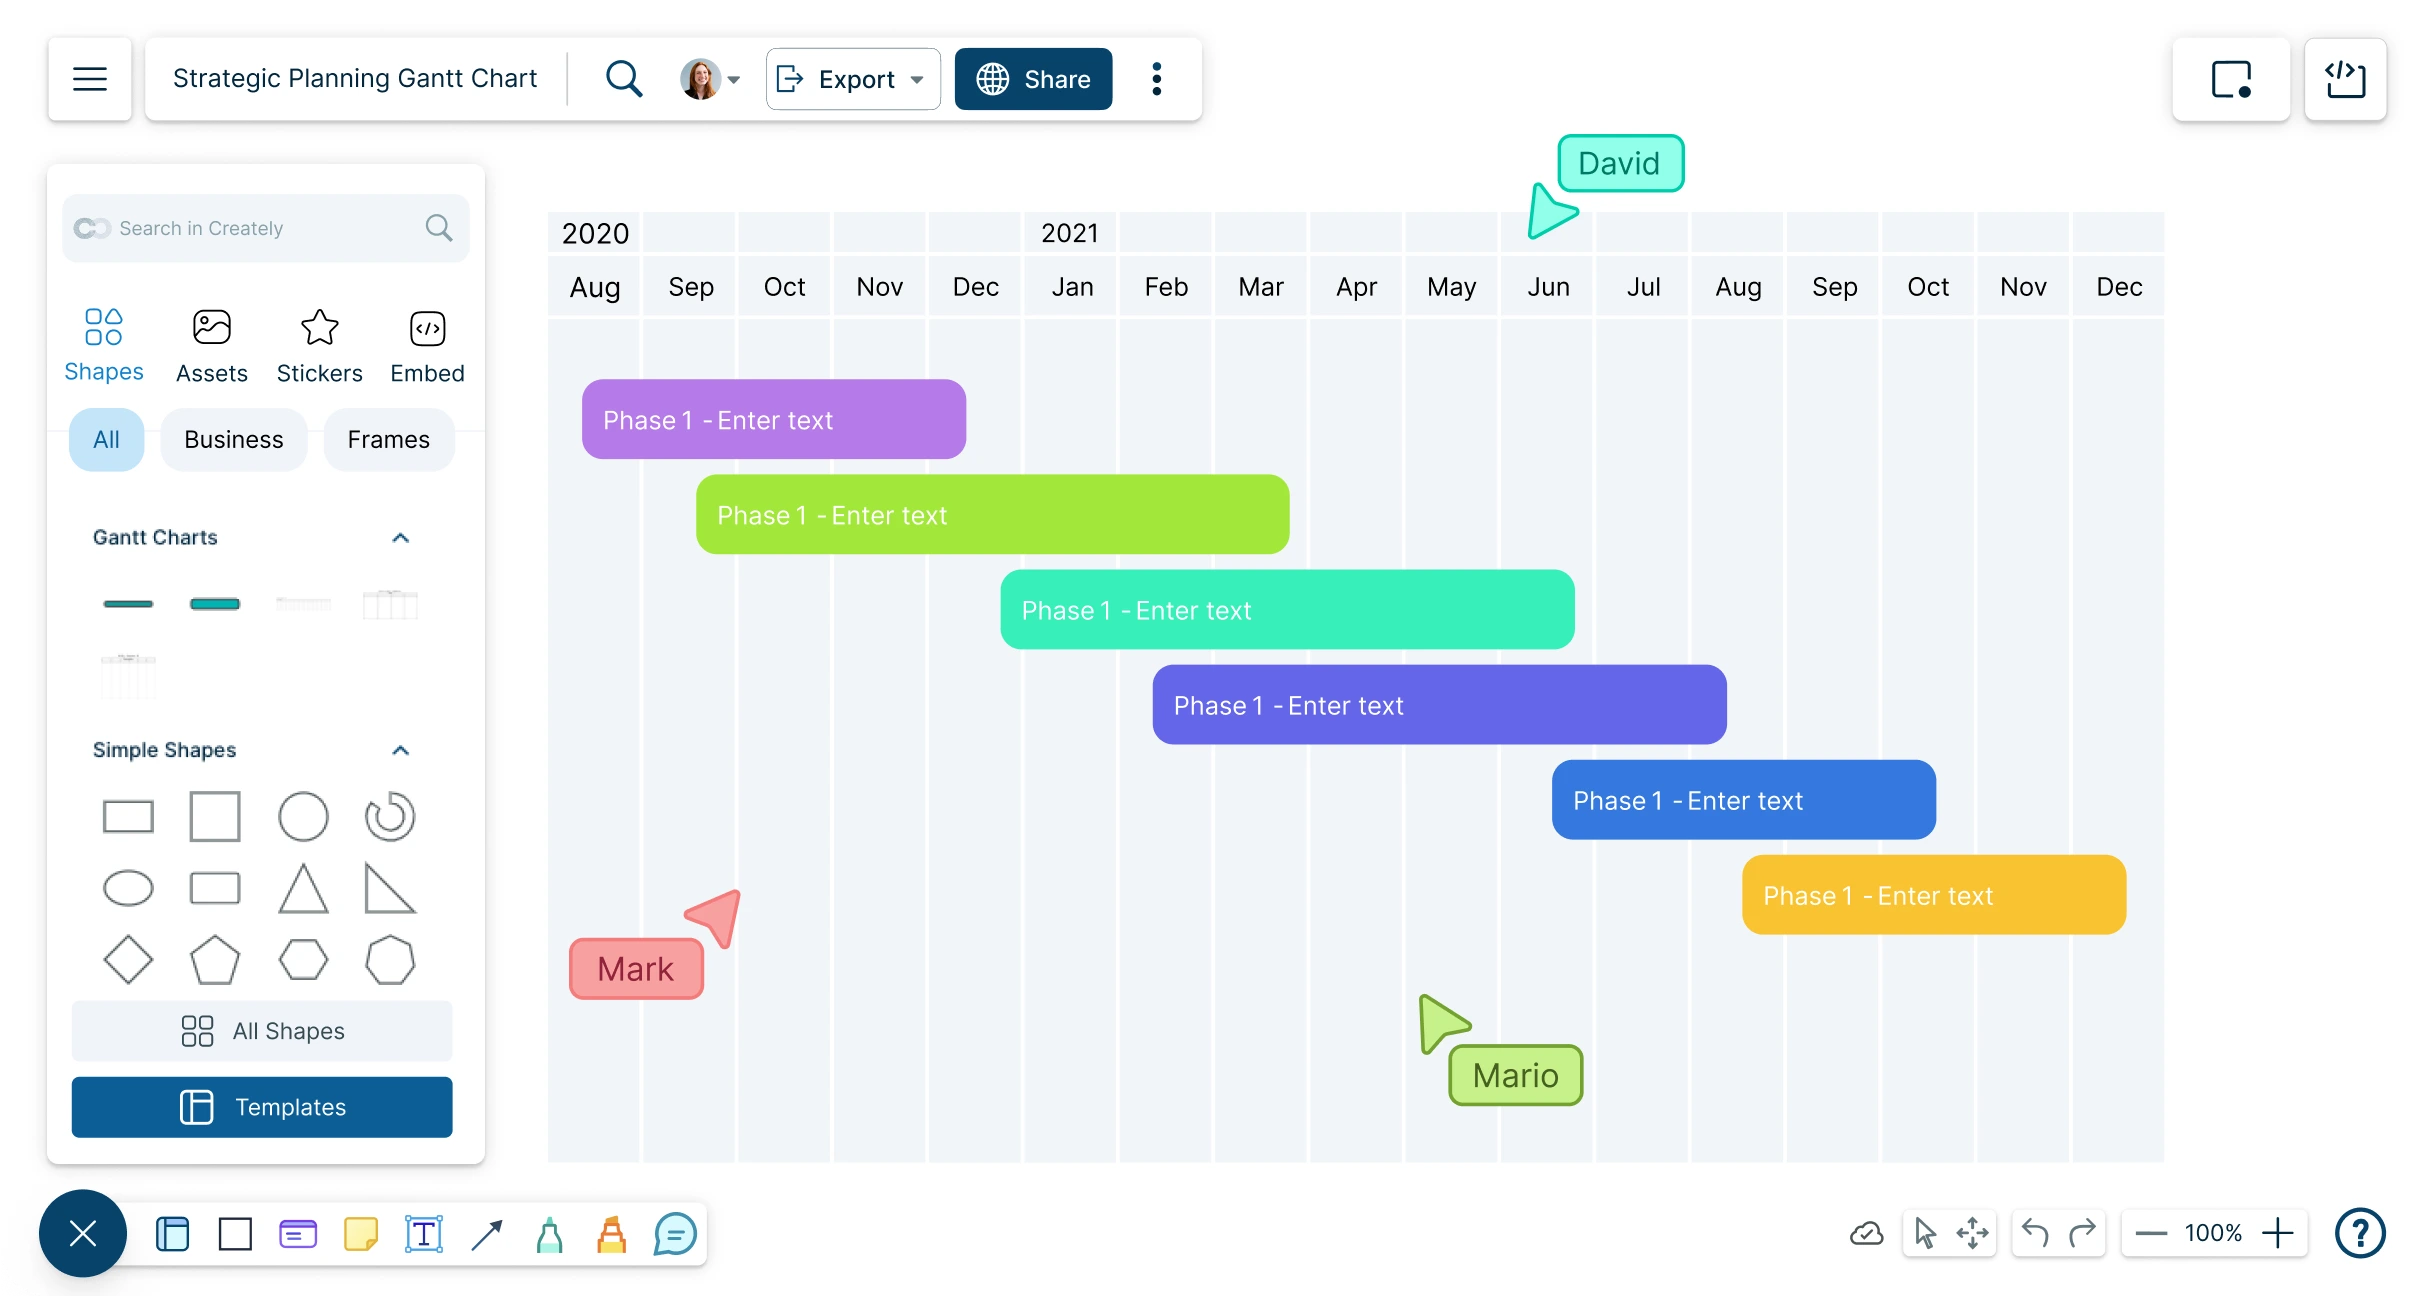
Create timelines for any event; track and analyze your team’s projects and tasks from start to finish with Creately’s Online Gantt Charts.
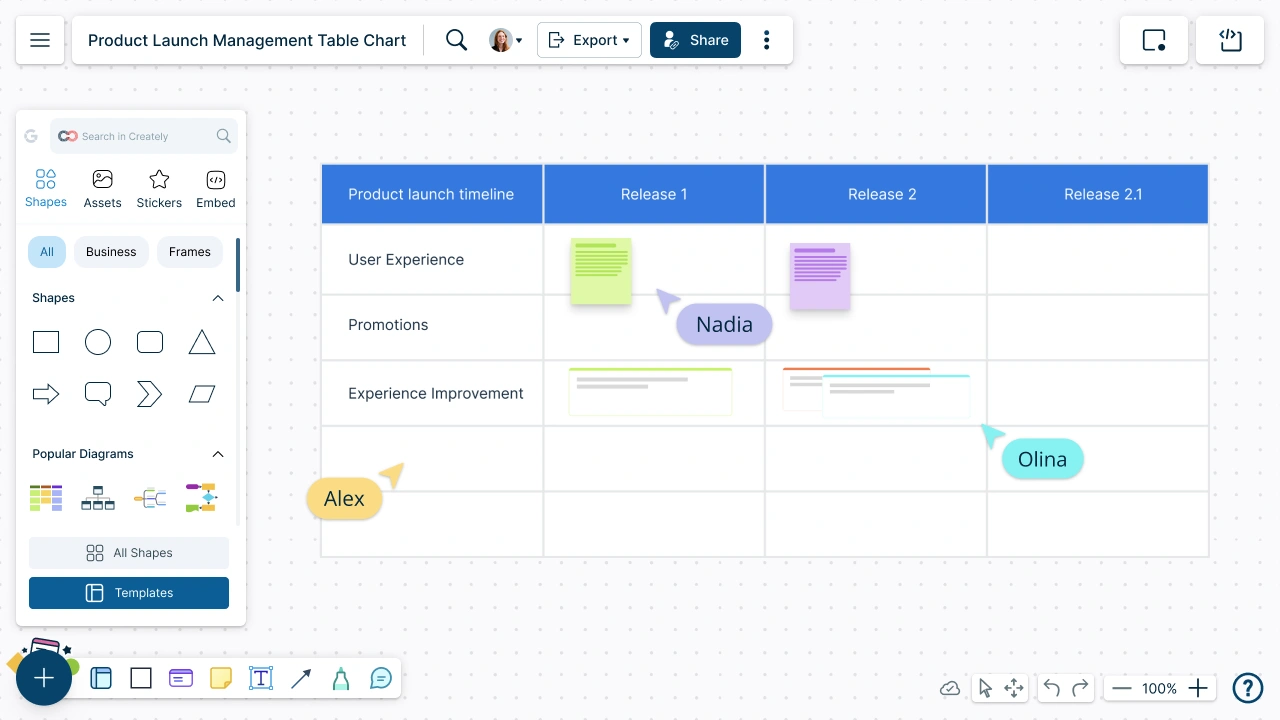
Create visually stunning table charts to organize your information and data with Creately’s table creator. Arrange your data in meaningful ways and interact with them to make effective data-driven decisions.
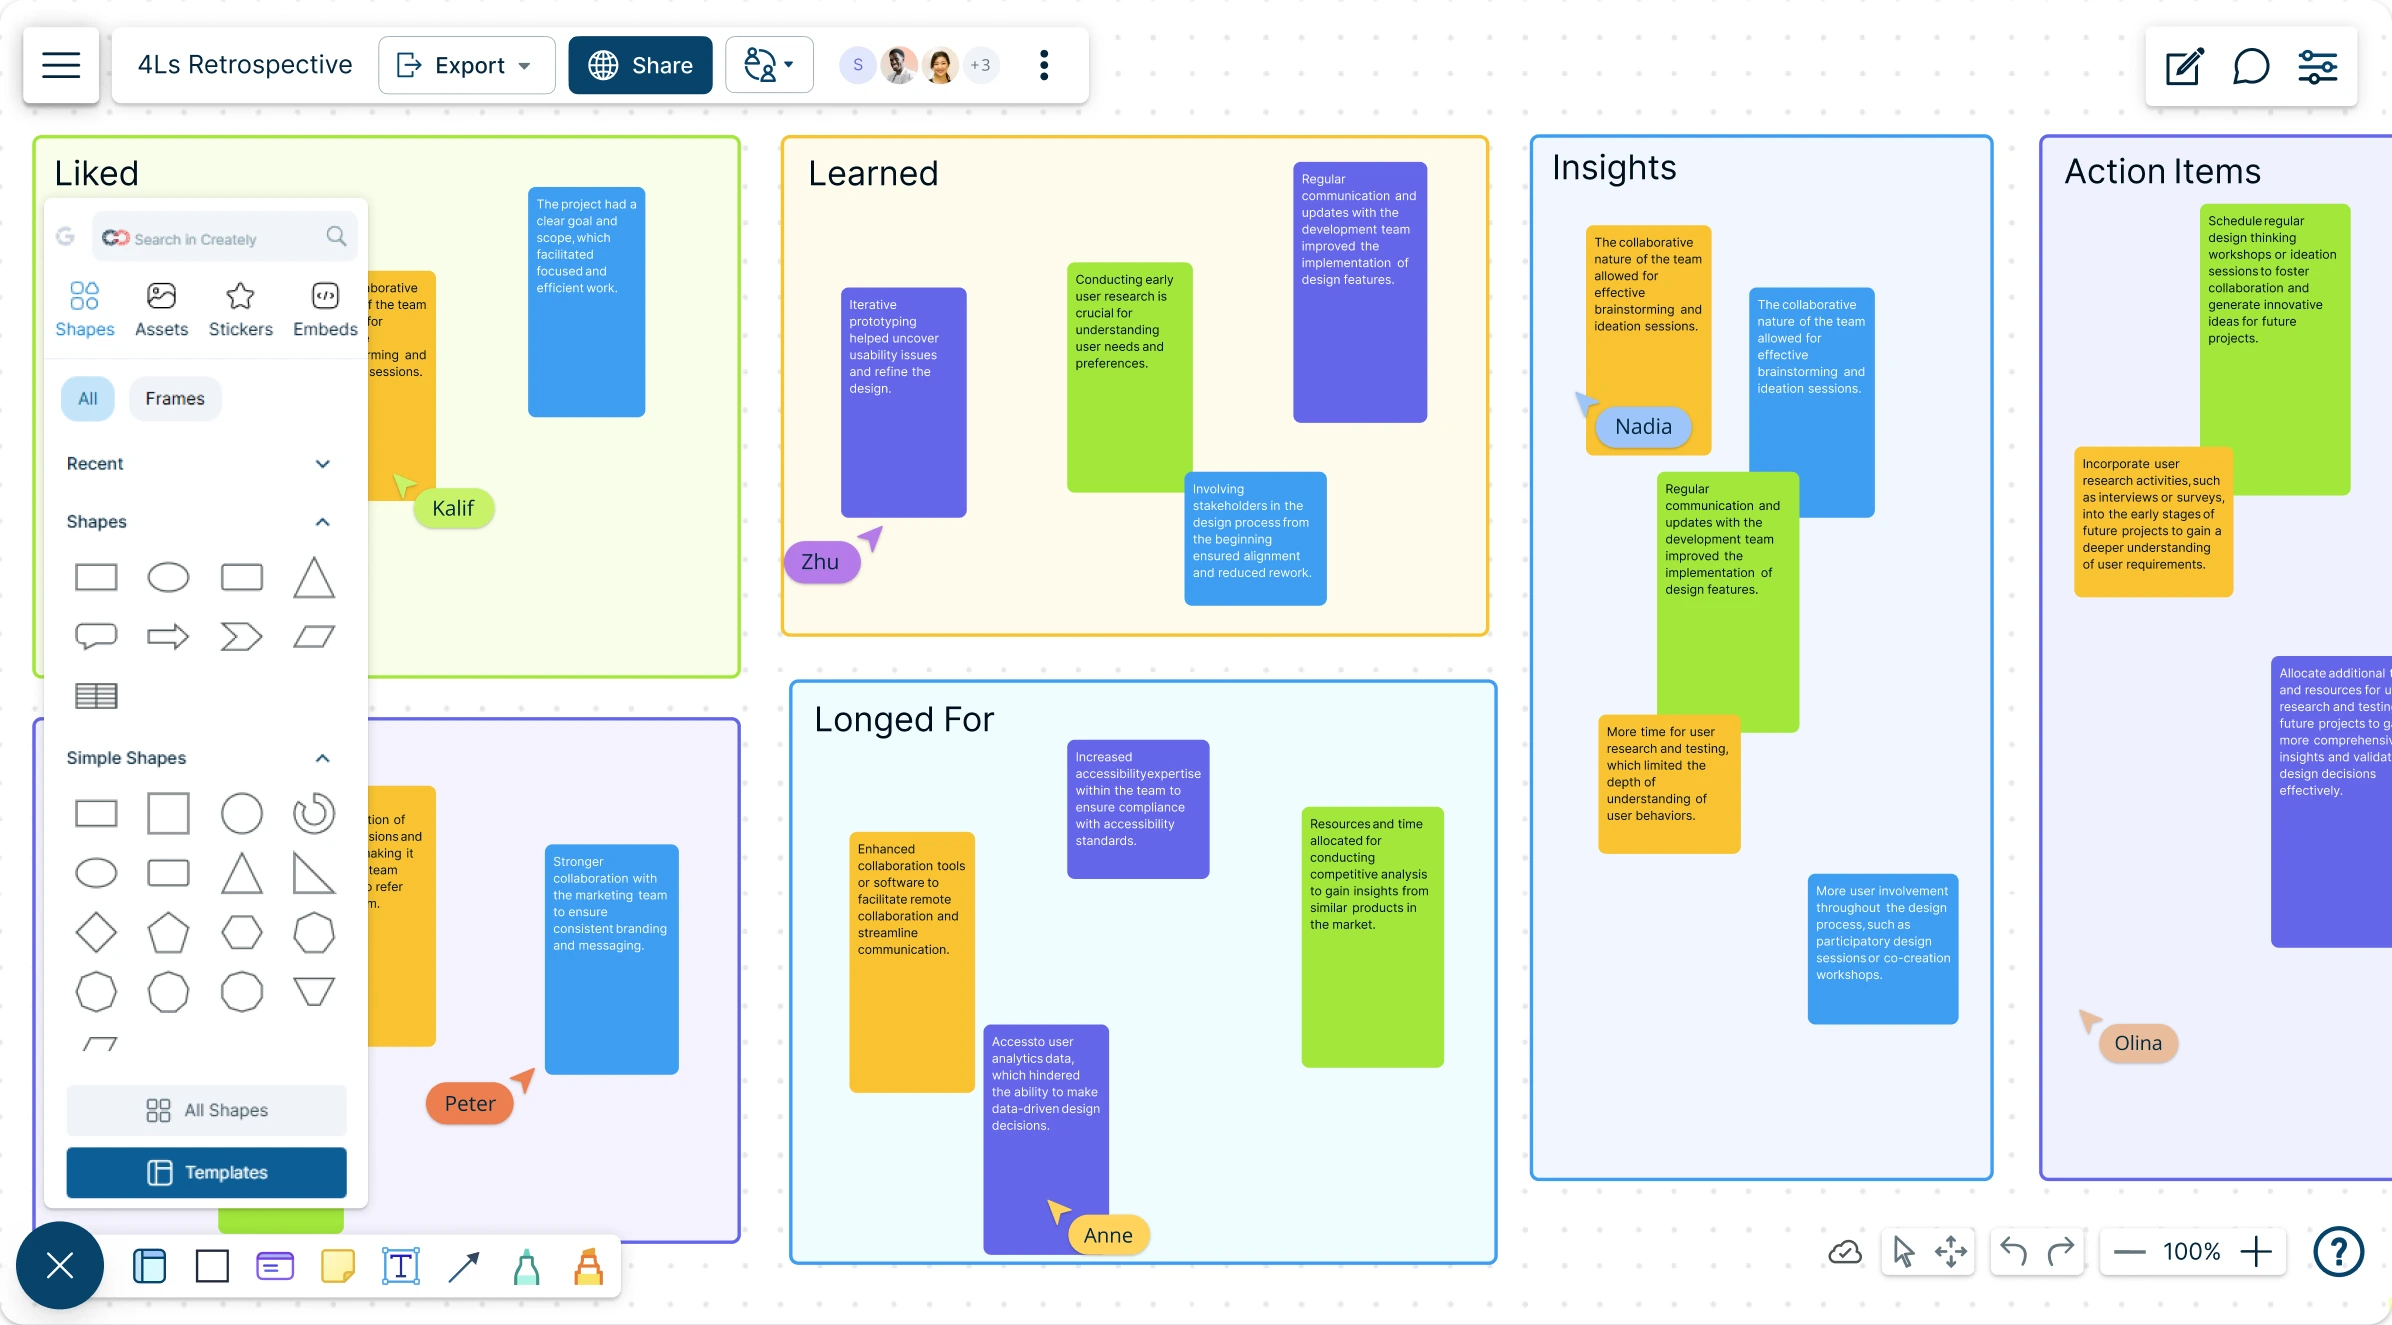
Run your 4Ls retrospective with Creately’s professionally-made templates to visualize, plan, and organize meaningful team reflections.
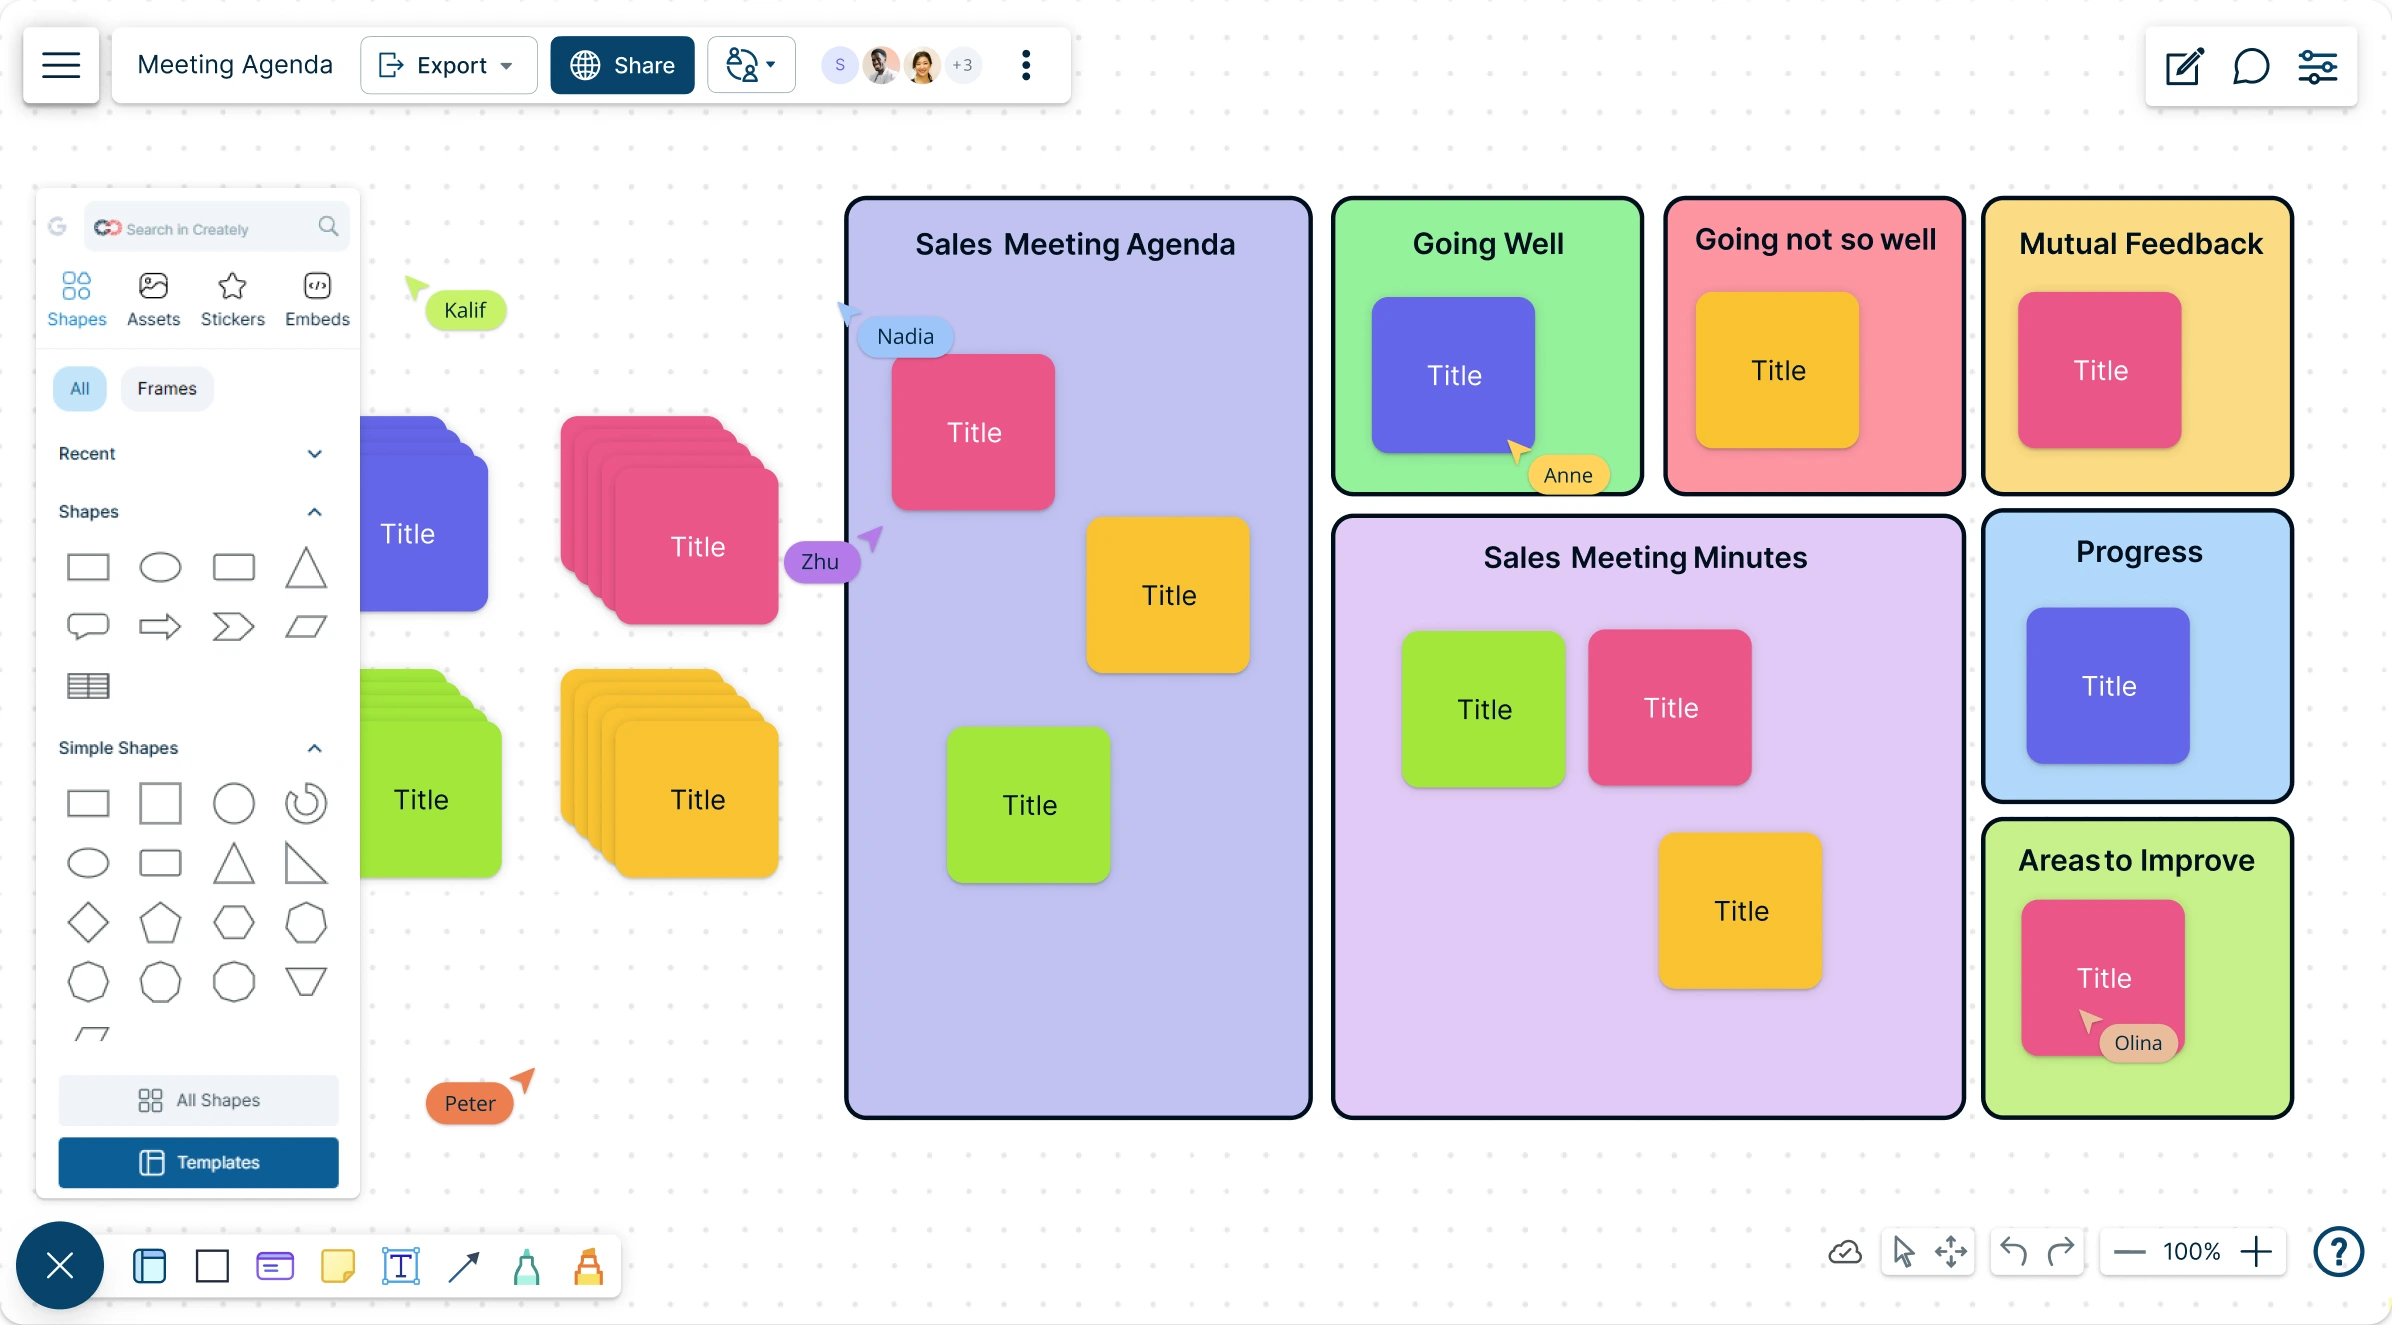
Make your meeting agenda online using Creately’s ready-to-use templates to visualize, plan and organize impactful meetings.
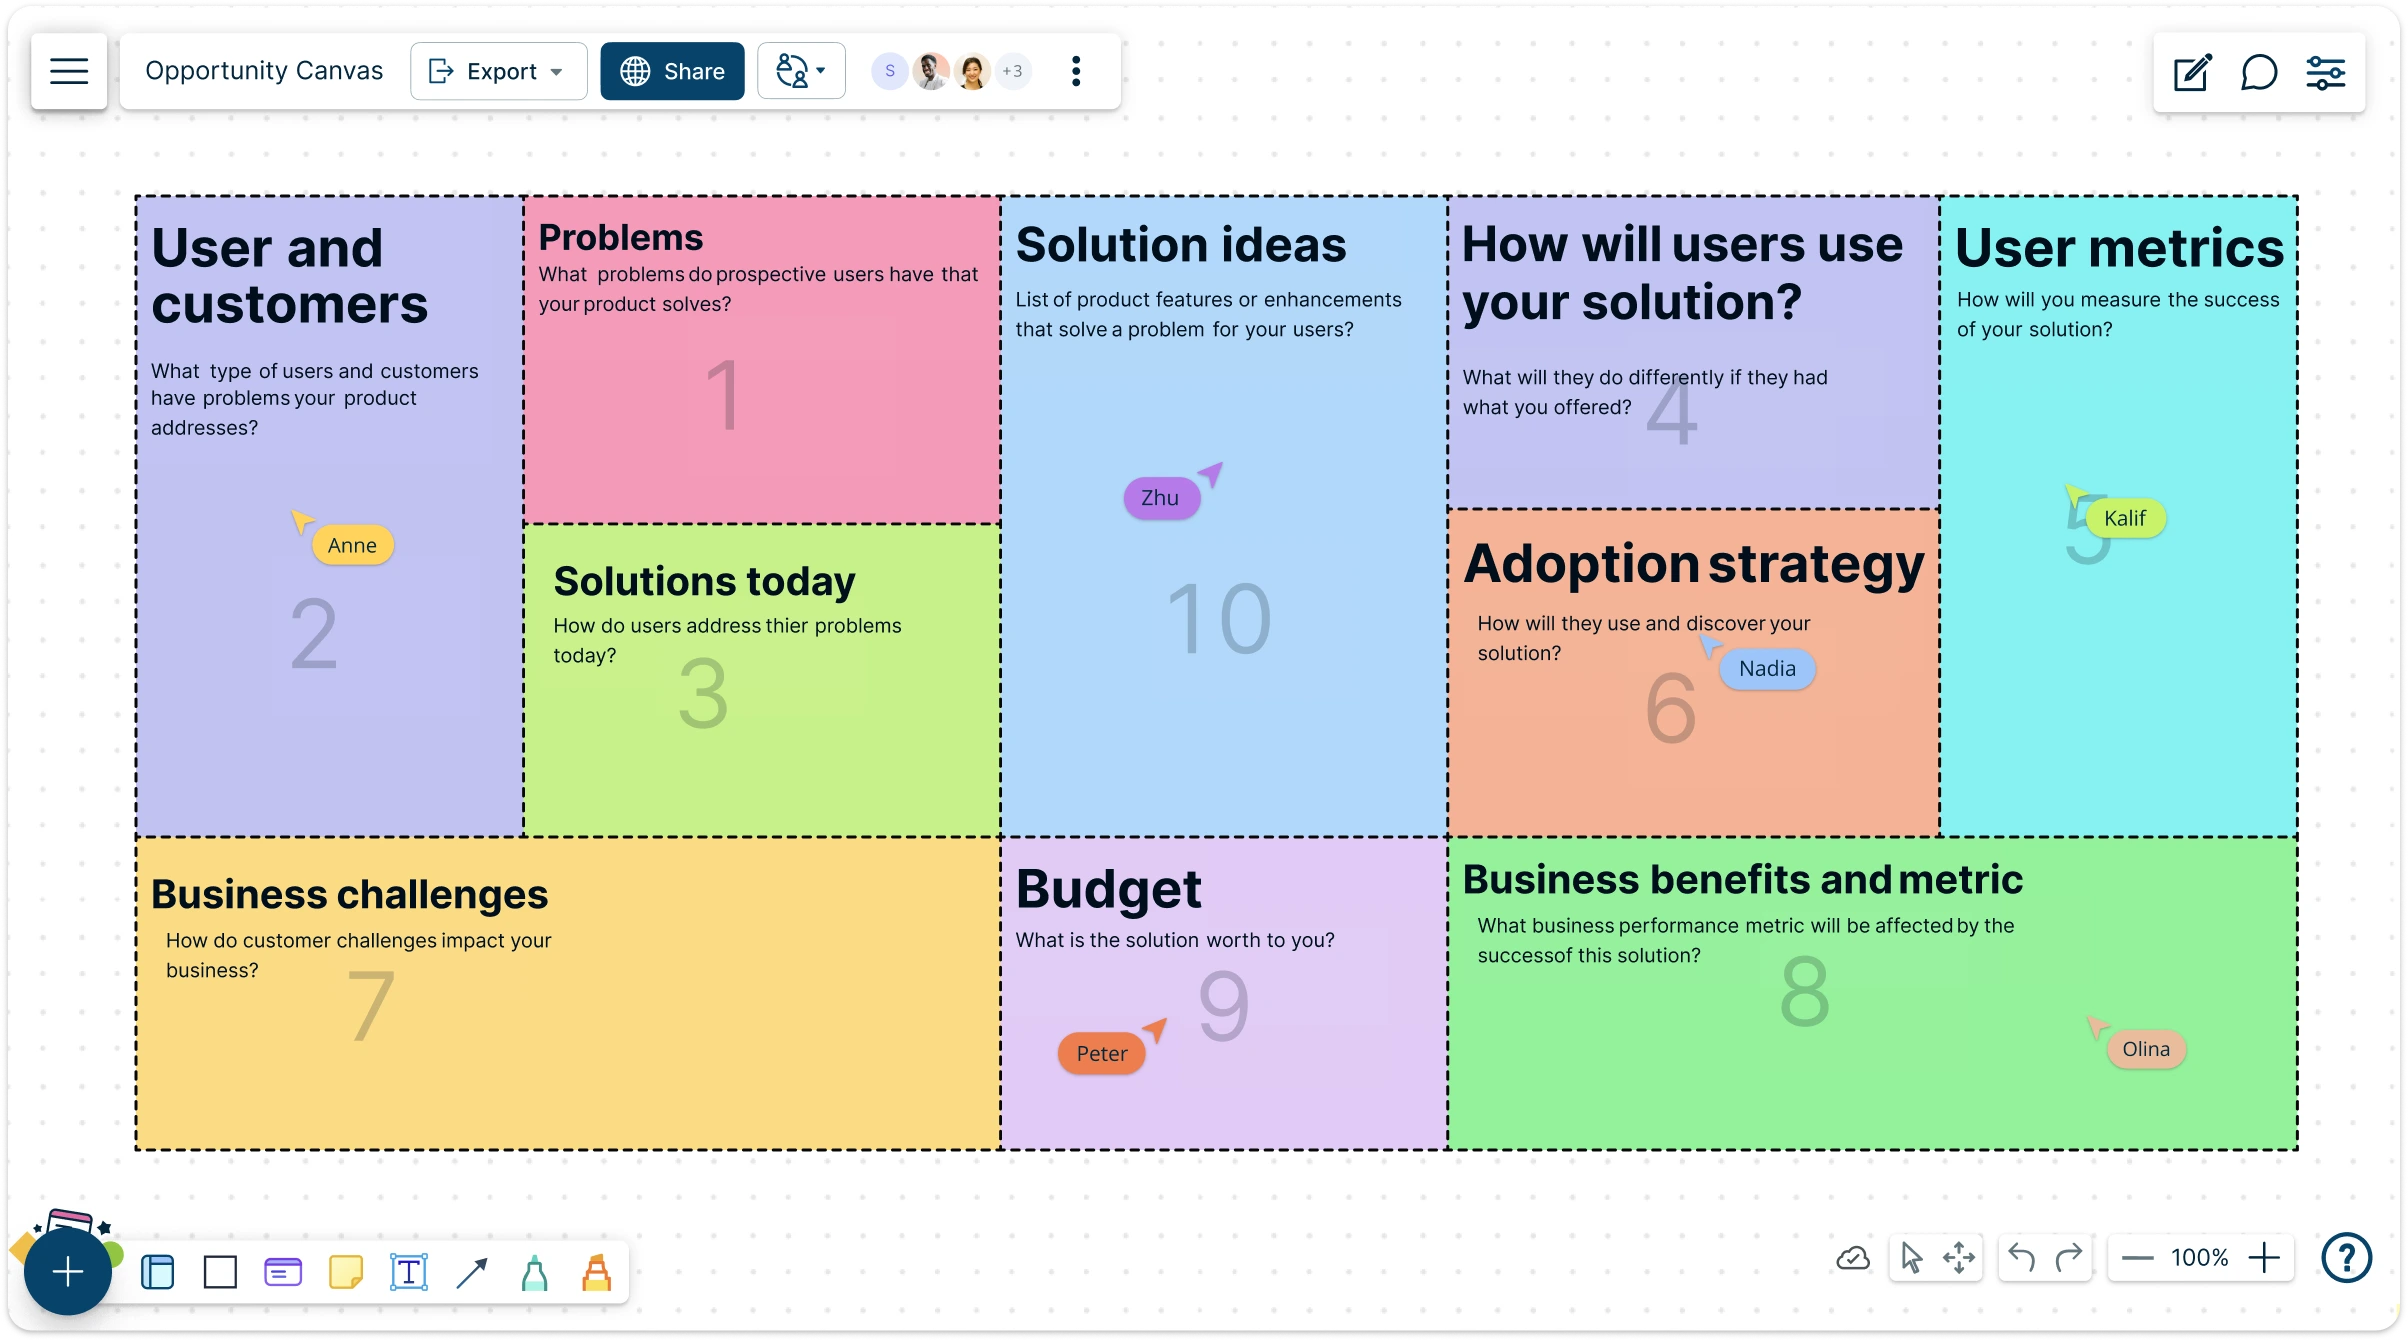
A strategic planning tool to uncover opportunities, minimize risk, and align your team around what truly matters.
See the big picture of your business strategy and align your products for growth instantly.
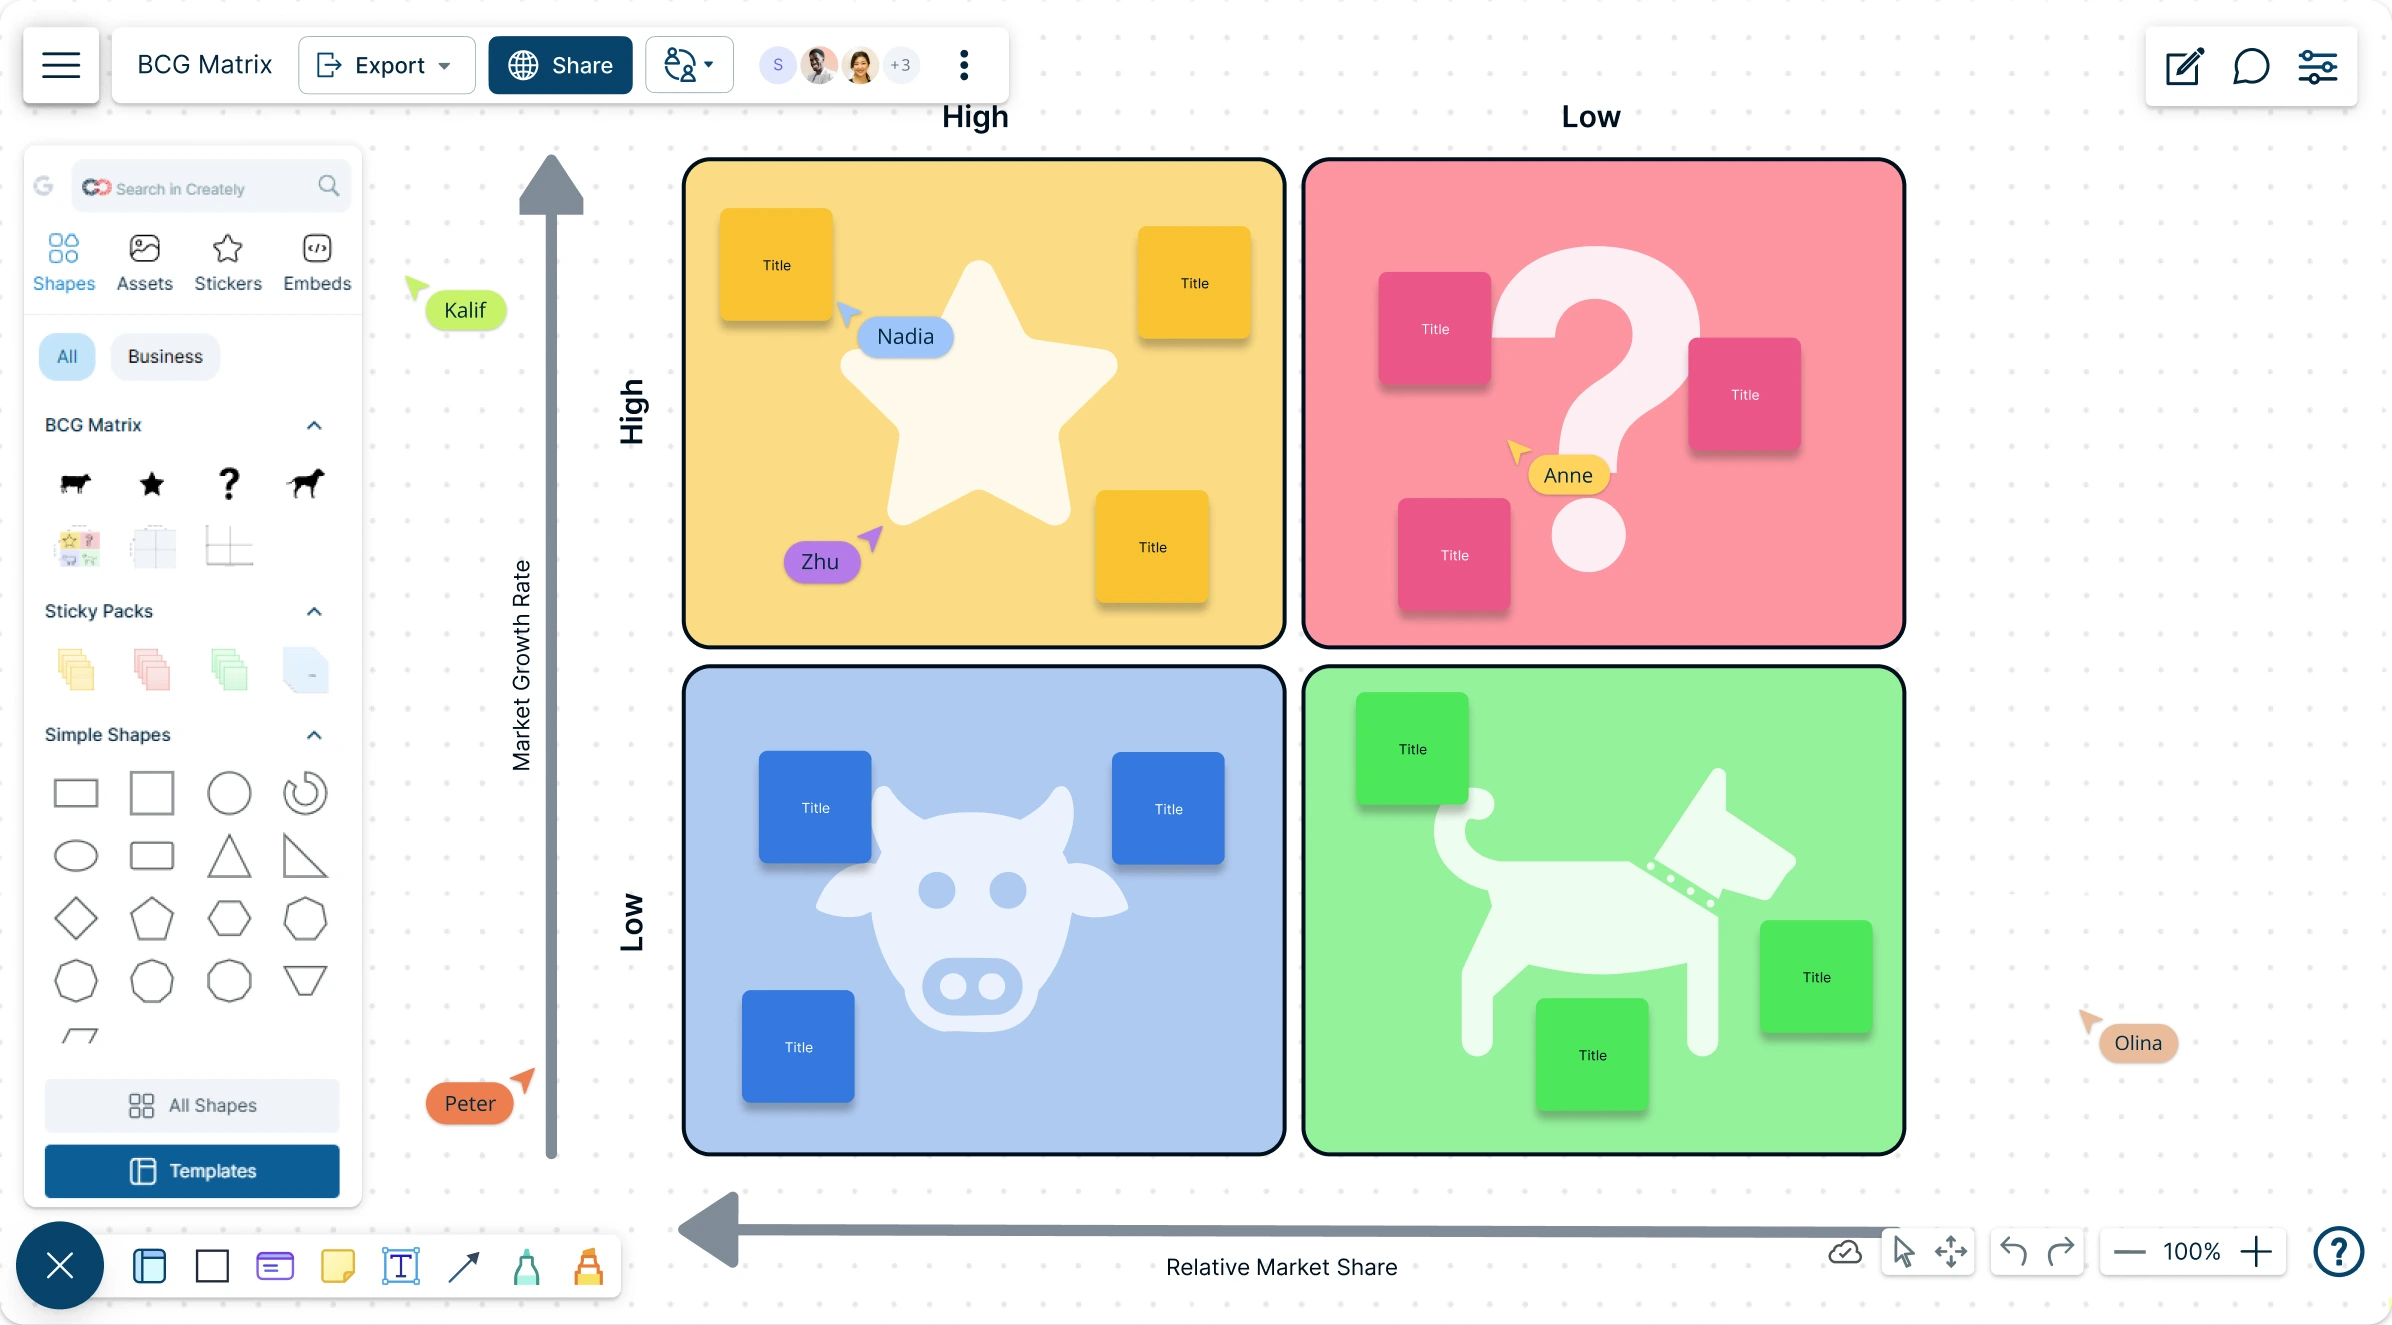
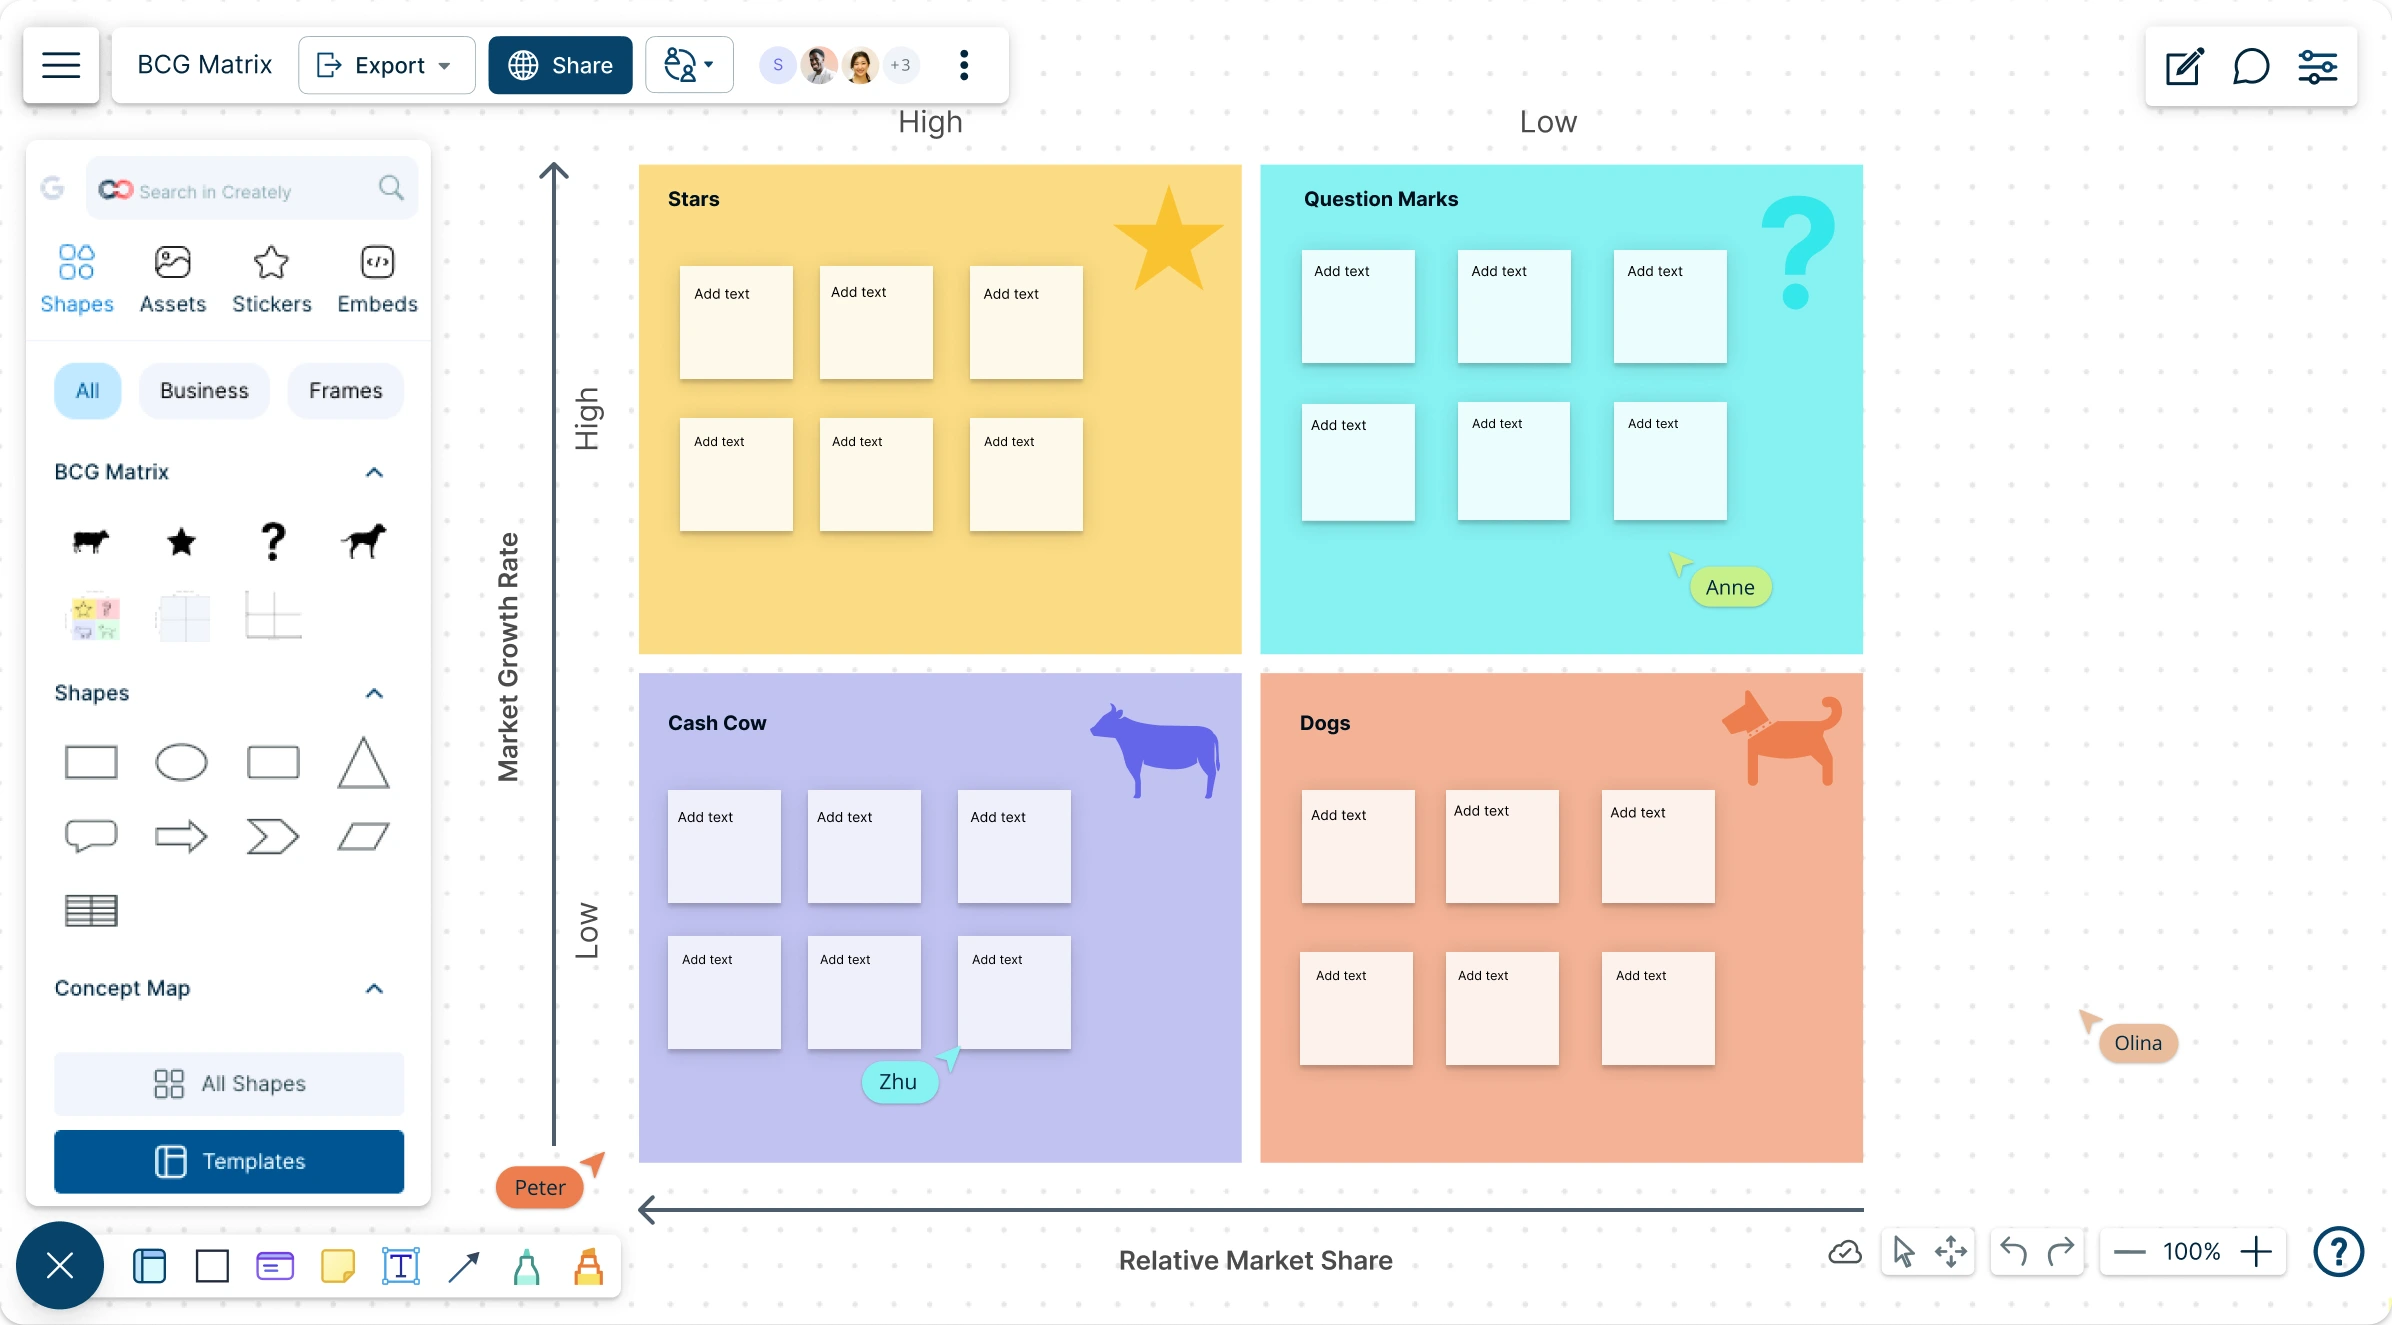
Take the guesswork out of strategic planning. Use our visual BCG Matrix Creator to assess your competitive landscape and focus your team’s efforts where they’ll deliver the highest return.
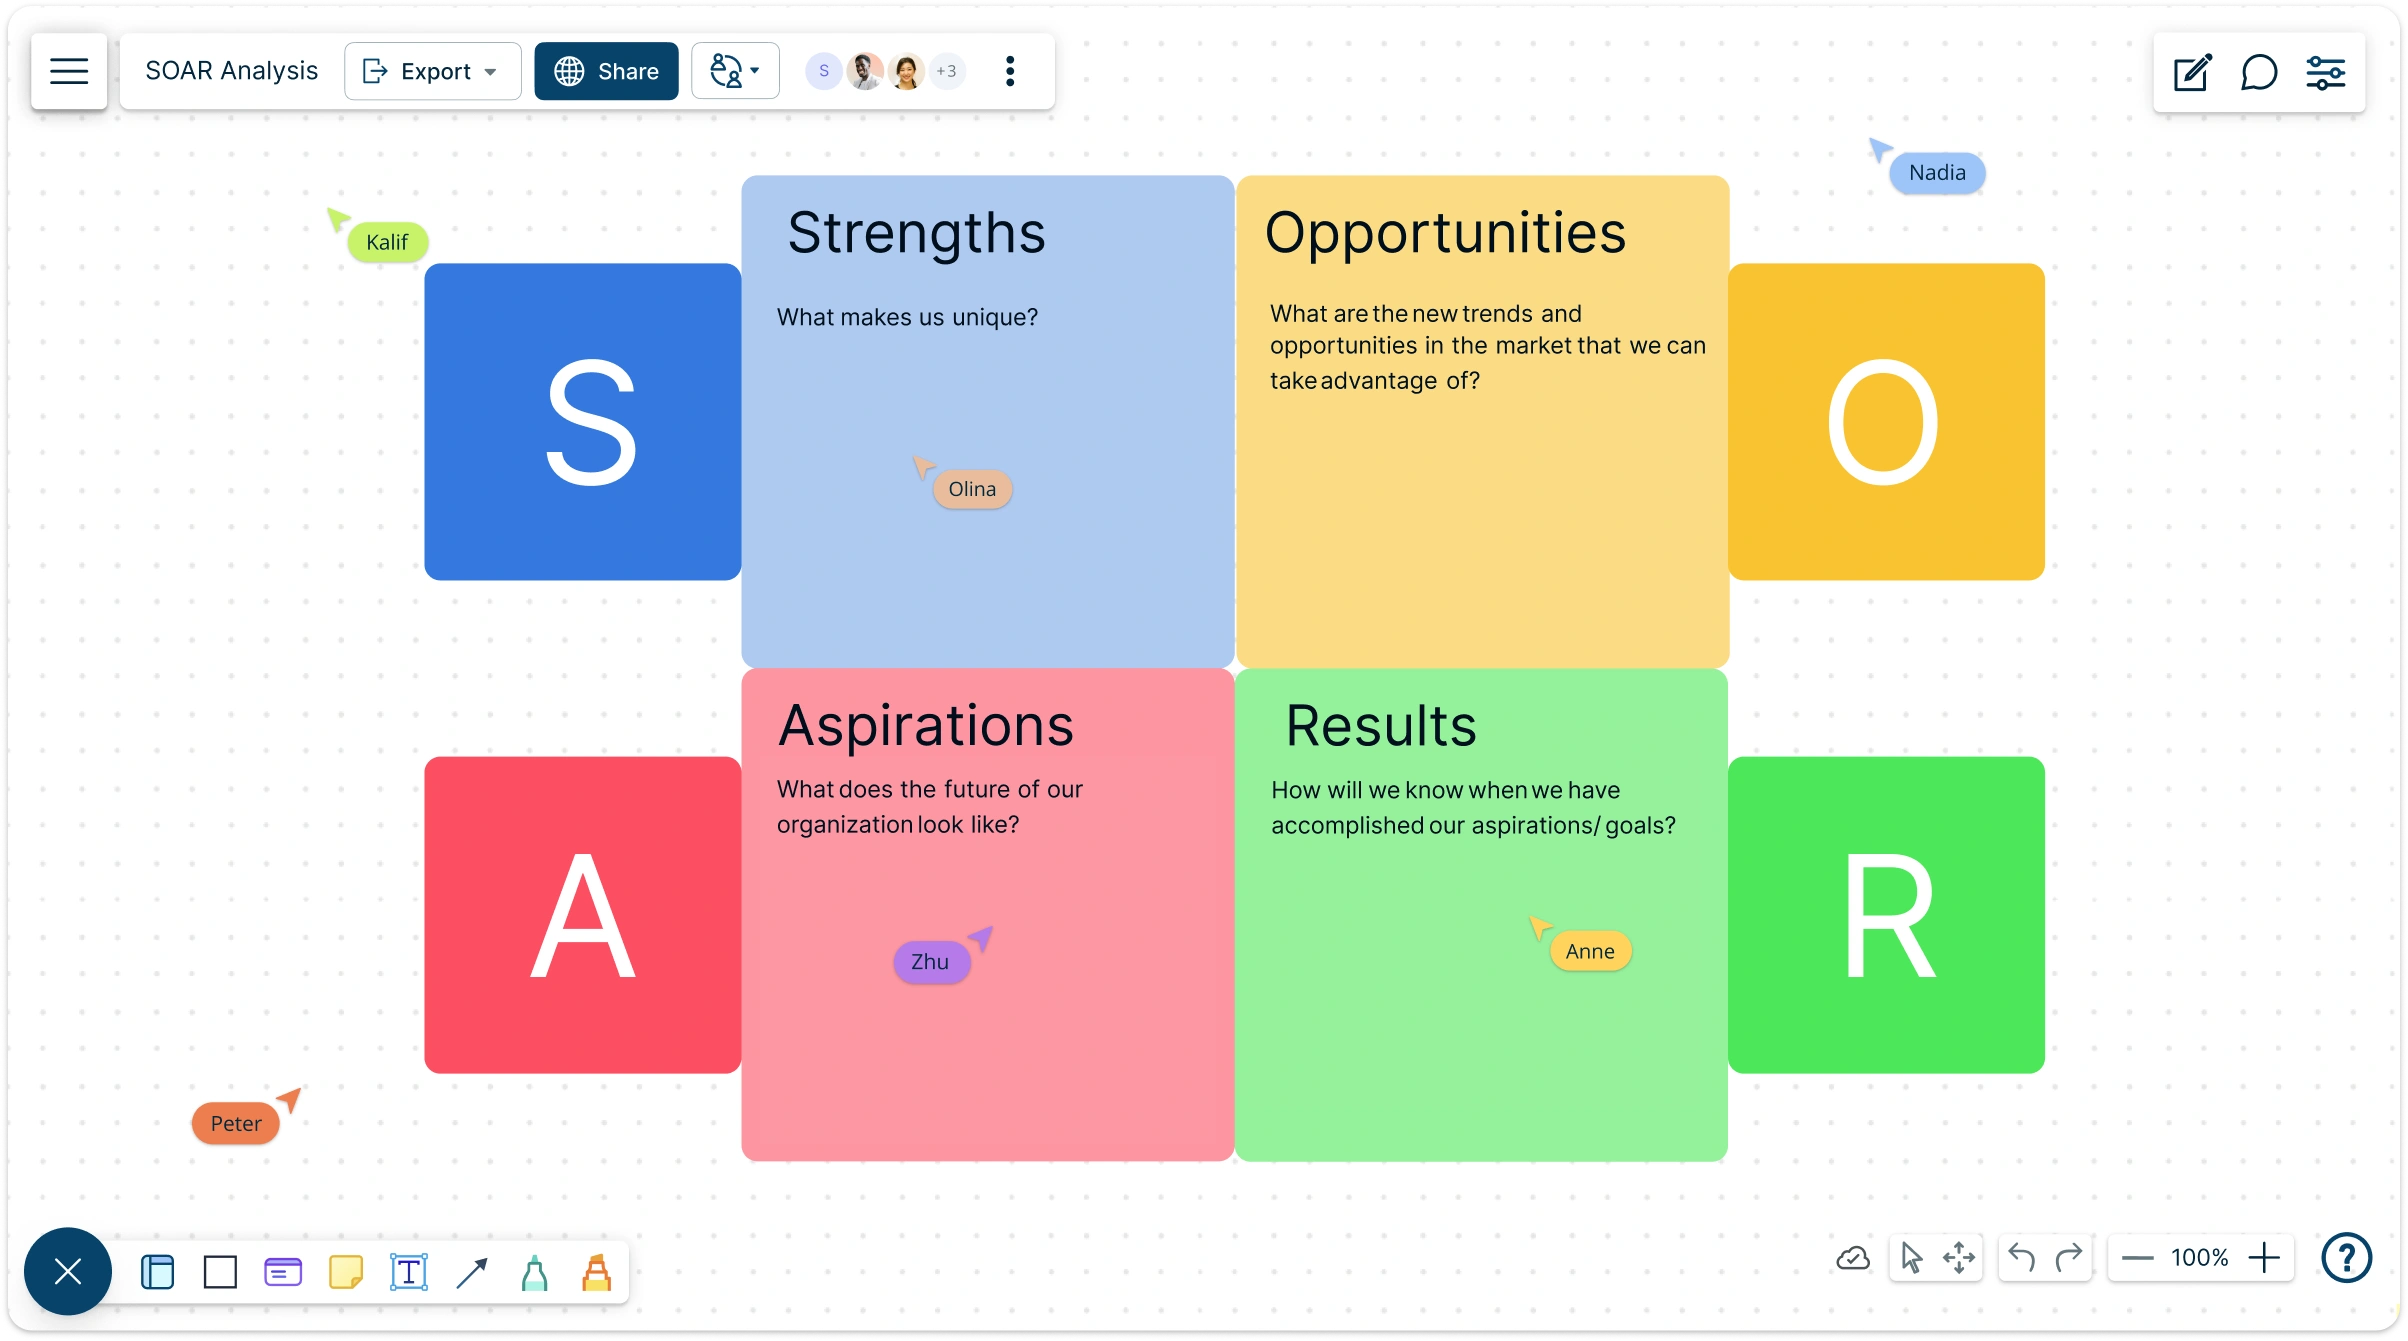
Visually analyze your organization’s strengths, opportunities, aspirations, and results to guide strategic planning.
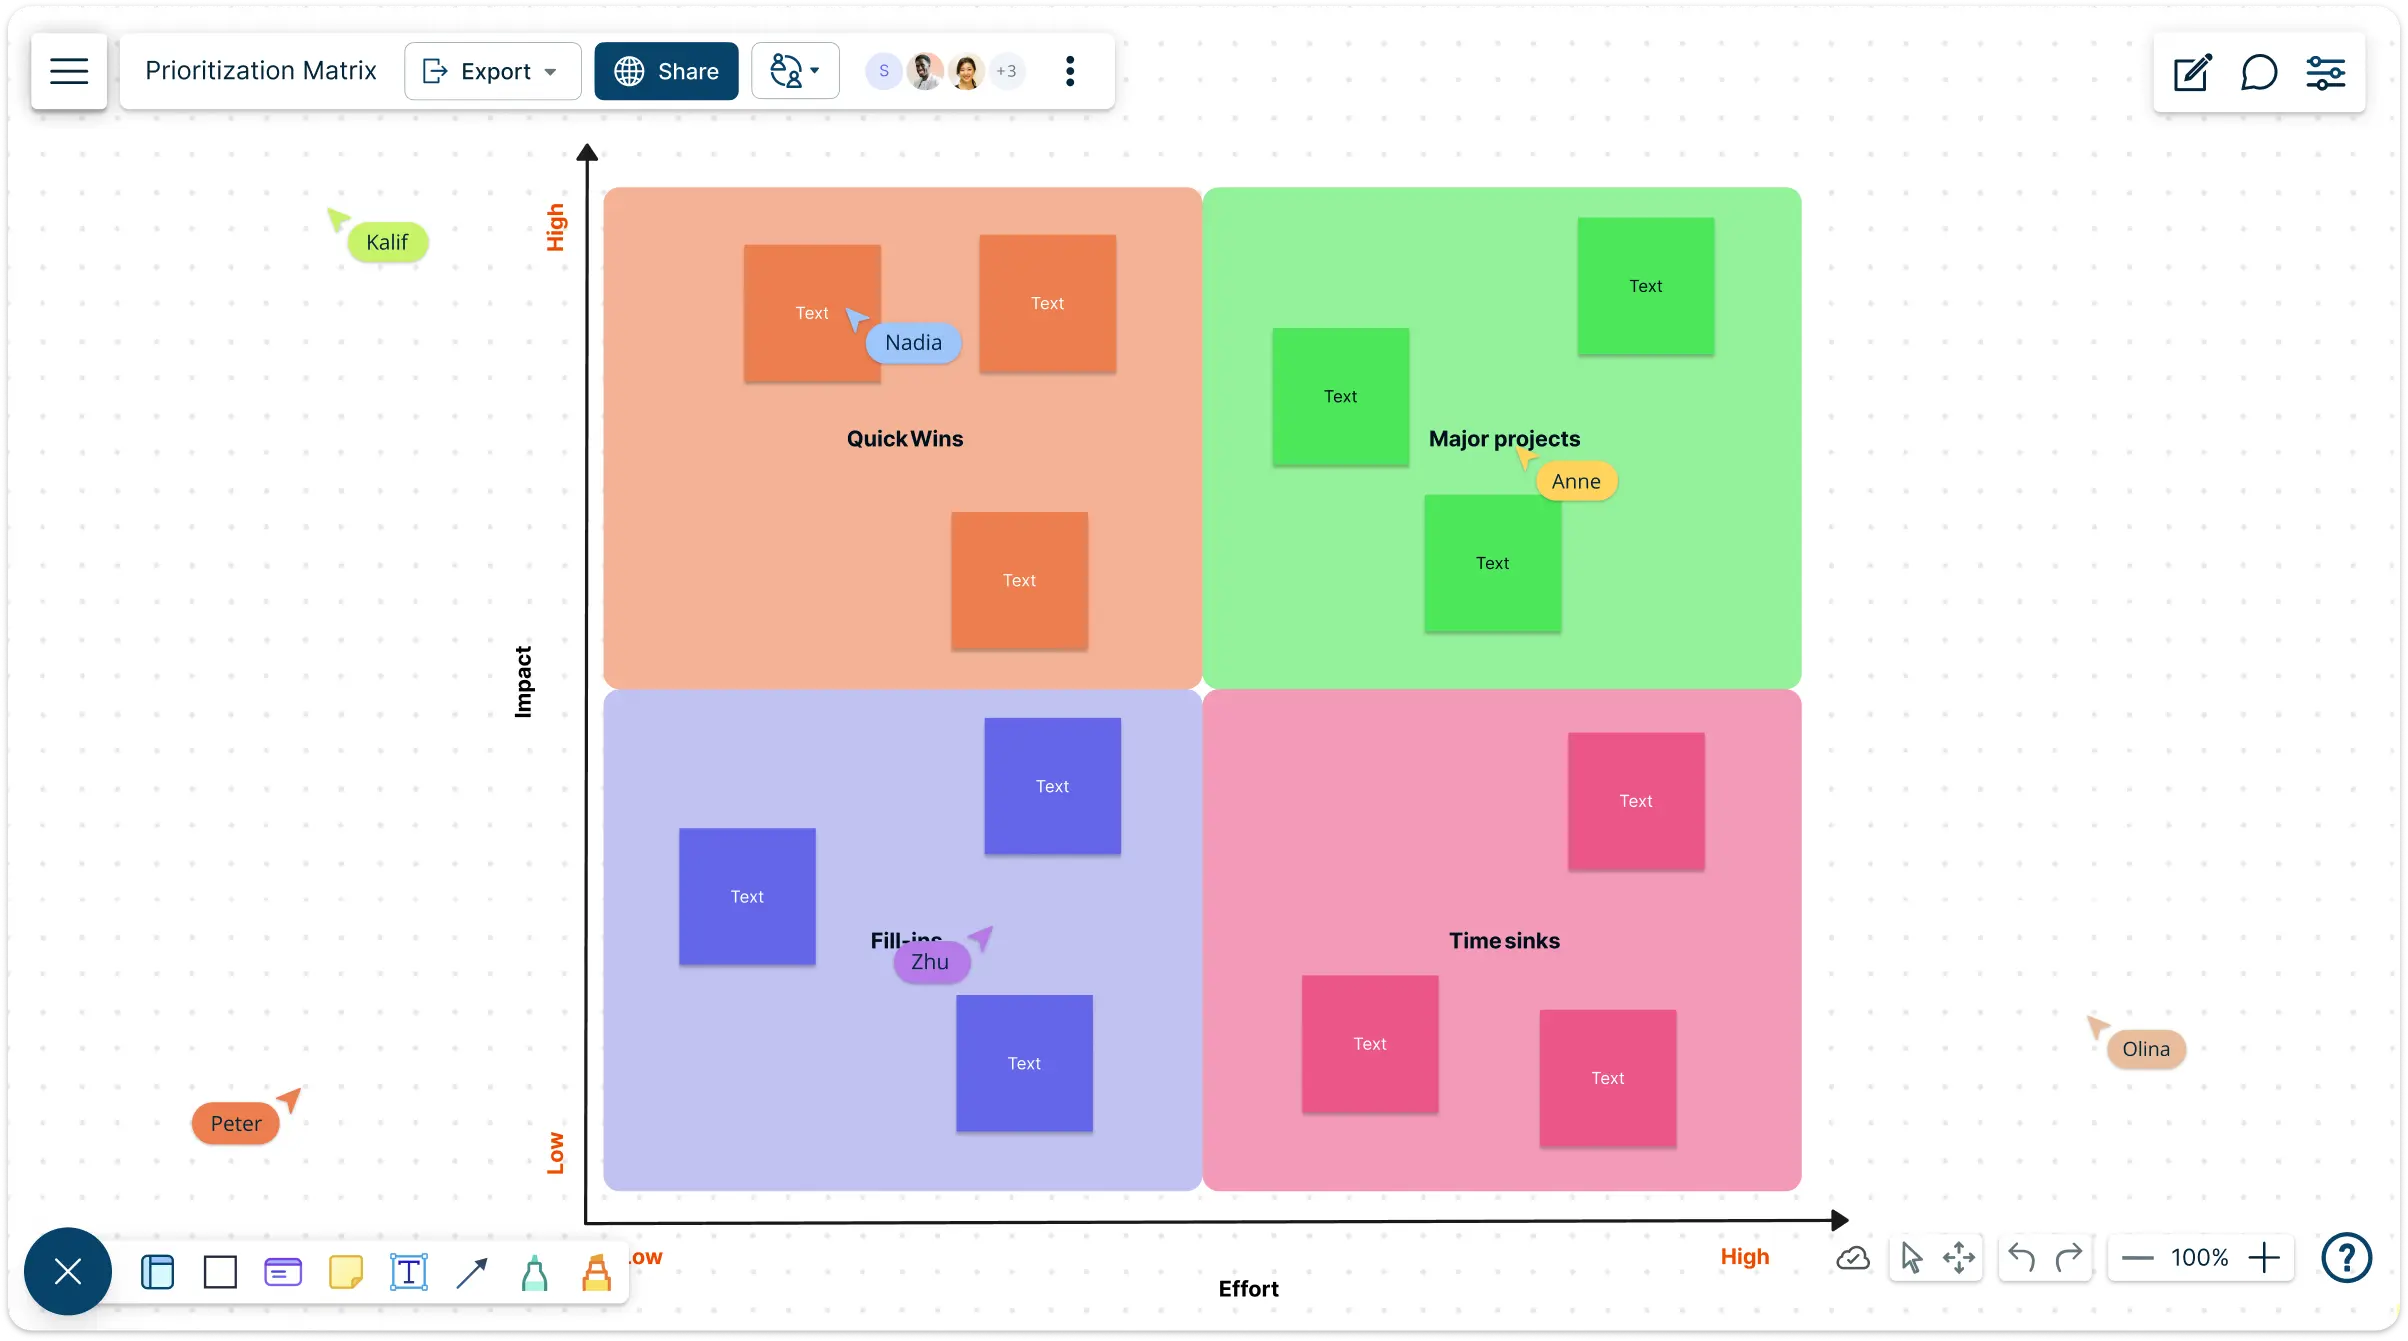
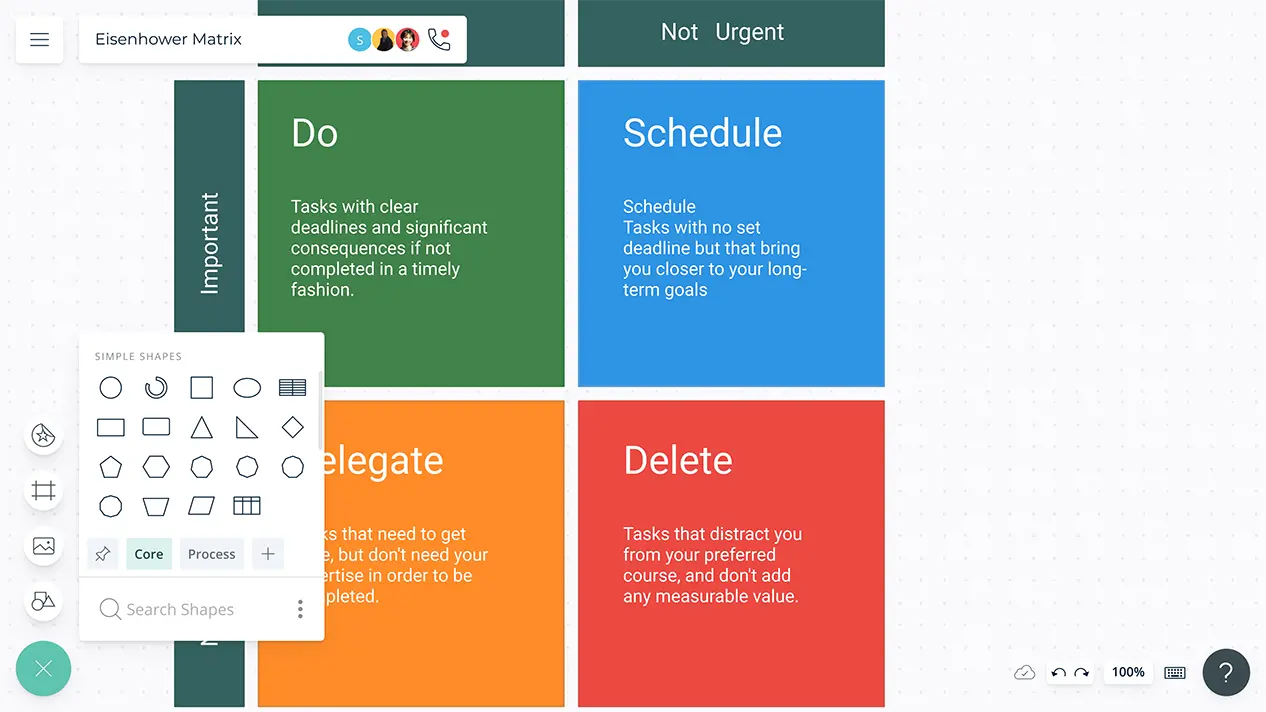
Categorize issues by importance and urgency to identify the priority to focus your efforts where they matter most
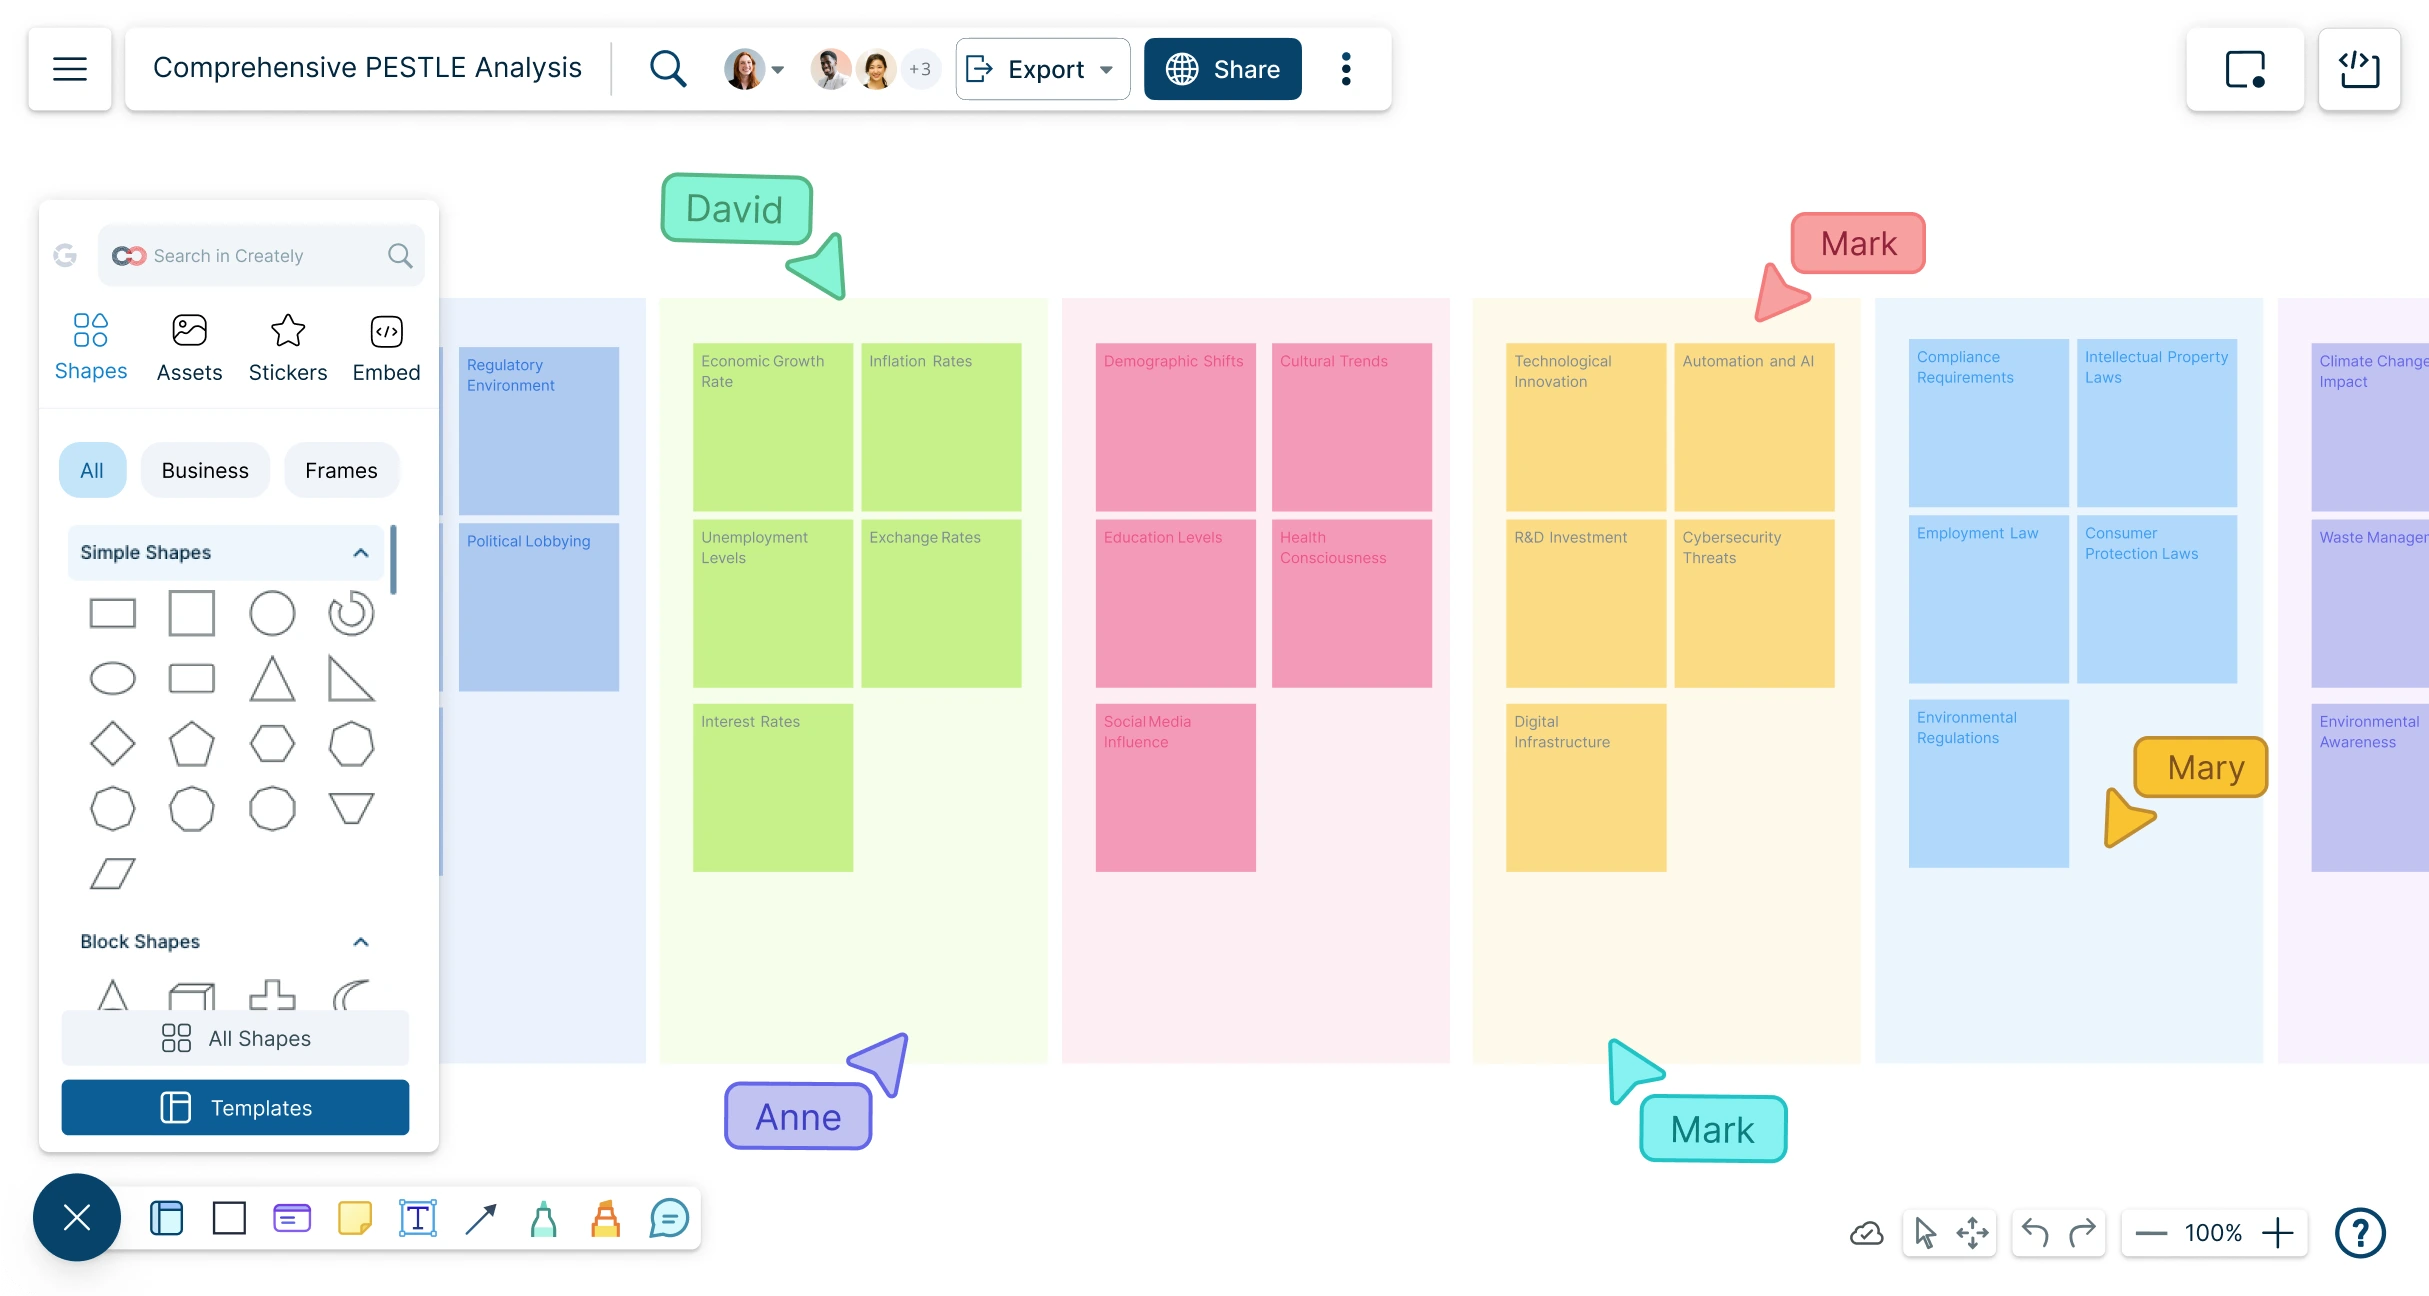
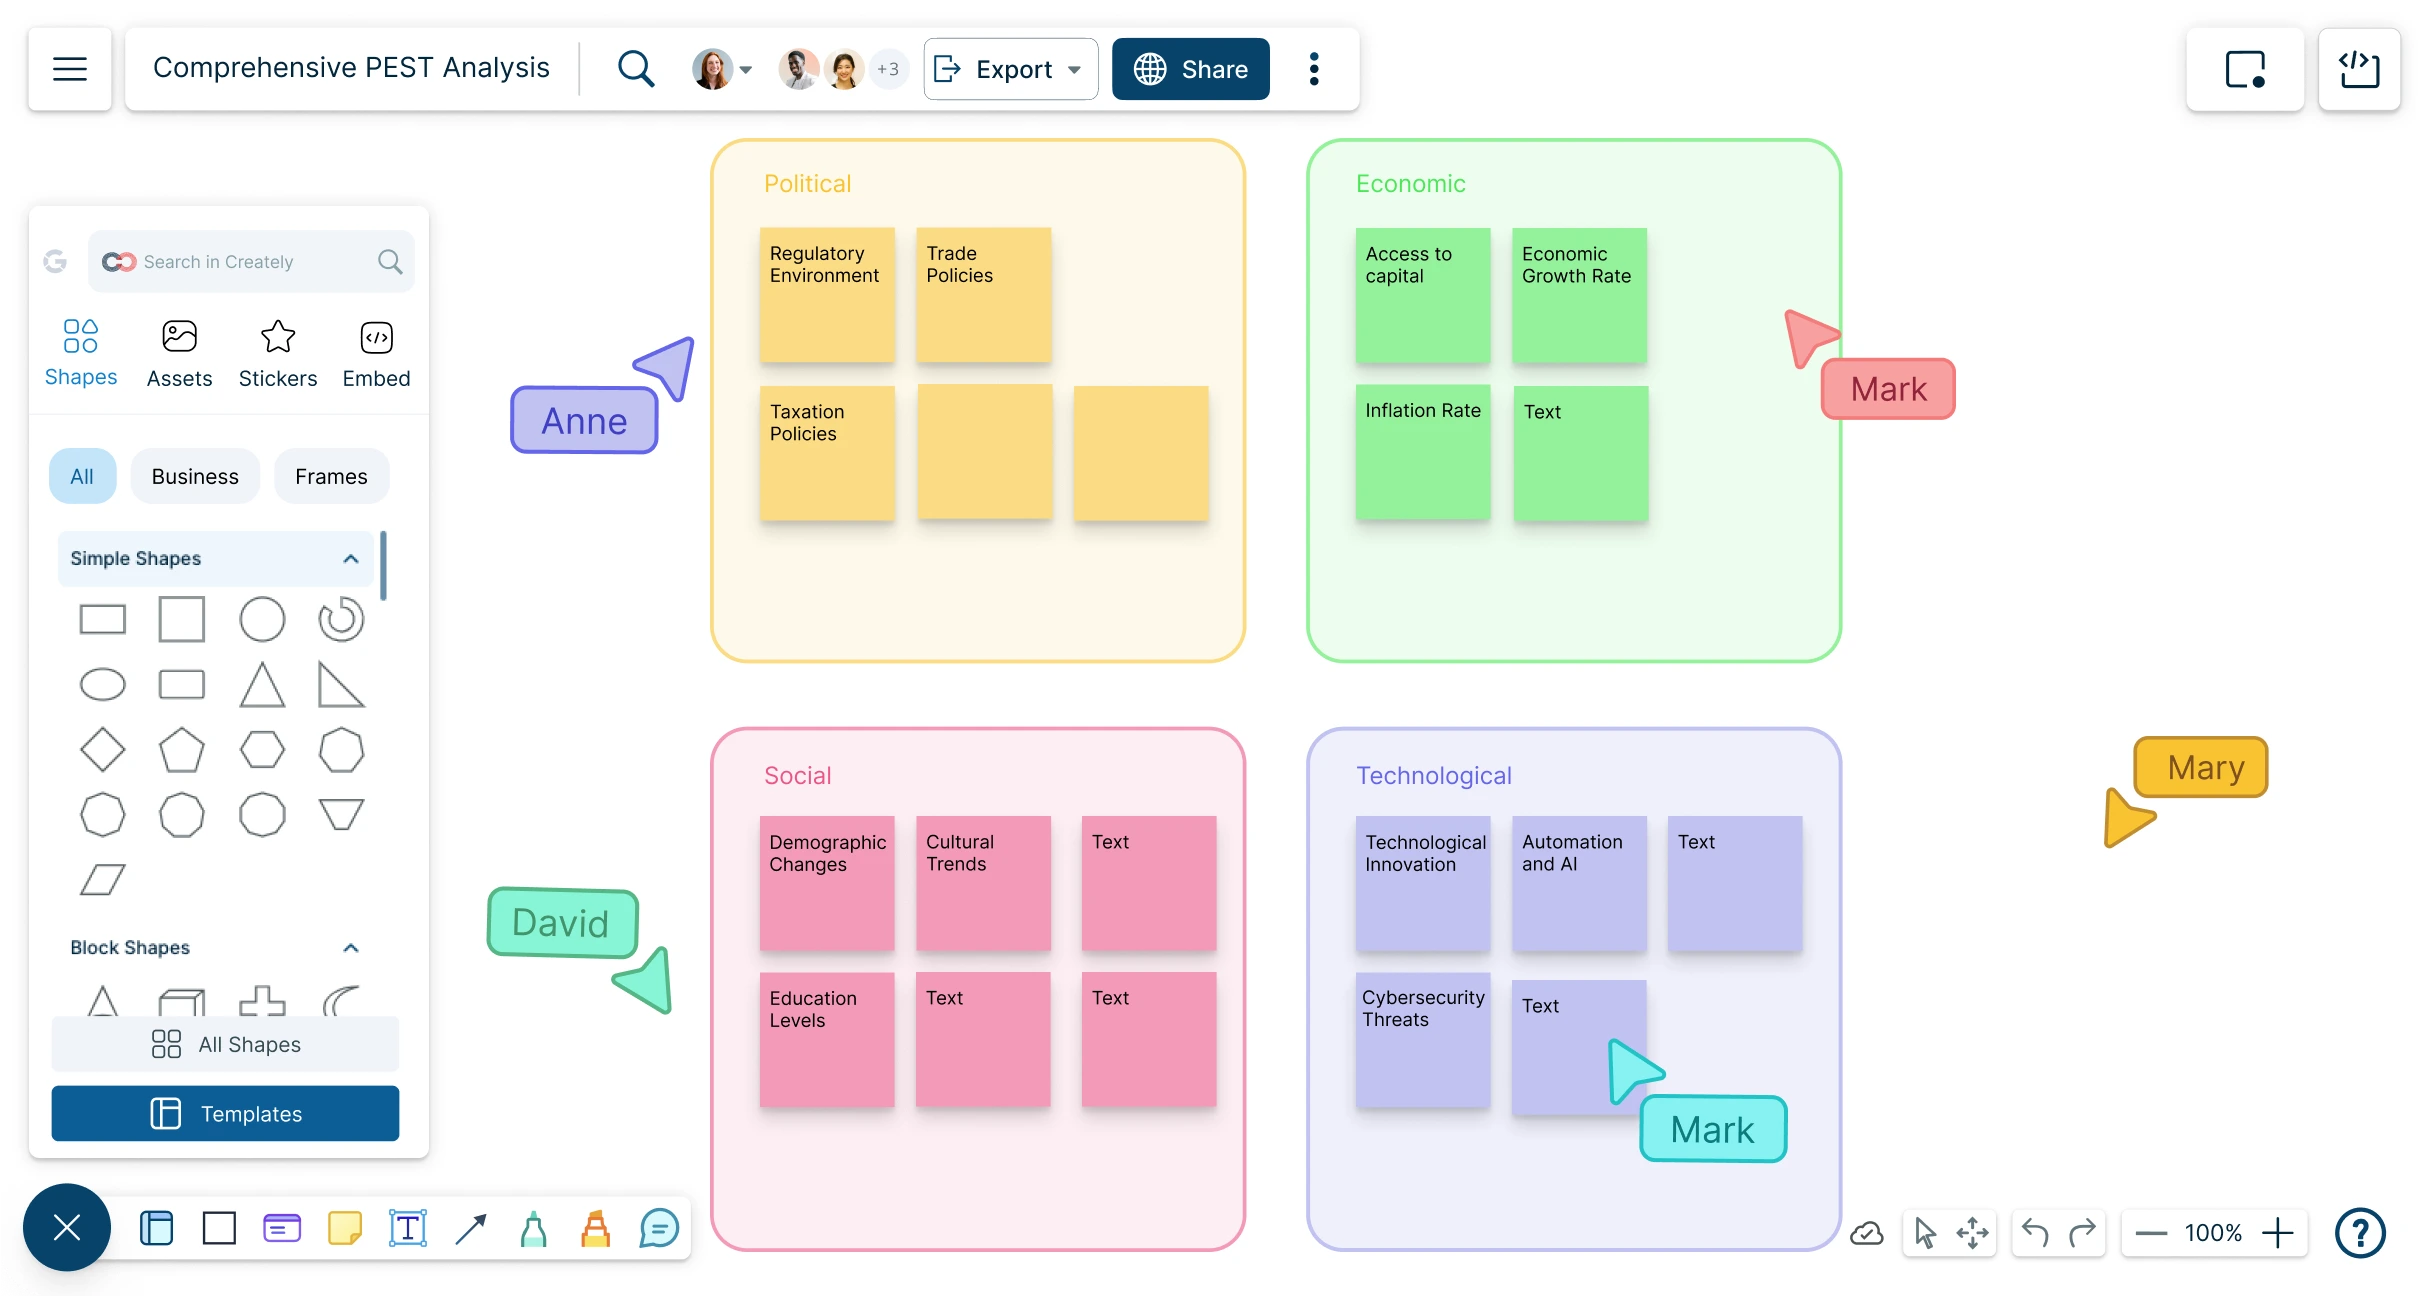
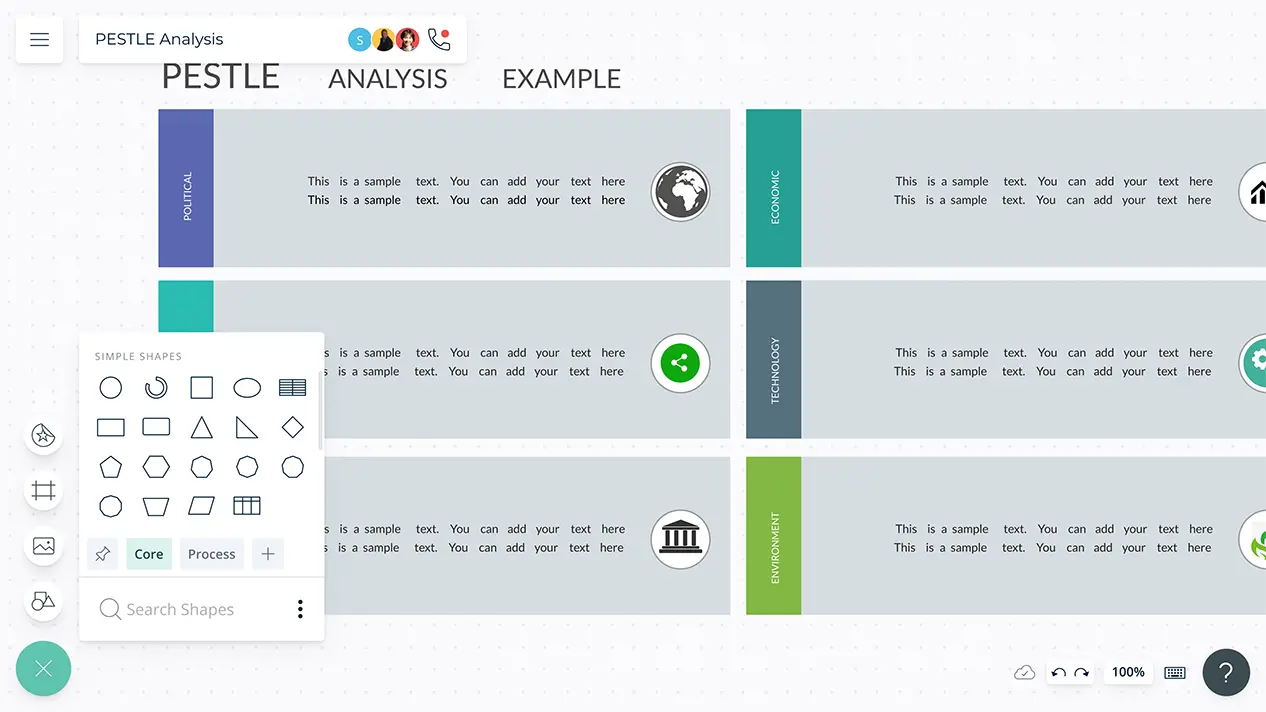
Creately’s PESTEL Analysis Generator instantly identifies key external factors, offers smart suggestions, and enables easy team collaboration—no manual work required.
Use AI-driven insights to analyze macroeconomic factors impacting your business and develop innovative strategies with your team to overcome challenges.
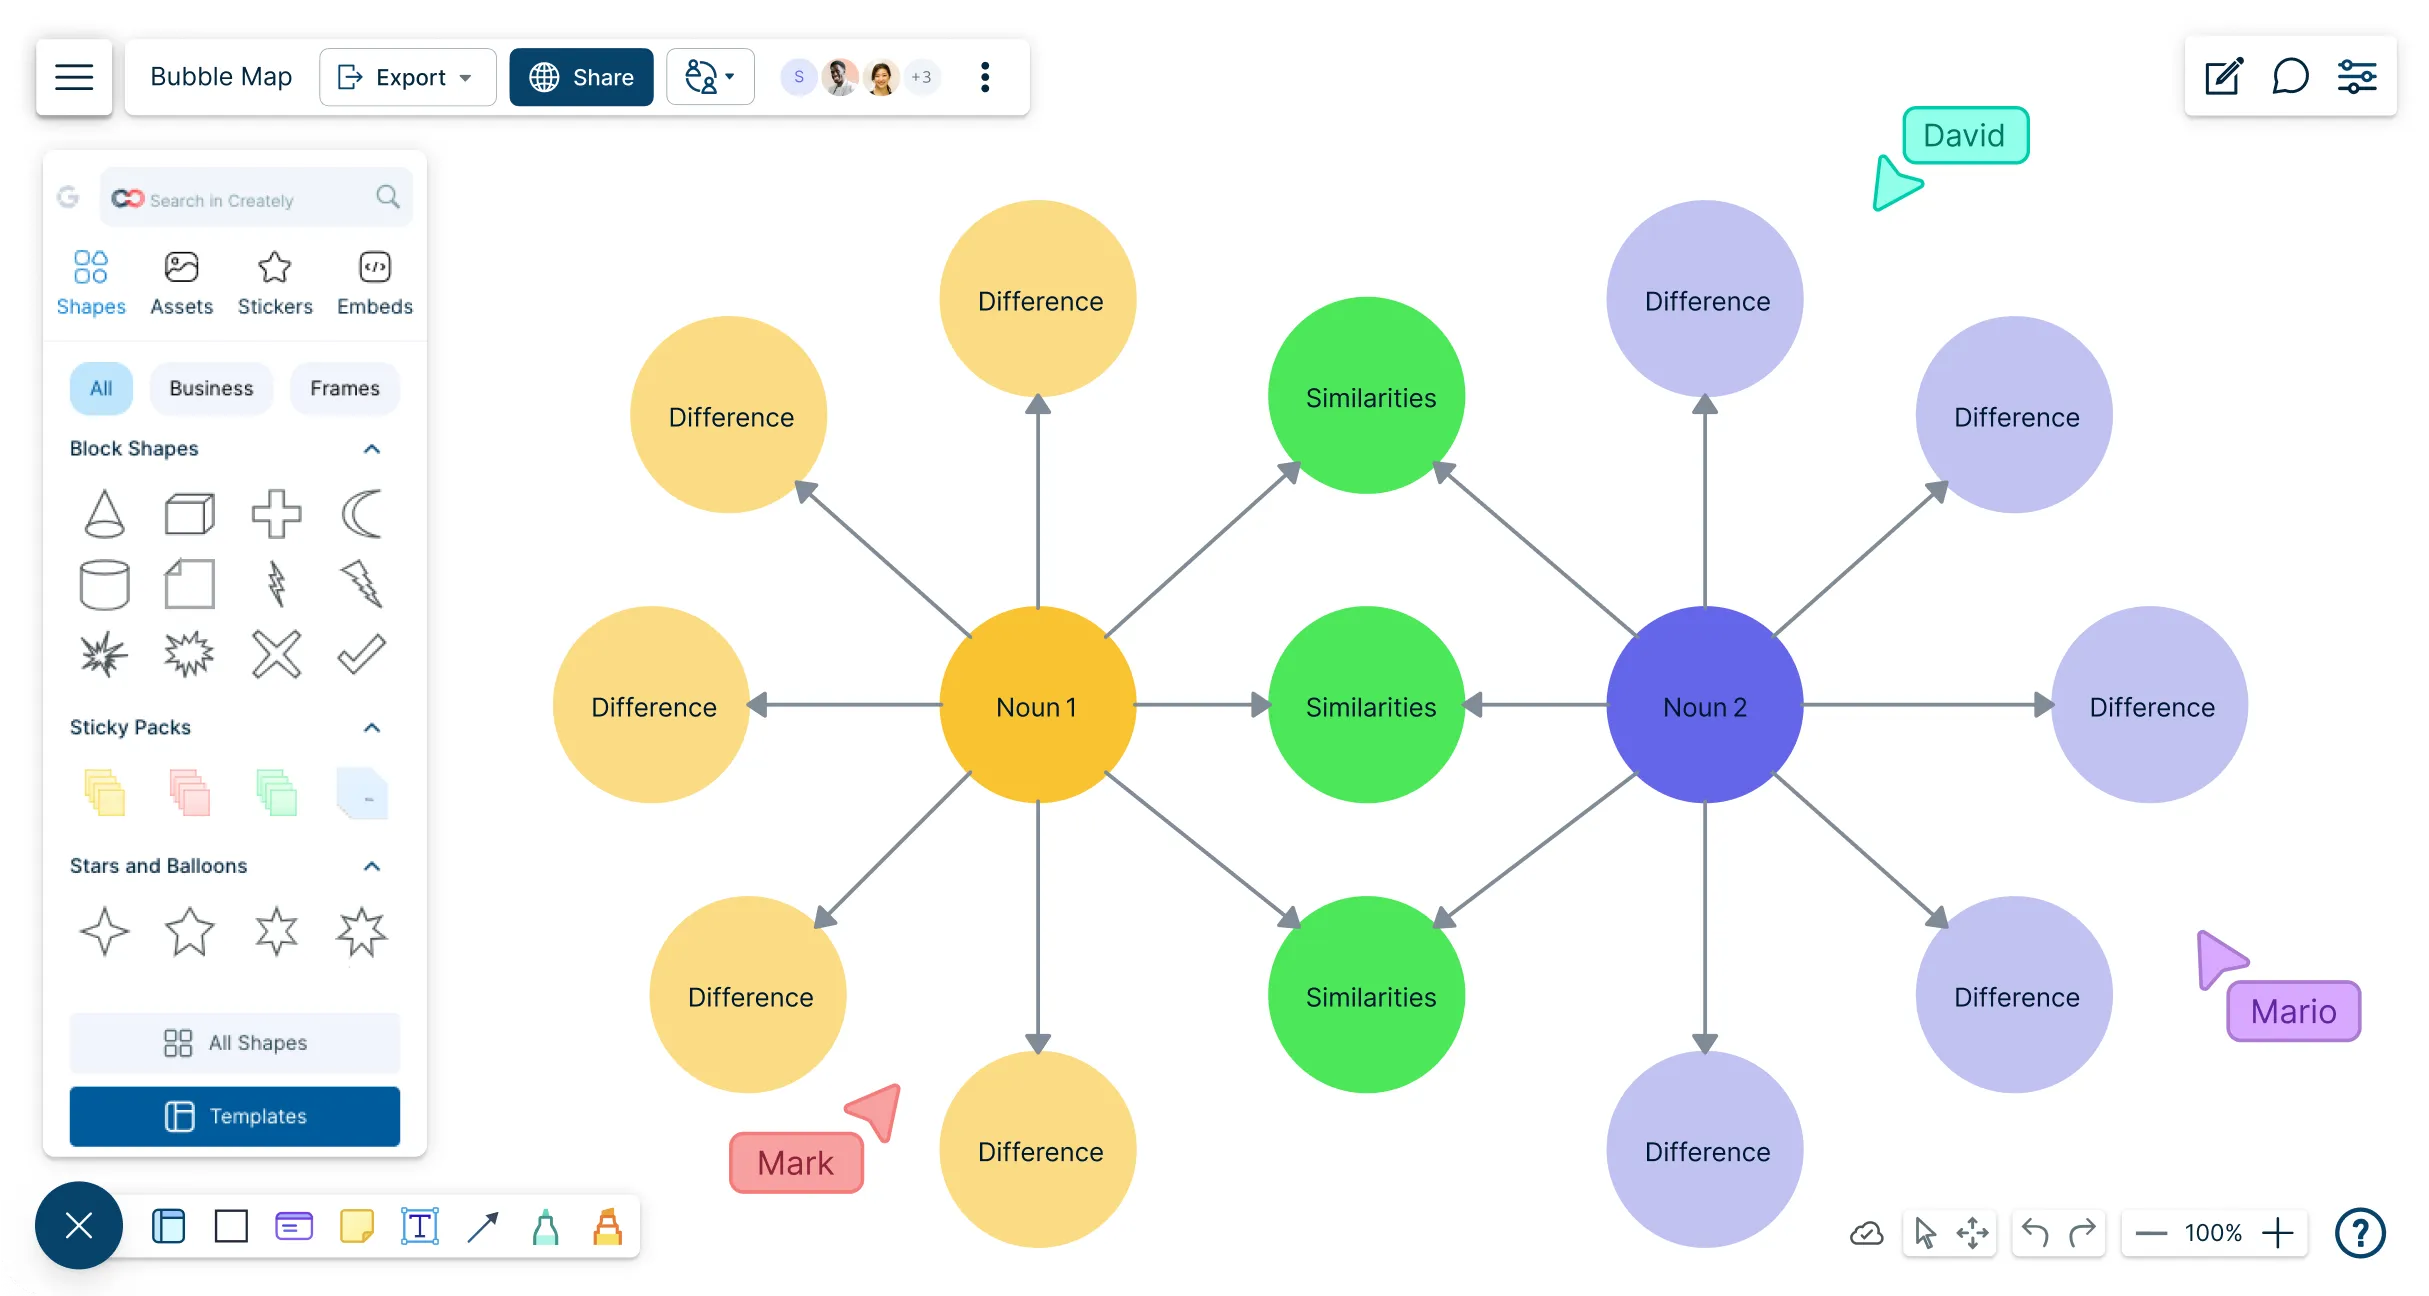
Visualize ideas, organize information, and boost creativity with Creately’s online bubble map maker. Create functional and creative bubble map that turn your thoughts into clear, actionable plans.
Use customer experience mapping templates to understand experiences at each stage, identifying needs, issues, and brand interactions.
Collaborate seamlessly on segmenting your market and developing successful marketing campaigns.
Streamline your sprint retrospectives, foster collaboration, and drive continuous improvement.
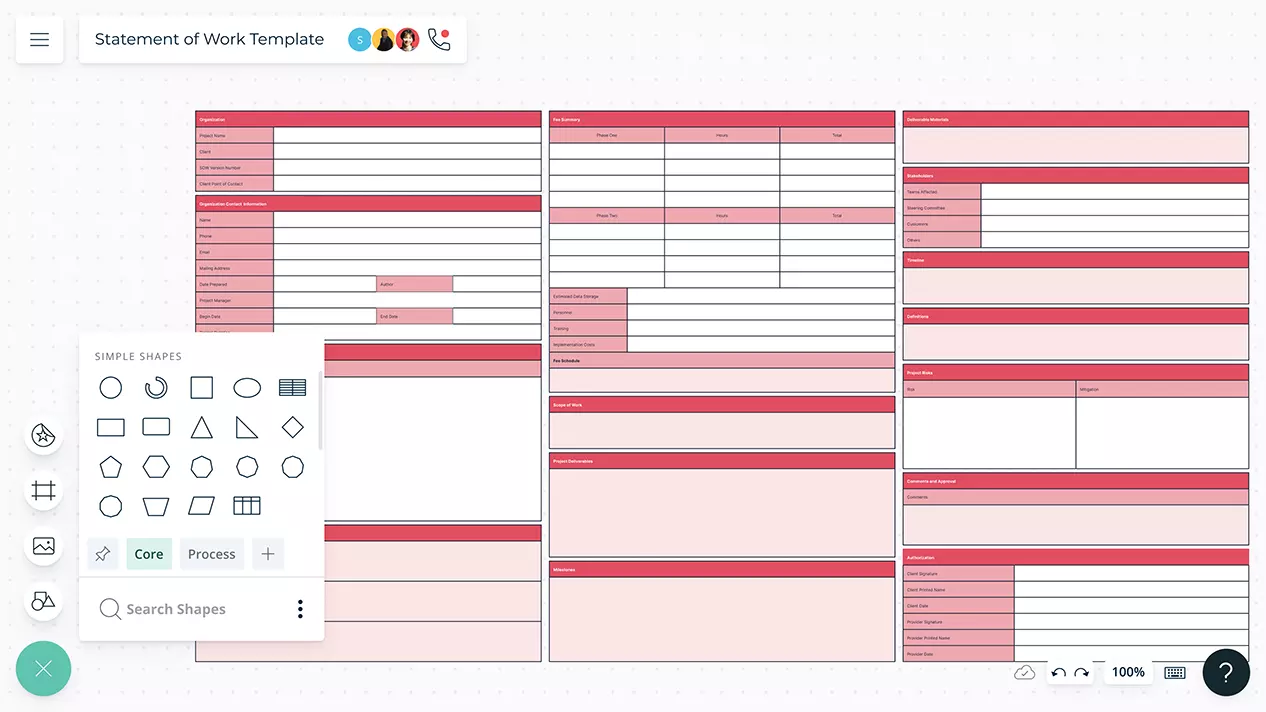
Intuitive visual tools and collaboration capabilities to create a Statement of Work document to clarify and communicate project requirements.
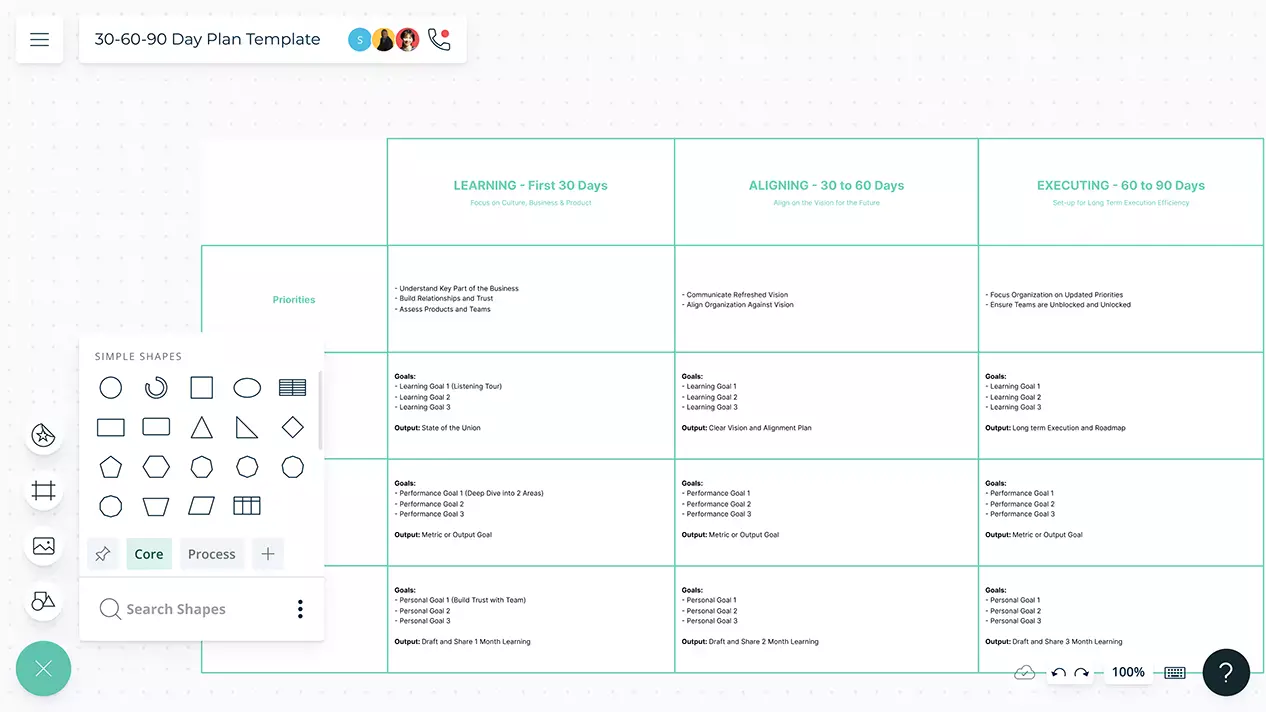
Map out an effective plan at various stages of an employee’s onboarding journey.
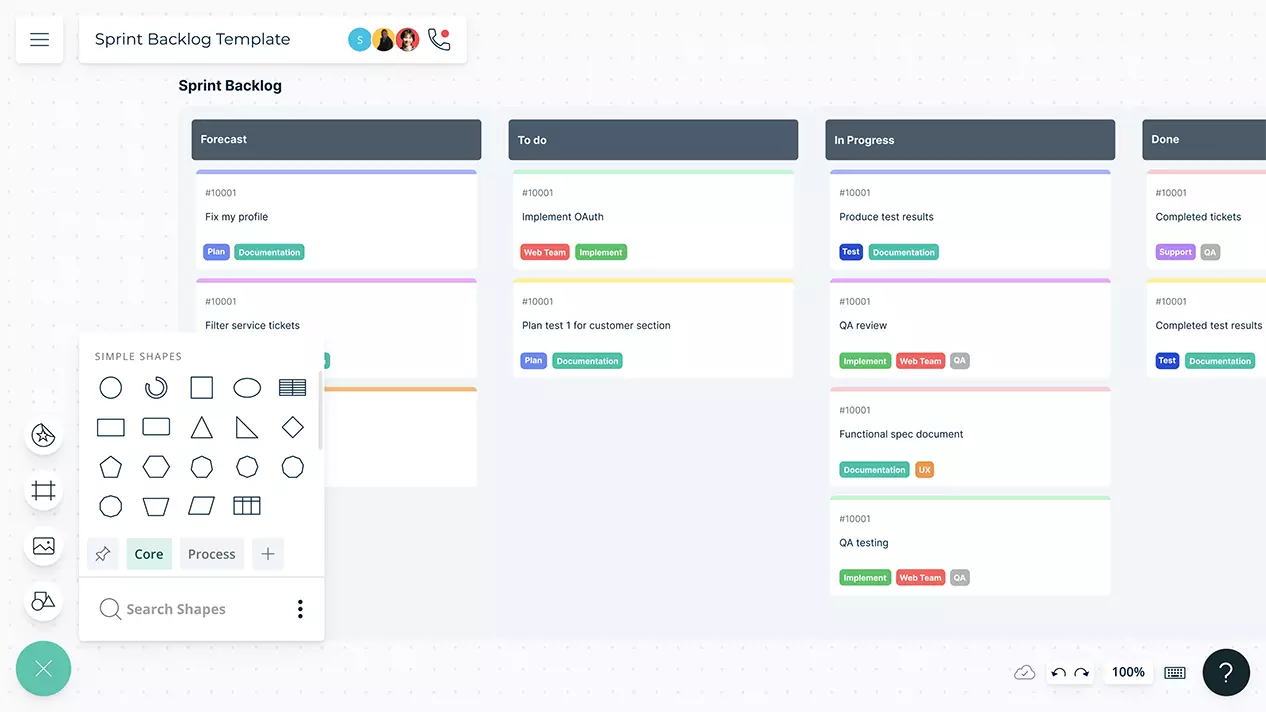
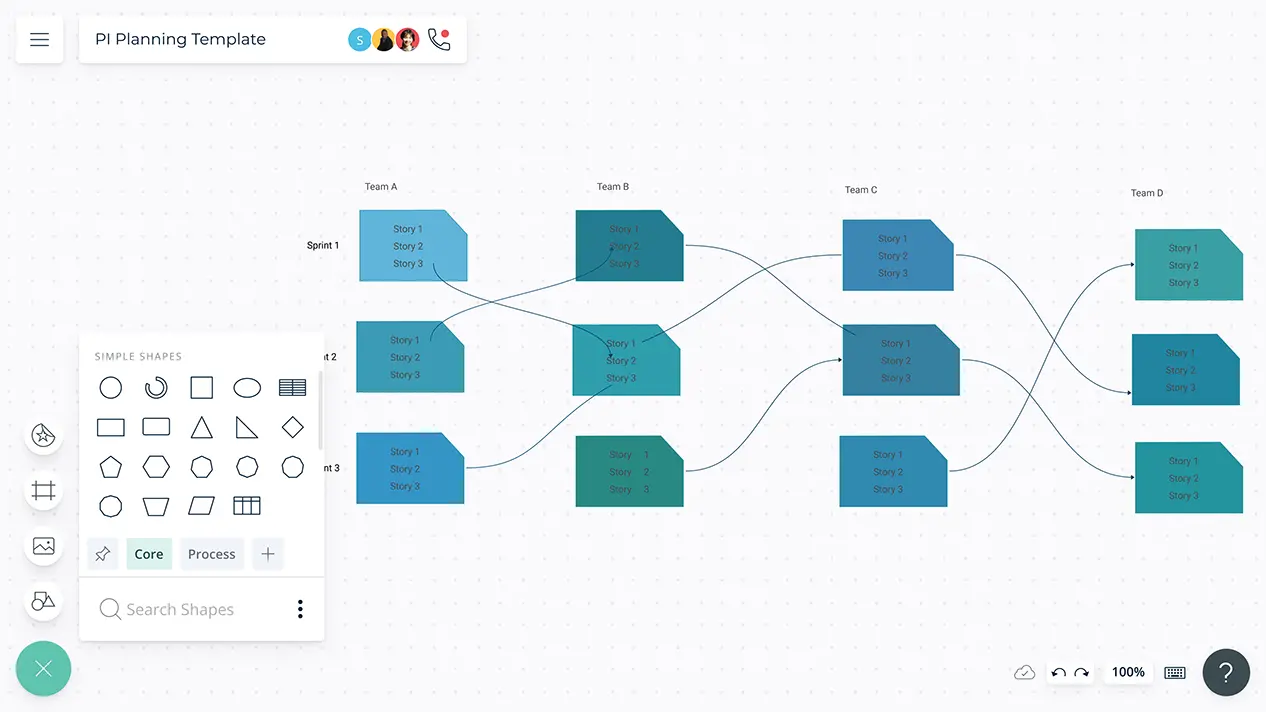
Visual framework to prioritize tasks and user stories from your product backlog to include in your weekly sprint.
Build a comprehensive visual representation of all your project activities.
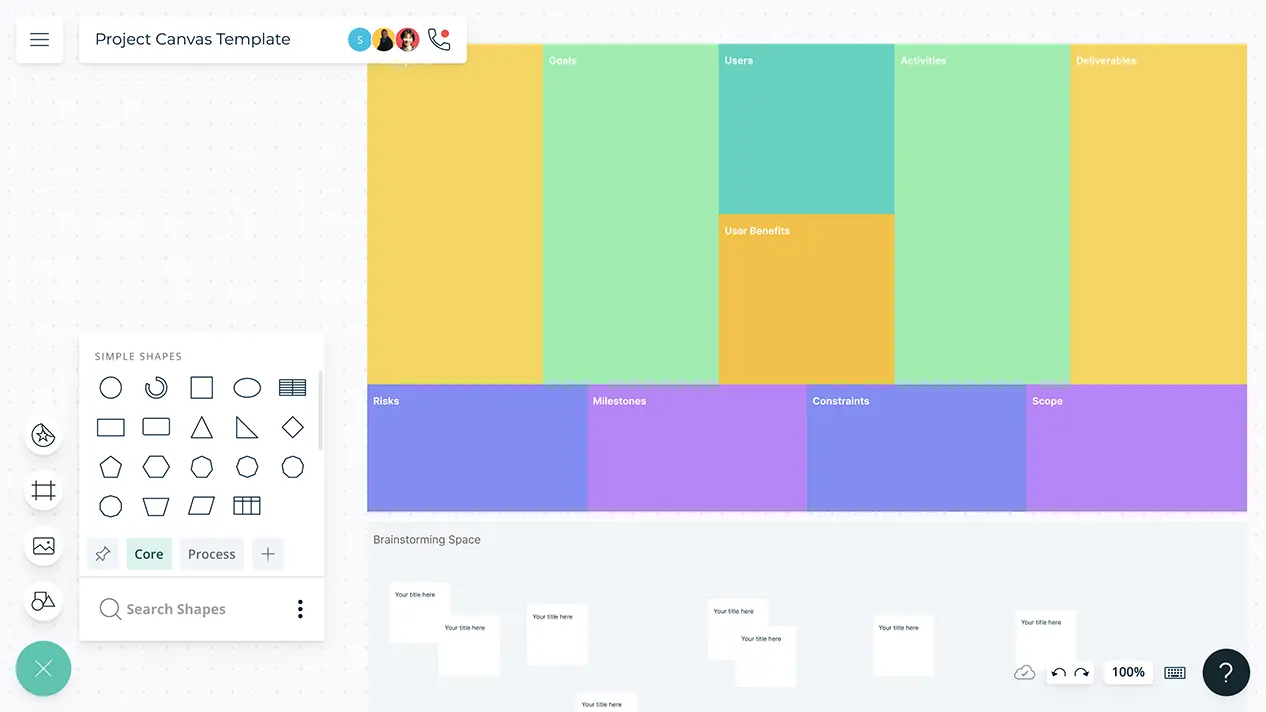
Structure your projects visually to define the project scope, goal and approach for better clarity and direction.
From ideation to release, collect actionable insights across teams to create better user experiences.
Successfully identify and bridge the gap between the present and desired performance of your organization.
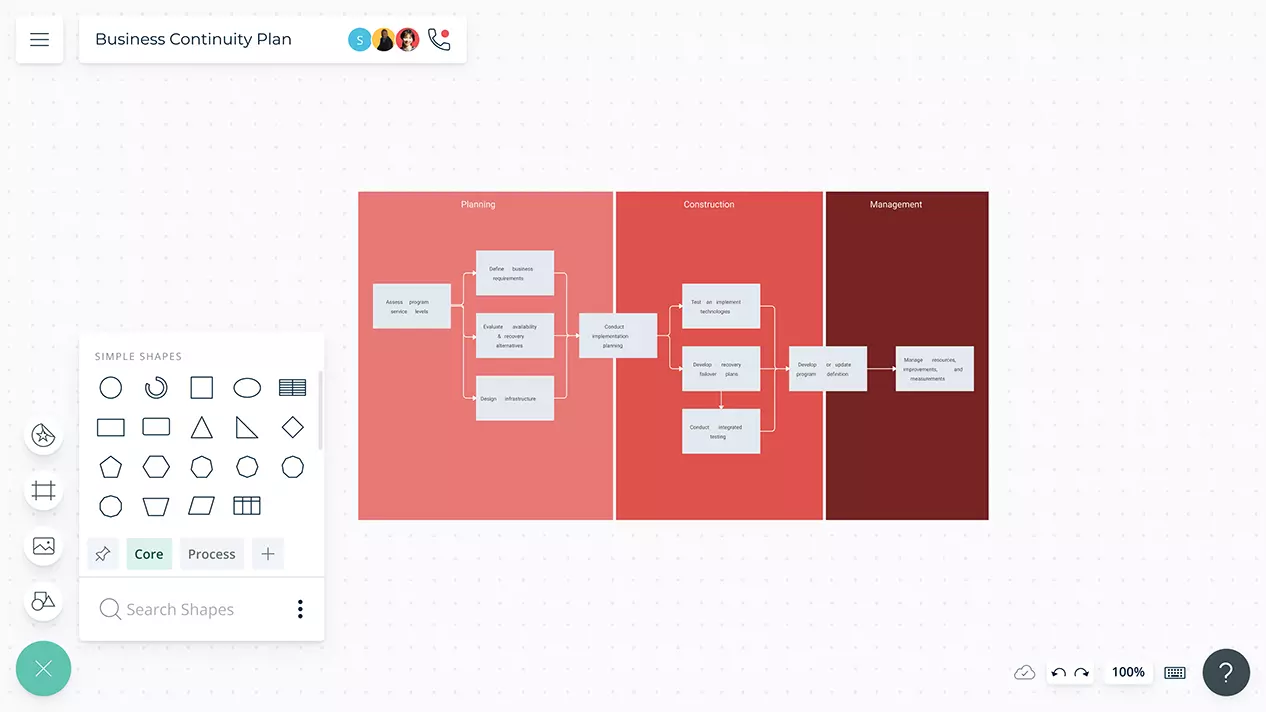
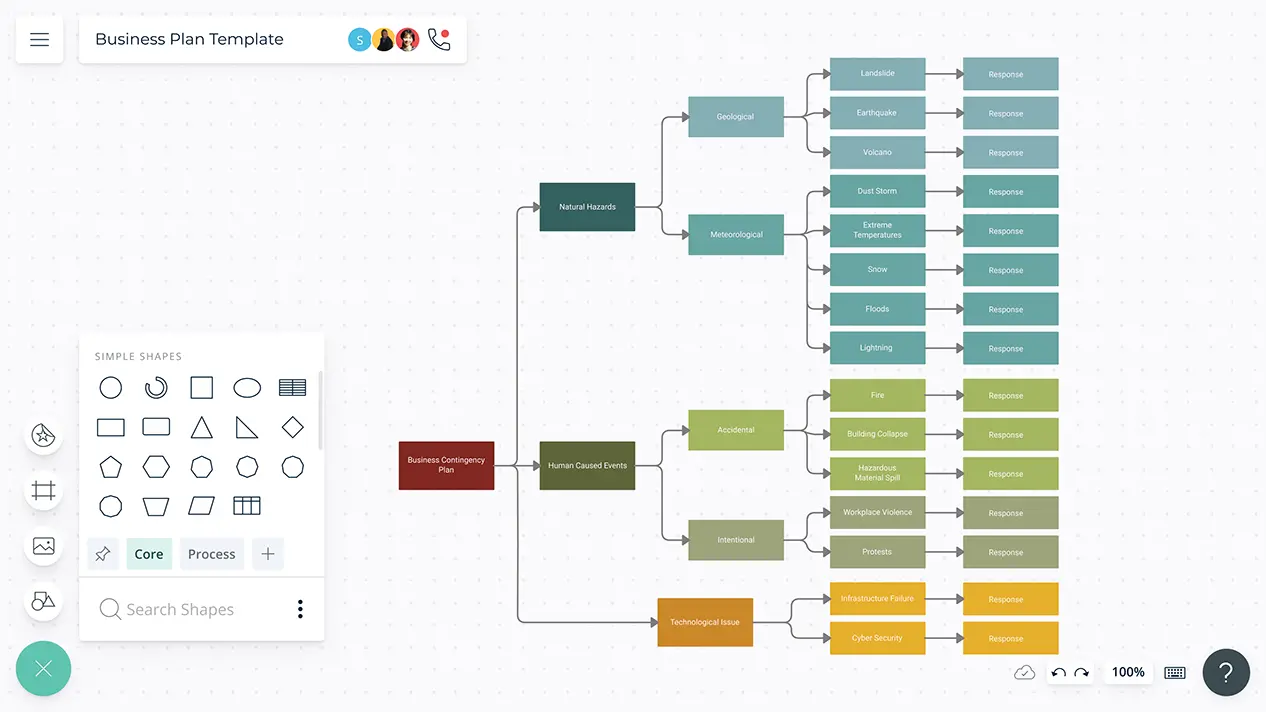
Map out effective strategies for keeping your businesses operational despite emergencies.
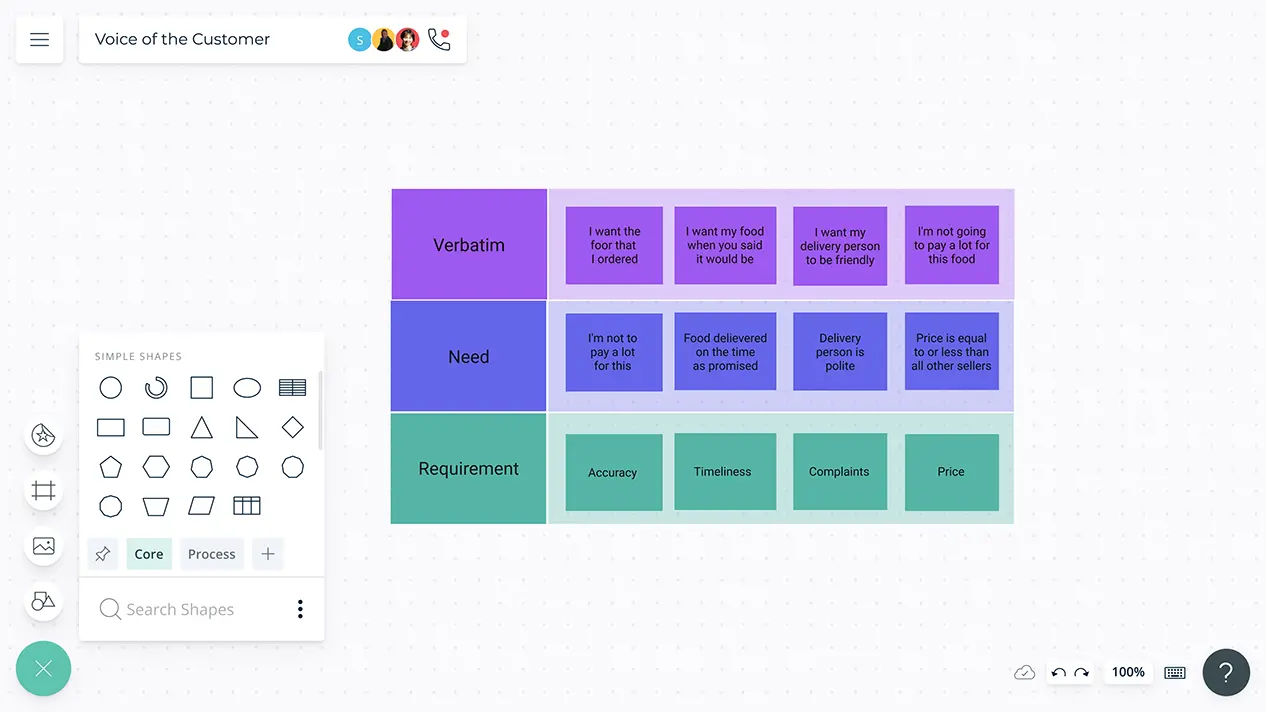
Visualize customer feedback and create a framework to translate them into product attributes.
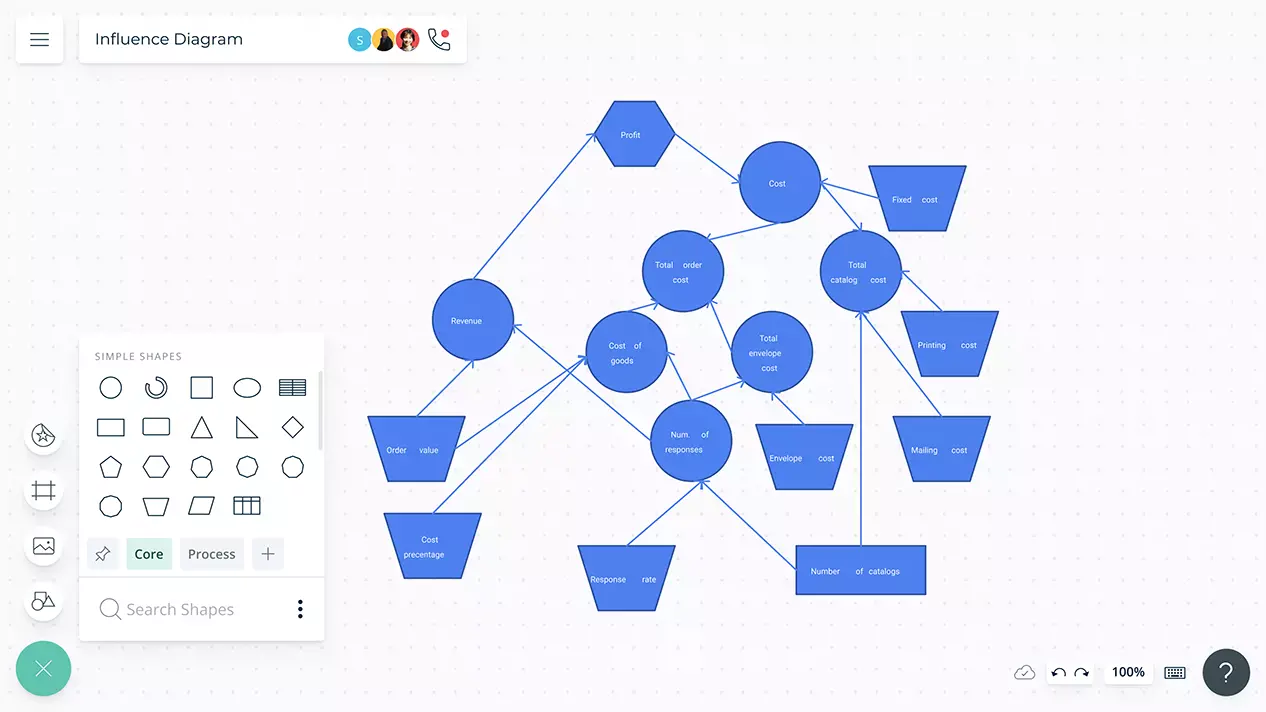
Effortlessly visualize the causal relationships between decisions, external factors, uncertainties and outcomes to make decisions effectively.
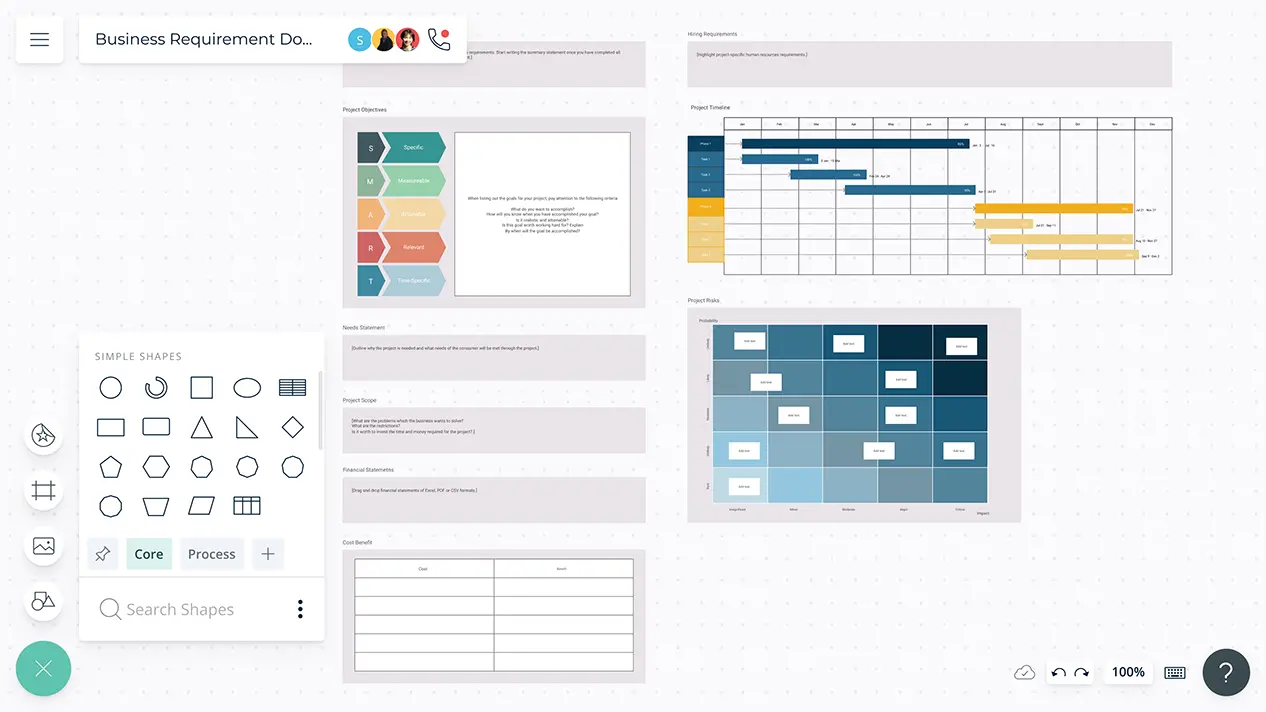
Effectively document and share intricate details of your projects and ensure that all stakeholders are on the same page.
Collaborate seamlessly on innovative new product ideas with interactive online templates.
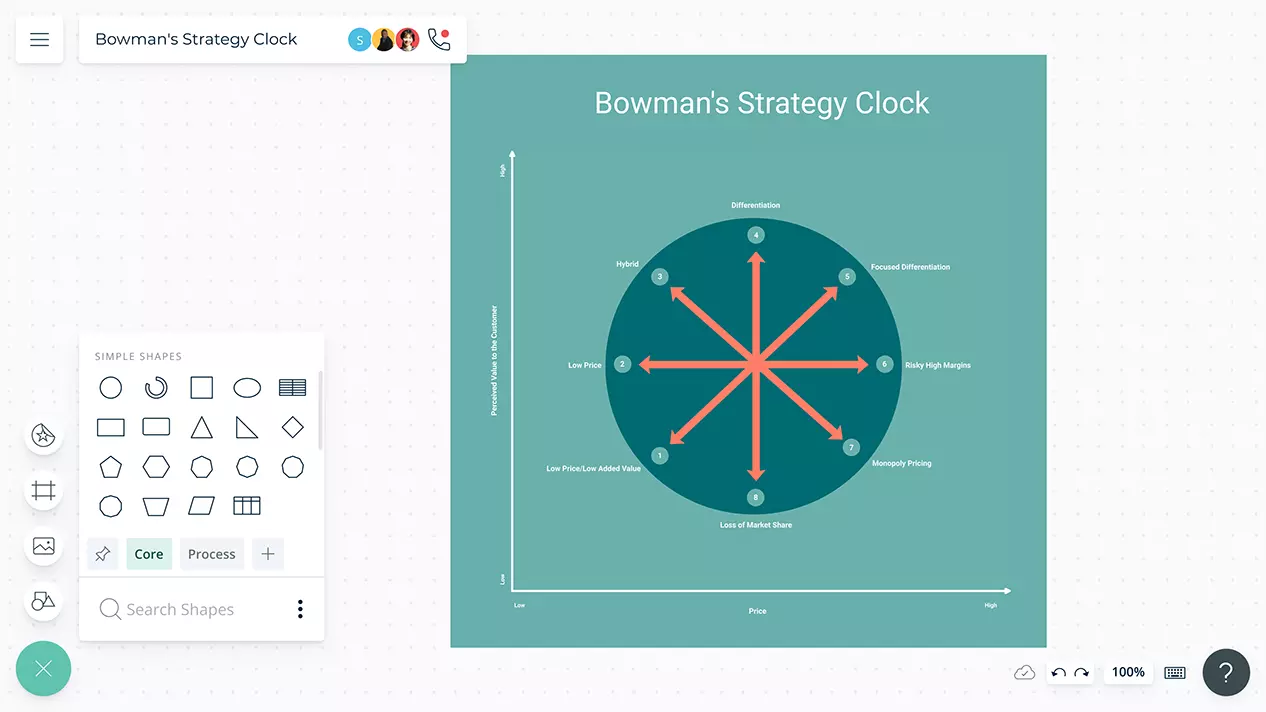
Explore potential opportunities for strategic positioning. Determine the positioning of your product or service based on the price and perceived value.
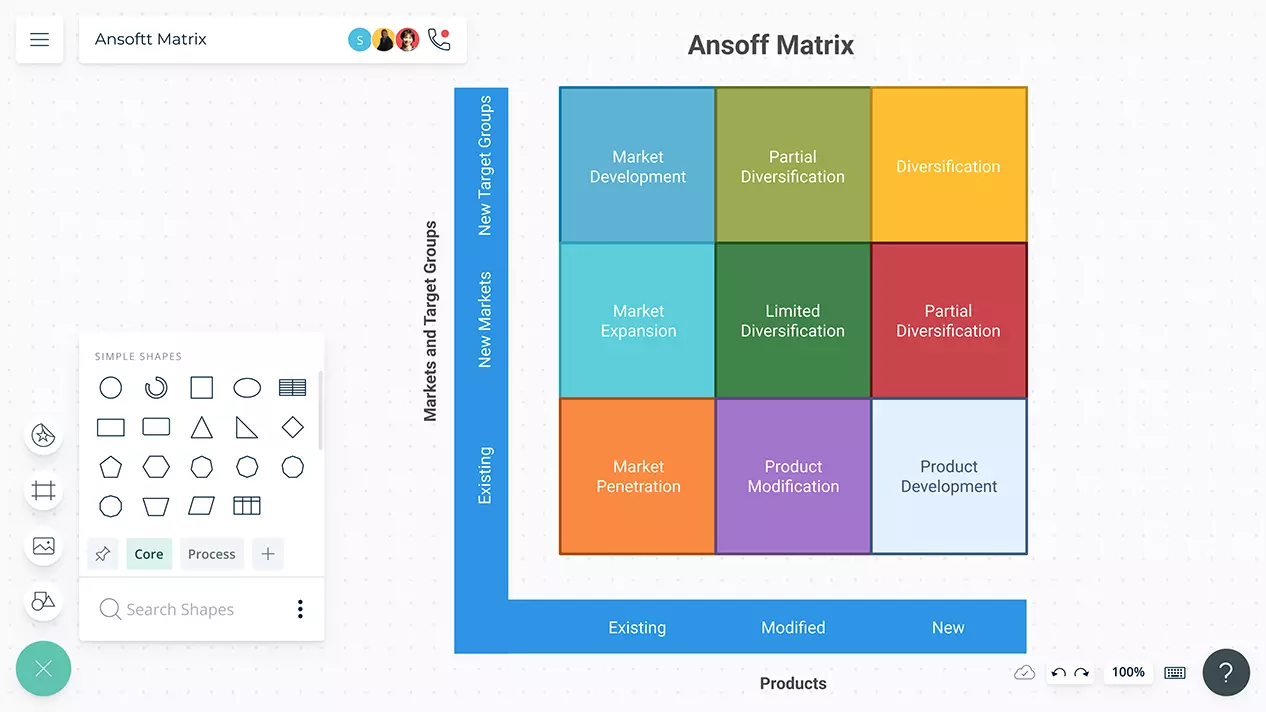
Collaborate with the team to identify viable growth strategies based on your company’s offerings.
Understand your organization’s landscape and plan ahead for rapid growth while being prepared to navigate successfully through uncertainty.
Carefully weigh the pros and cons of your decisions and choose the best approach to drive forward.
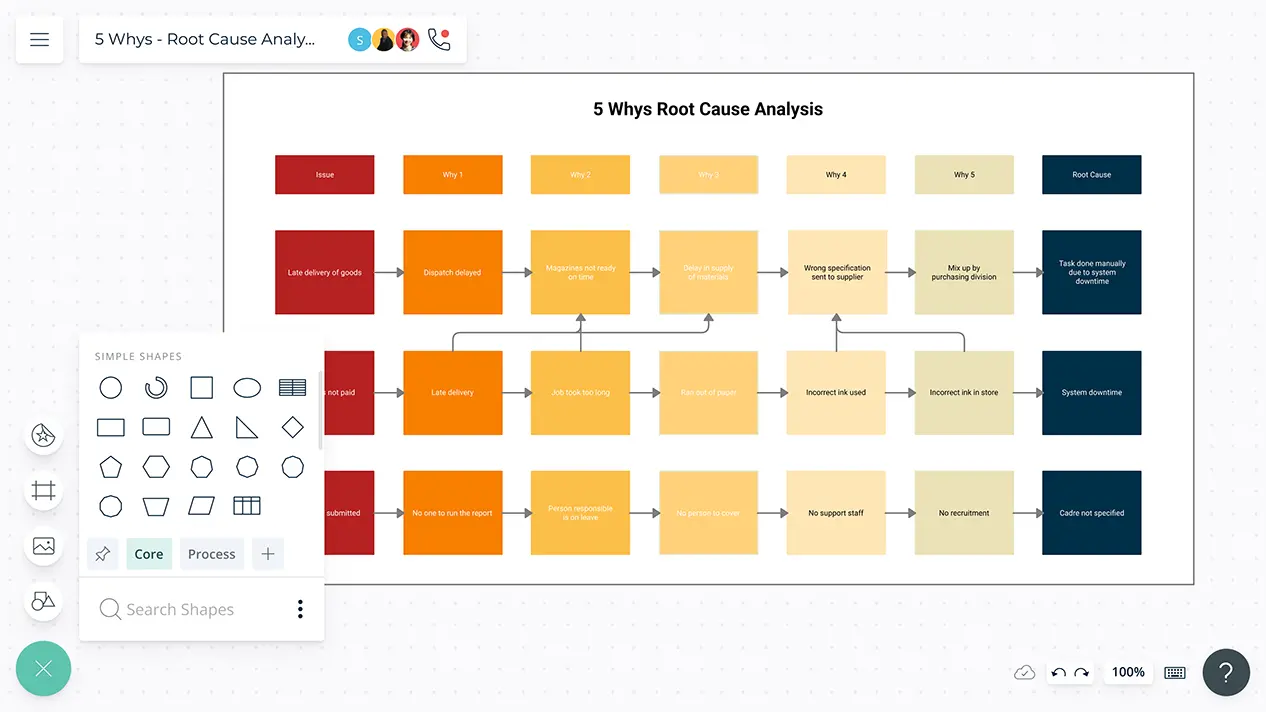
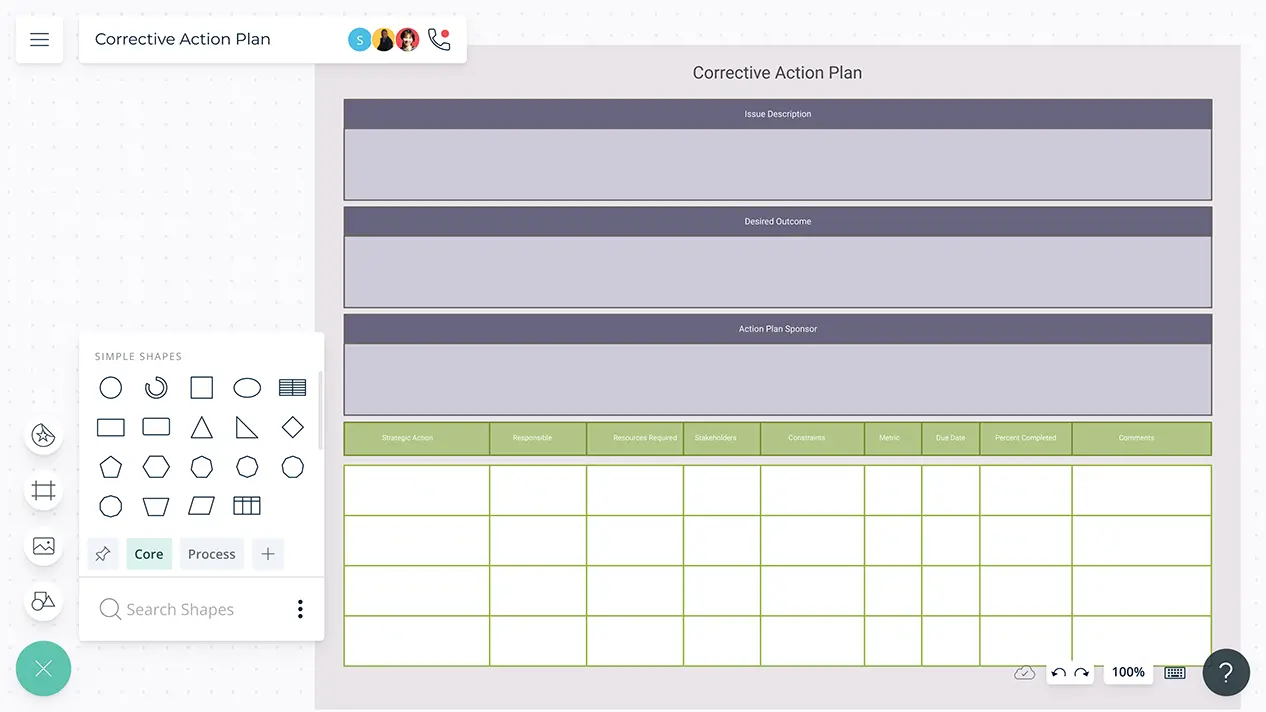
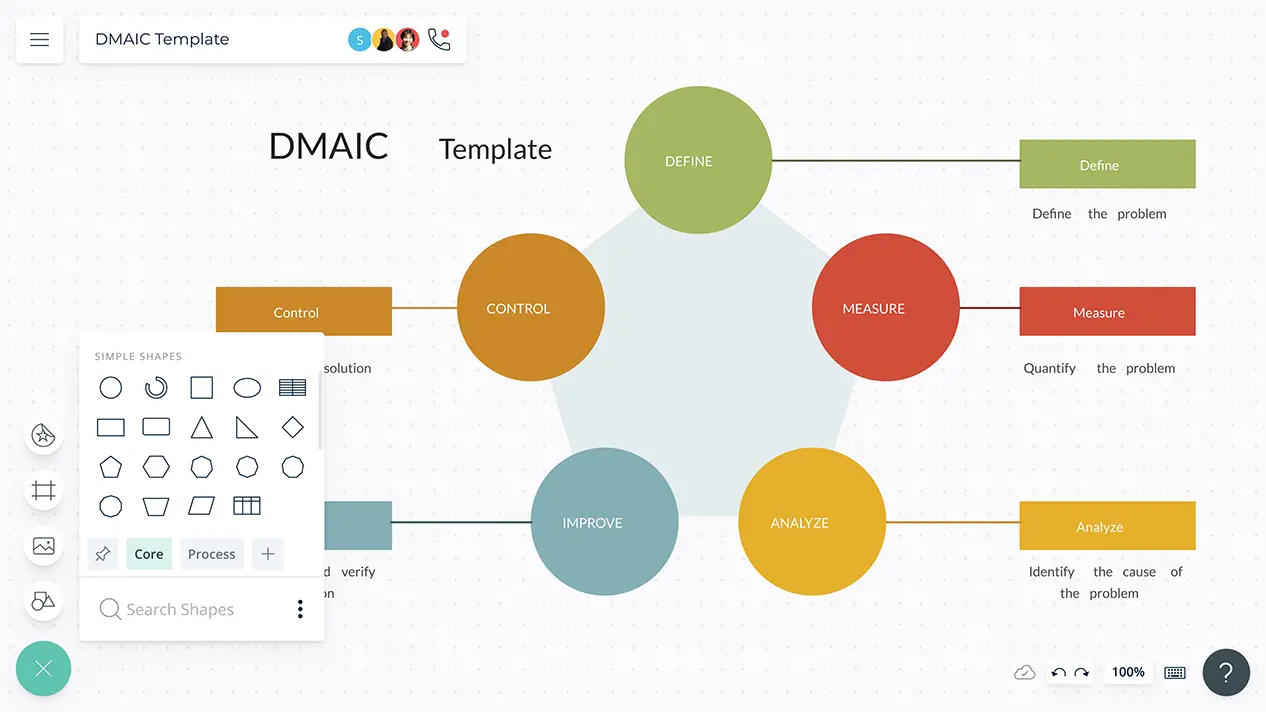
Improve inefficient processes in your organization by identifying root causes of problems and successfully mapping out corrective actions.
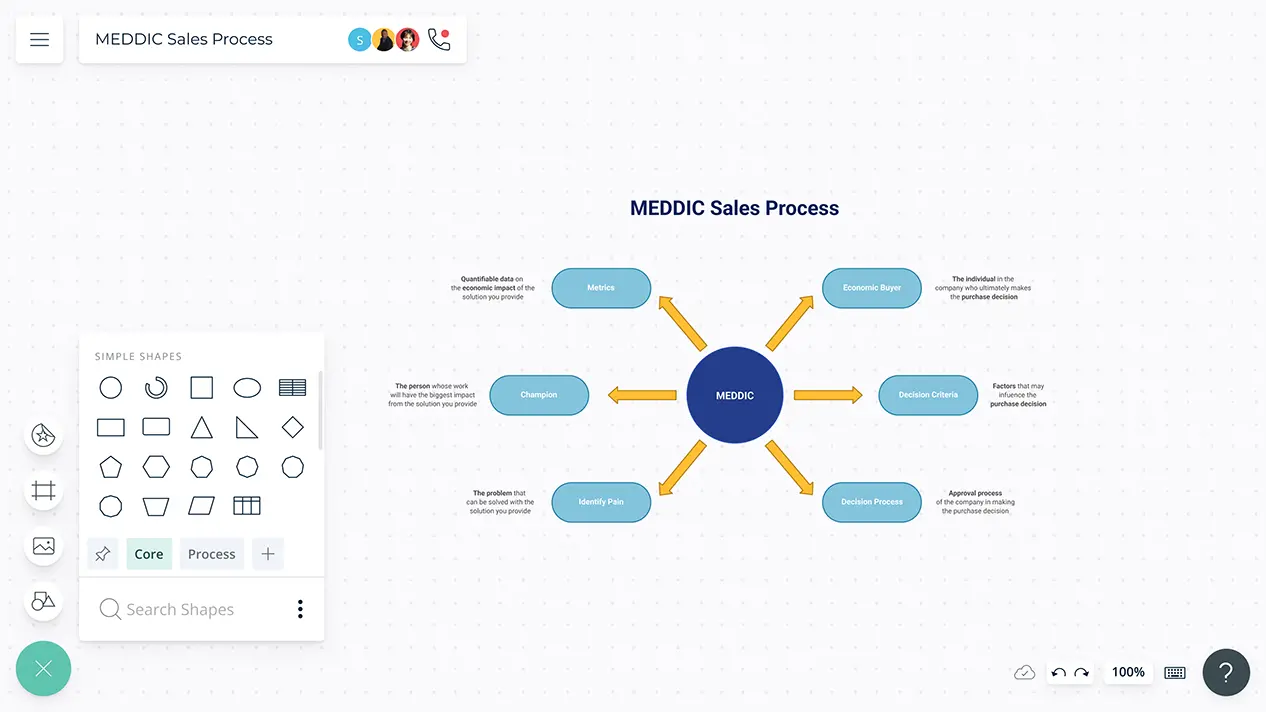
Maximize the efficiency of your sales by knowing and qualifying the right audience.
Understand business requirements and areas of improvement to enhance the productivity of workflows and streamline business operations.
A single connected visual workspace to get your team to synchronize, collaborate, and align on workflows, objectives, and releases.
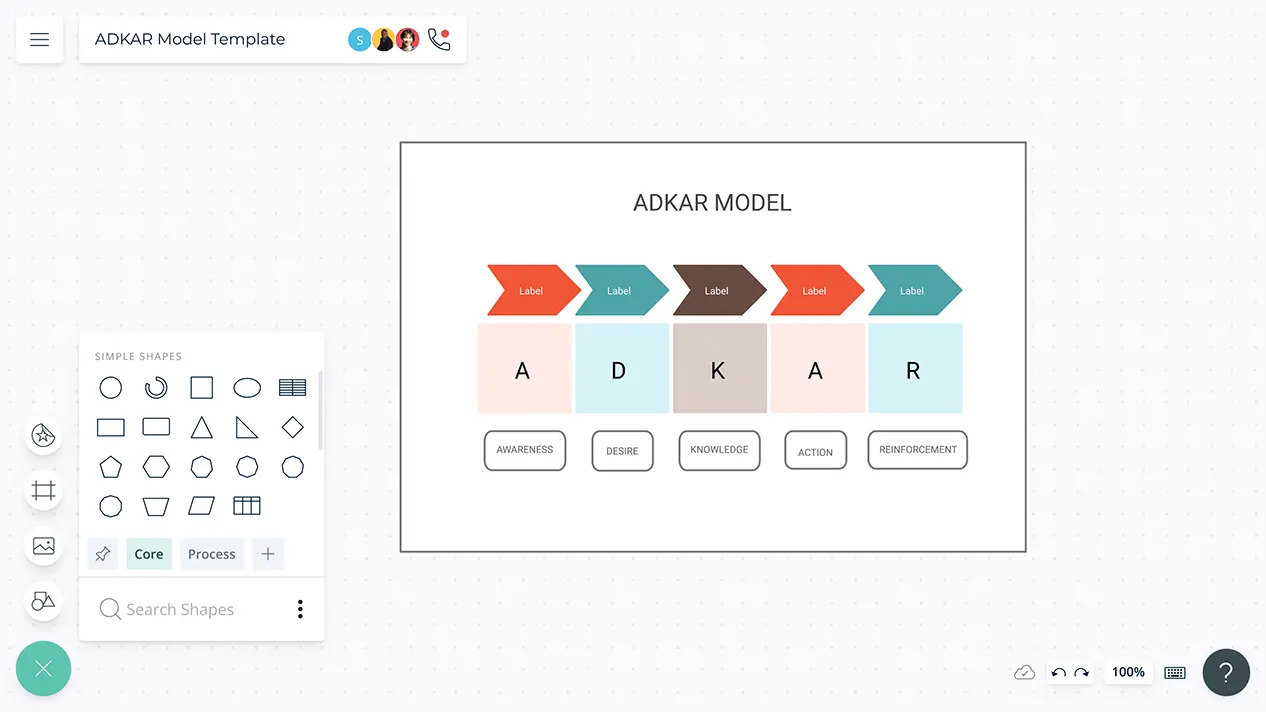
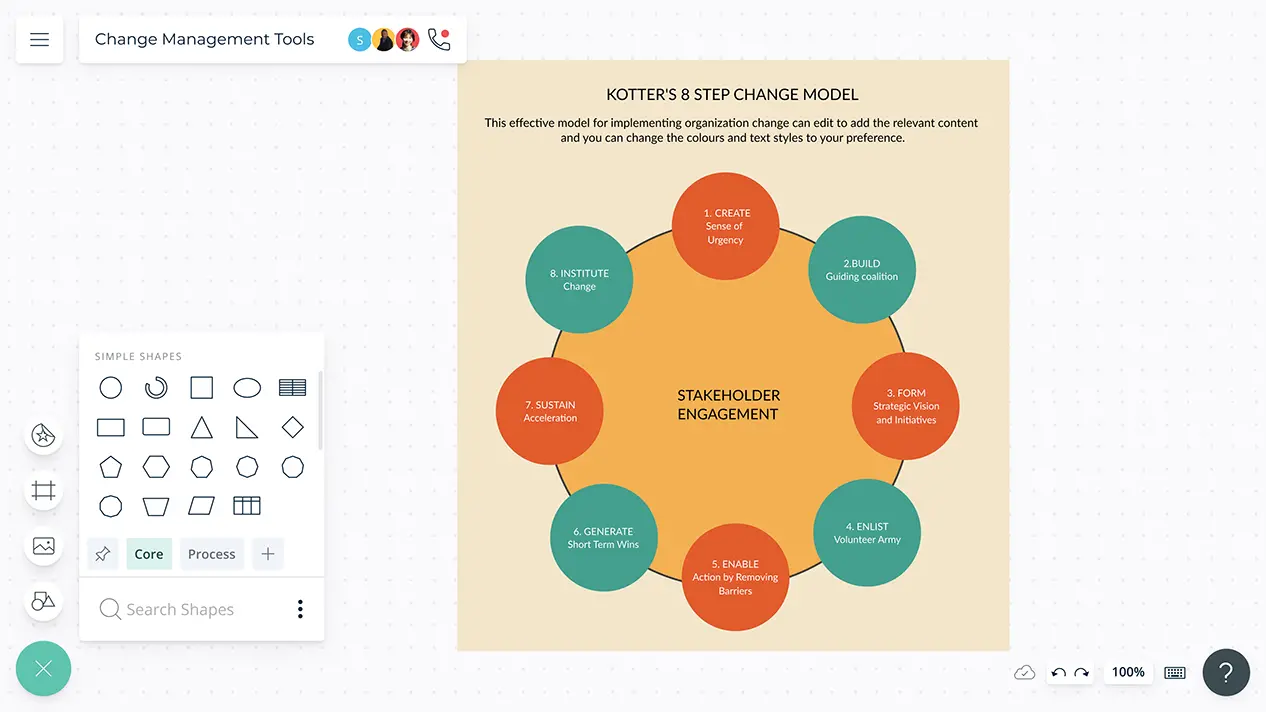
Develop effective change management strategies using the ADKAR model to help people better embrace and adopt change.
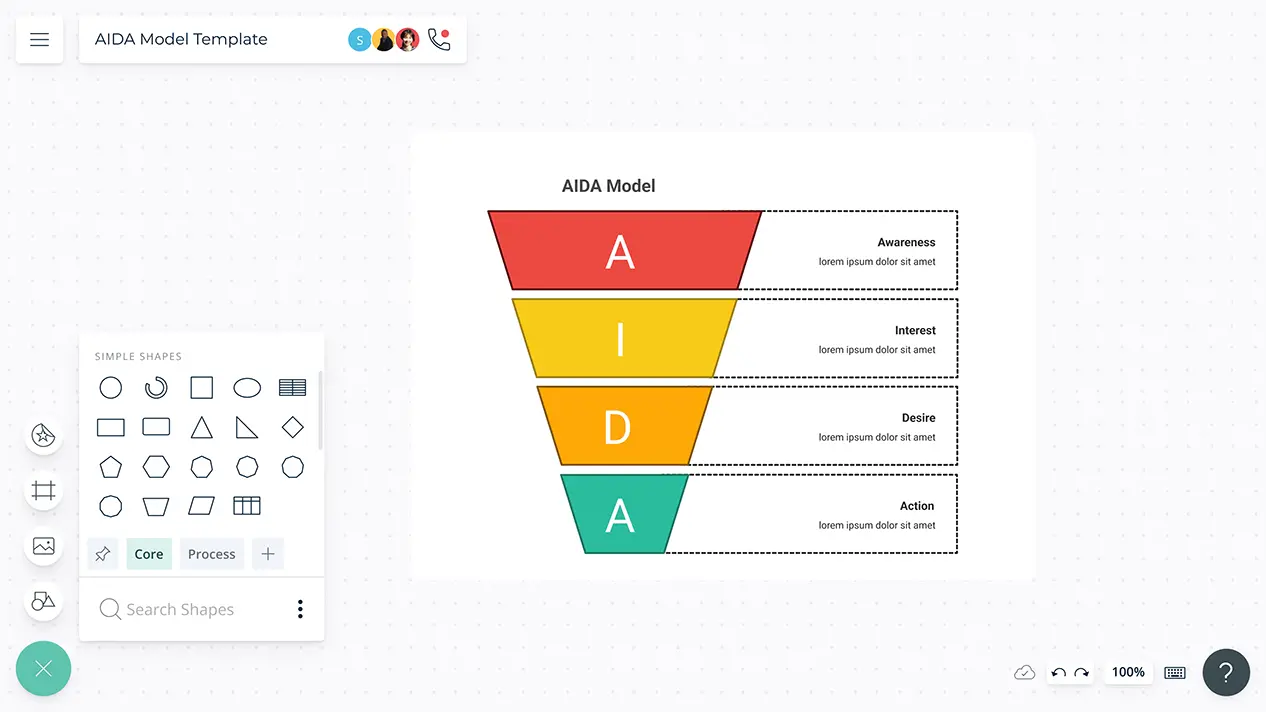
Trace your customers' journey through awareness, interest, desire and action stages with your sales and marketing team.
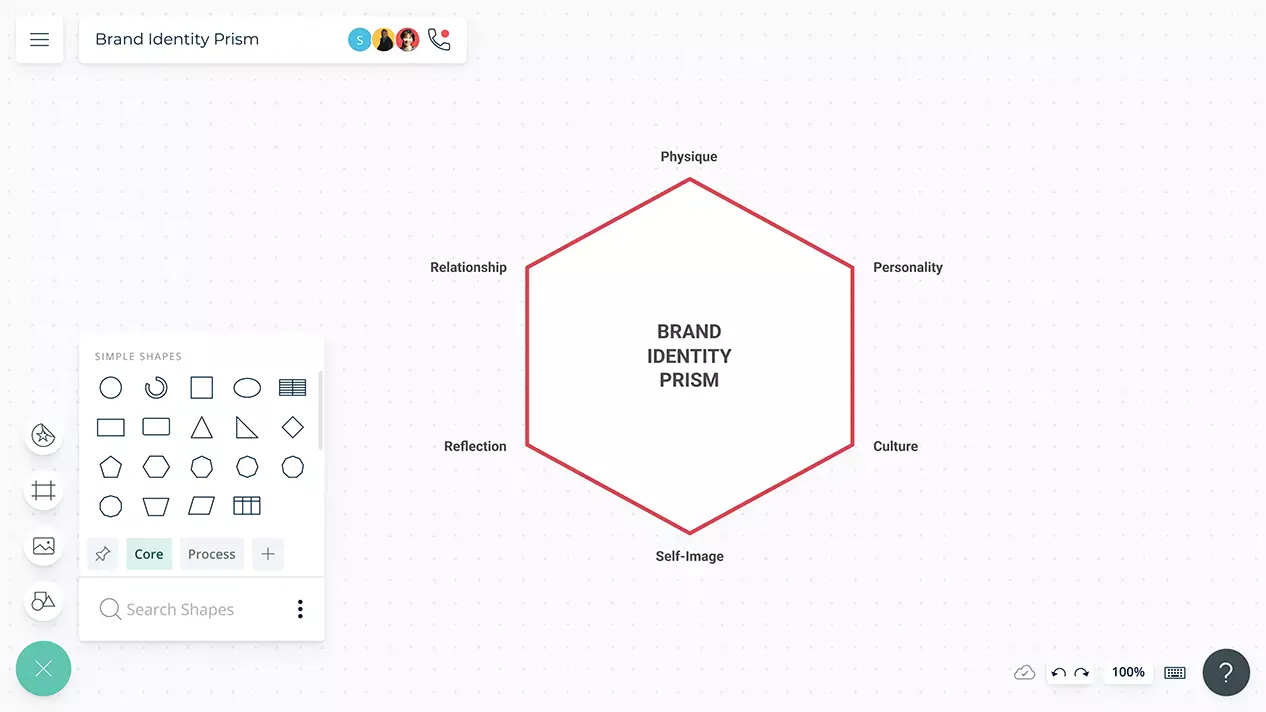
Collaborate around clarifying your brand identity and building a brand image that resonates well with your customers.
Identify favorable competitive positions for your organization and formulate go-to-market strategies.
Identify, analyze, and manage threats to your business collaboratively.
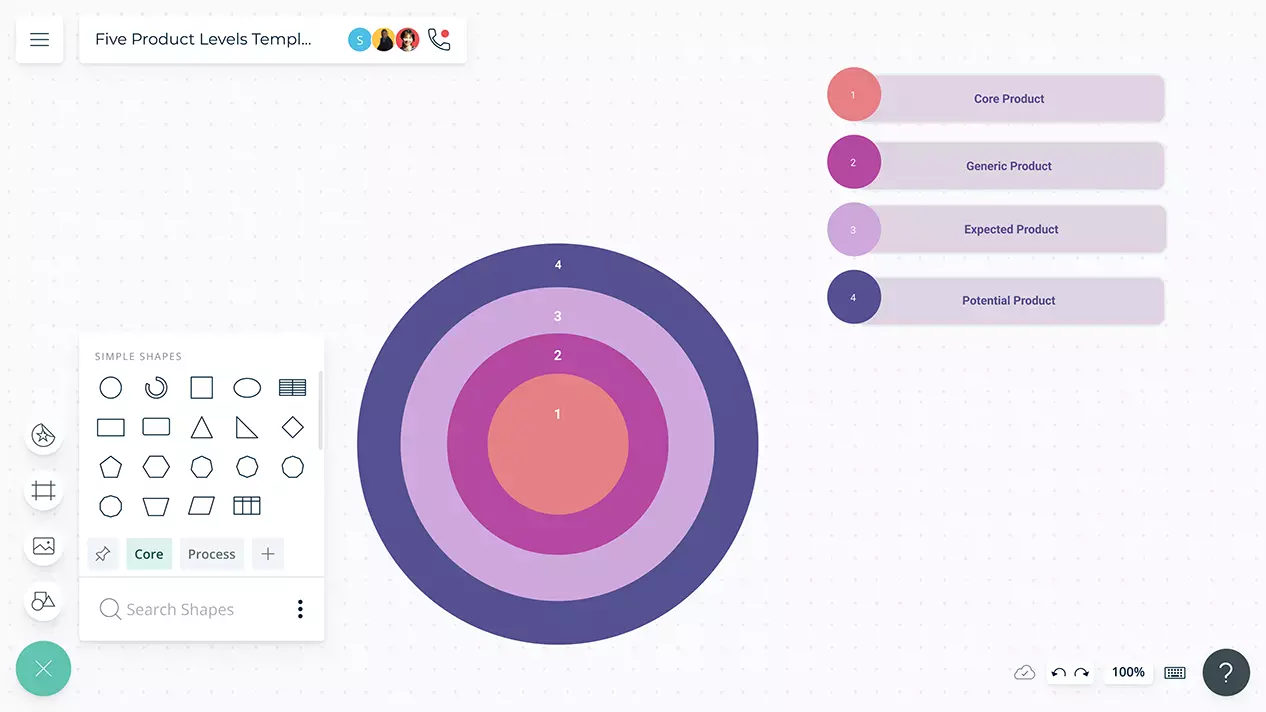
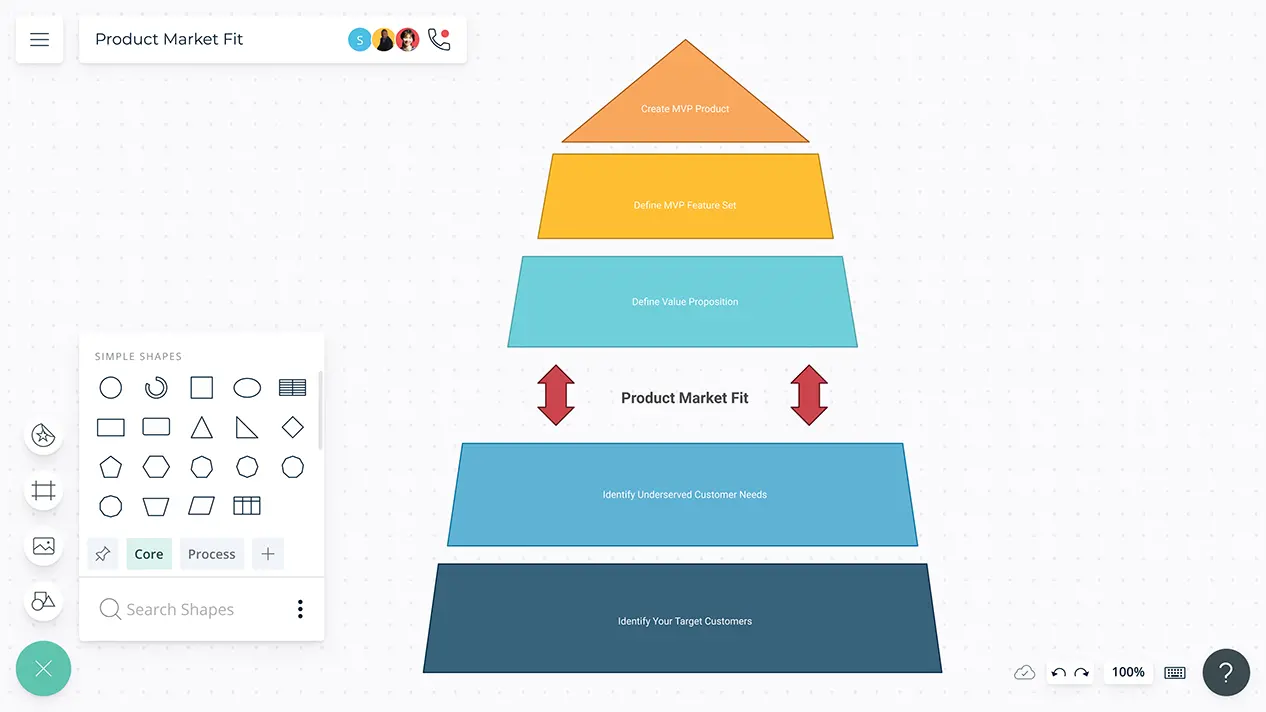
Easily identify how your products align with market needs for better design, position, and strategy.
Smart visual tools to steer your change management process in the right direction.
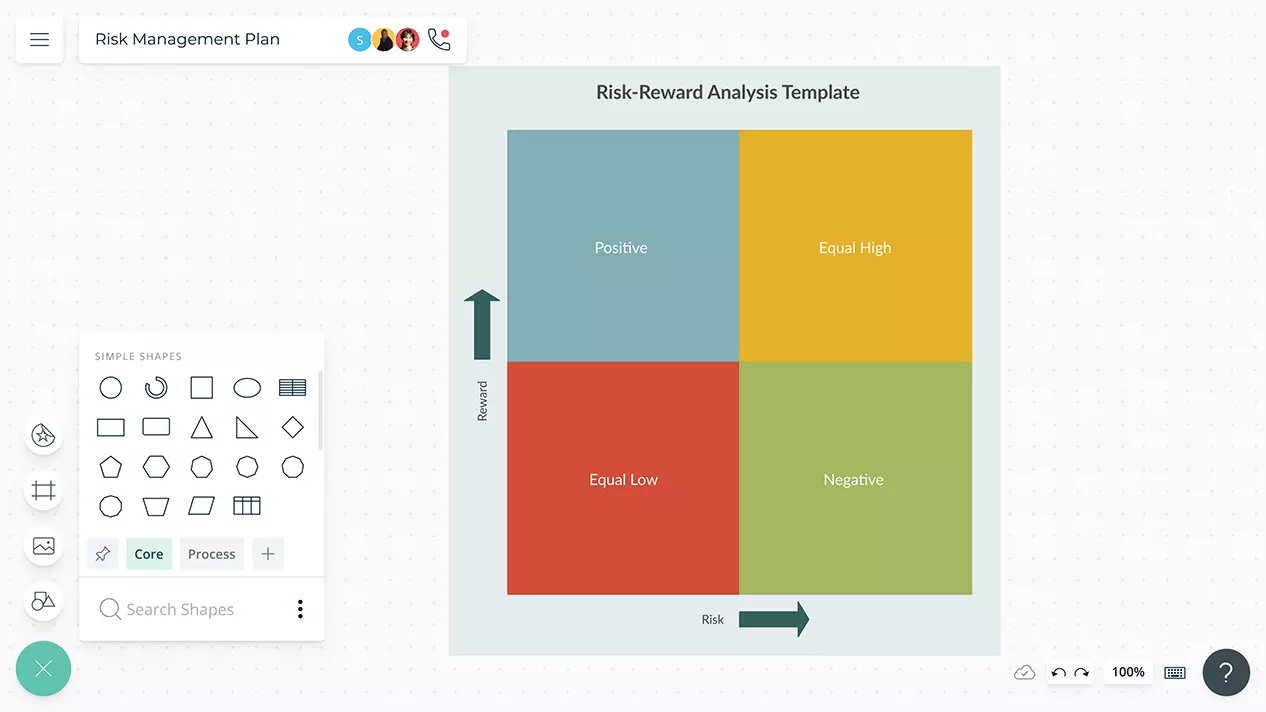
Visual tools to make better judgment calls, prioritize tasks, mitigate risks and overcome uncertainties.
A single, connected workspace to bring together your business goals, roadmaps, data, and teams together to generate solid business strategies.
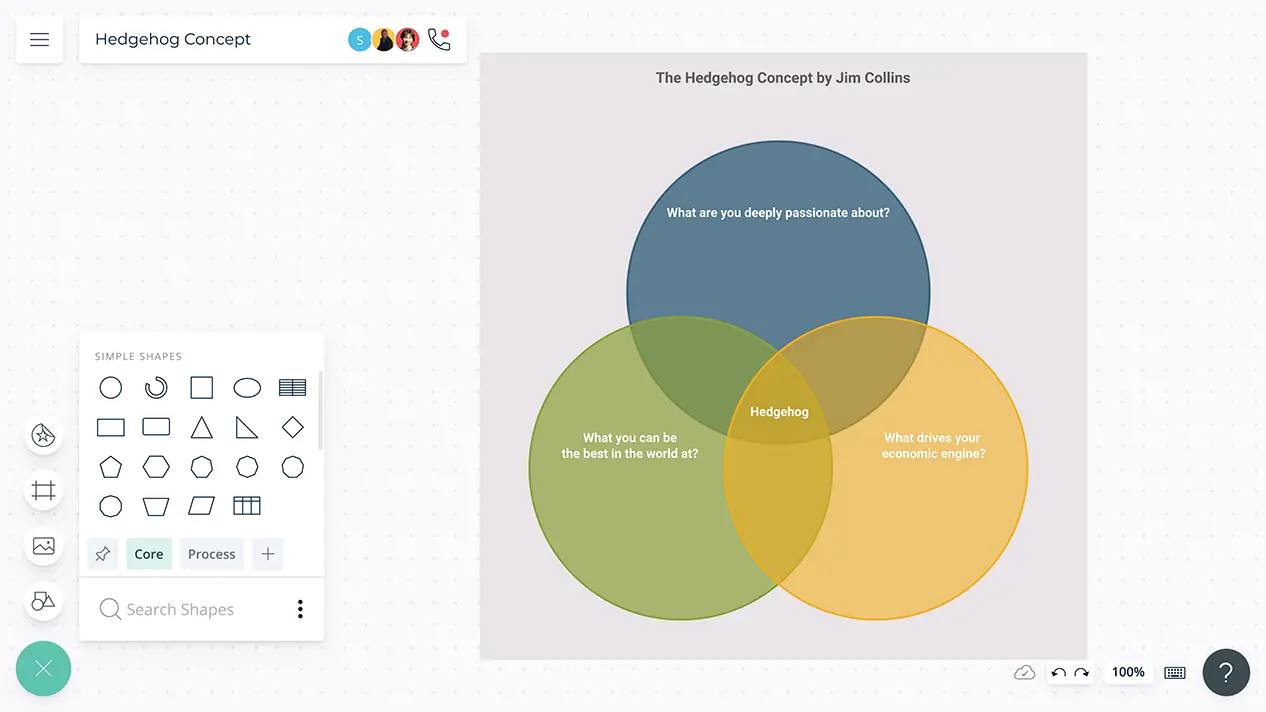
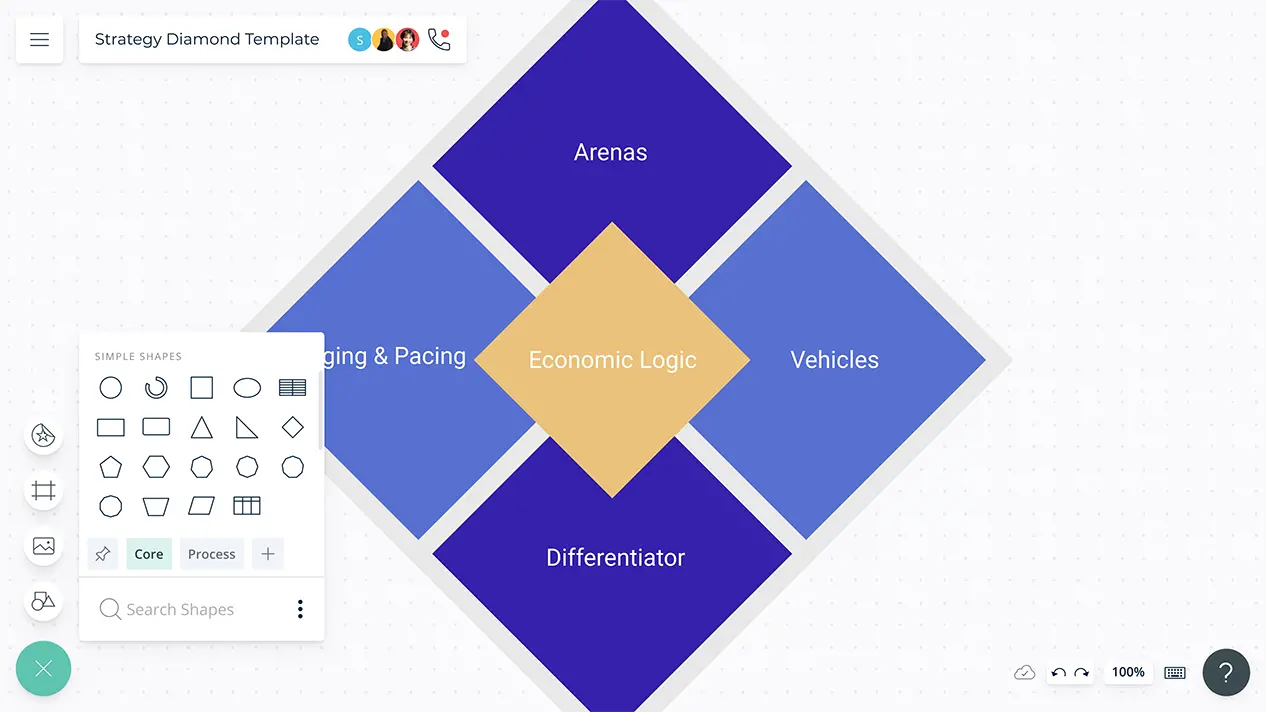
Visual tools to identify the overlap between corporate drive, its competency and economic growth factors to devise strategies and maximize success.
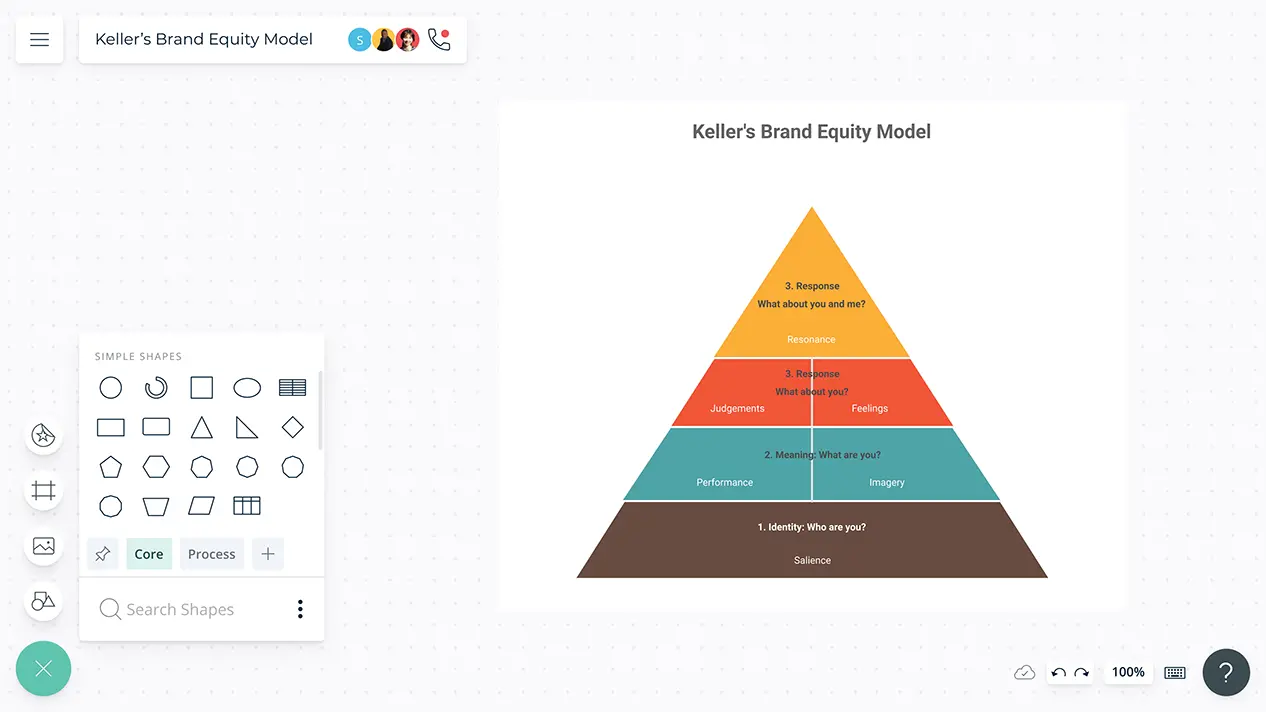
Create Keller’s Brand Equity models for your business/service with Creately to collaborate, extend, and visualize in one place.
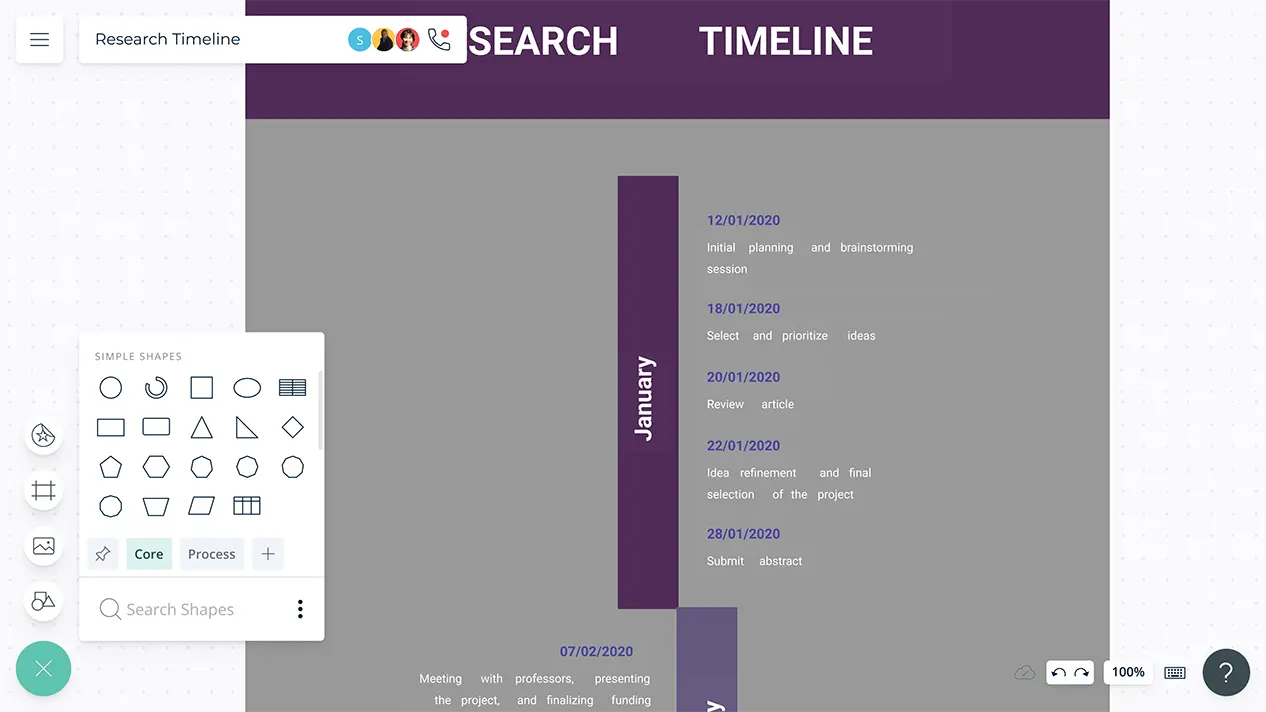
Use Creately to conduct market research on competitors, customers, and industry using customizable templates and an intuitive canvas.
Identify inefficiencies in your processes and make needed improvements to increase productivity.
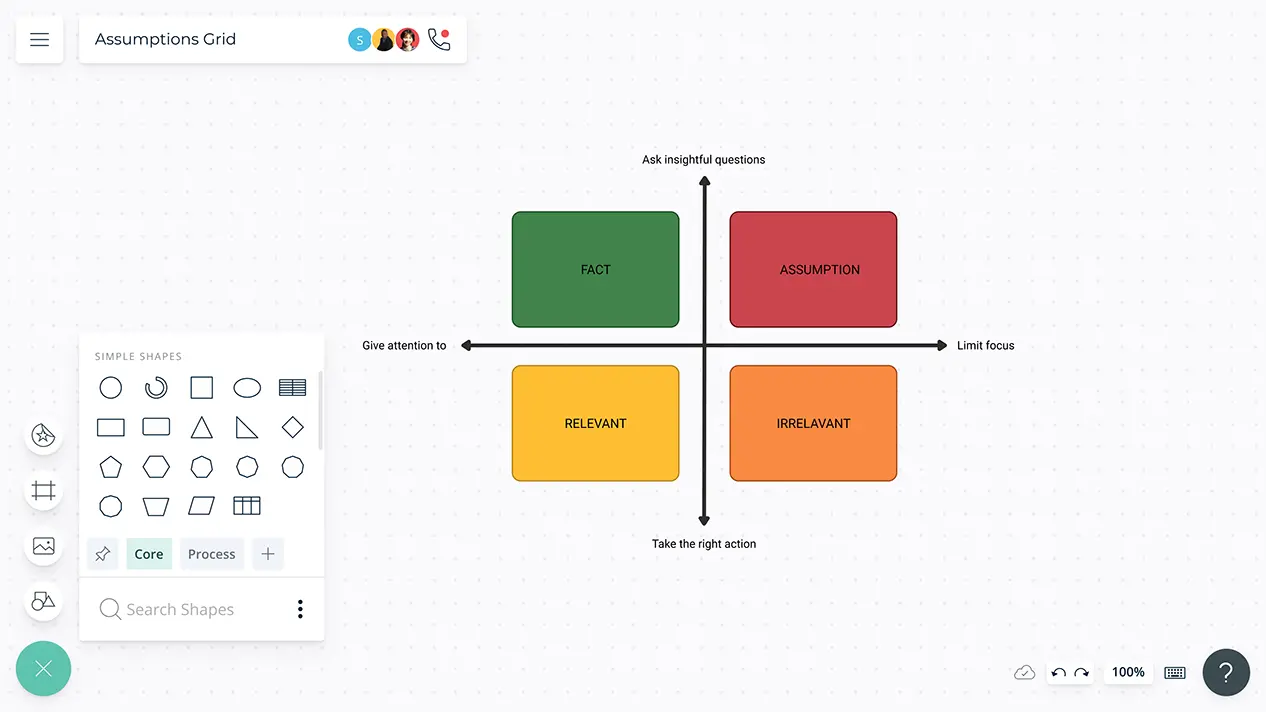
Use Creately’s professional templates for strategic analysis to develop your strategies easily. Identify and assess information relevant to your organizational strategy.
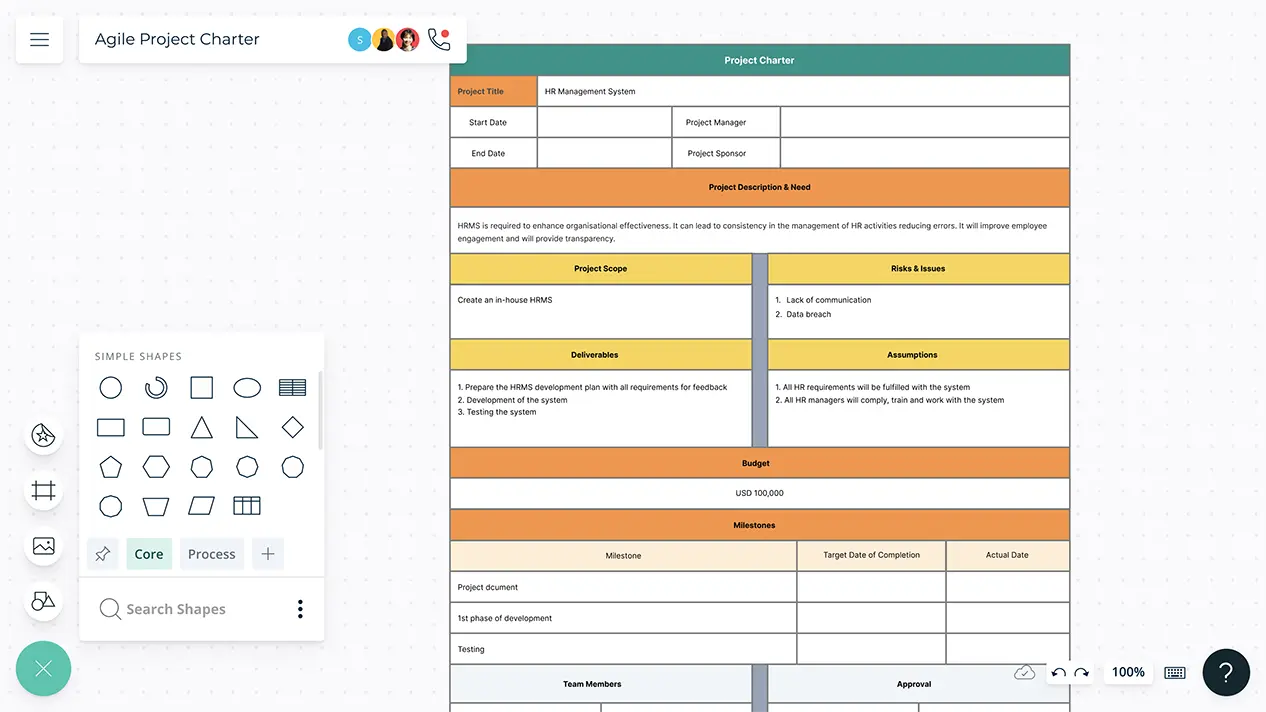
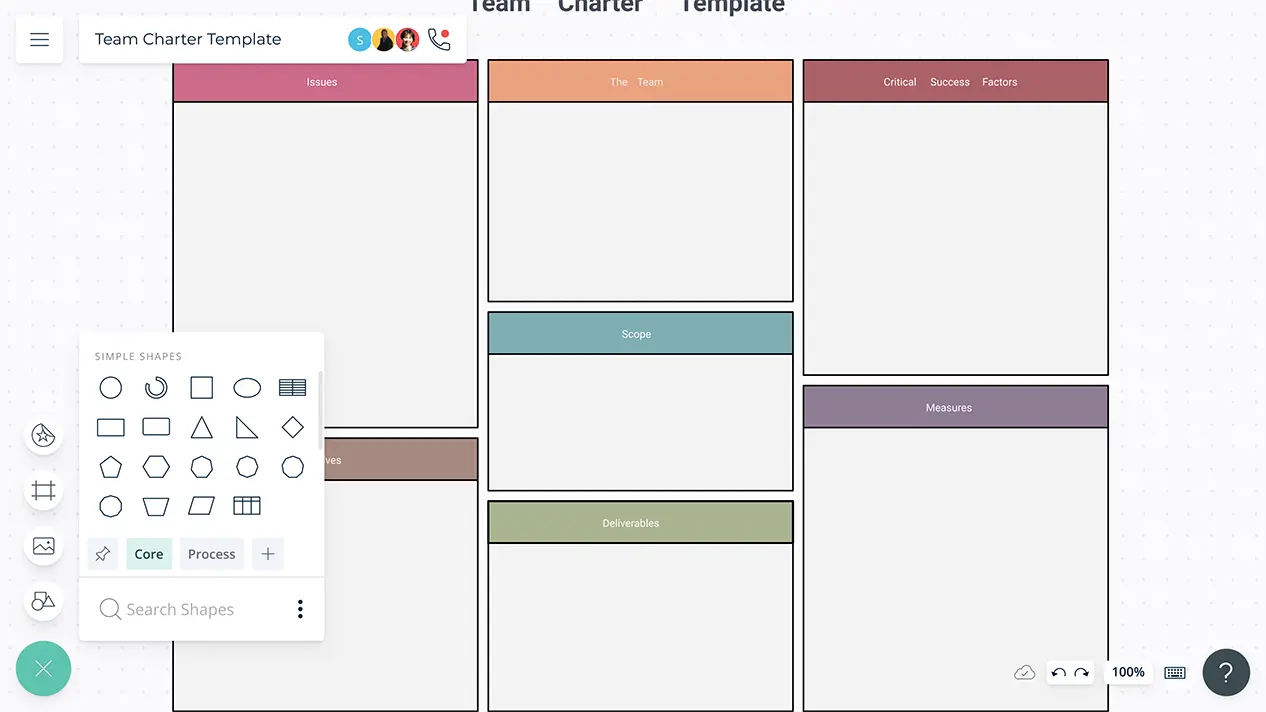
Instantly create a team charter with Creately and precisely visualize direction and boundaries.
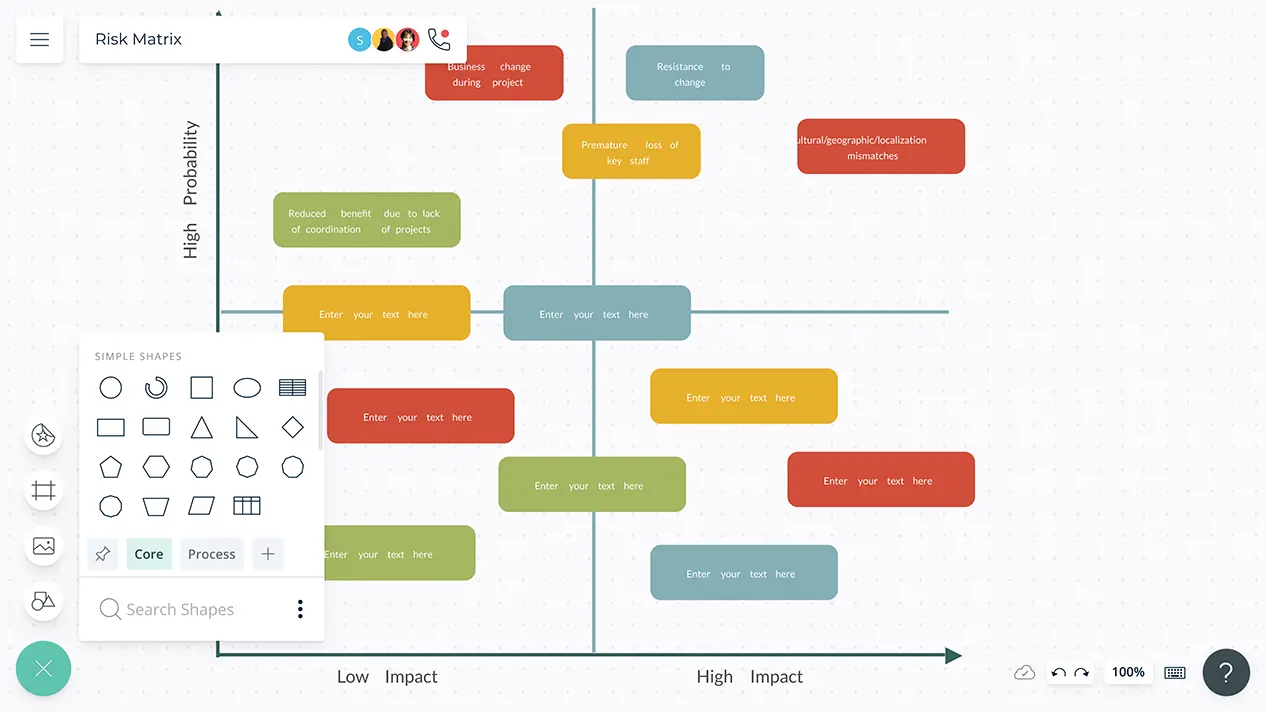
Visually identify the elements of risk associated with a project and prioritize steps needed to mitigate them.
Improve your strategic growth by understanding how key areas of your business interact.
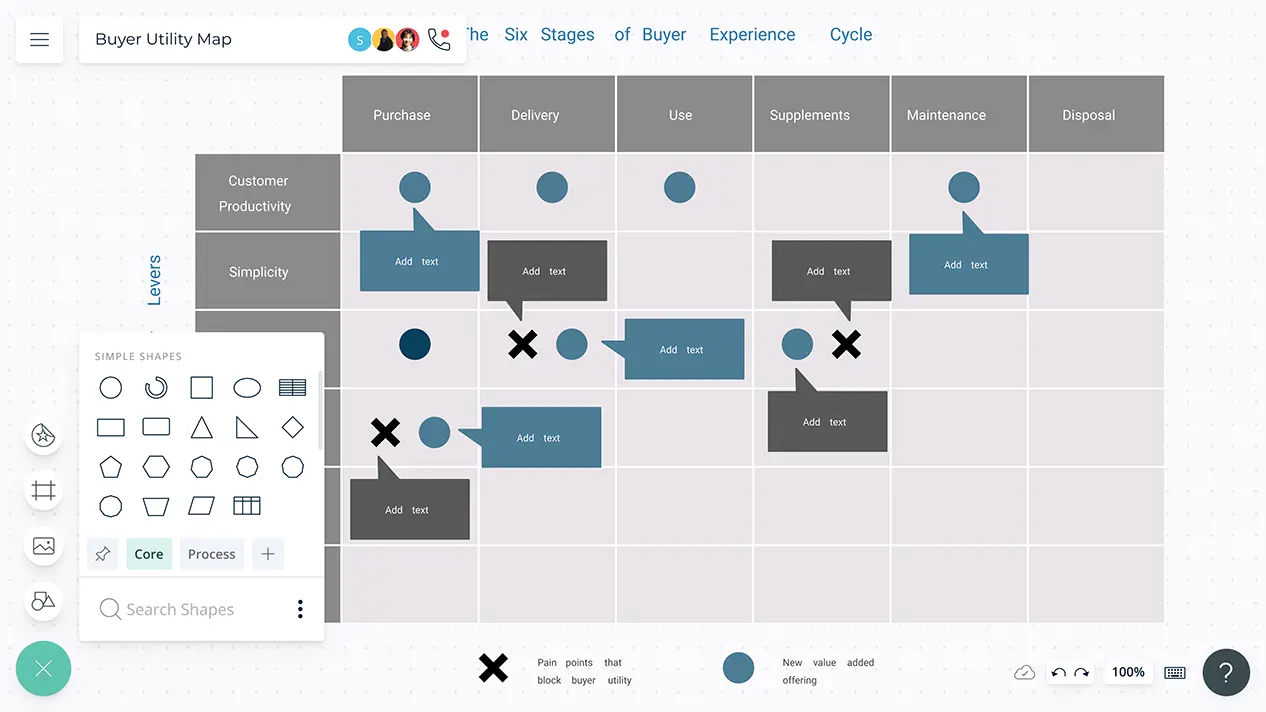
Uncover strategic opportunities to create outstanding value for your customers.
Visual templates to improve design, product and services. Prioritize the root causes of problems by collecting and analyzing data.
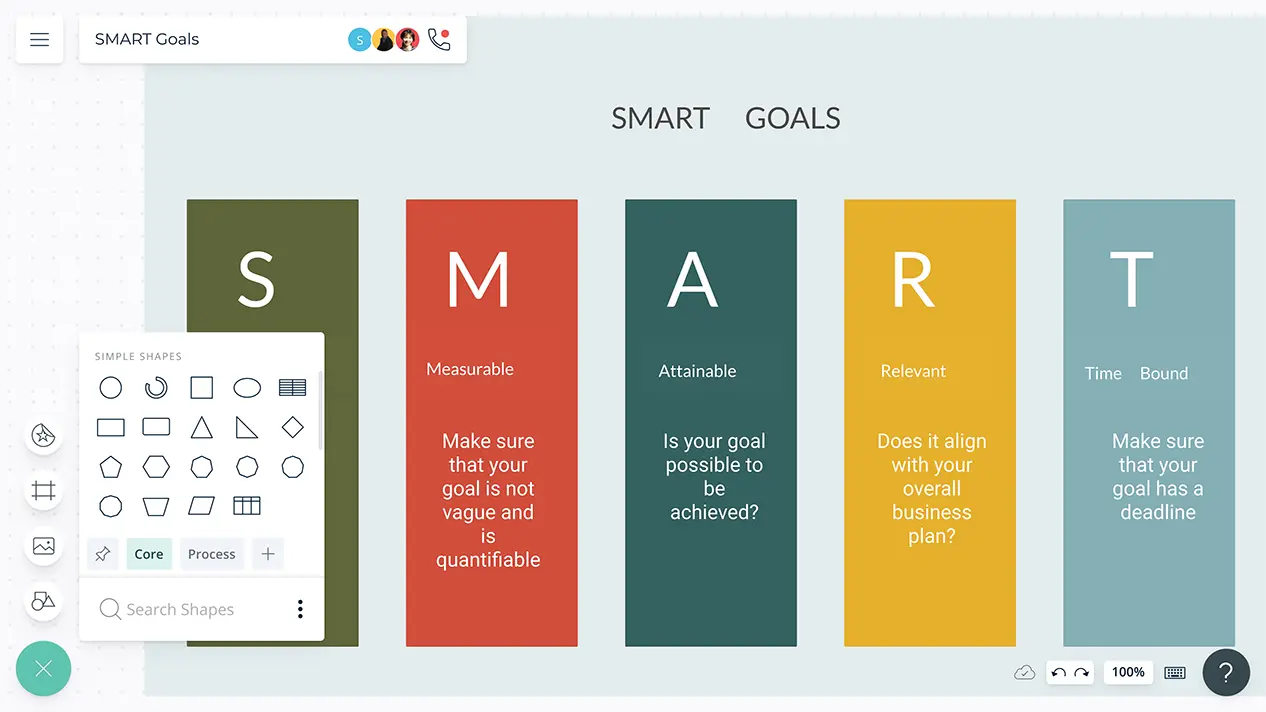
SMART goal template and worksheets to plan and improve the chances of succeeding in accomplishing organizational goals.
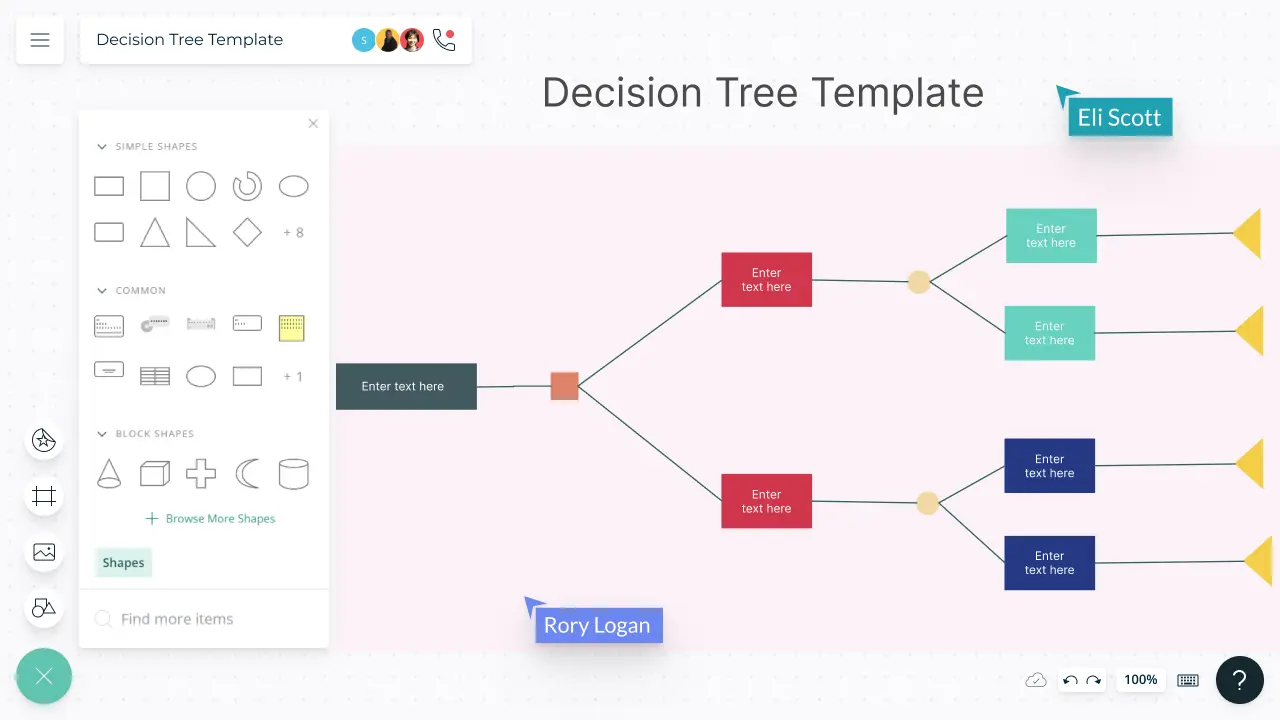
Customizable decision tree templates to visualize outcomes at a glance and identify the best path forward.
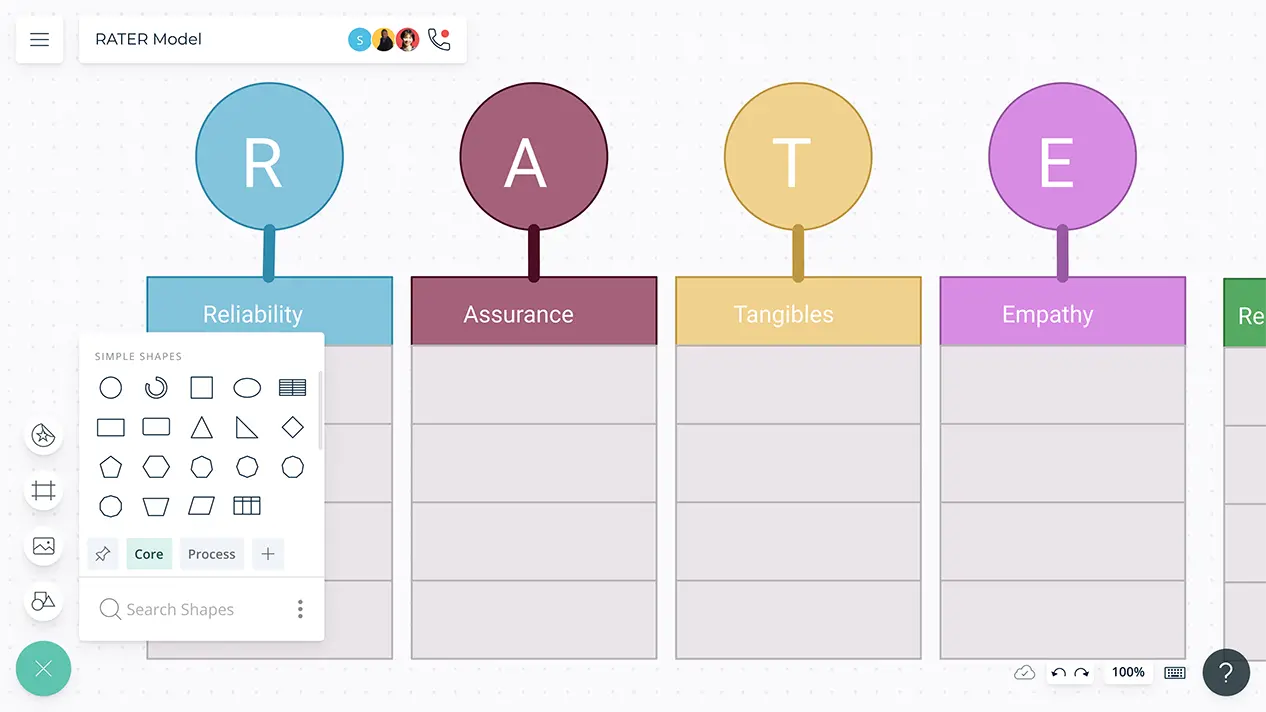
Visual tools to identify customer service quality gaps. Evaluate the status of your current customer service standards against 5 factors of customer expectations: reliability, assurance, tangibles, empathy, and responsiveness.
Manage your time effectively and plan ahead by using visual templates to prioritize tasks based on urgency and importance. Manage your workload efficiently.
Use Creately’s visual canvas to analyze macro and micro environmental influences on an organization and assess the threats they pose.
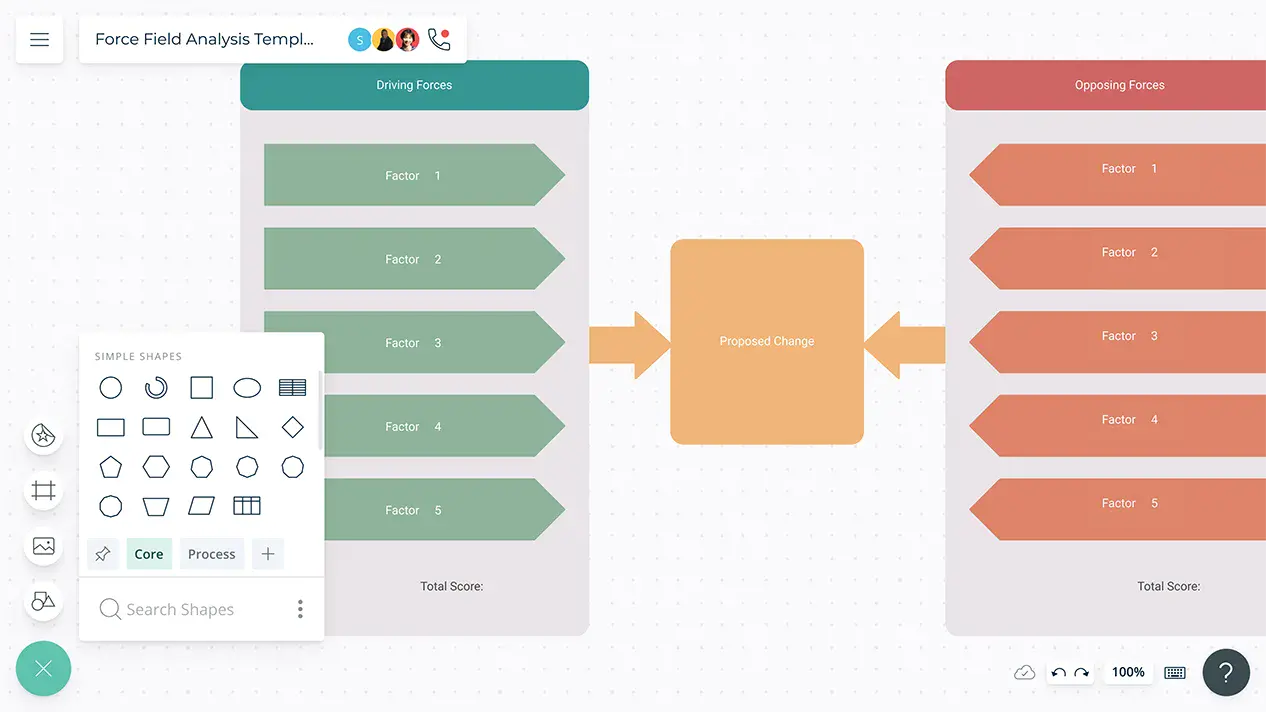
A shared workspace for your team to analyze the forces supporting and opposing organizational change and work collaboratively on implementation.
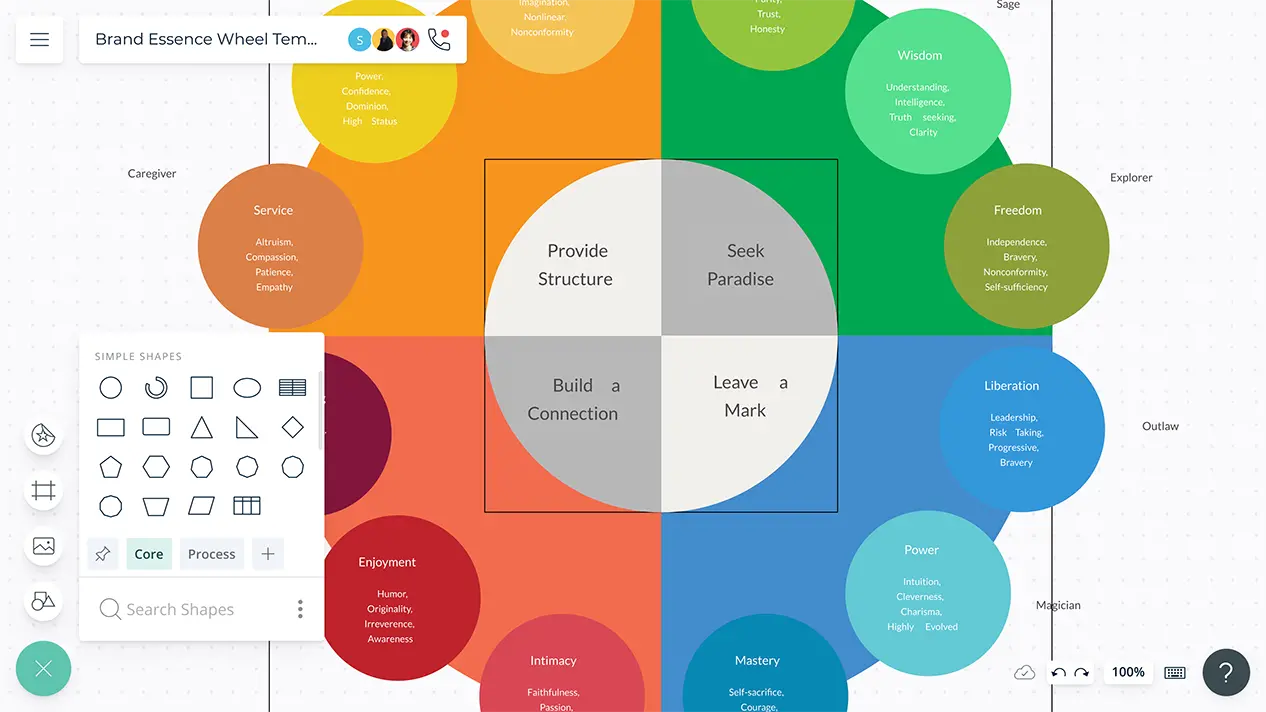
Discover the essence of your brand and build strong connections with your customers.
Venn Templates Venn Diagram Template Edit Diagram Edit Diagram Blank Venn Diagram Template Edit Diagram Edit Diagram Deep Learning Euler Diagram Edit Diagram Edit Diagram Euler Diagram Edit Diagram Edit Diagram Math Venn Diagram Edit Diagram Edit Diagram Venn diagram for 3 sets Edit Diagram Edit Diagram Venn Diagram for 4 Sets Edit Diagram Edit Diagram Student Commitment - Venn Diagram Template Edit Diagram Edit Diagram What Is a Venn Diagram? Venn diagrams are made up of two or more overlapping circles. They are often used to show relationships between sets. Circles that overlap have a commonality while circles that do not overlap do not share those traits.
Wireframe Templates UI Mockup Example Edit Diagram Edit Diagram User interface wireframe for Business Analysis Edit Diagram Edit Diagram User Flow Wireframe Edit Diagram Edit Diagram Lead Generation - Landing Page UI Mockup Edit Diagram Edit Diagram Web Page Mockup Template Edit Diagram Edit Diagram Online Shopping Store Wireframe Edit Diagram Edit Diagram Photo Store Android App Mcokup Template Edit Diagram Edit Diagram Wireframe Example Edit Diagram Edit Diagram Online Shopping Website Product Page Wireframe Edit Diagram Edit Diagram What Is a Wireframe? A wireframe is a technical document that represents the blueprint or structure of a software, app, or site. This skeletal outline provides an overview of the page layout, information and user flow, functionality, and intended behaviors.
Solve complex problems with this guide to better decision making