Influence Diagram
Streamline Decision-Making
Effortlessly visualize the causal relationships between decisions, external factors, uncertainties and outcomes to make decisions effectively.
- Multiple influence diagram templates to get a quick start
- Advanced diagramming capabilities for faster drawing
- Real-time collaboration to work together with decision makers

Visual Tools for Effective Decision-Making
Multiple premade templates and frameworks for structured decision making; influence diagrams, cause and effect diagrams, decision trees, and more.
Extensive shape libraries for influence diagrams and 50 other diagram types.
Plus Create to quickly add the next relevant shape and effortlessly assemble influence diagram nodes into a coherent graph.
Dynamic connectors that automatically adjust themselves to easily expand and demonstrate relationships between the nodes.
Discover Insights Faster

Bring in necessary data and knowledge from external sources onto the canvas to visualize them as meaningful shapes for easier analysis.
Embed Google docs, sheets, and links to web pages with in-app previews to centralize information and assets.
Add detailed docs, attachments, links and more with notes on each item to capture details and the big picture in a single space.
Infinite canvas with smooth zooming to navigate across large complex influence diagrams and universal text search to locate any information instantly.

Connect All Teams Across the Board
Collaborative online whiteboard with built-in brainstorming tools to facilitate group ideation, planning, and analysis sessions.
Real-time cursors for any number of participants to collaborate with team members on a shared canvas.
Video conferencing baked into the platform to feel like you are in the same room even when you are working remotely.
Comment with context, have discussions and follow ups on the same canvas. Async!
Full version history to keep track of key points during each iteration of your analysis. Branch out from an earlier version if needed at any time.
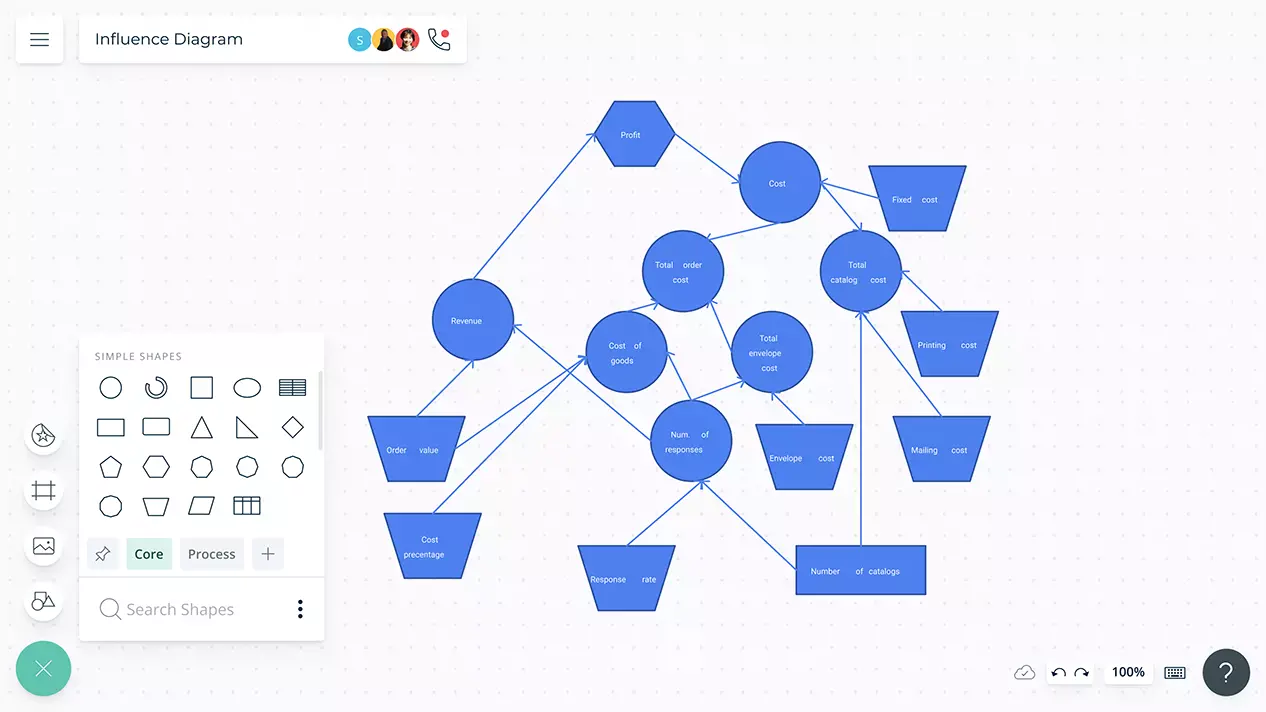
What Is an Influence Diagram?
An influence diagram is used to represent the summary of information of a decision tree. It shows variables that are known and unknown when making a decision and understand the connection that exists among them.
How to Create an Influence Diagram?
- Open a Creately workspace and add relevant stakeholders as collaborators to develop your influence diagram.
- Enable the relevant shape library and start creating your influence diagram as you conduct the analysis. Alternatively, you can select a premade influence diagram template to get a headstart.
- First, identify the outcome or the objective and decompose it into independent variables that directly determine it.
- Continue to decompose each variable until no variable is left. The idea is to keep adding variables until there are outcomes that, in the future, could be measured, and, in the present, can be estimated.