Interrelationship Diagram Maker
Analyze Causes and Effects with Professional Interrelationship Diagrams
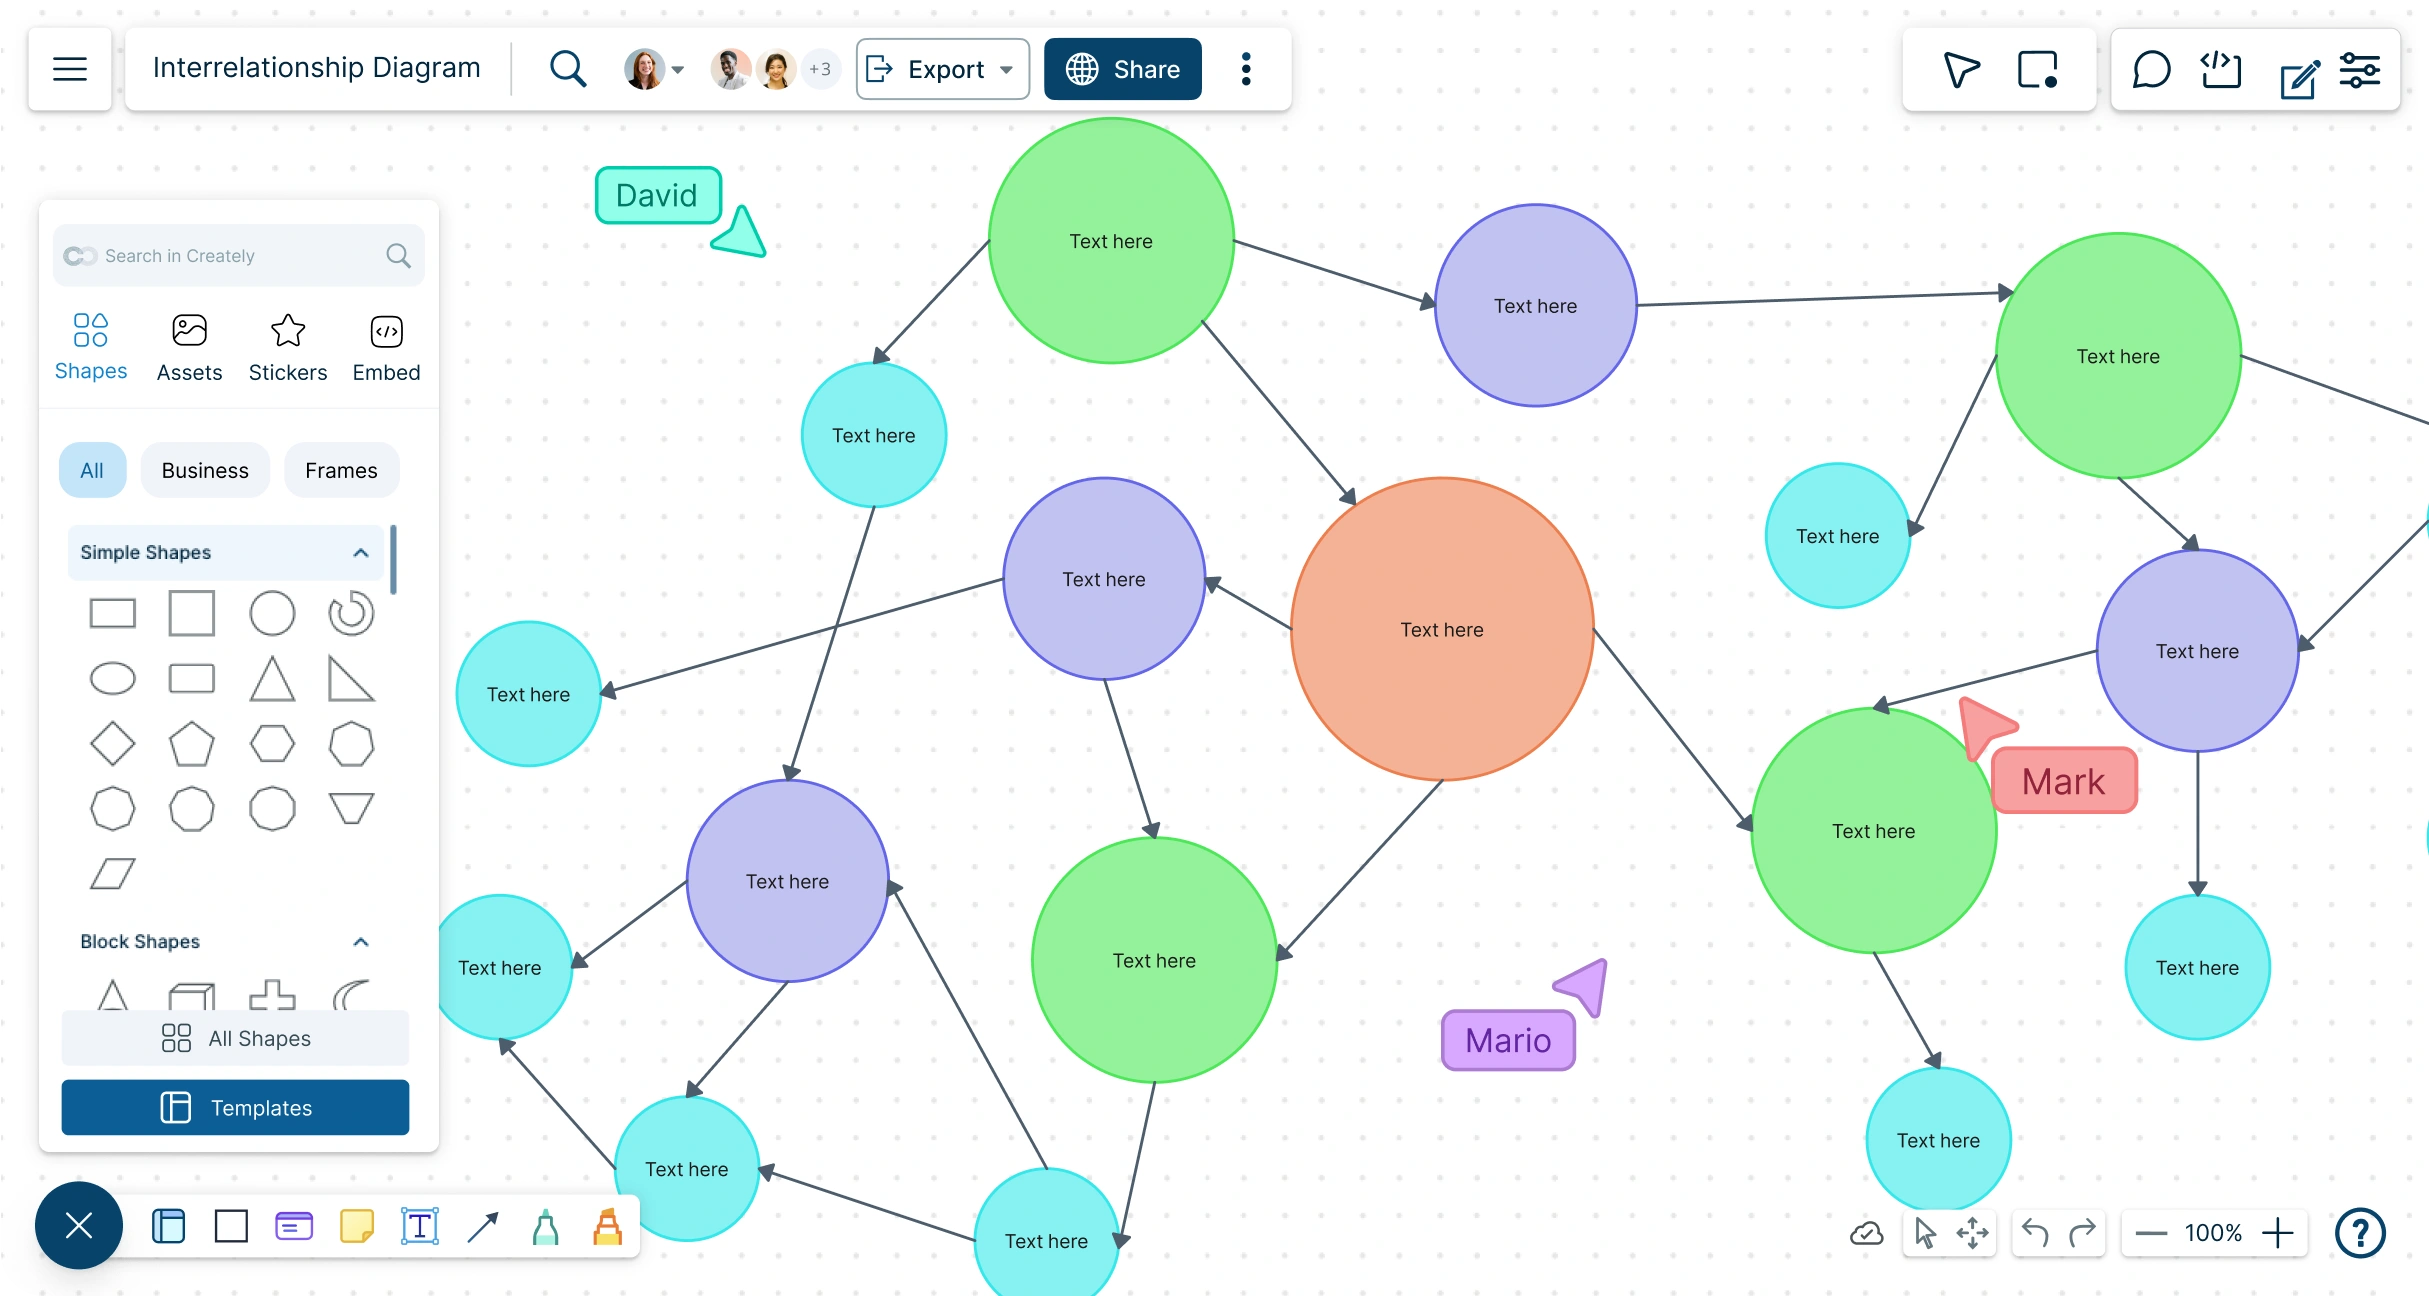
Evaluate cause-and-effect relationships of critical issues with our online Interrelationship Diagram tool. Use customizable templates to identify solutions faster and make informed decisions with the best online diagram tool.
Create interconnected diagrams easily with professional templates
Collaborate in real-time with team members on an infinite canvas
Export diagrams as PDF, SVG, PNG, or JPEG securely with version control


 Diagramming Visual Collaboration Org Chart


Brainstorm and Visualize Ideas with the Easiest Interrelationship Diagram Tool

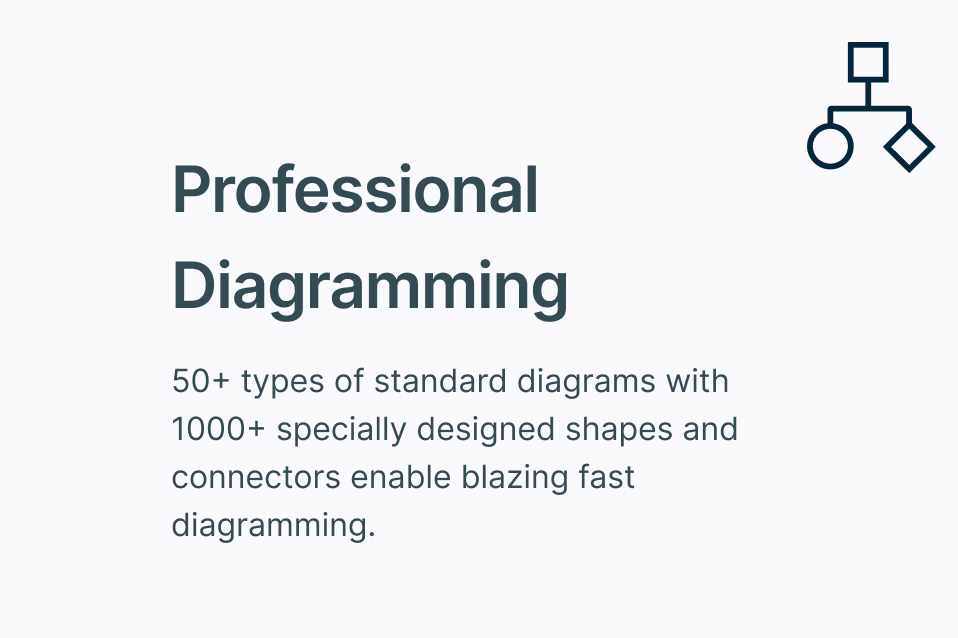
Simple drag and drop tools with Plus Create to easily create complex interrelationship diagrams in minutes.
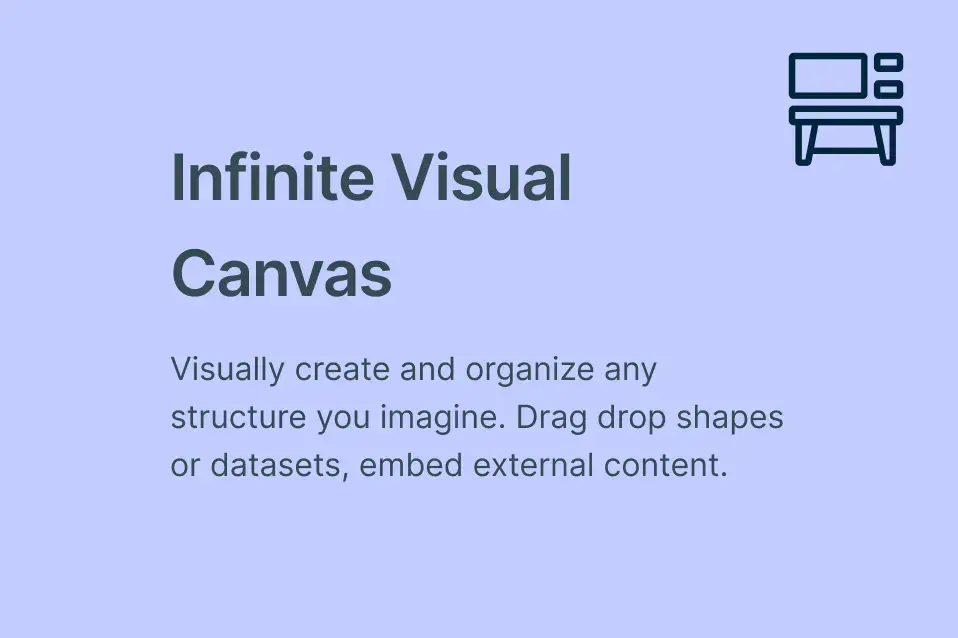
Organize ideas, sticky notes, and mind maps seamlessly on an infinite canvas for full creative freedom.
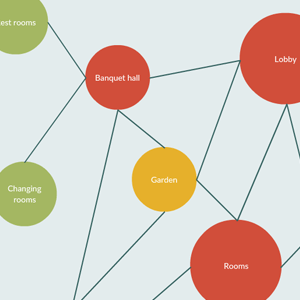
Leverage ready-to-use Interrelationship Diagram templates to speed up diagram creation and problem-solving.
Customize diagrams easily with a comprehensive shape library, color themes, and formatting options.

Centralize Documentation and Link Insights in Your Interrelationship Diagram
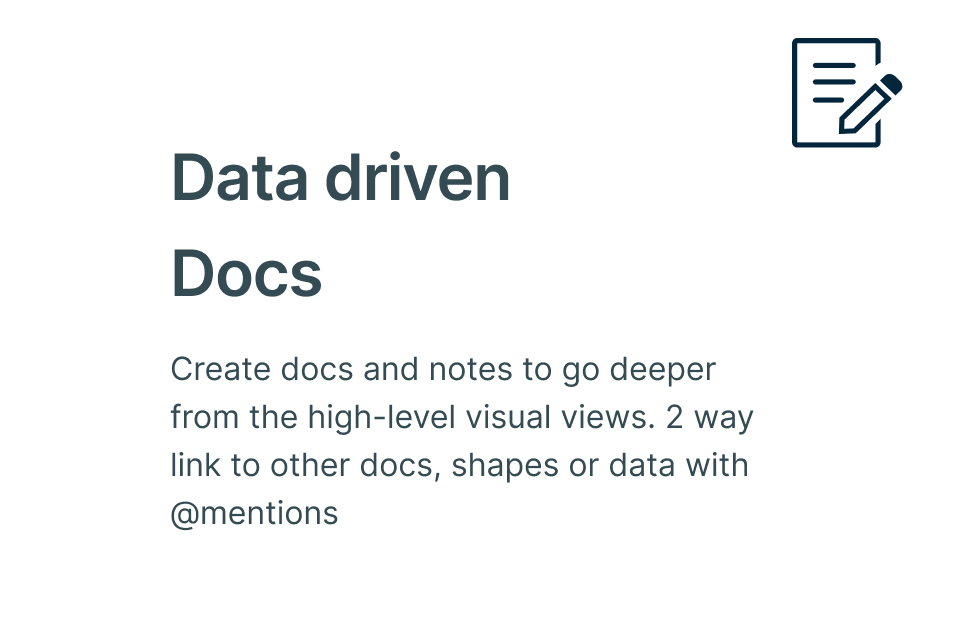
Keep all notes, links, and multimedia organized within your Interrelationship Diagram workspace.
Easily connect ideas, document findings, and maintain a structured overview of critical issues.
Streamline information flows across your diagrams for efficient problem analysis.
Make Data-Driven Decisions with Powerful Interrelationship Diagram Software

Track changes and maintain clarity with version control to manage diagram updates effortlessly.
Present your cause-and-effect analyses with presentation mode for clear, actionable insights.
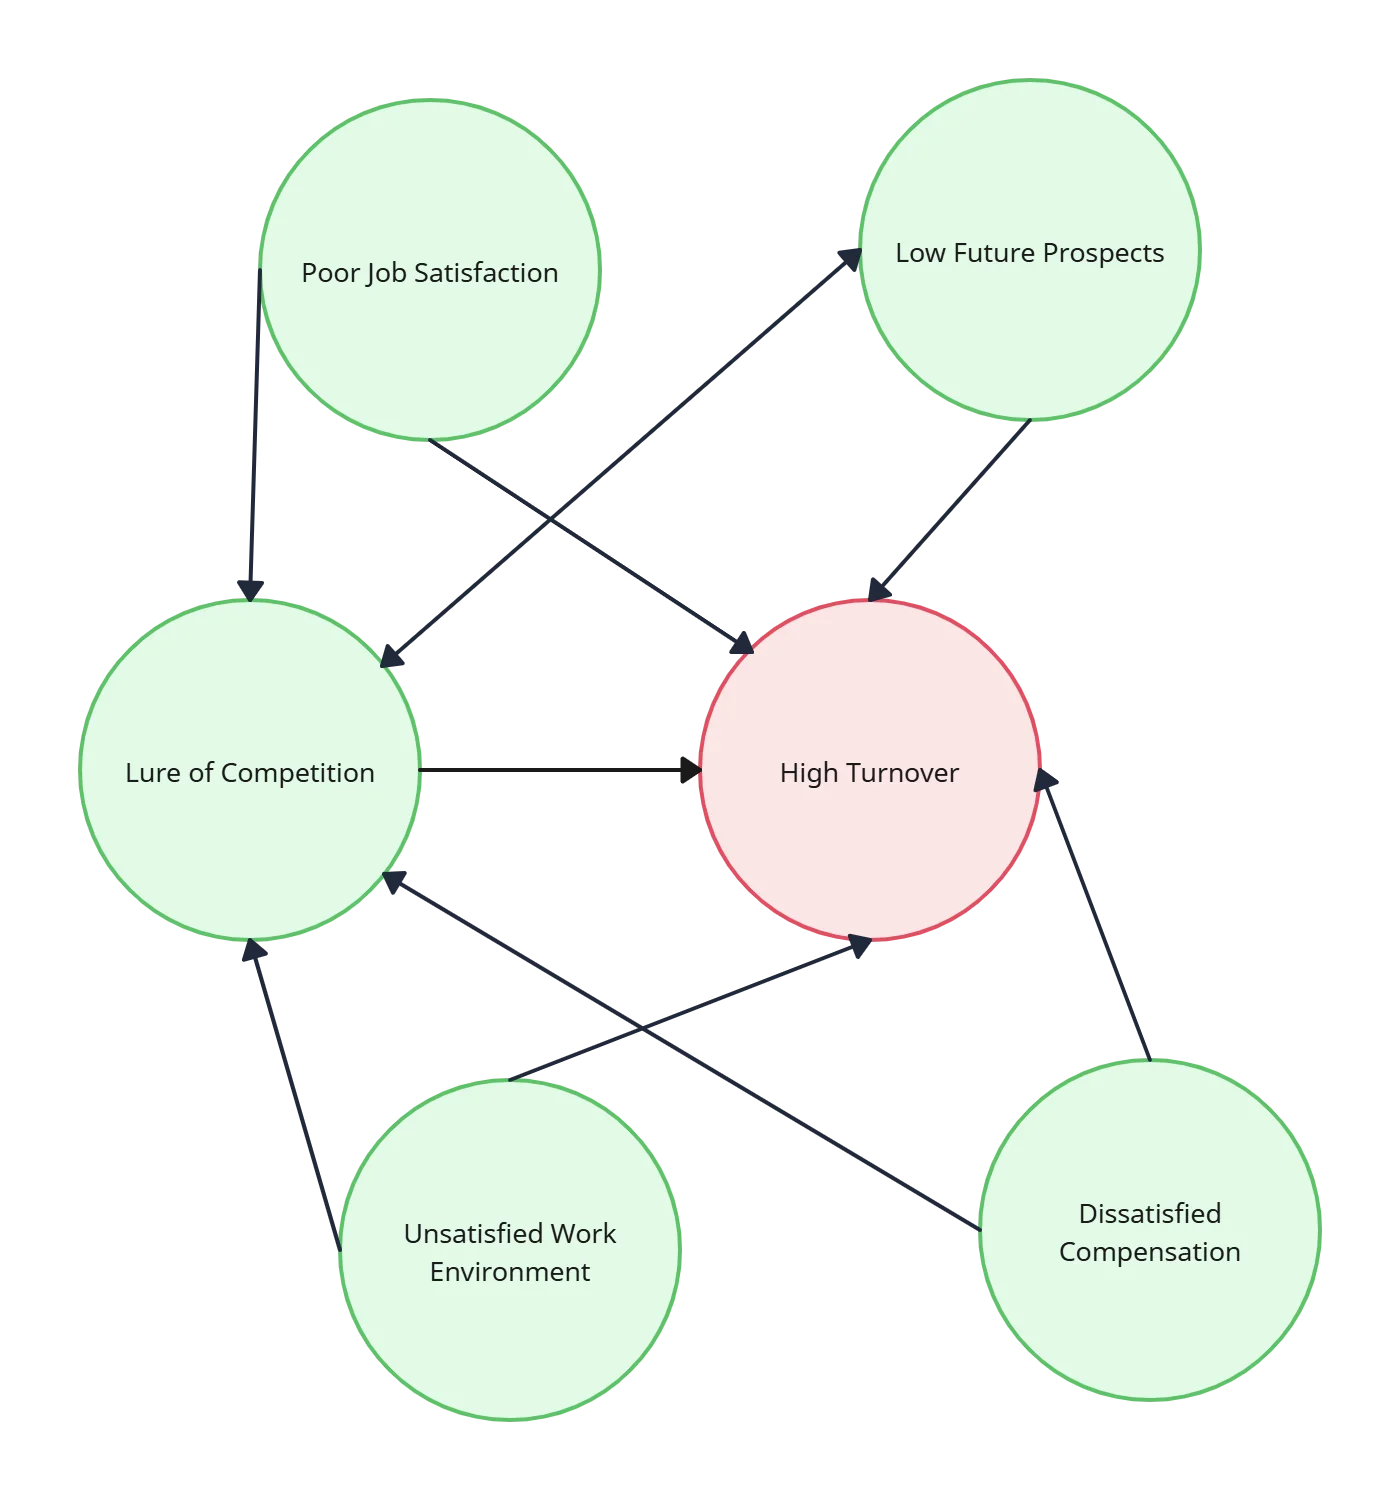
Identify critical nodes and relationships to inform effective problem-solving strategies.

Work Together Seamlessly with the Best Online Interrelationship Diagram Tool
Collaborate in real-time with multiple cursors, @mentions, and contextual comments.
Securely share diagrams with controlled access while tracking revisions through versioning.
Export your professional Interrelationship Diagrams in PDF, SVG, PNG, or JPEG formats for easy sharing.
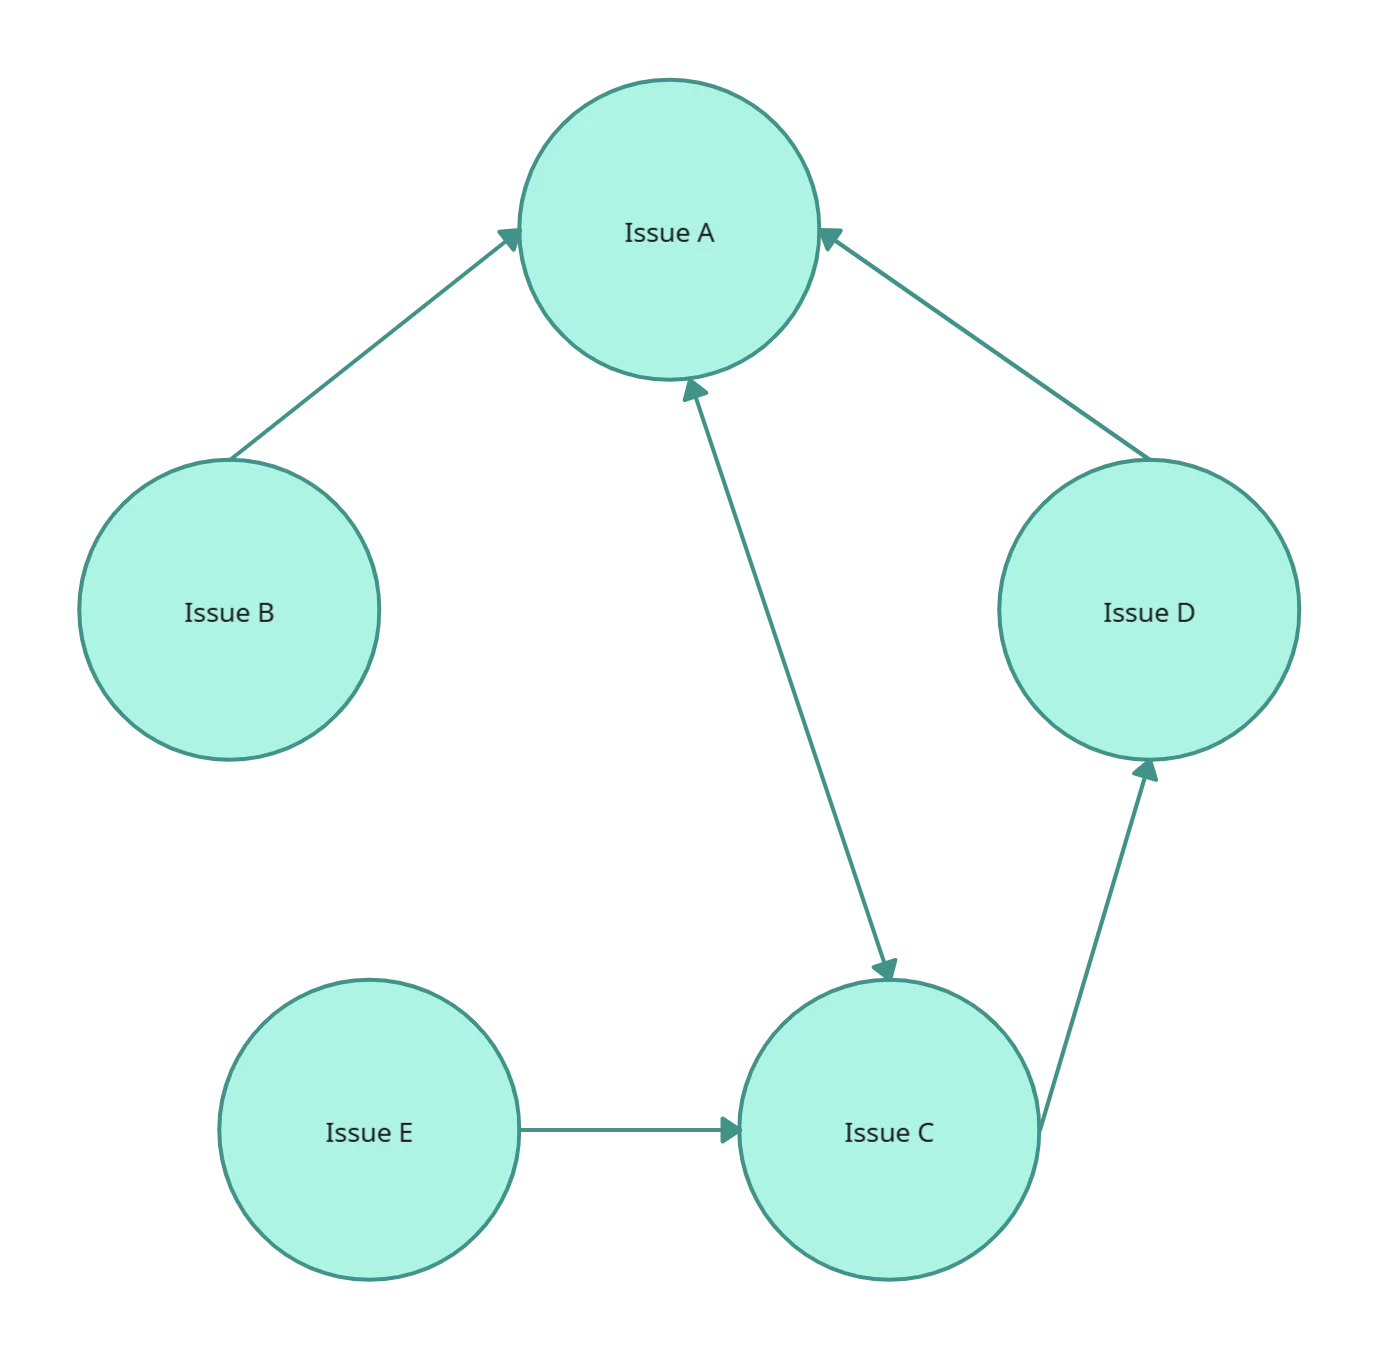
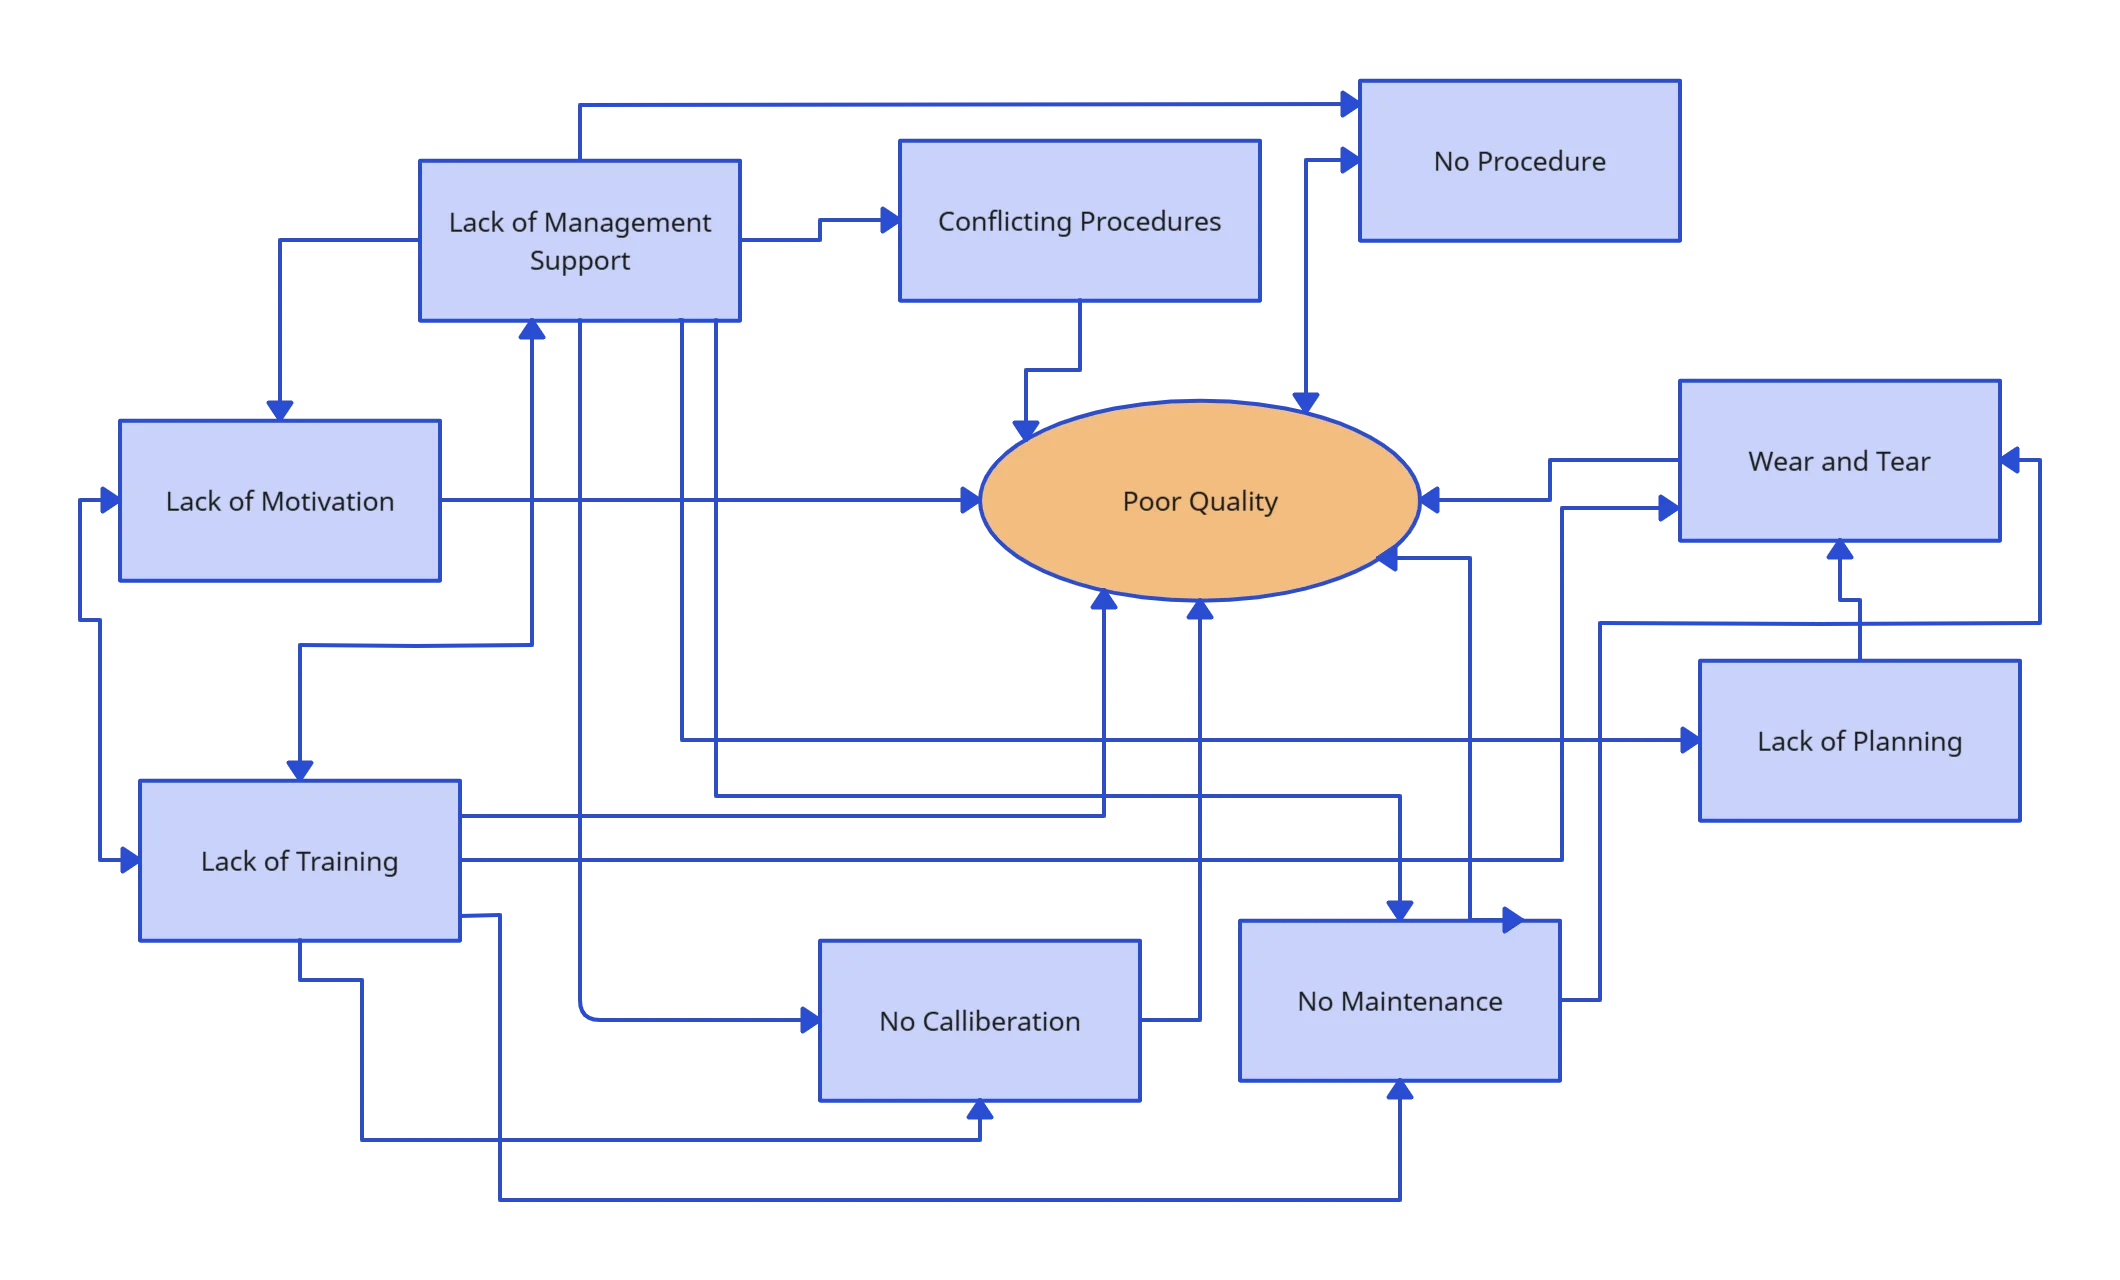
What Is an Interrelationship Diagram?

How to Create an Interrelationship Diagram in Creately
Launch Creately and Open a Workspace
Sign in to Creately and open a new workspace. Choose a blank canvas or start with one of the Interrelationship Diagram templates to kickstart your analysis.
Add and Customize Diagram Elements
Use Creately’s comprehensive shape library and drag-and-drop tools to add issues, causes, and effects. Customize each element with colors, text formatting, or sticky notes for easier identification.
Connect Issues and Analyze Relationships
Compare the issues and create connections using influencer arrows to show cause-and-effect relationships. Adjust arrow styles or colors to reflect the strength of each connection.
Collaborate with Your Team
Invite team members via email or share links to collaborate in real-time. Utilize @mentions, multiple cursors, and contextual comments to gather insights and make informed decisions together.
Review, Update, and Share
Finalize your professional Interrelationship Diagram by reviewing all connections and updating as needed. Export your diagram in PDF, SVG, PNG, or JPEG formats to share, publish, or present easily.
Create an Interrelationship DiagramJumpstart Your Analysis with Free Ready-to-Use Interrelationship Diagram Templates
FAQs About the Interrelationship Diagram Tool
What are Creately’s interrelationship diagram maker pricing plans?
- Free Plan — $0/month for basic interrelationship diagram creation and collaboration
- Starter & Team Plans — $8/month or $5/month billed annually
- Business Plan — $149/month or $89/month billed annually
Annual billing helps you save more while unlocking advanced collaboration, workspace management, and enhanced interrelationship diagram features. You can compare all available plans and features on the Creately Pricing Page.
How can you create interrelationship diagrams faster?
Are there templates for different interrelationship diagram use cases?
Can teams collaborate on interrelationship diagrams?
Can I add notes, data, and files?
Can I share, present, or export interrelationship diagrams?