Easily visualize your processes and workflows with smart automation.
Create visual organizational structures with images and detailed profiles.
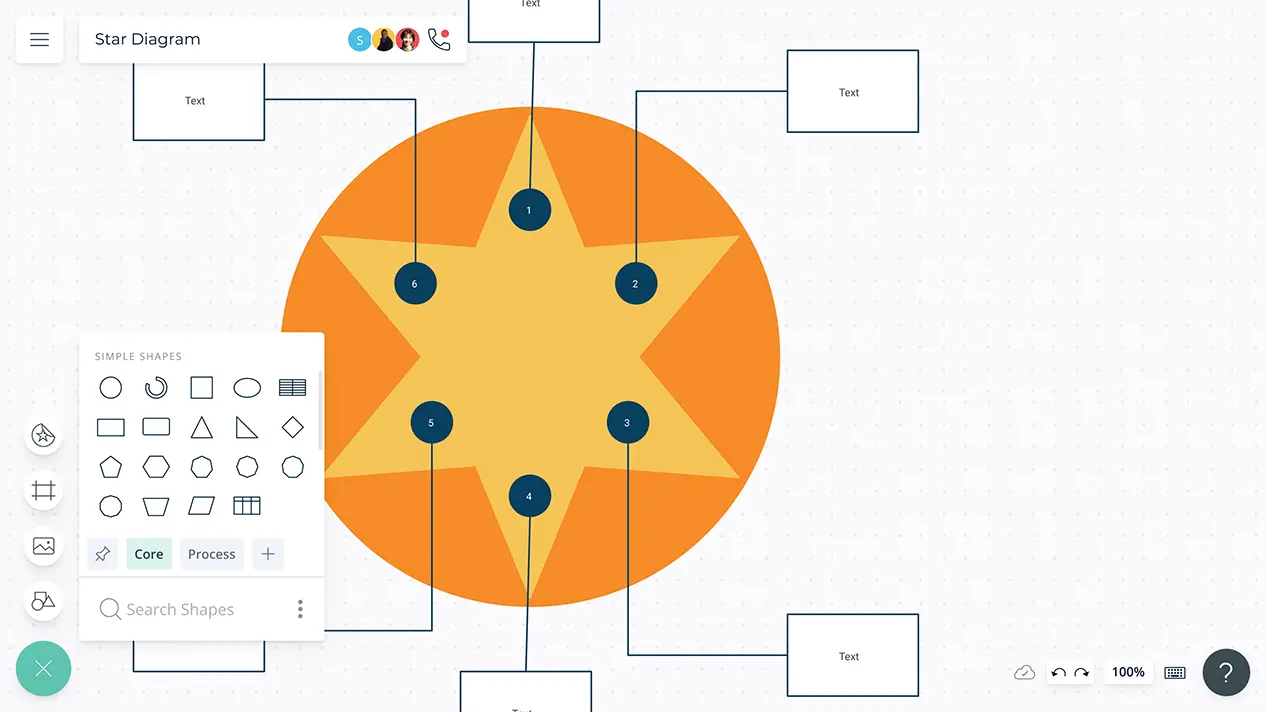
Visualize concepts and their relationships on an infinite visual canvas.
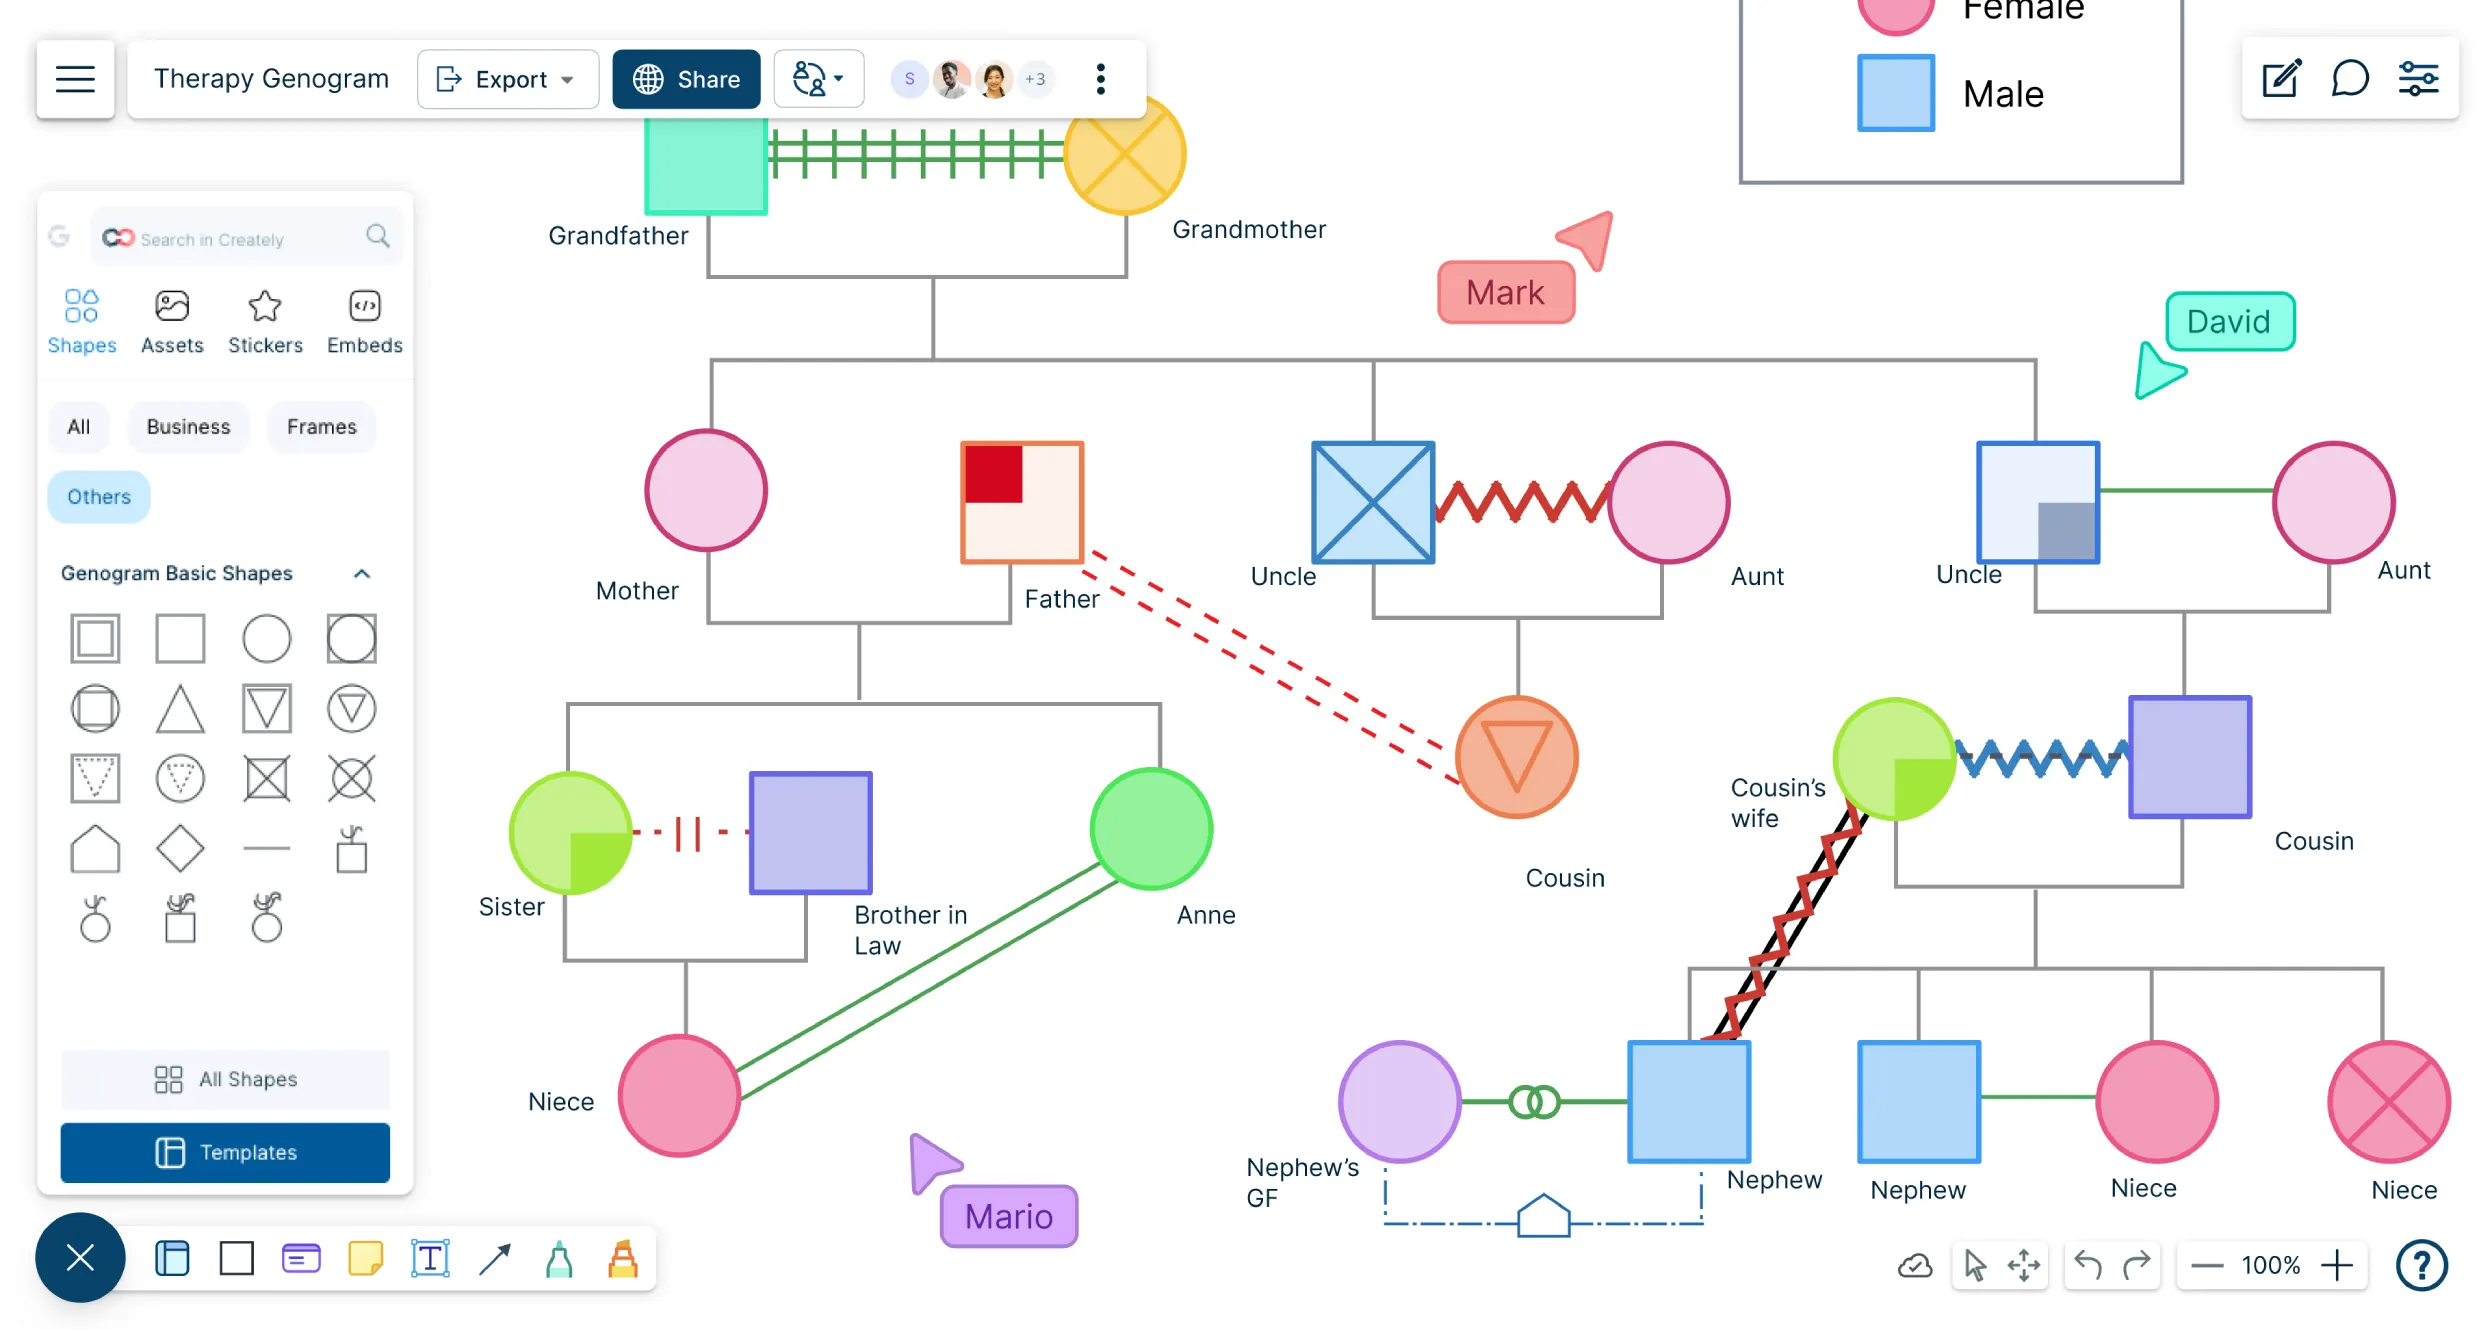
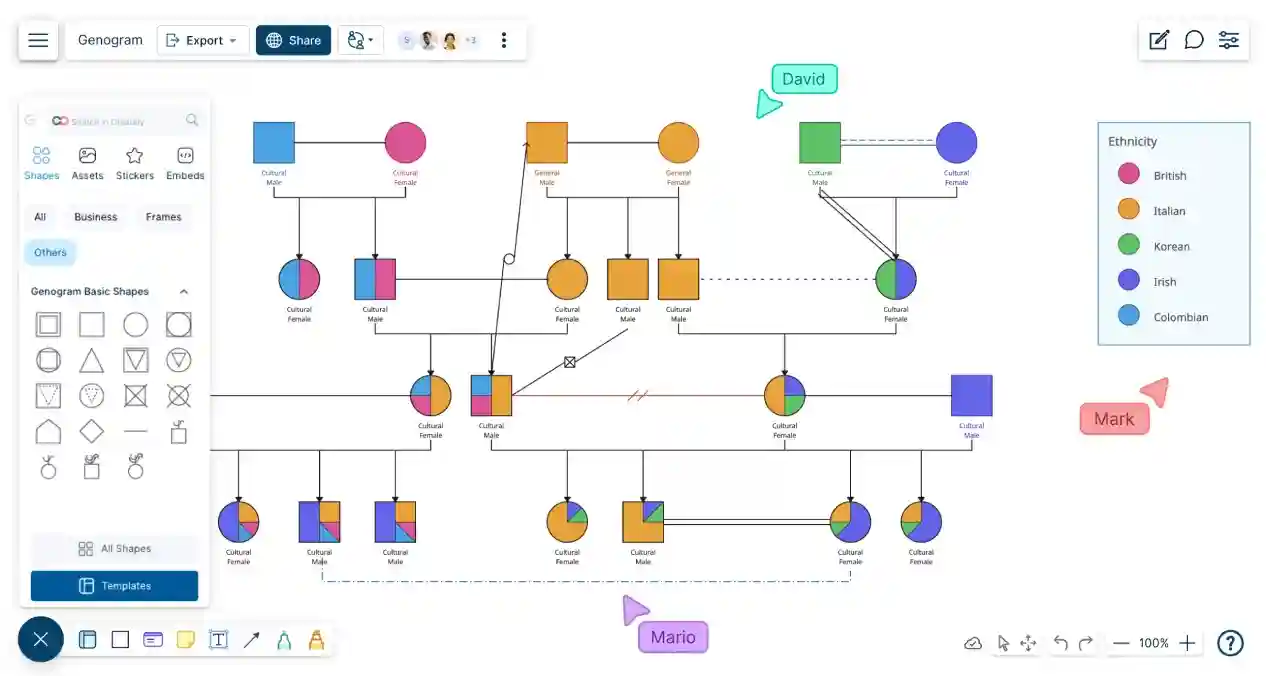
Map family history and understand the relationships with detailed genograms.
Visualize relationships between entities using Crows Foot or Chen notation.
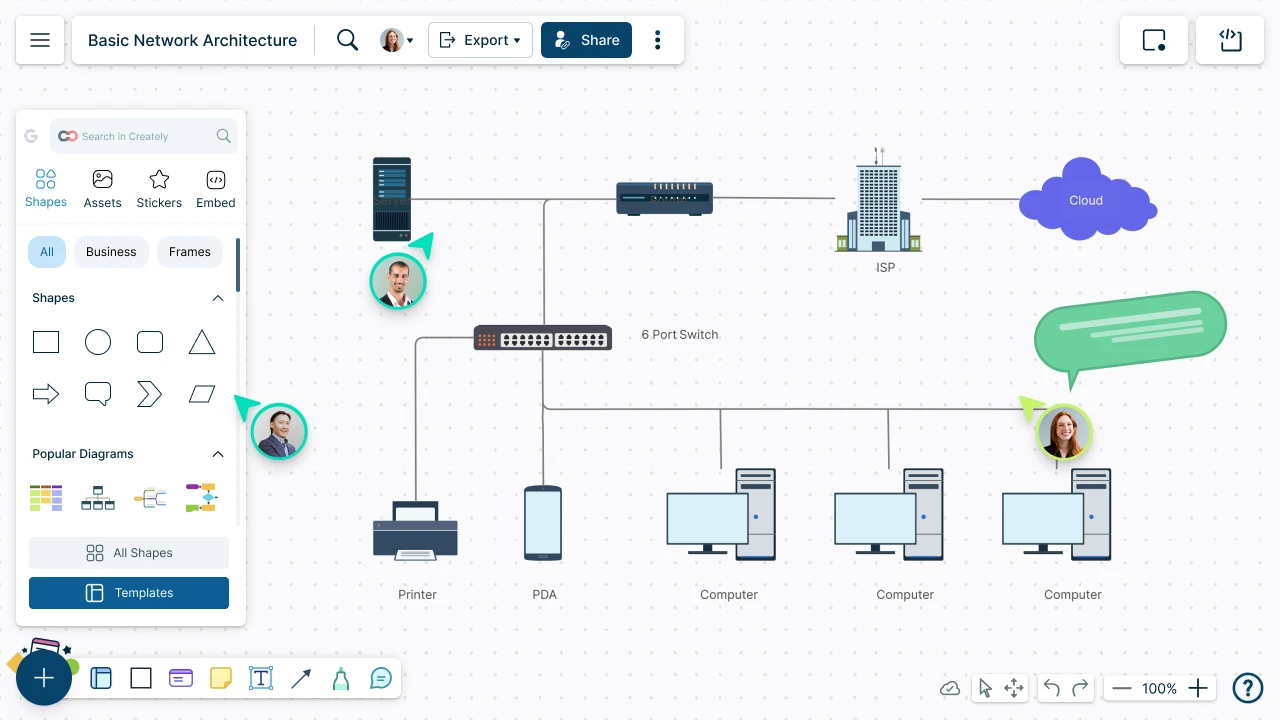
Visualize your network infrastructure. Support AWS, CISCO, Azure and more.
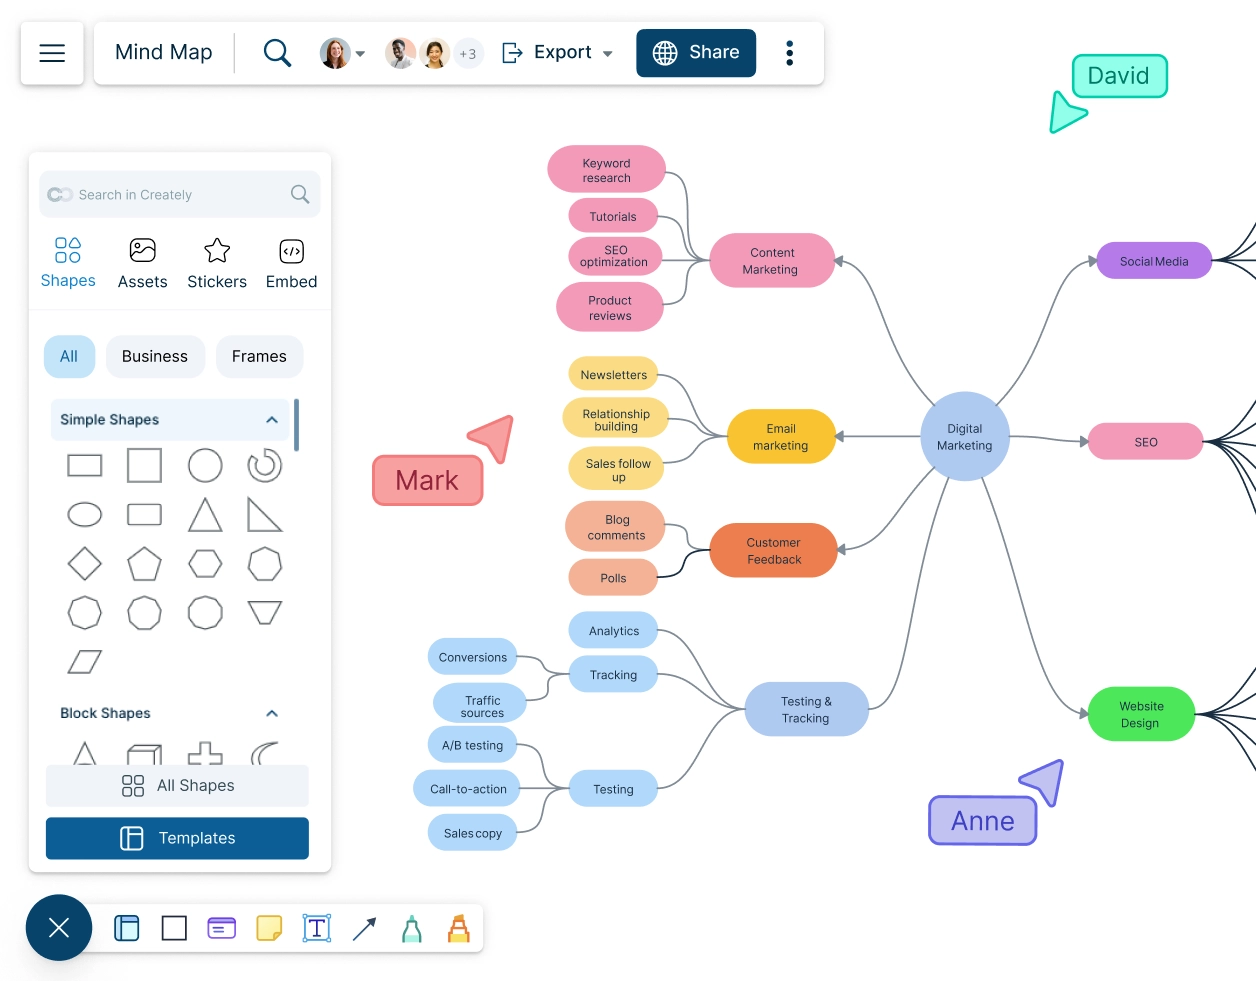
Visualize and expand your ideas using our powerful mind mapping tool.
Easily create family trees with our professionally designed templates.
Infinite canvas to add diagrams, images, sticky notes and more.
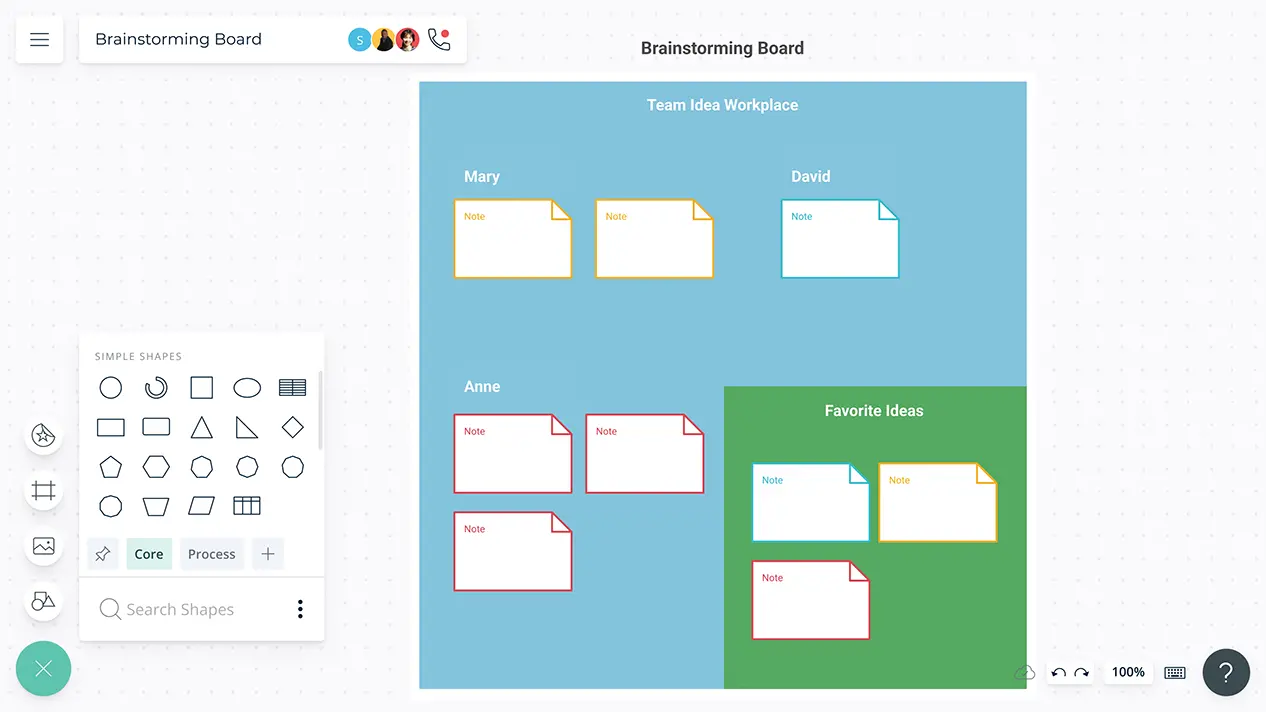
Run collaborative meetings, workshops or brainstorming sessions.
Collaborative diagramming for educators and students at discounted rates.
Generate customizable diagrams with a simple prompting tool.
Log In
Sign Up Free
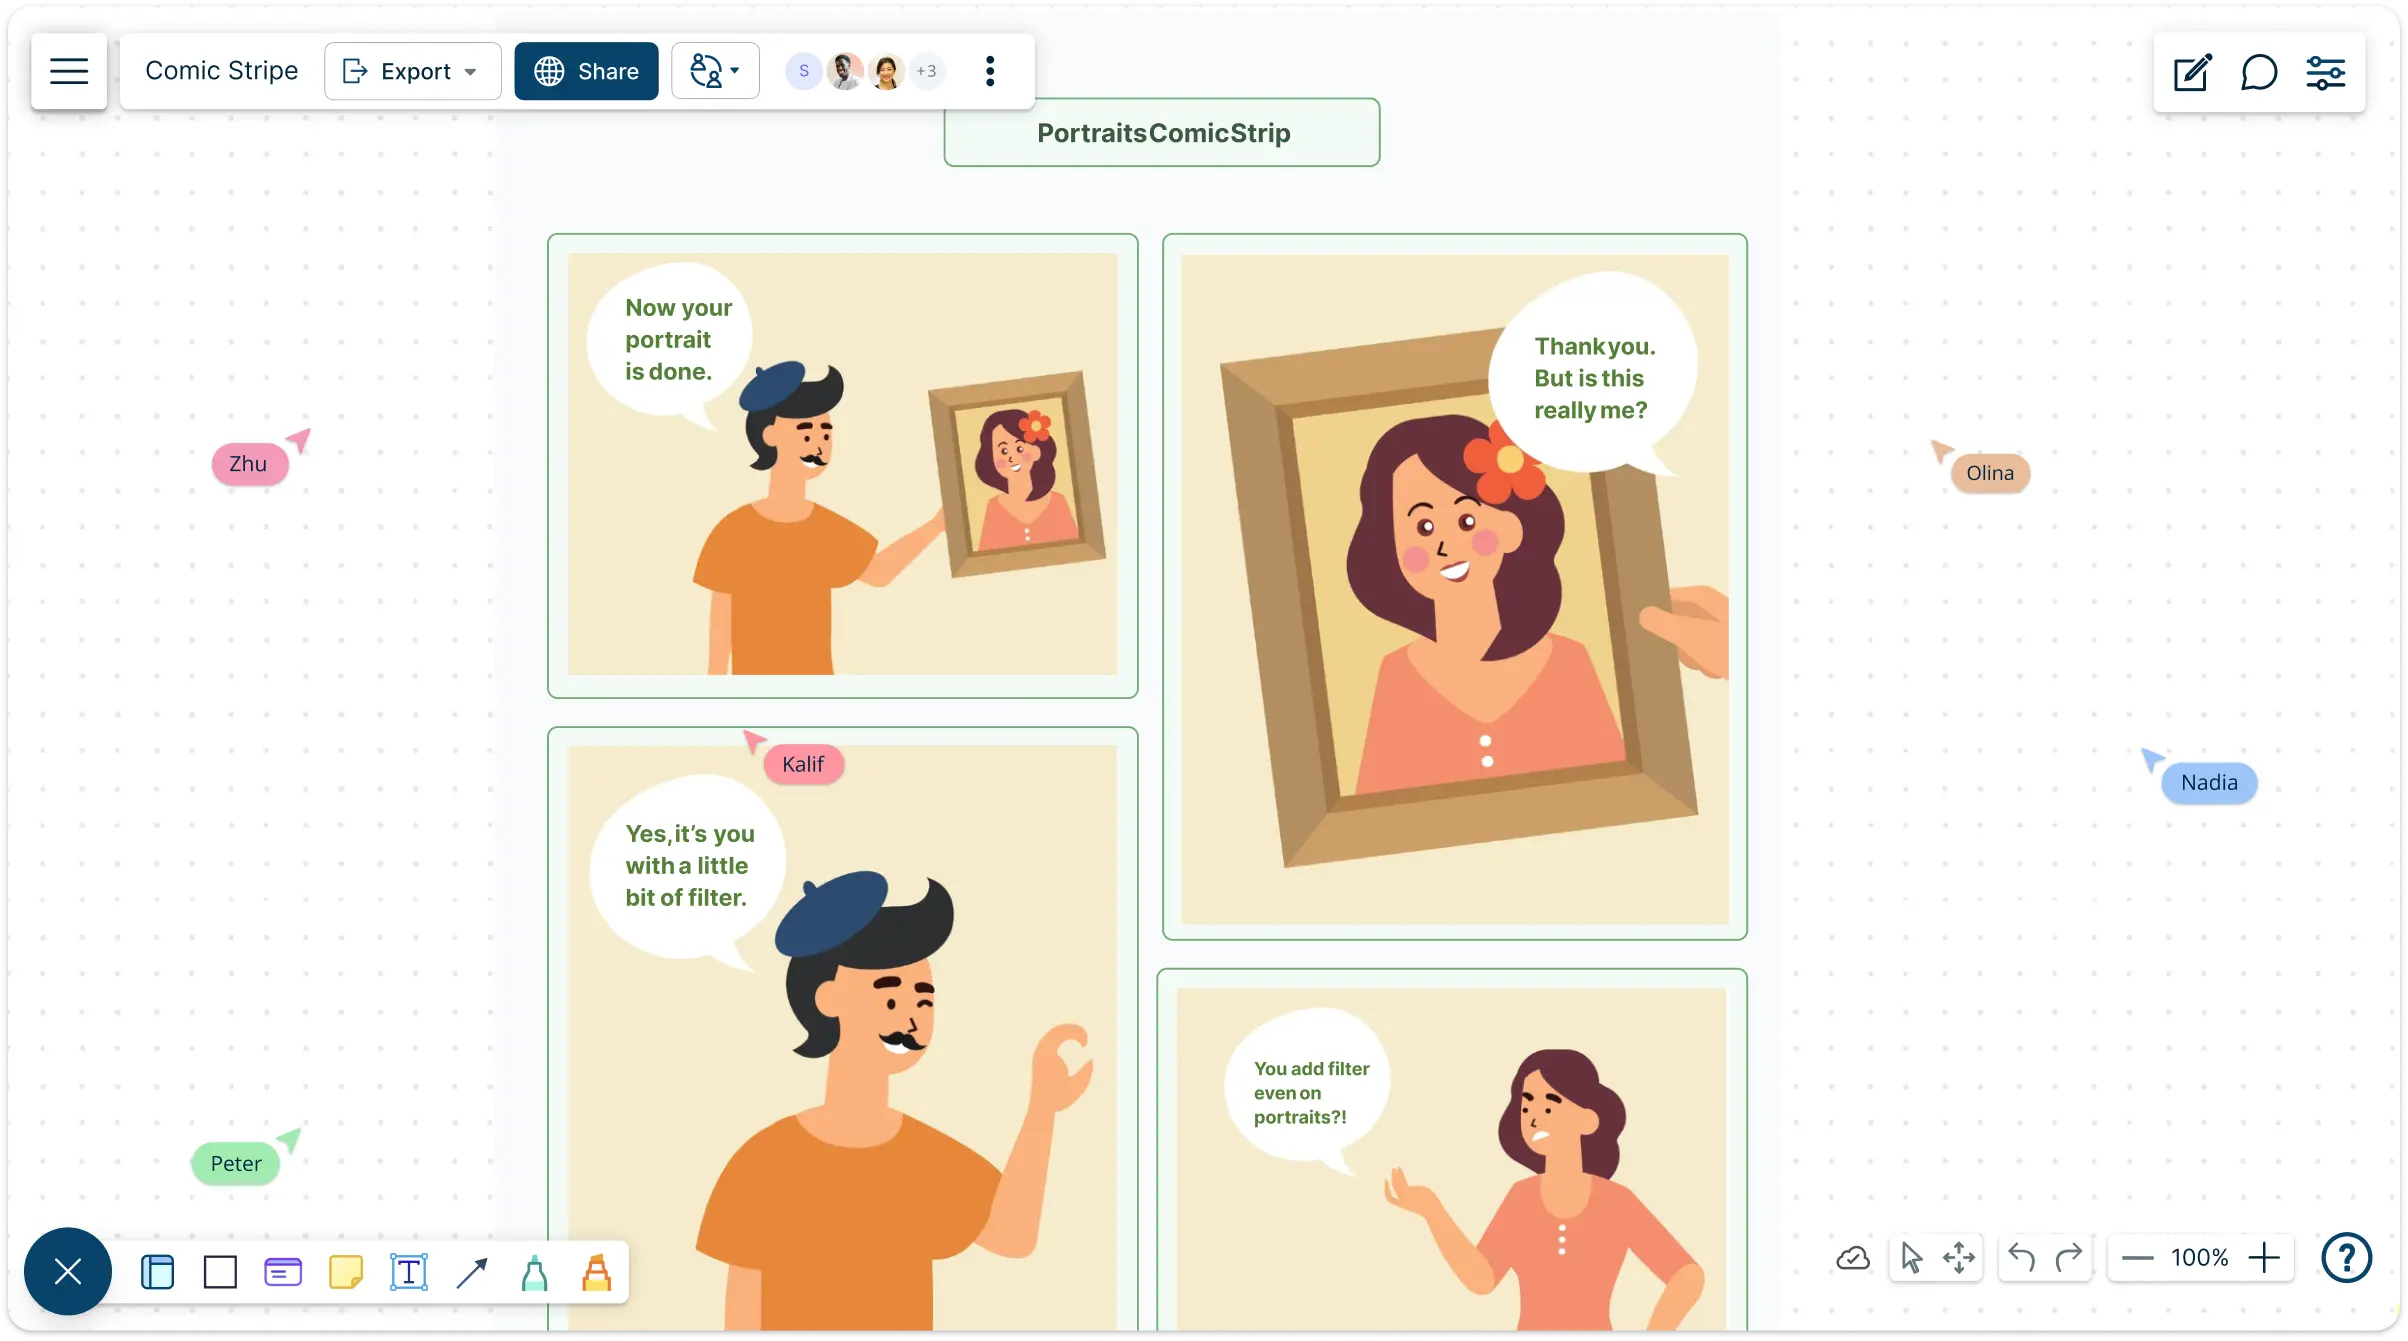
Capture imagination and awaken the storyteller in you with Creately’s easy-to-use visual platform to make fantastic comic strips. Visualize characters, storyboard ideas, design panels, add dialogue, and share, all in one collaborative canvas. Start from free comic strip templates or build your style from scratch.
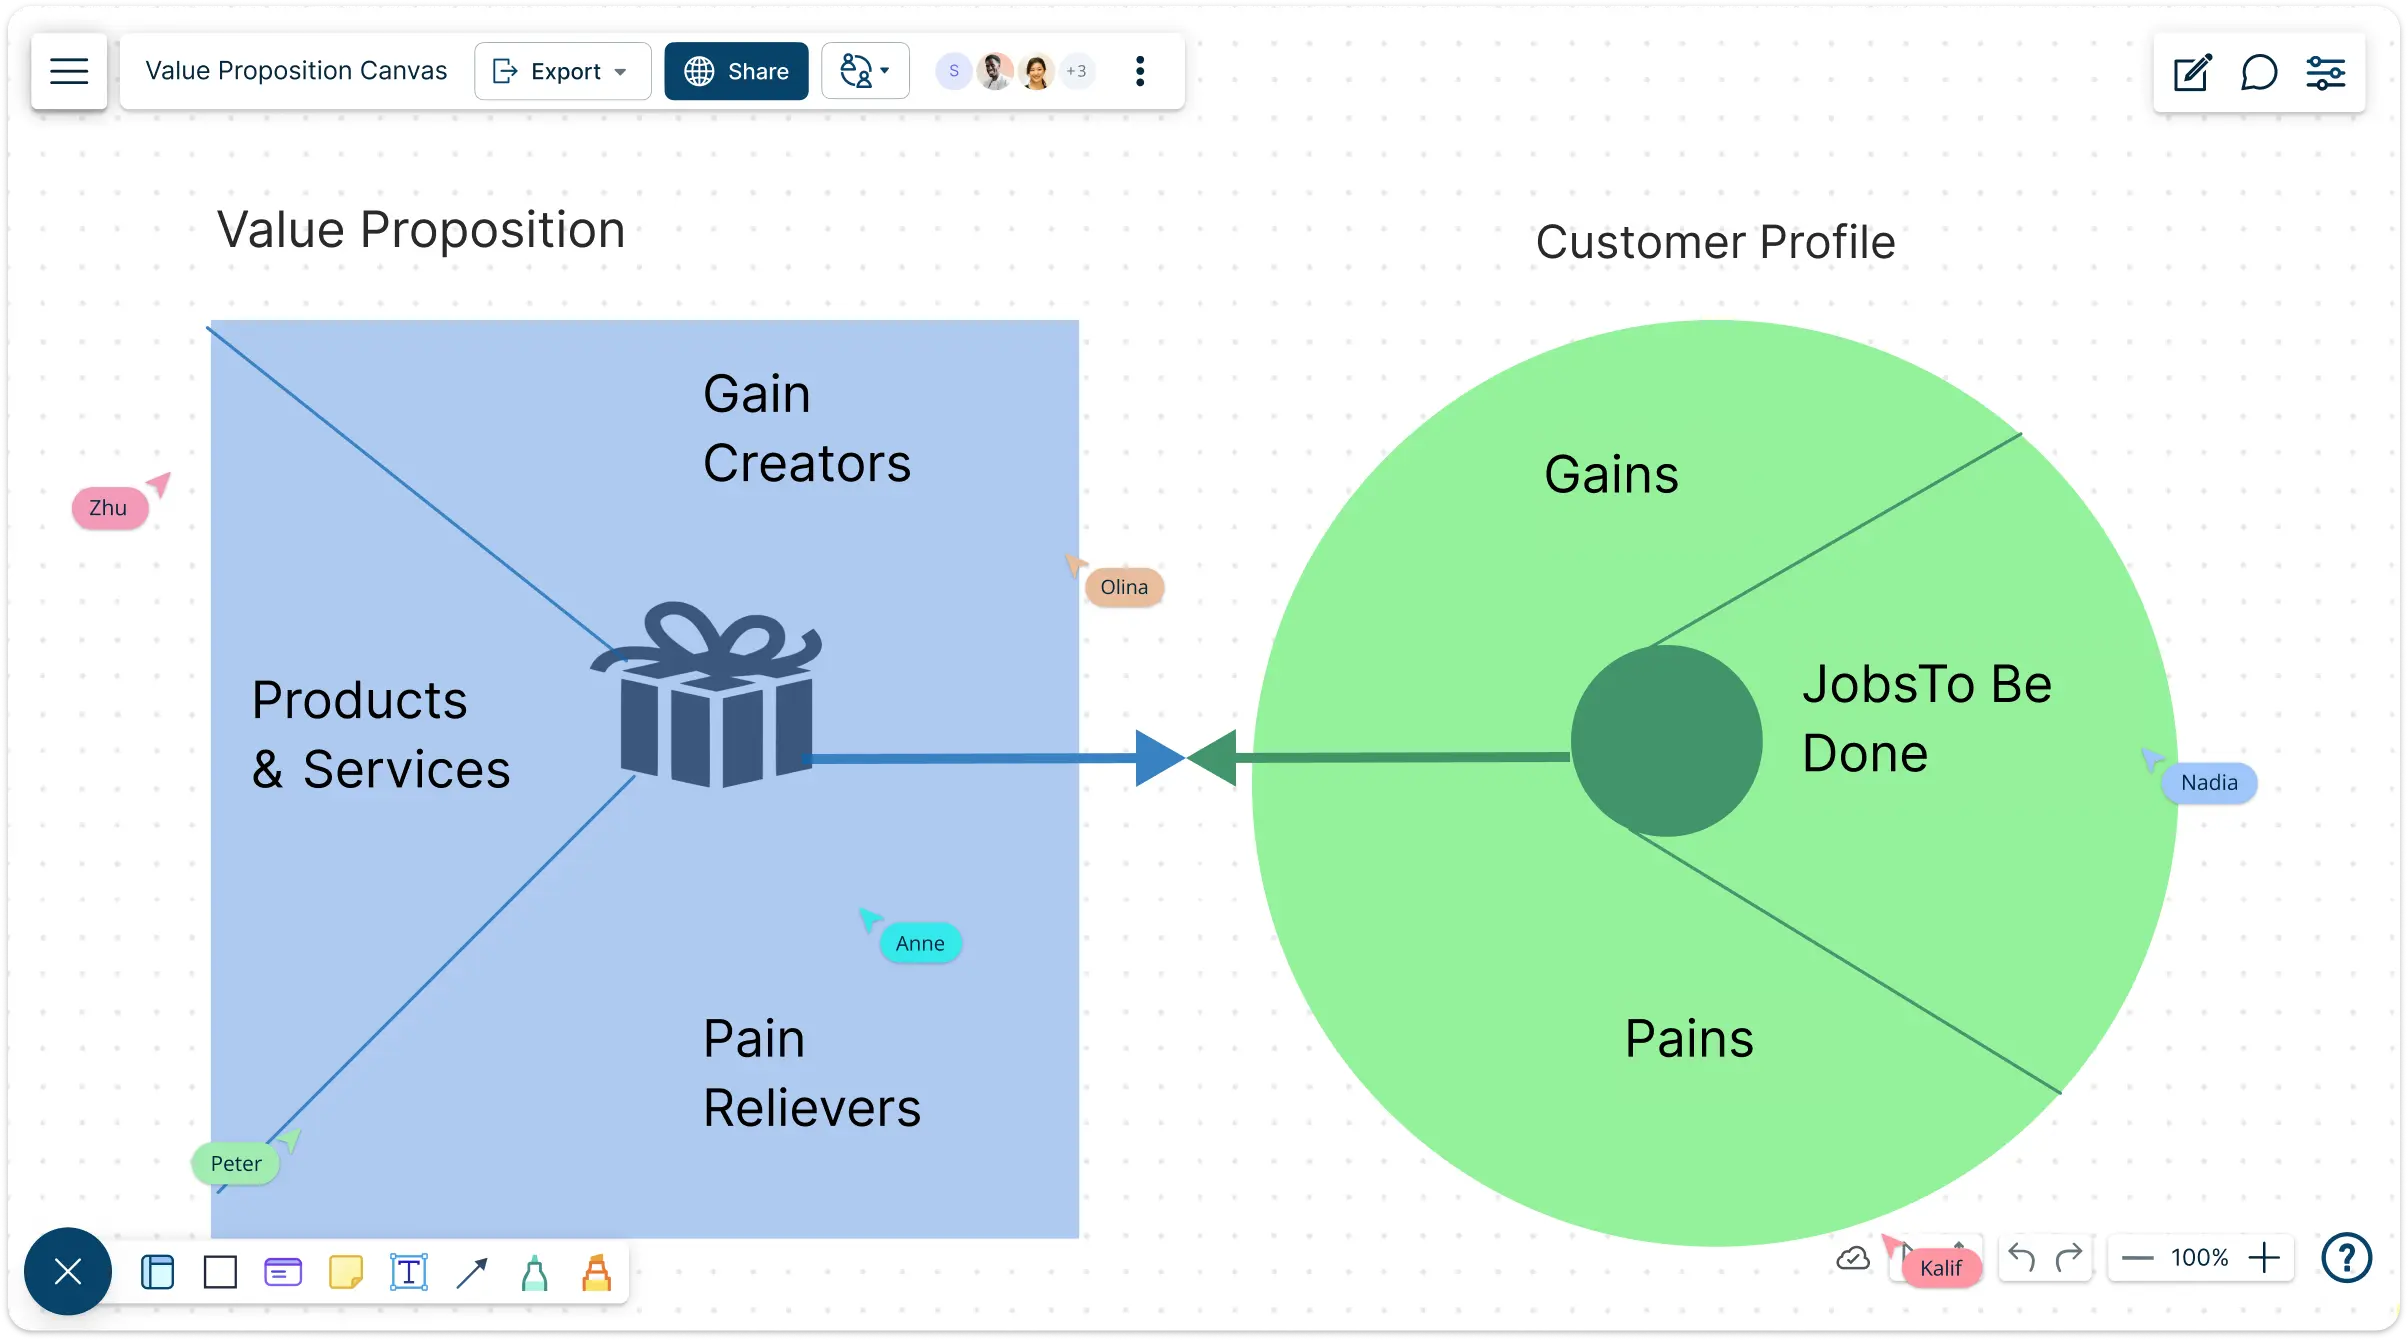
Map your customer needs and business offerings side by side. Explore how your products create real value through clear visualization and actionable insights; validate and refine your business strategy quickly.
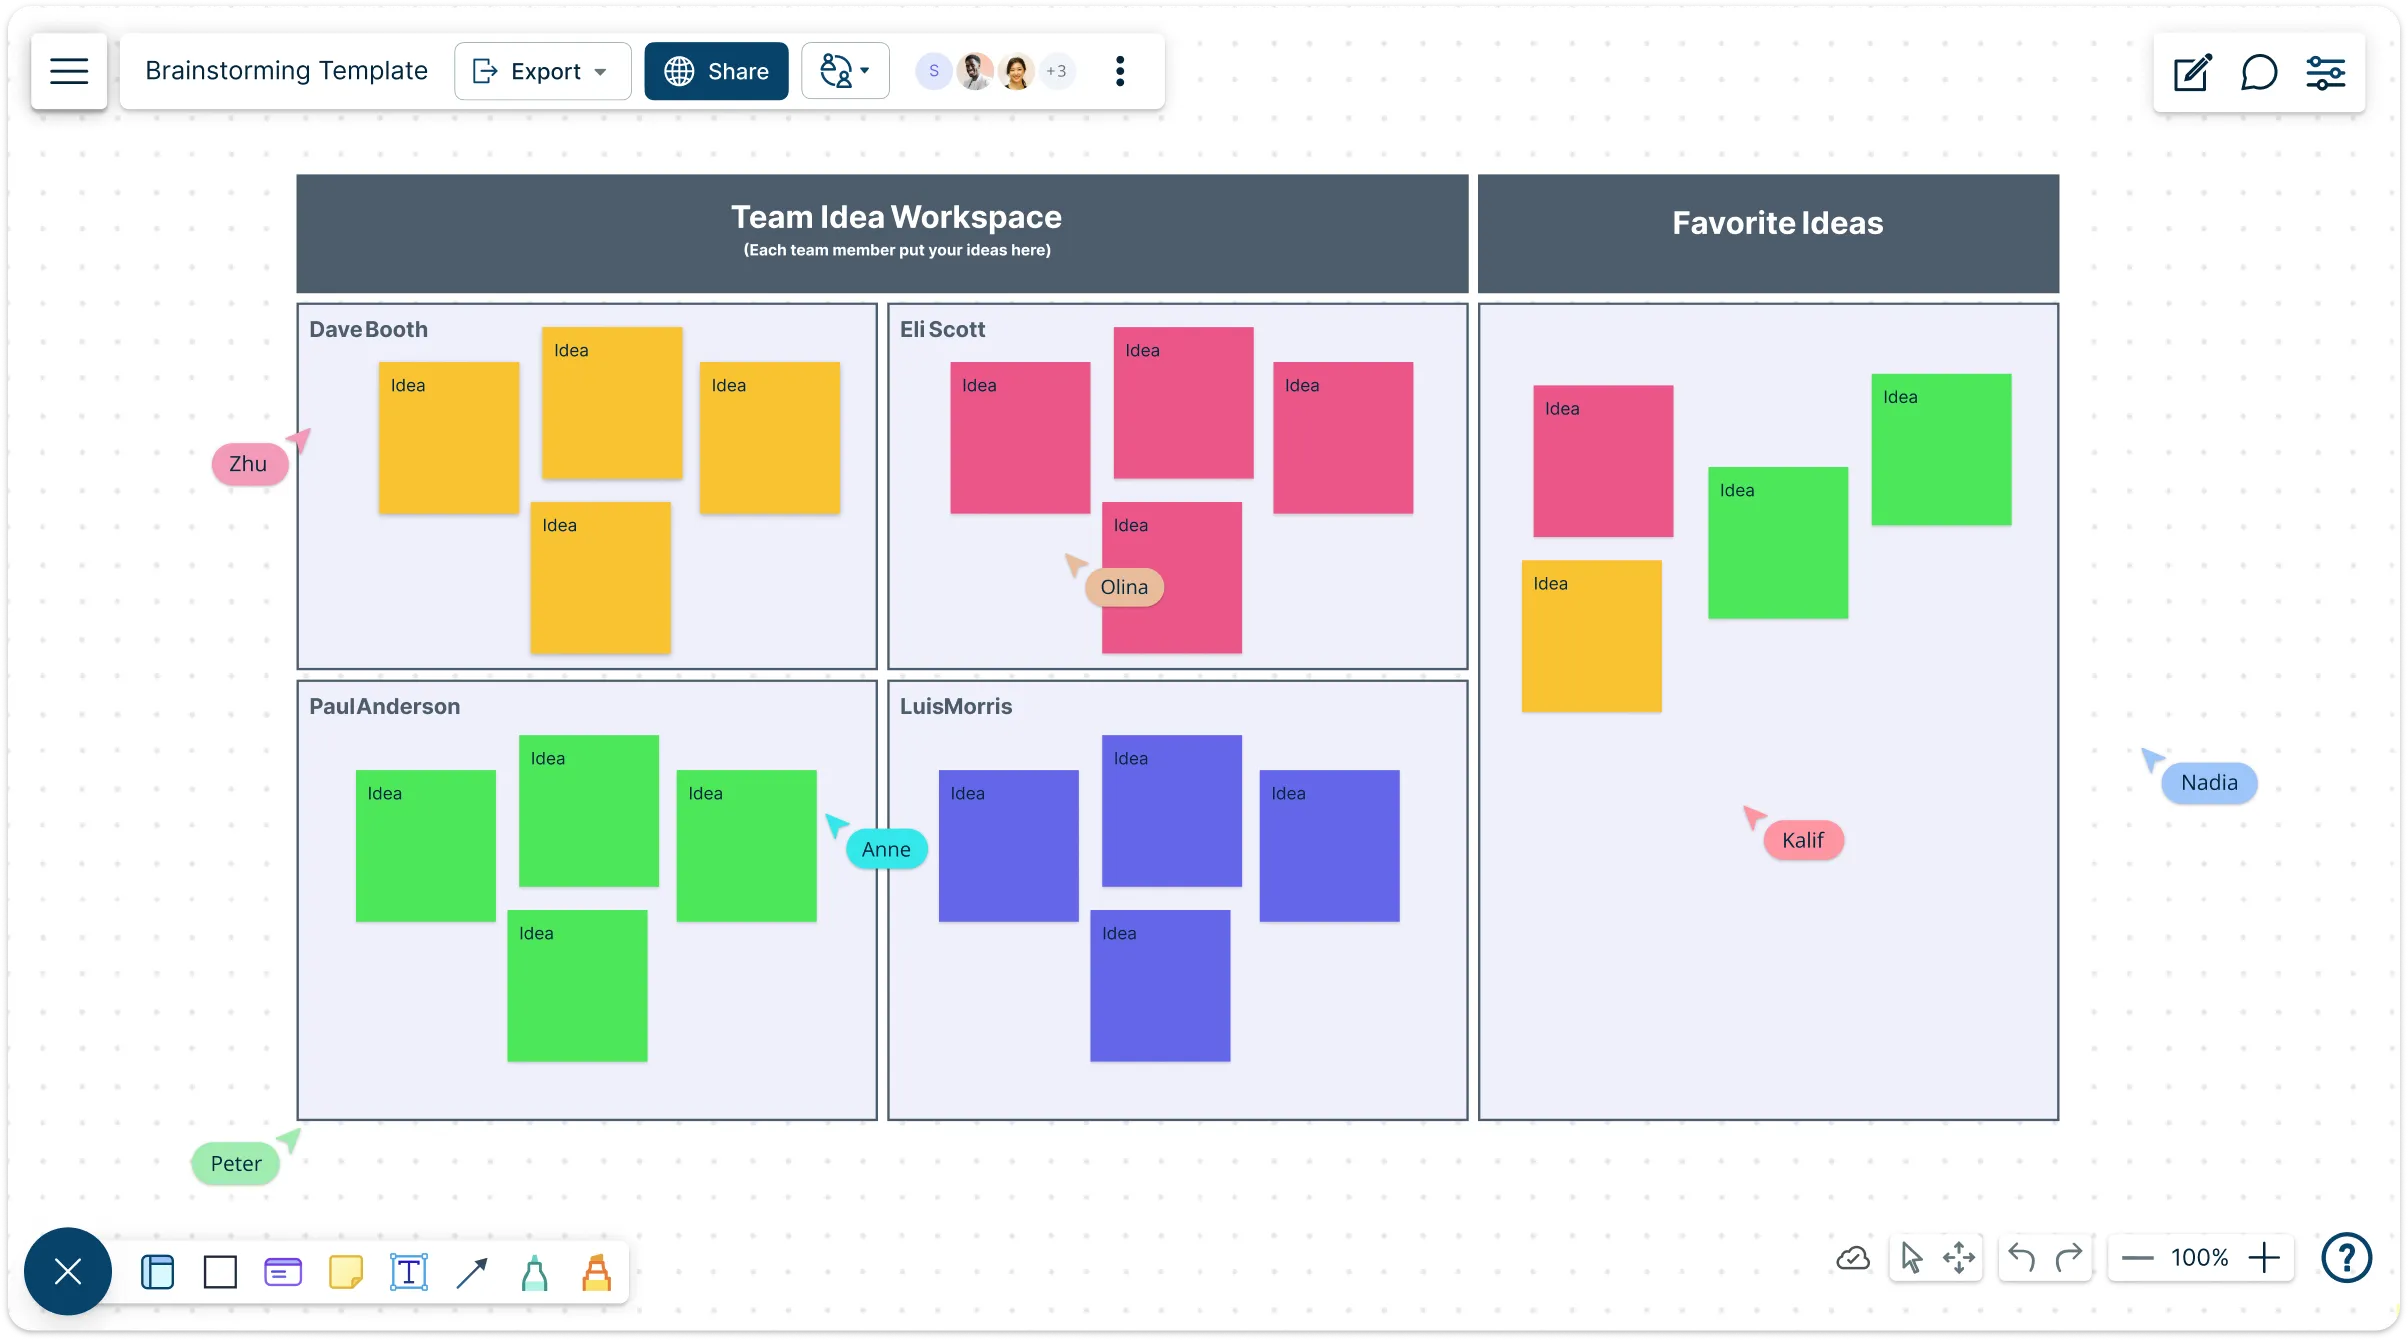
Turn scattered thoughts into clear, actionable plans with Creately’s visual brainstorming templates. Capture ideas, organize them instantly, and move from concept to execution — all on one canvas.
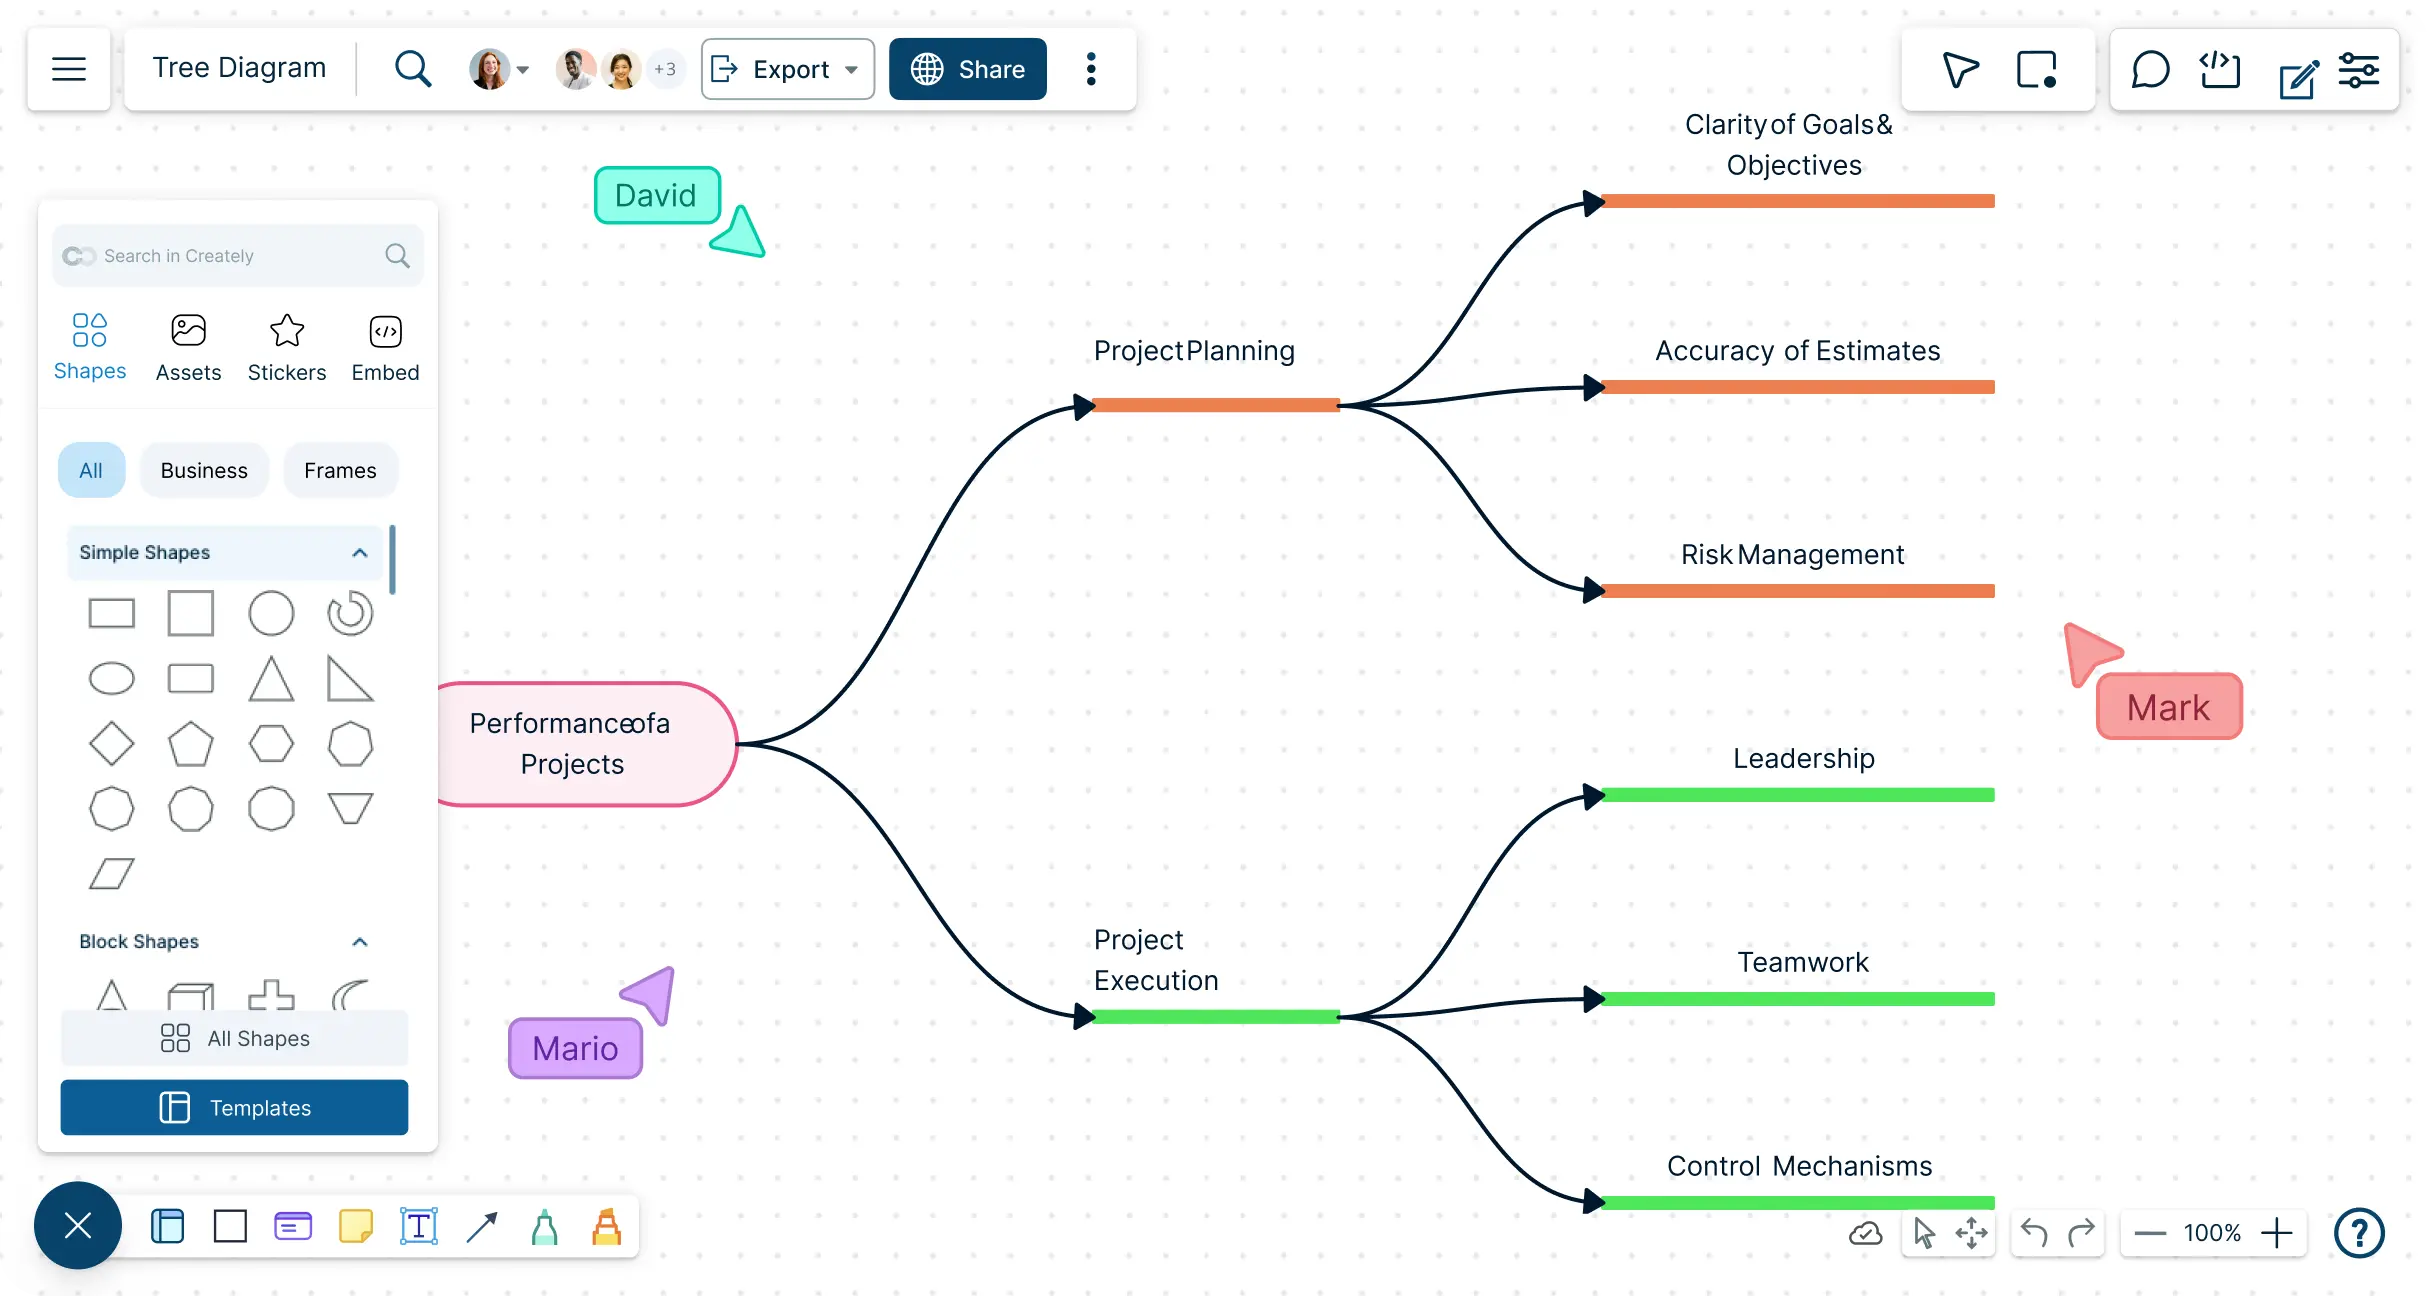
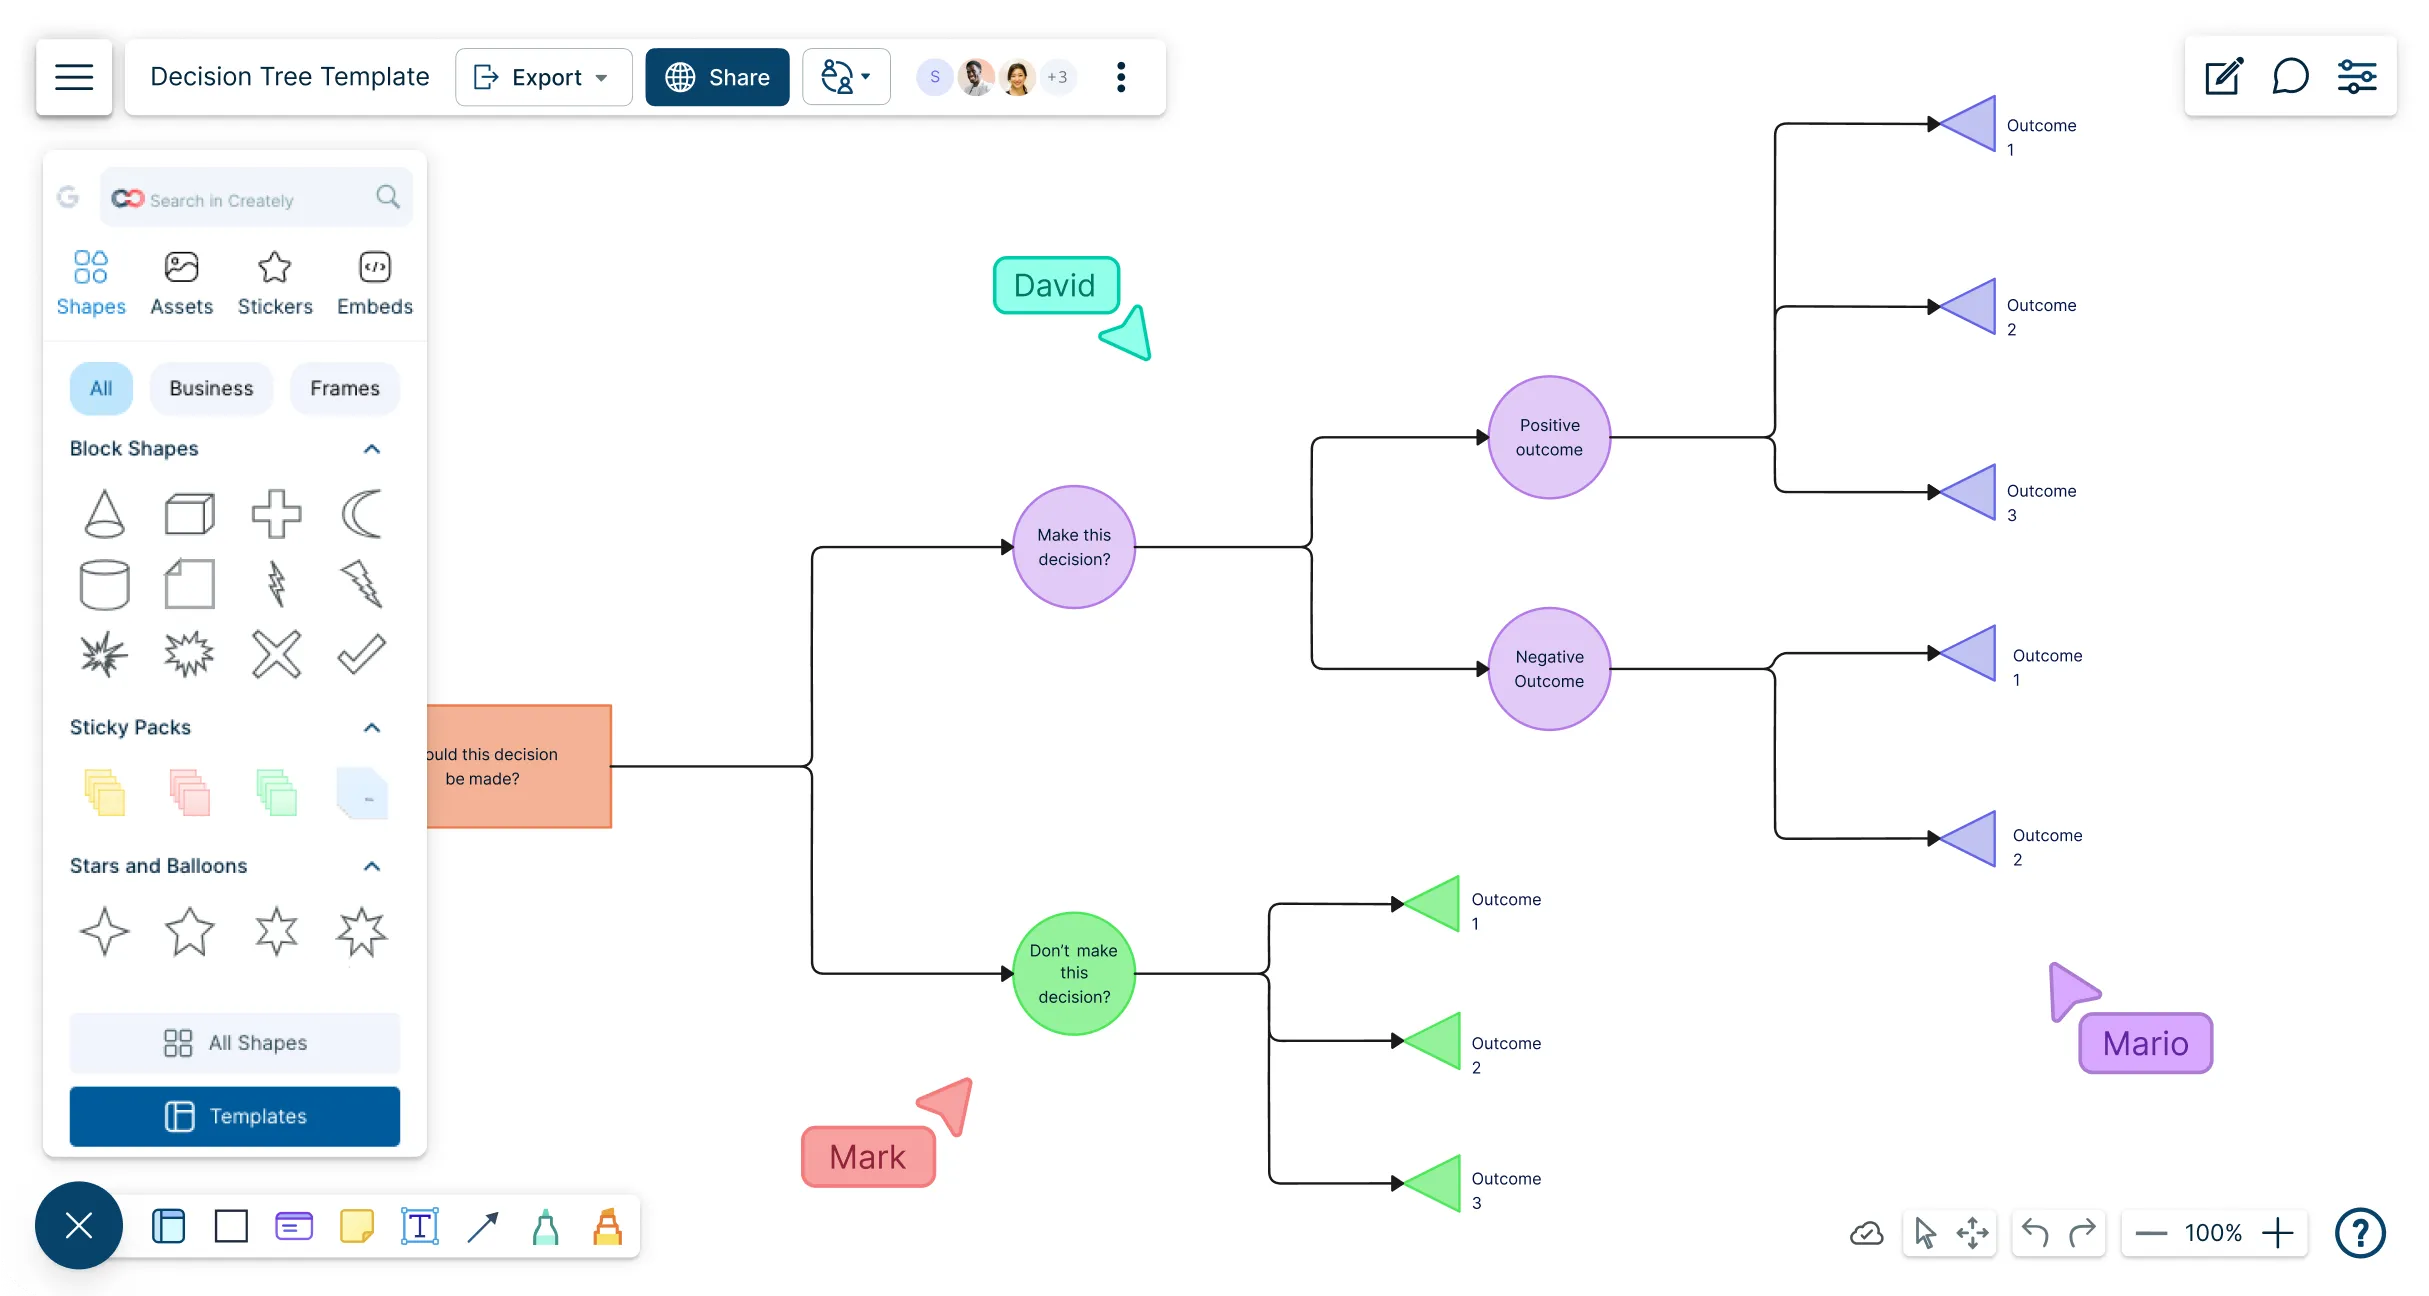
Transform complicated data into clear, easy-to-understand hierarchical data visualization with Creately’s intuitive online tool. Create, edit, and share professional decision analysis tree diagrams in minutes.
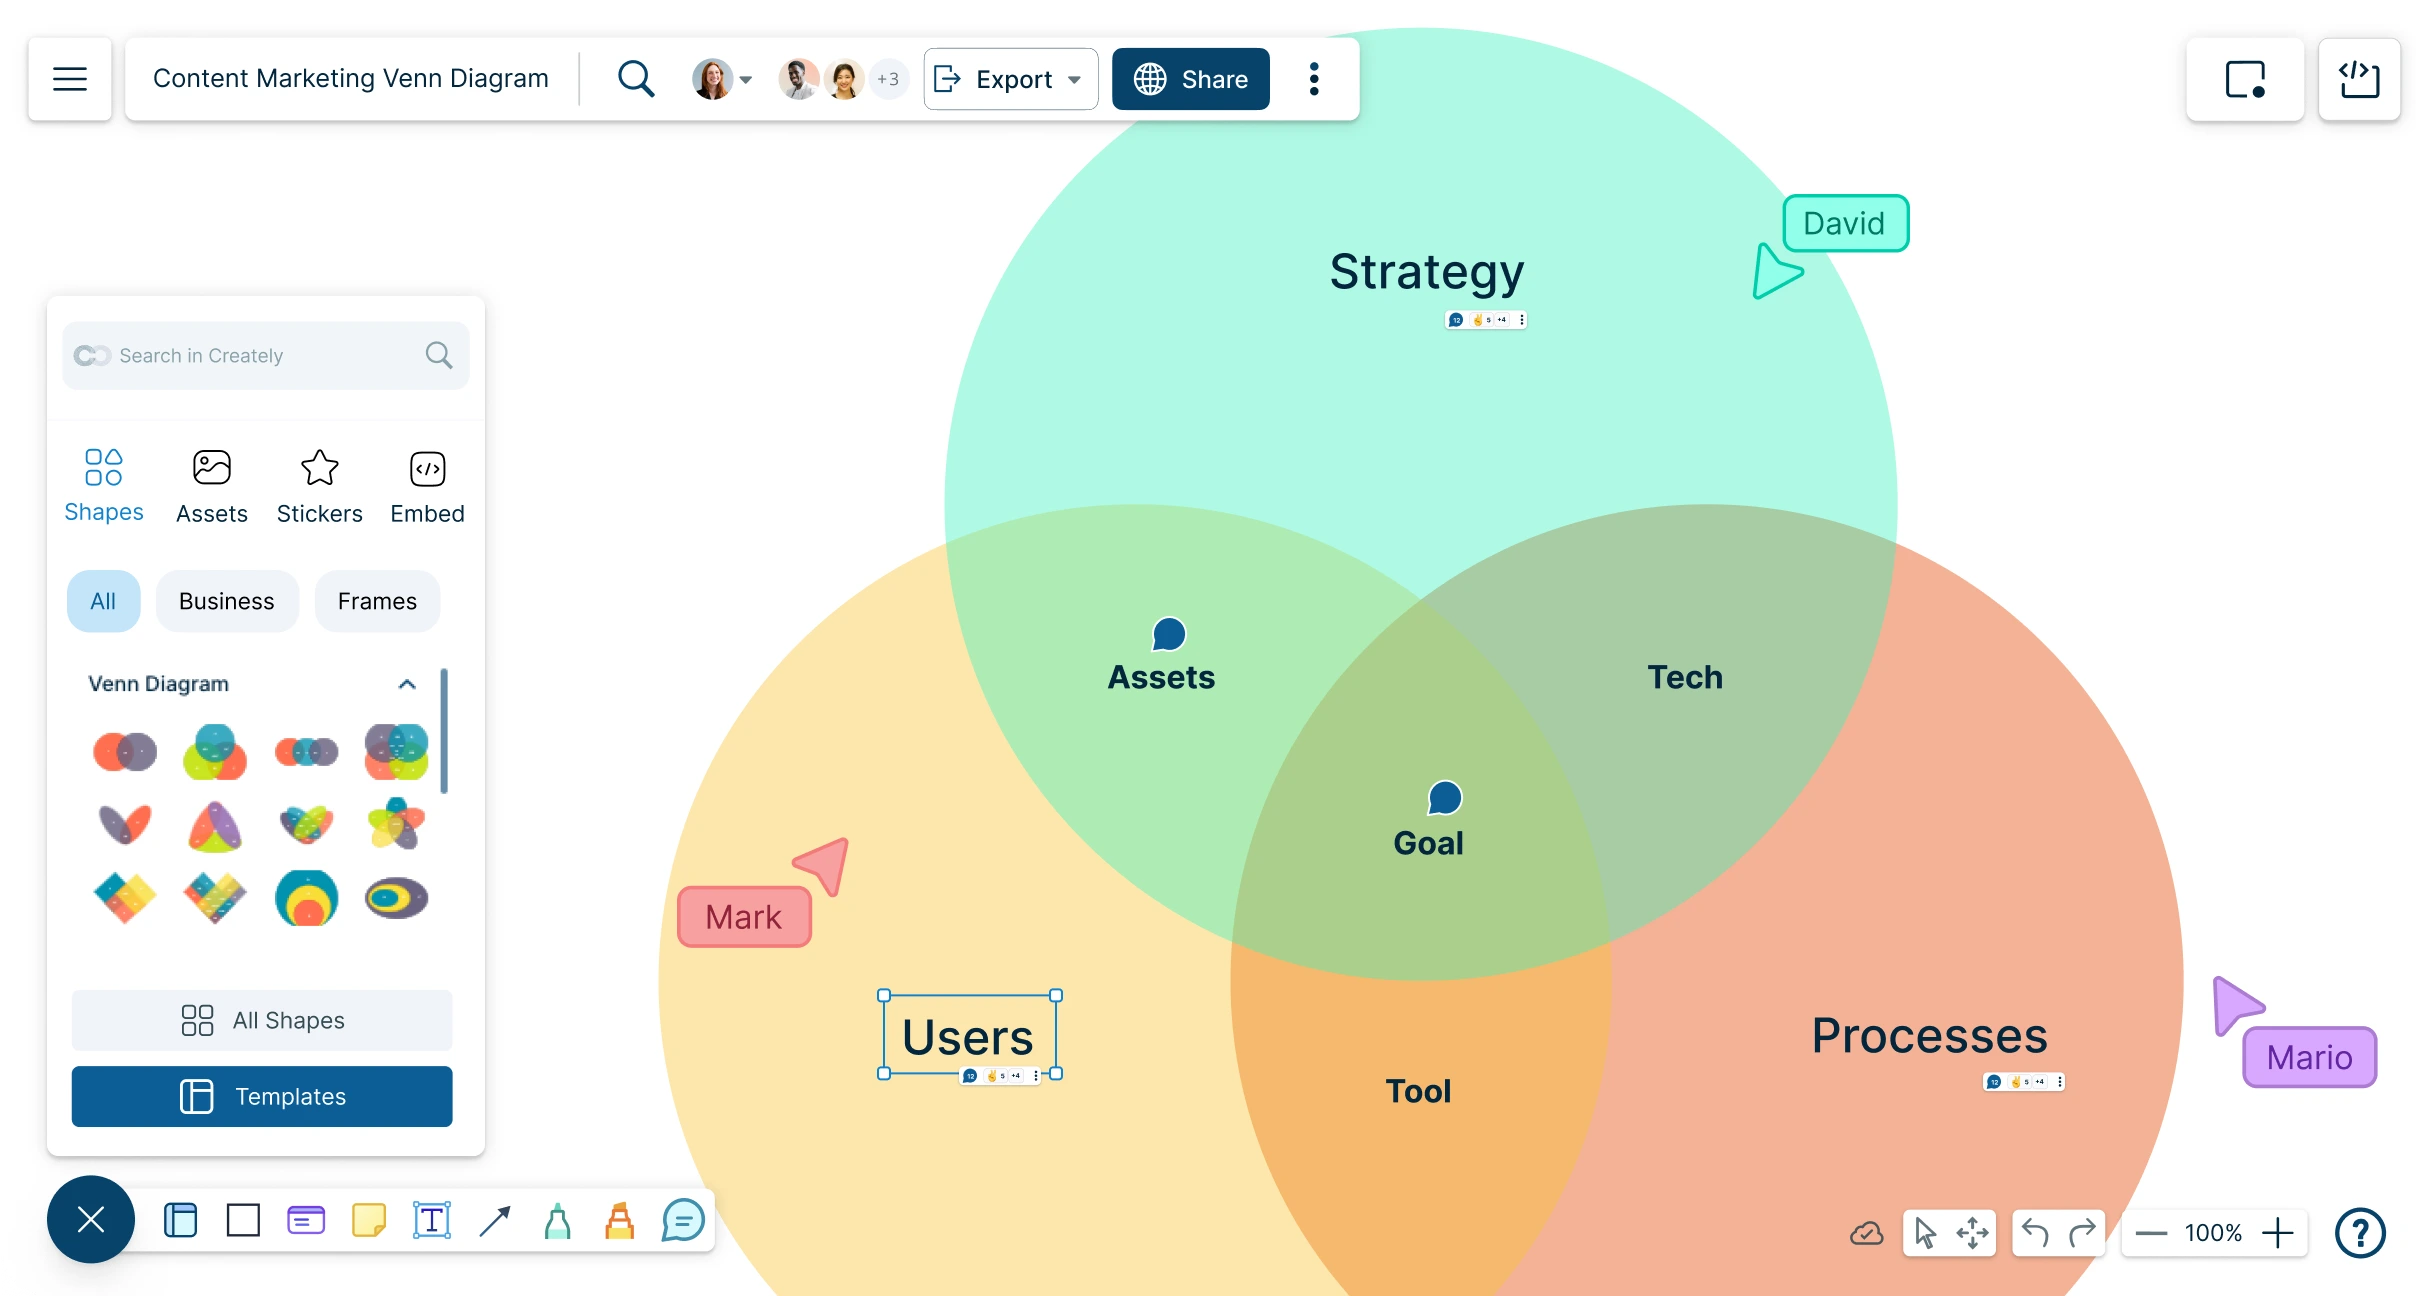
Better understand and represent data with our free Venn diagram tool. Visually represent information with our shape library and simple drag-and-drop tools.
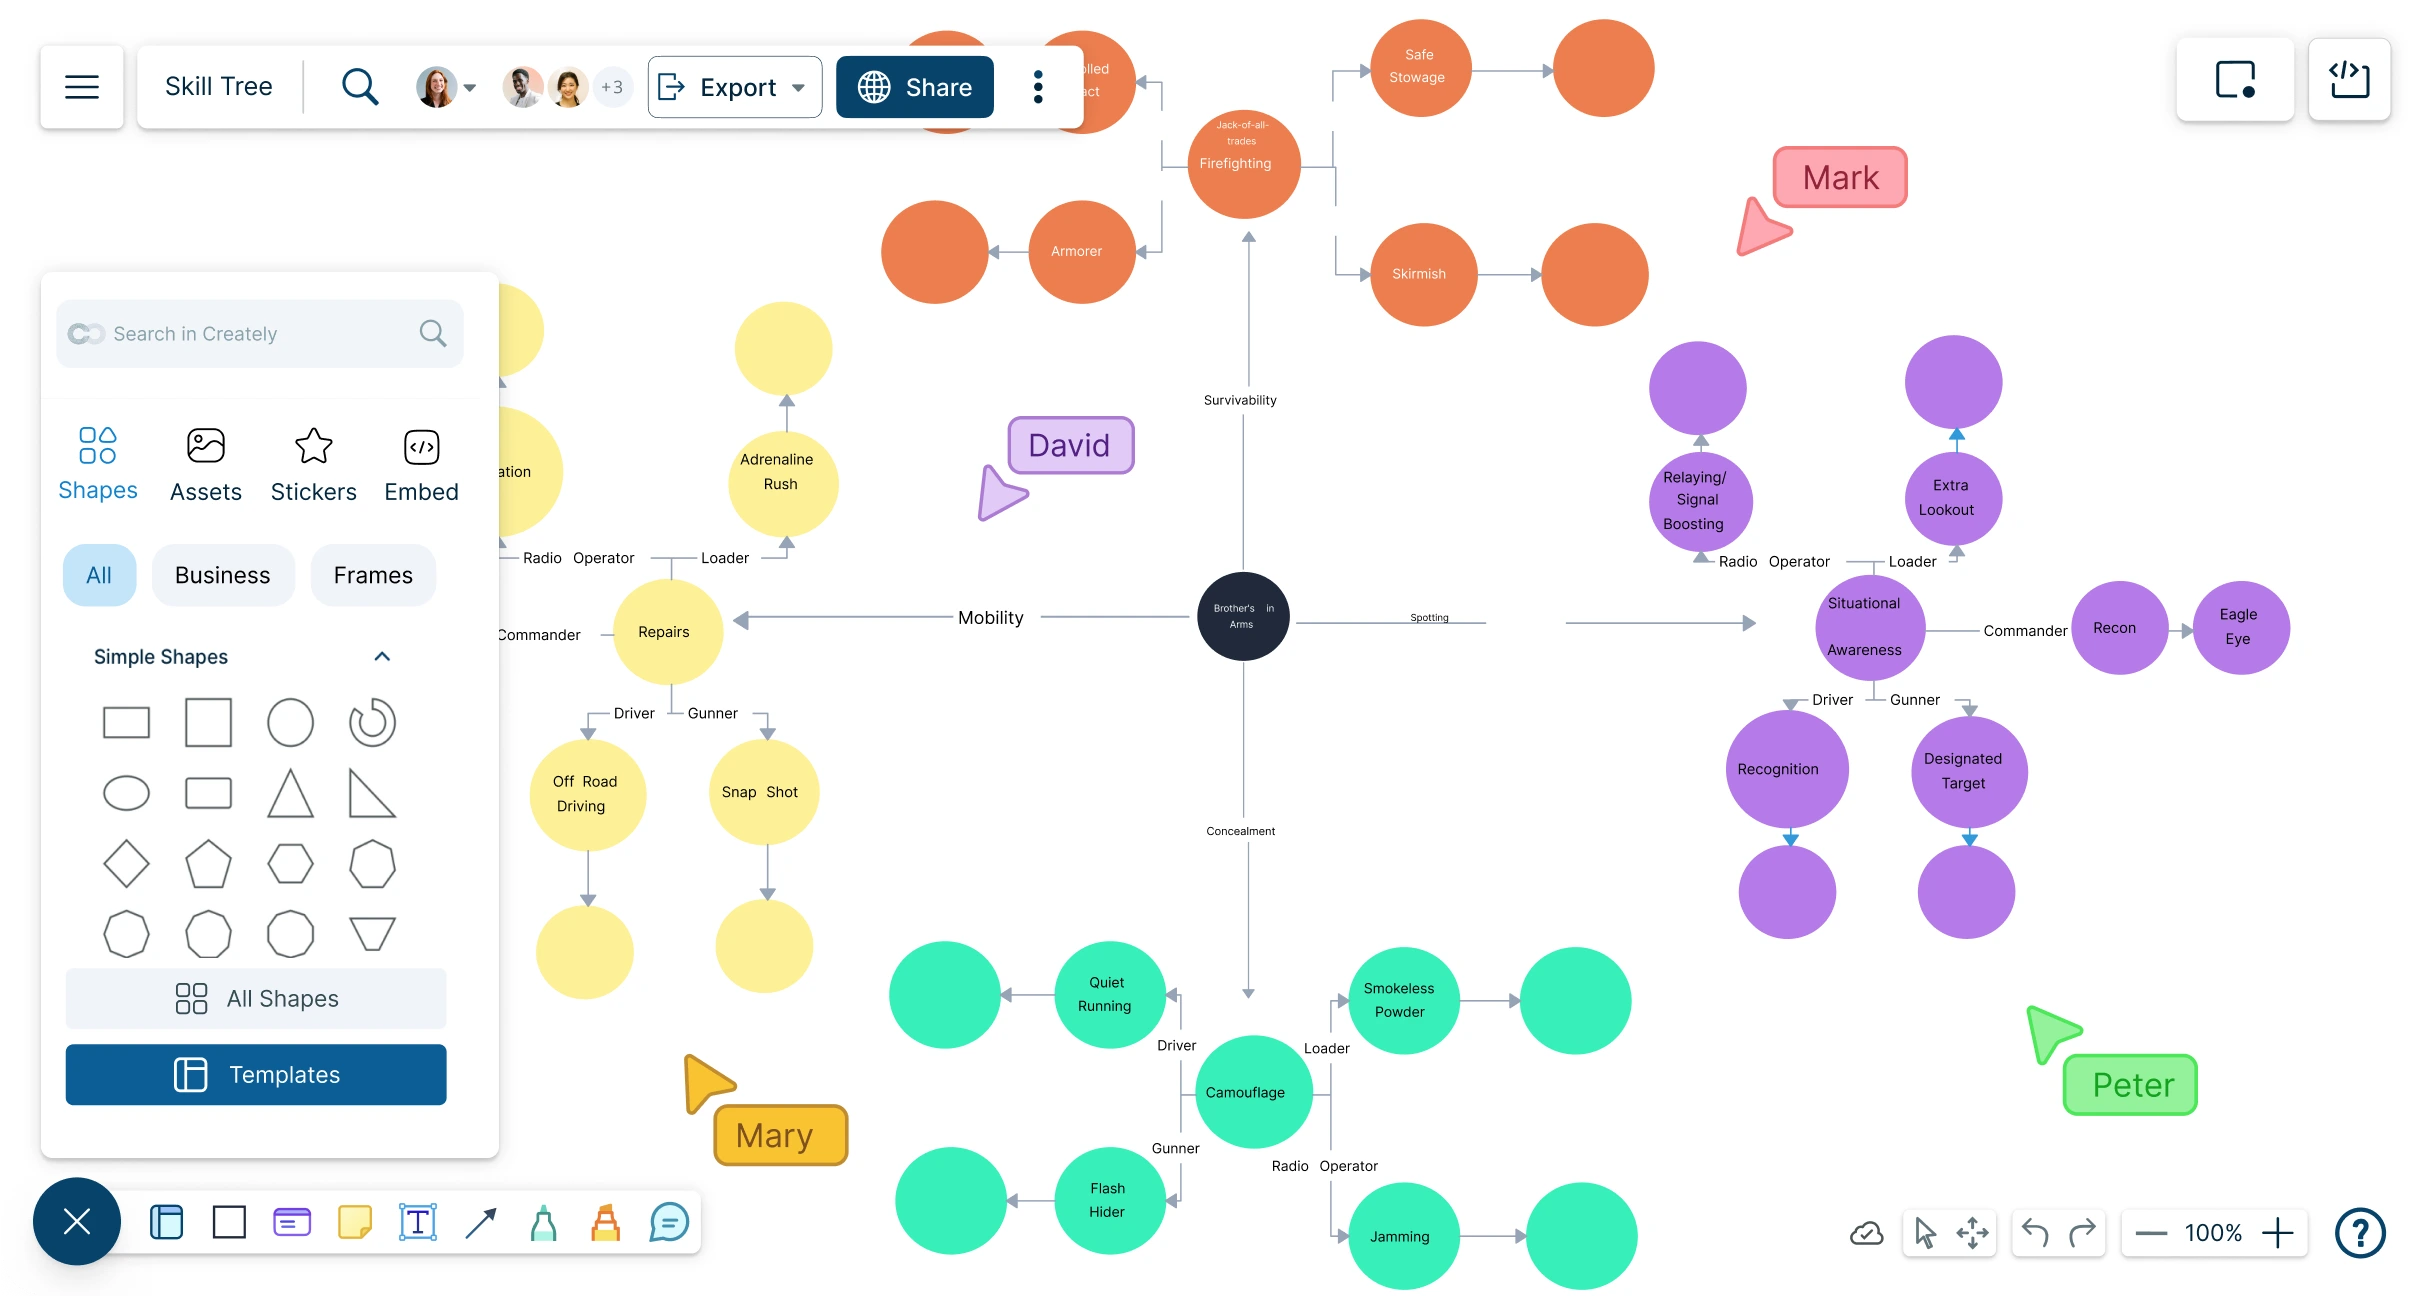
Enhance your video game character’s skill and gameplay progression with a powerful Skill Tree Creator that includes ready-to-use templates.
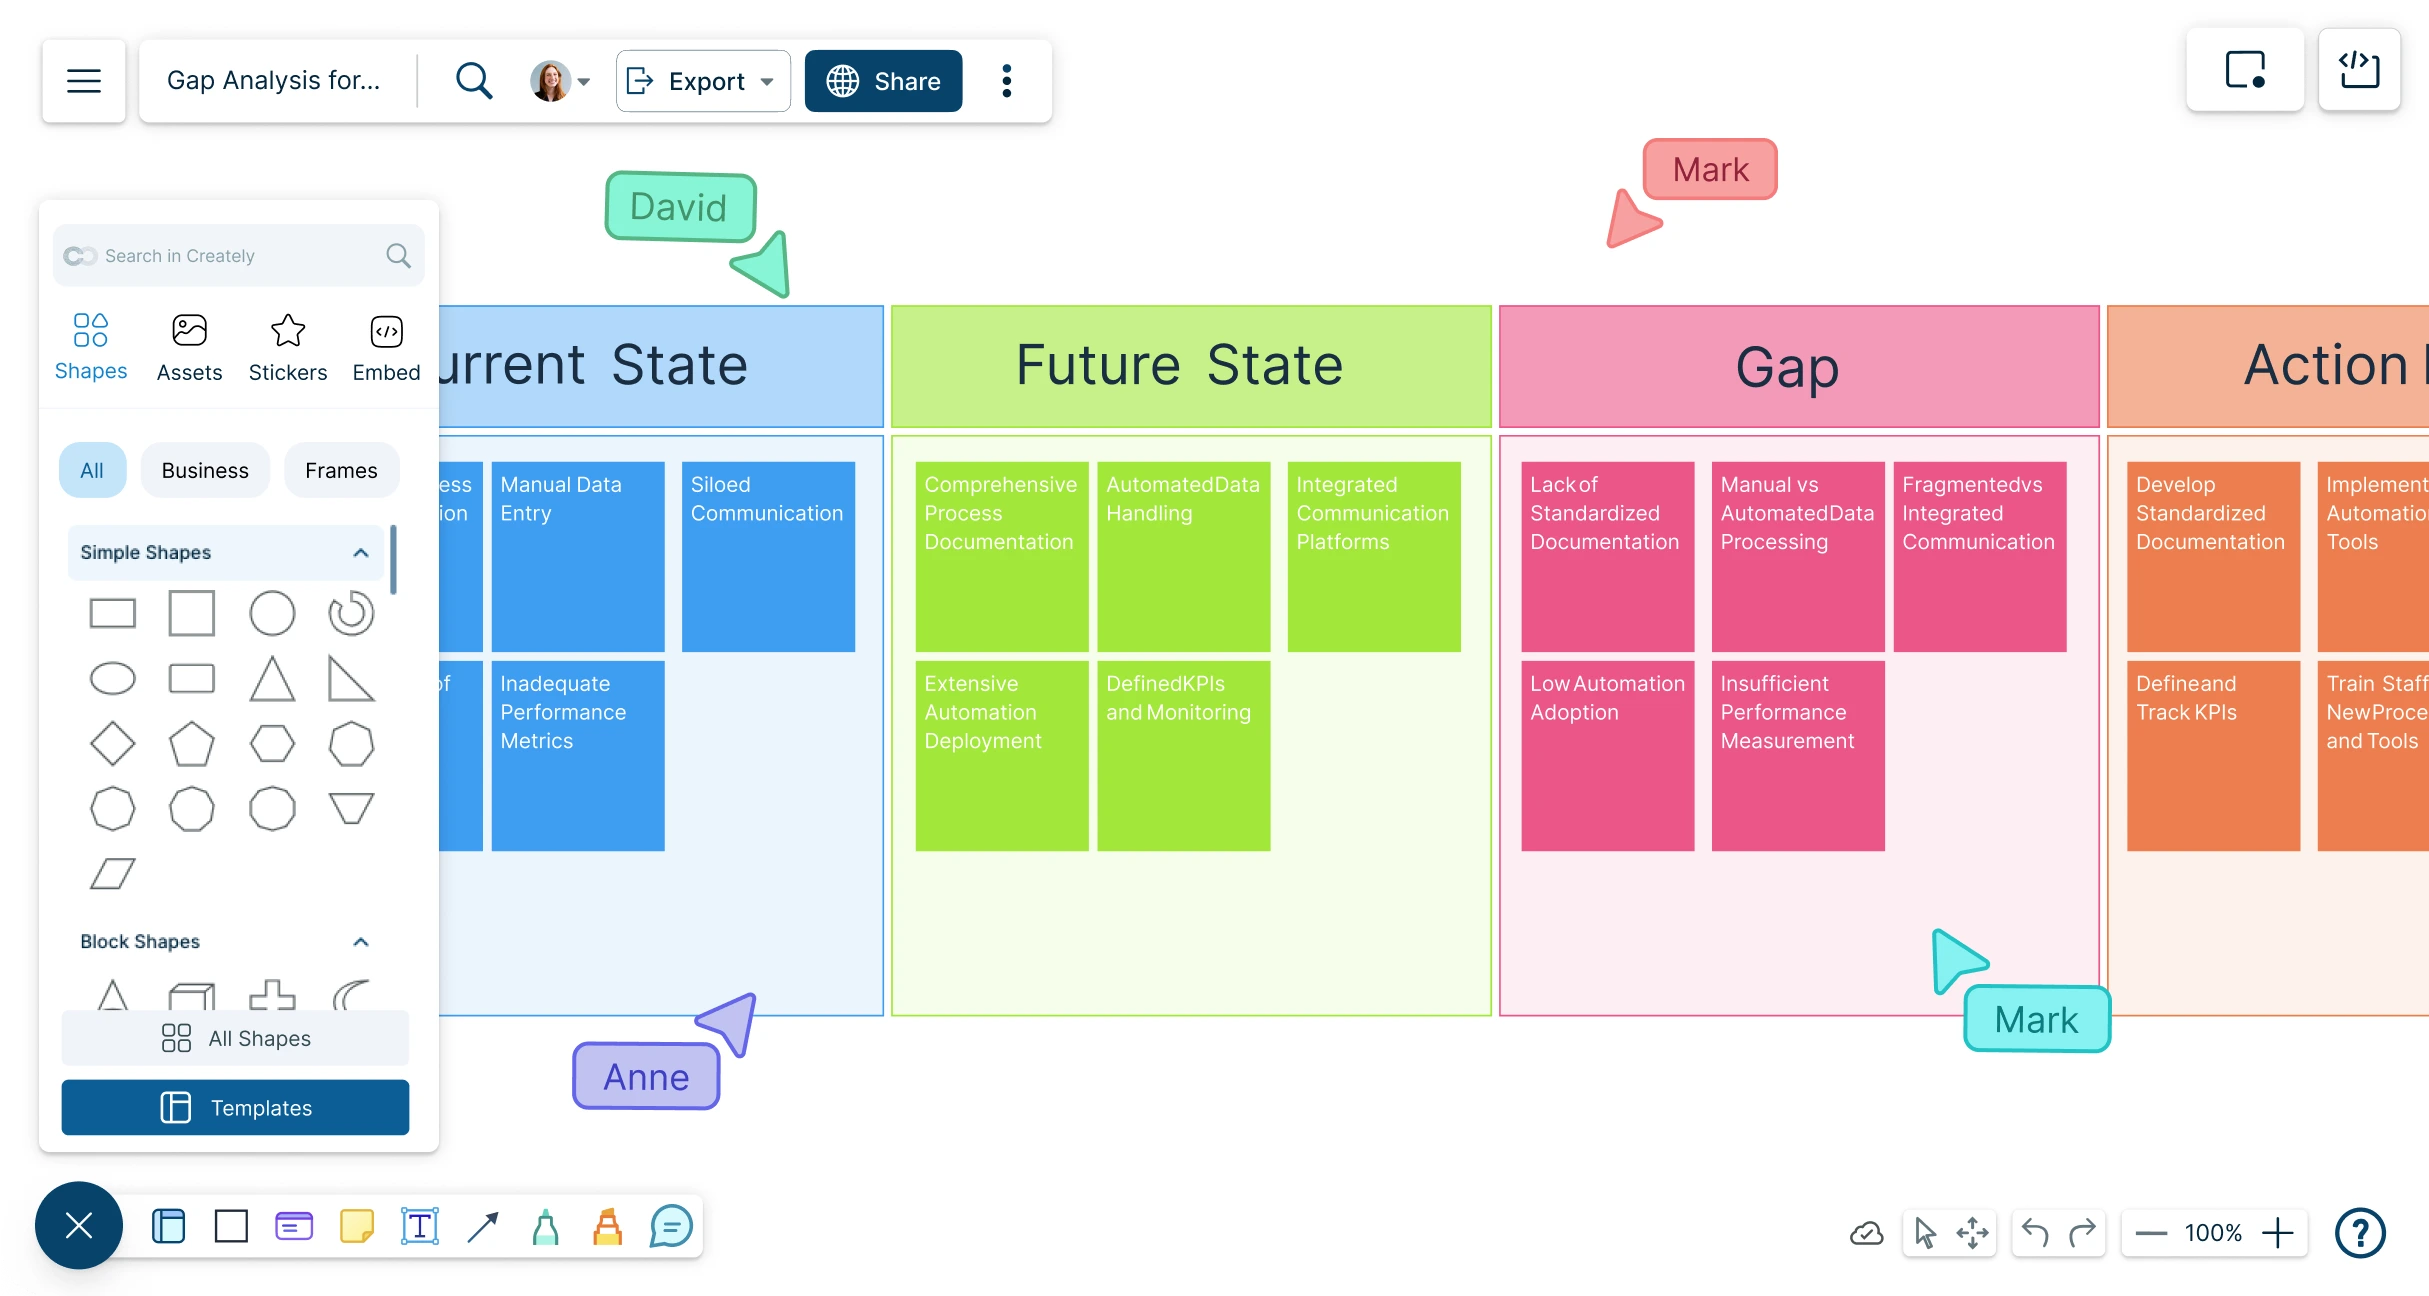
Quickly map your current vs. target state, identify gaps, and align teams on a clear path forward with Creately’s visual and collaborative gap analysis tool.
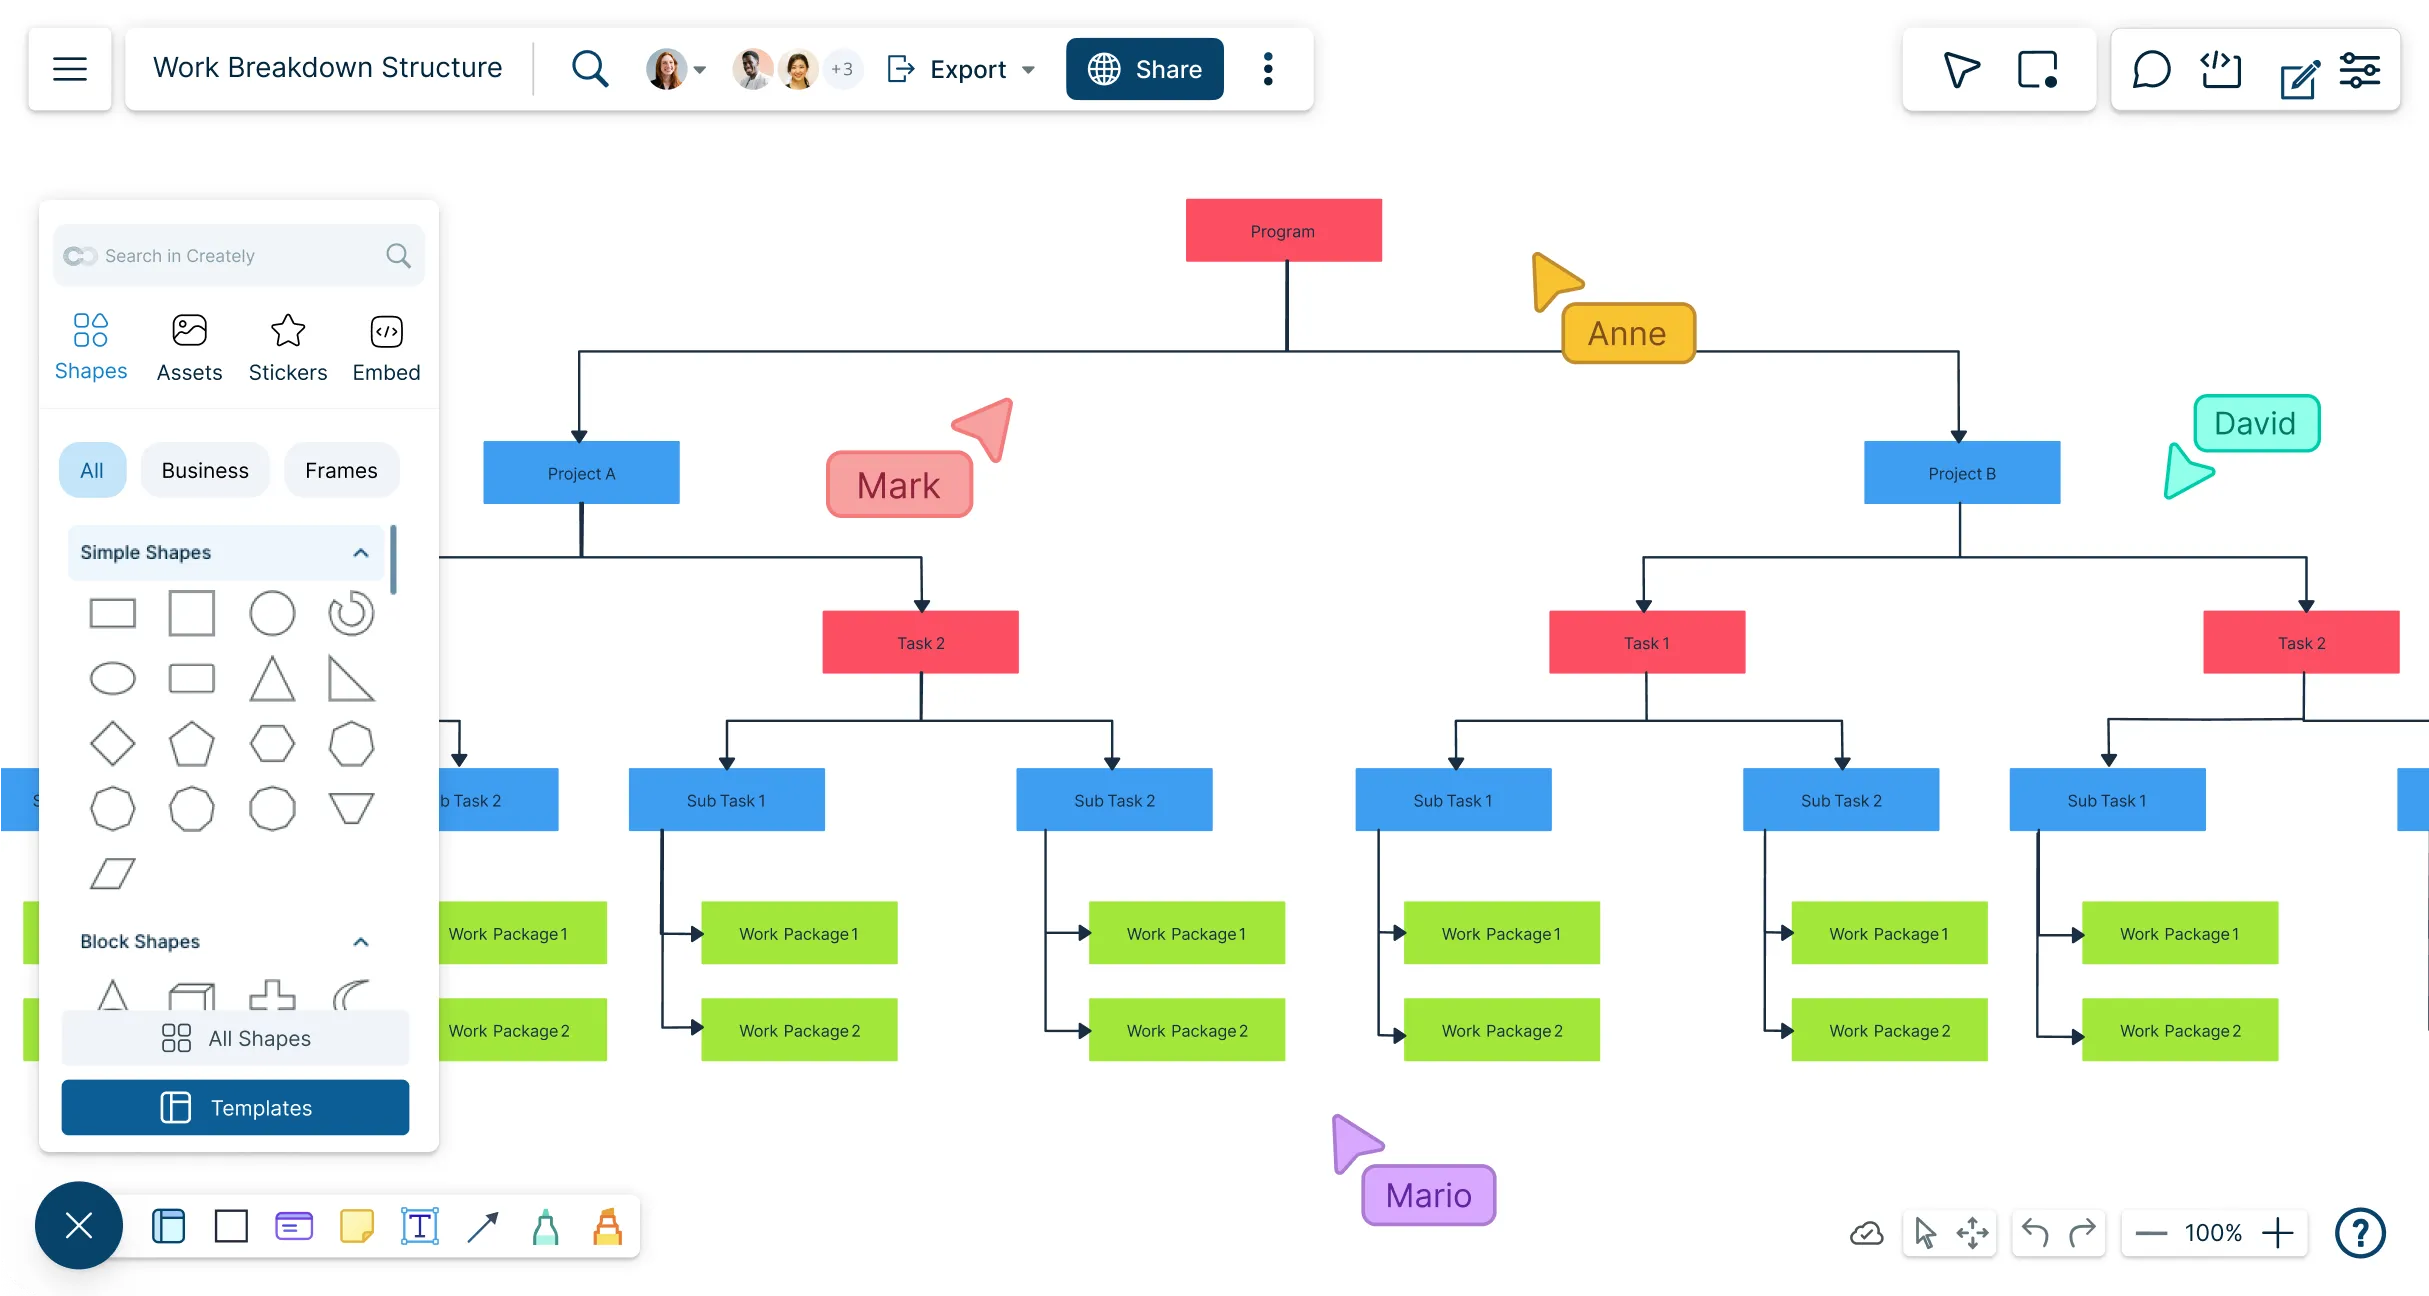
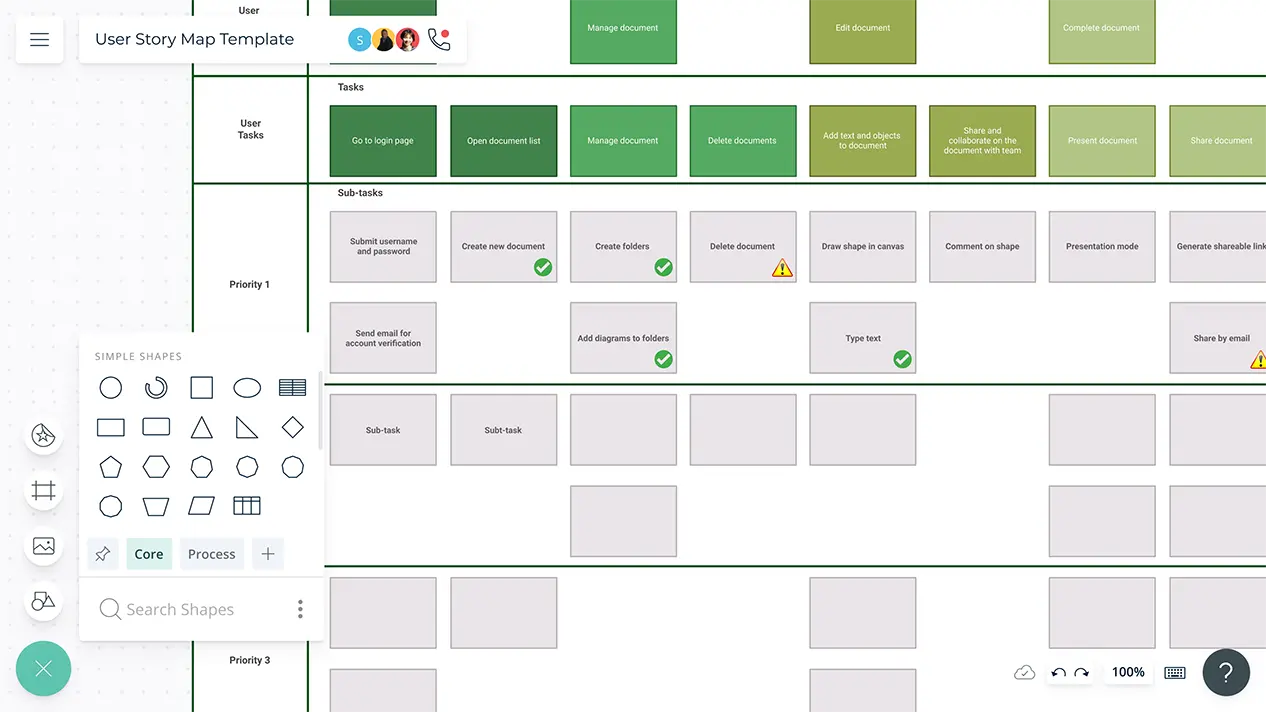
Break down large projects into tasks, visualize workflows, and keep your team aligned with our intuitive work breakdown structure software.
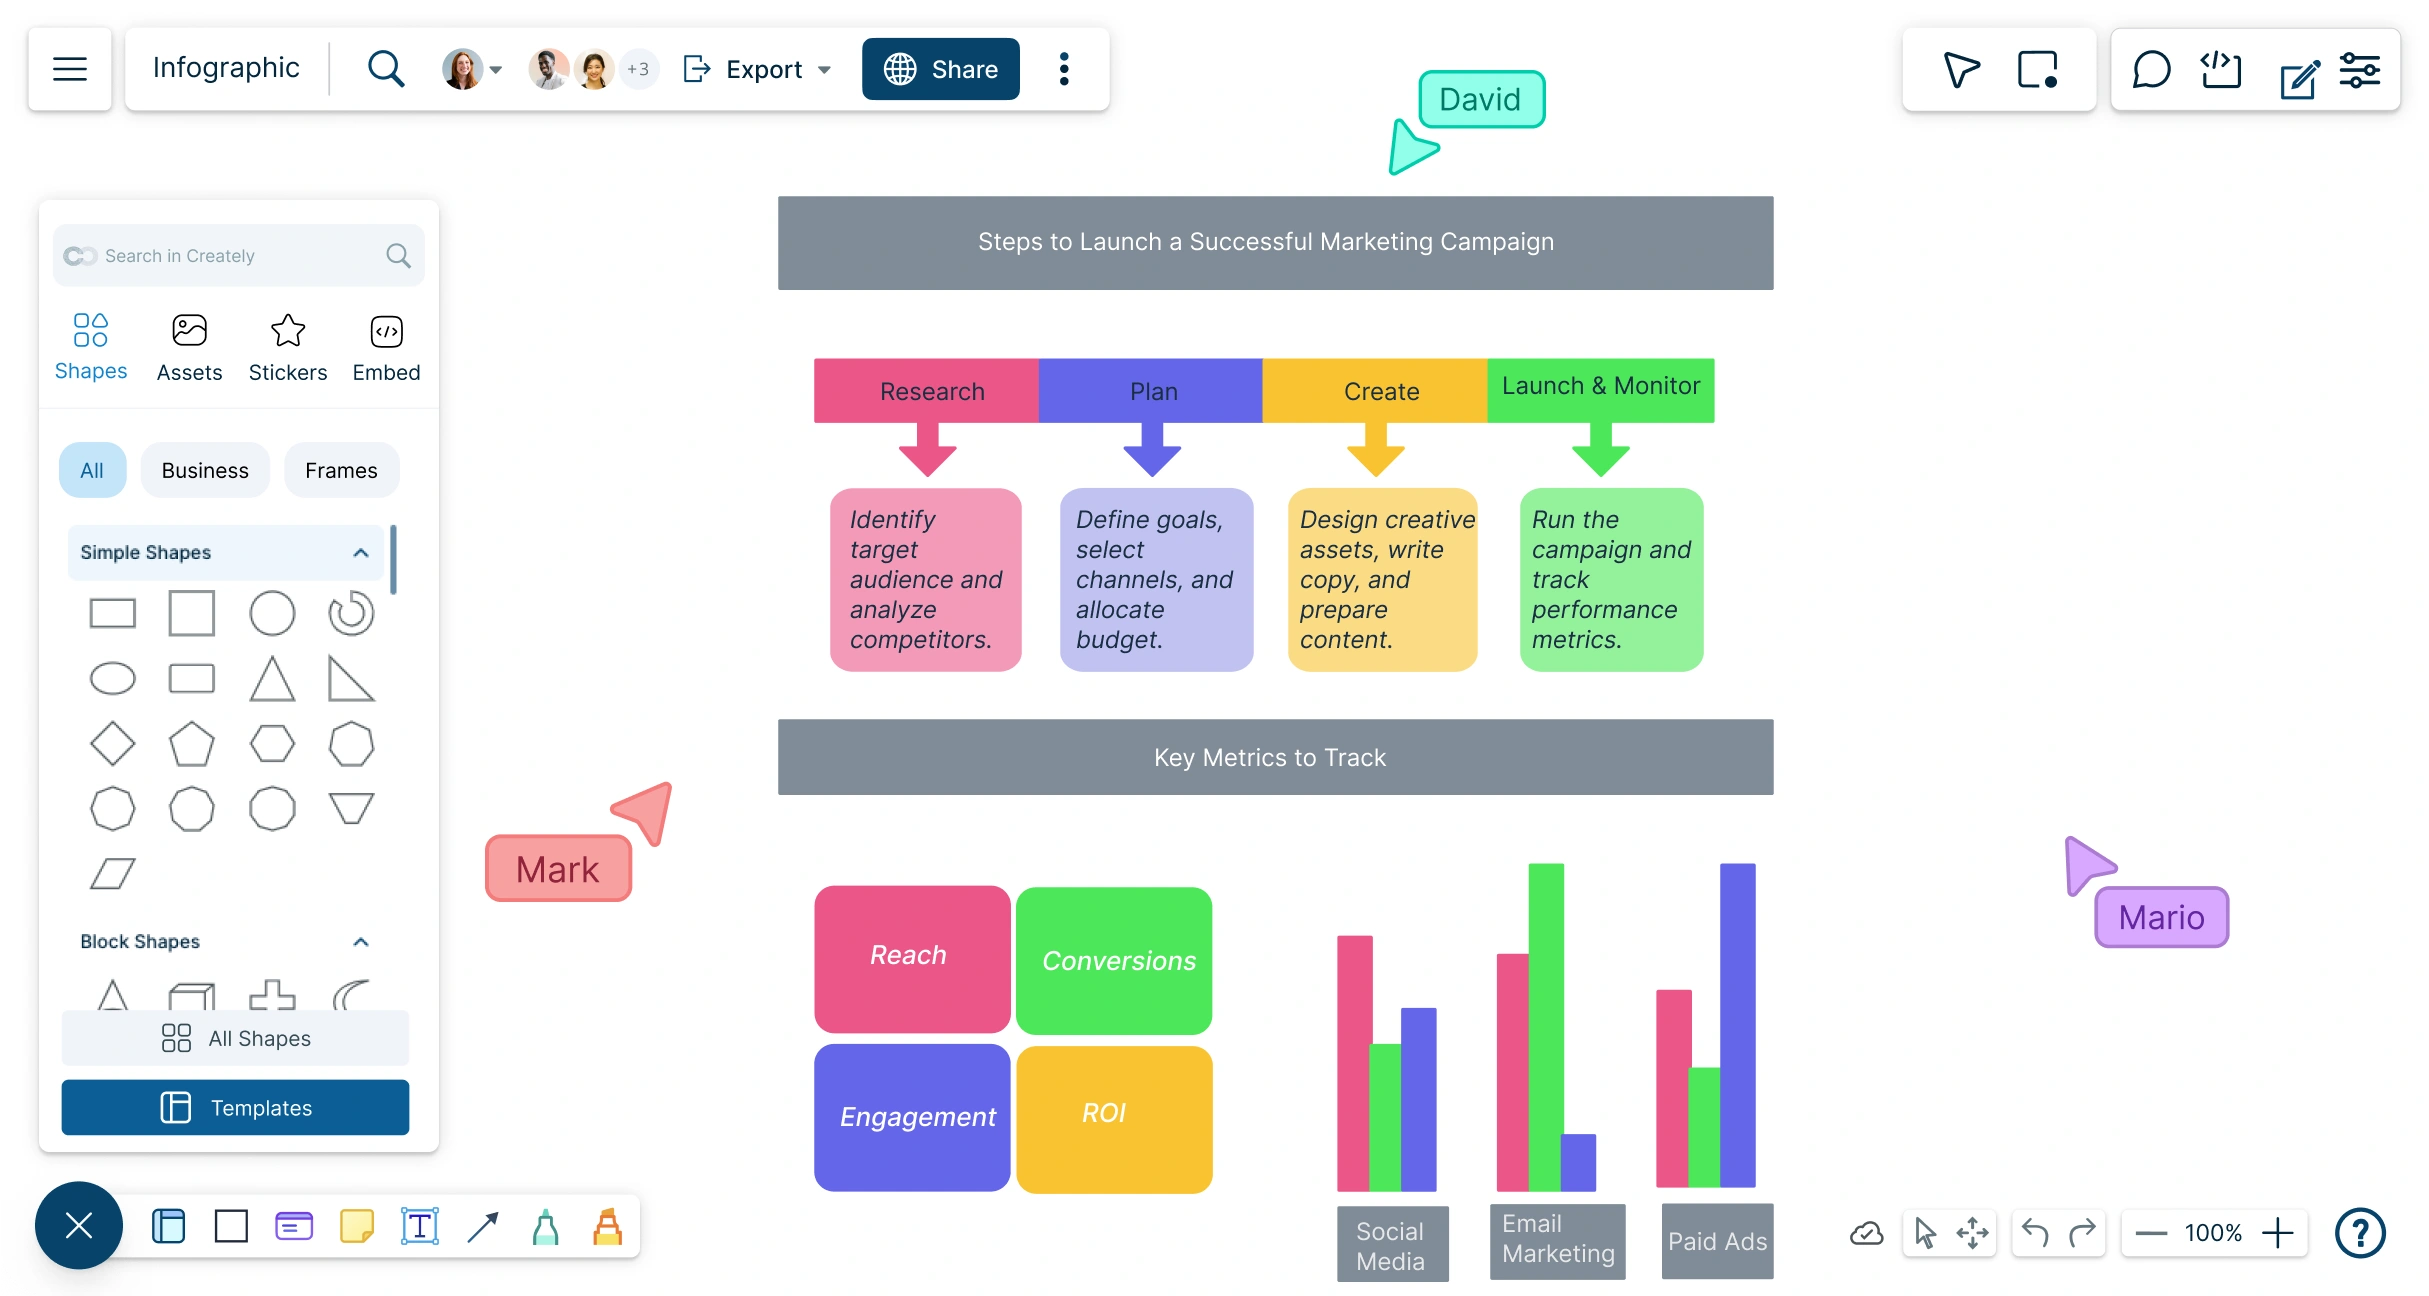
Generate interactive infographics with Creately’s easy-to-use infographic creator. Customize templates, collaborate with your team, and illustrate complex data or information.
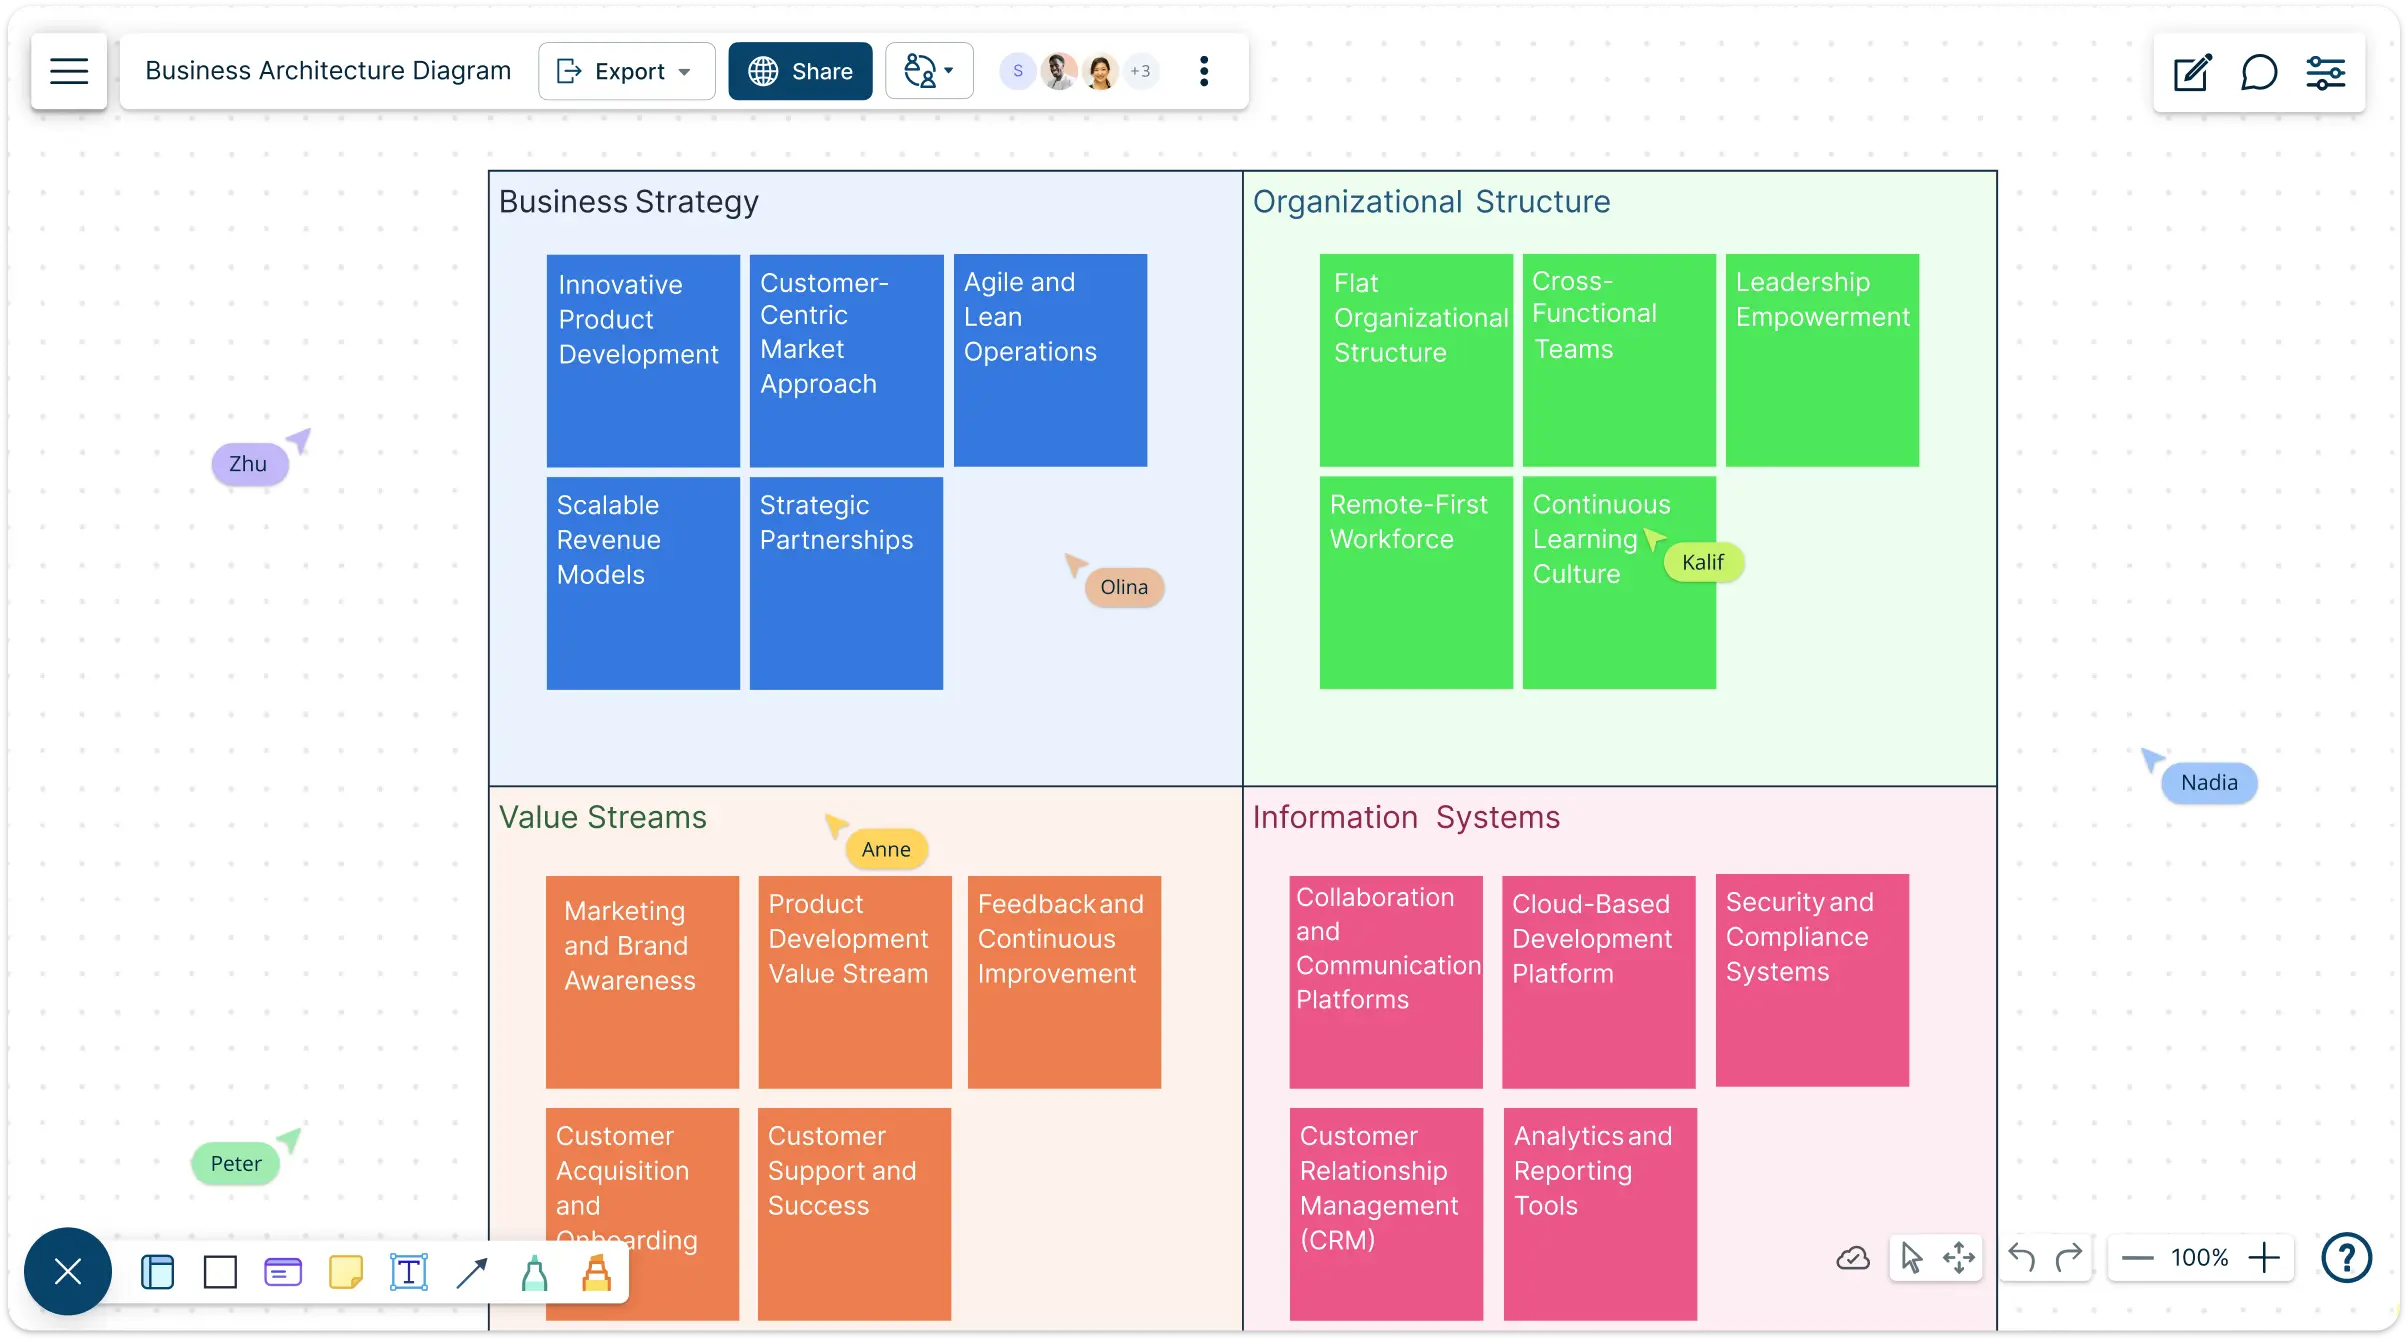
Create clear business architecture frameworks to visualize your corporate footprint, map strategy, processes, & systems while connecting business principles with execution.
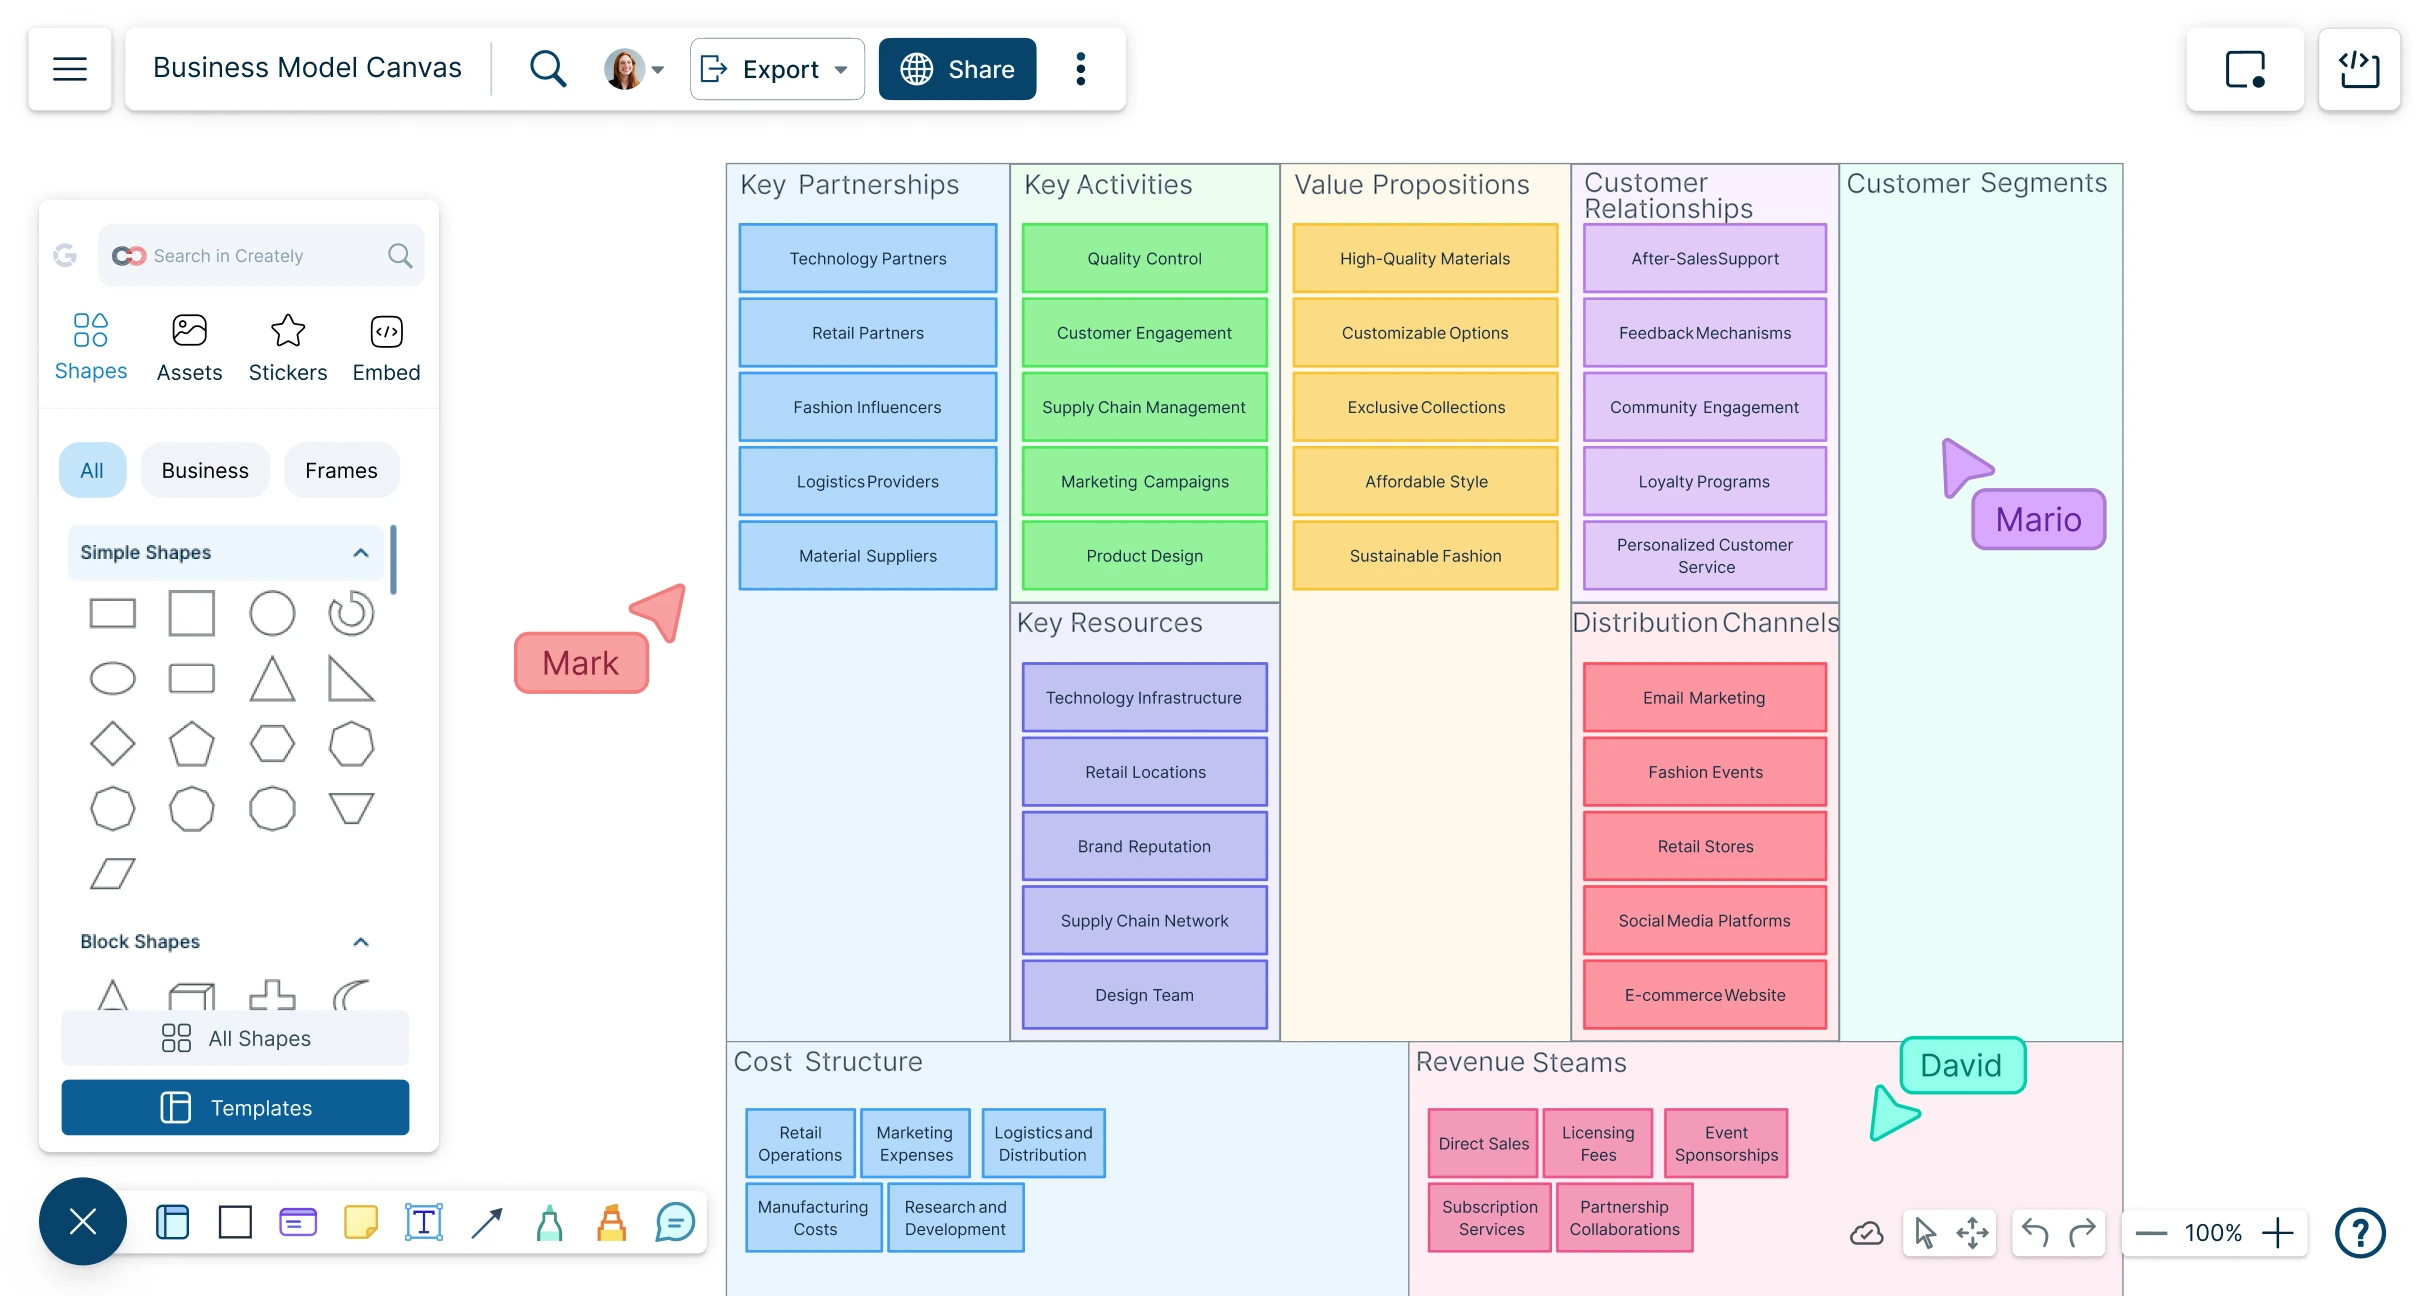
Easily transform business planning with Creately’s Business Model Canvas Generator — ideal for quickly creating, refining, and collaborating on business models.
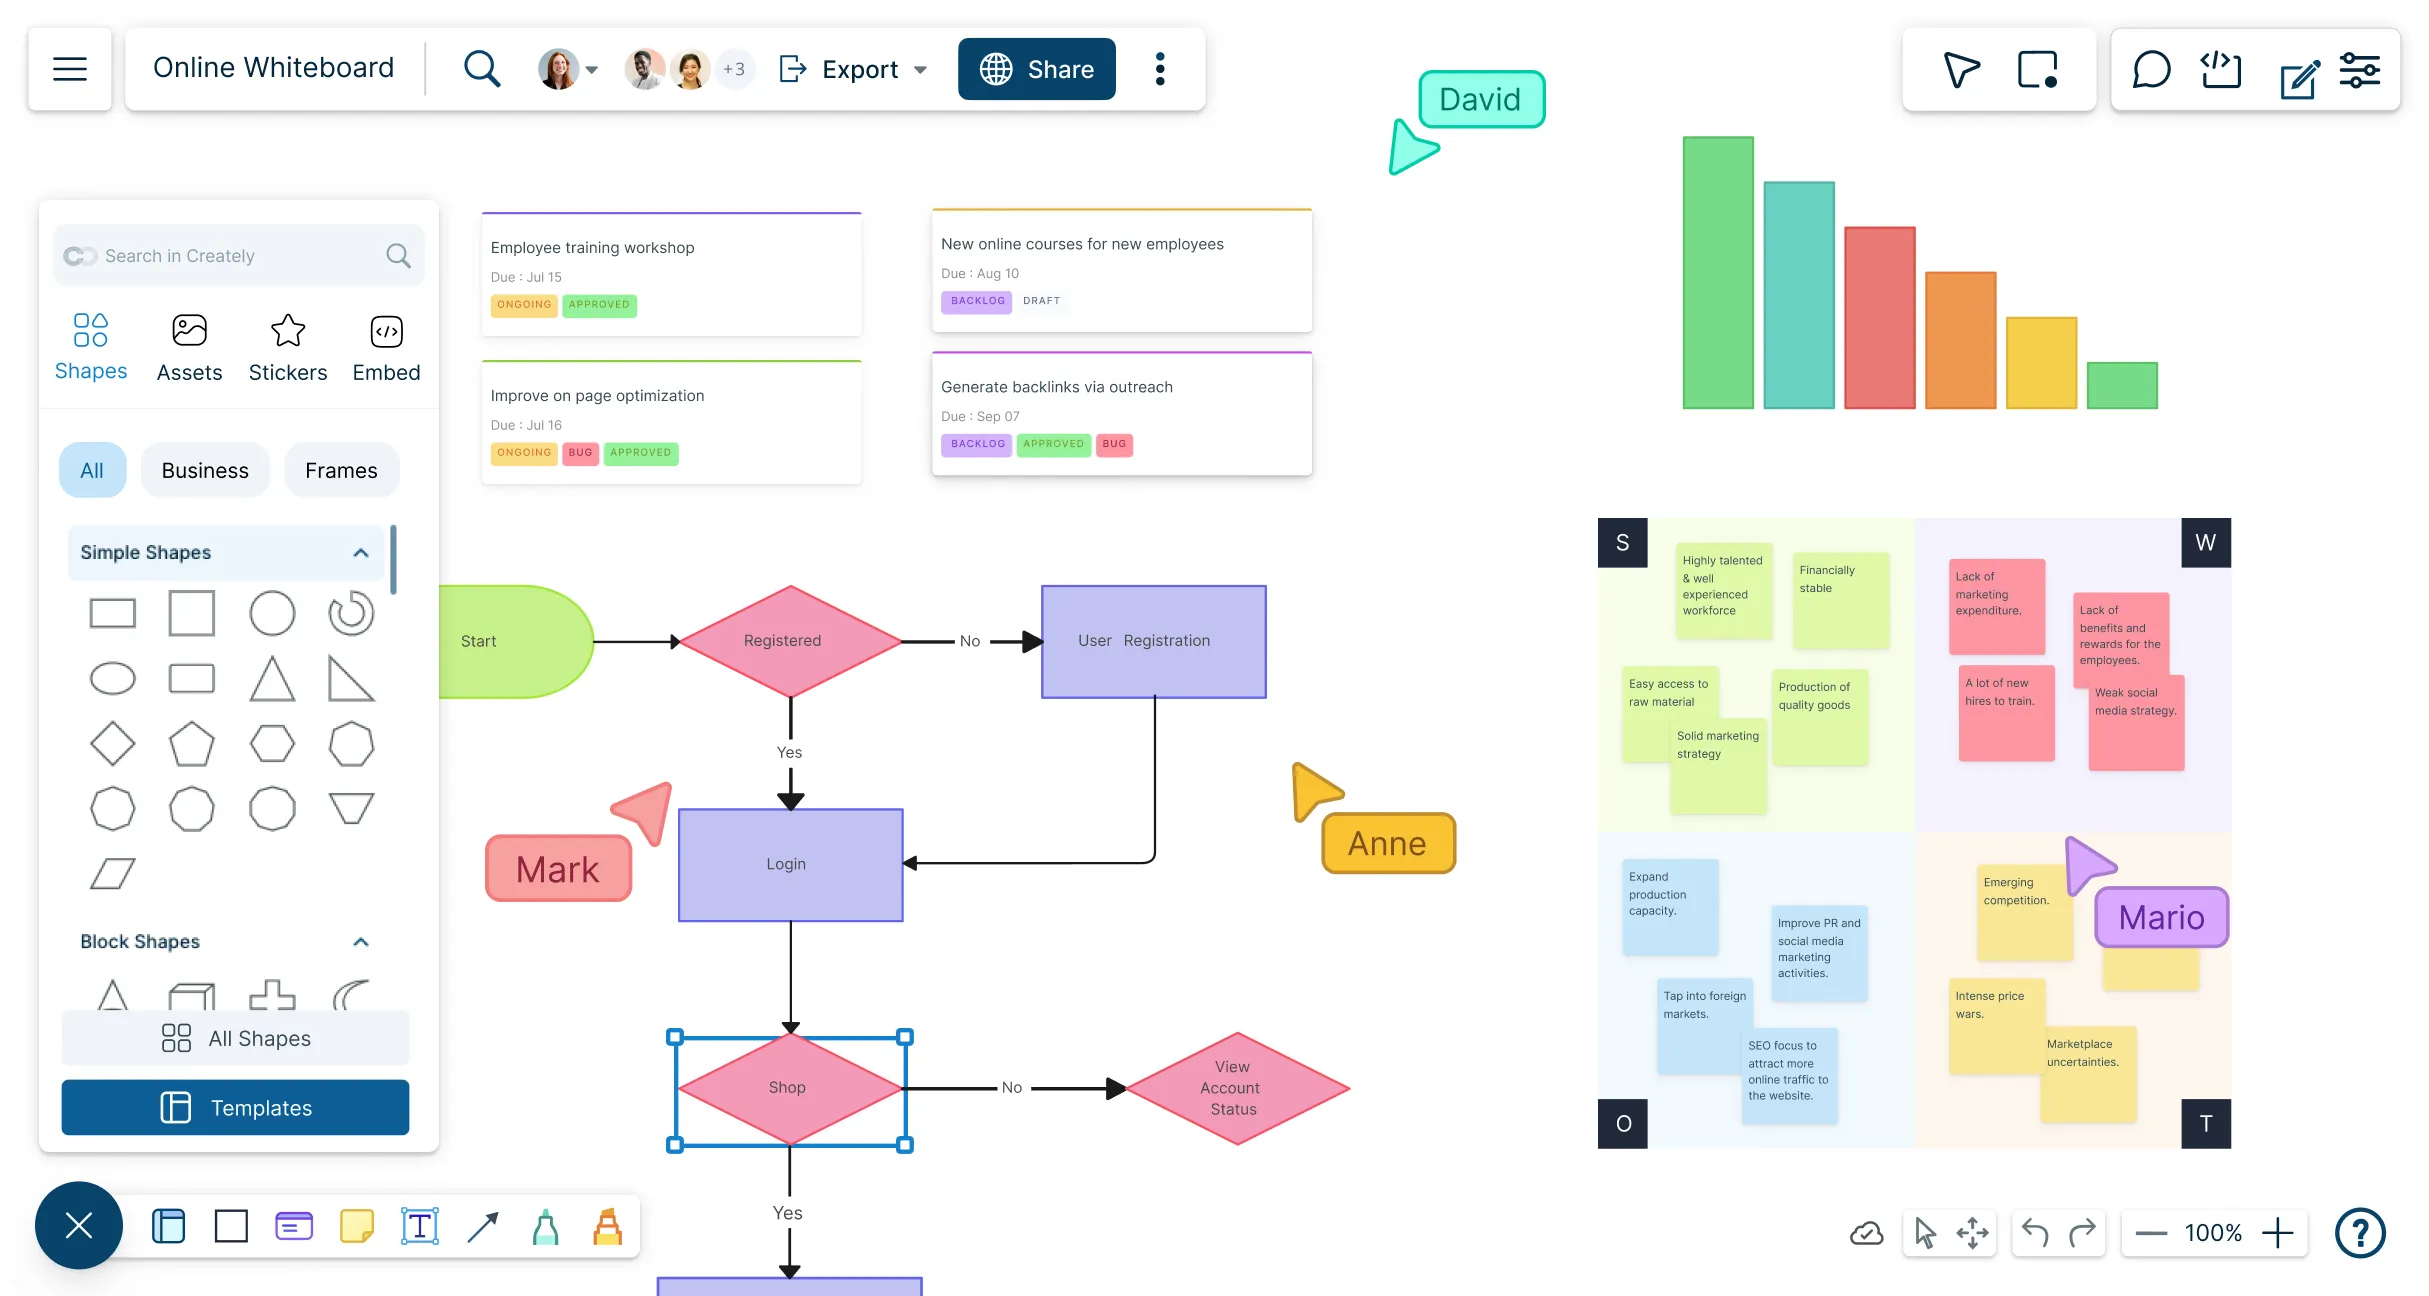
Brainstorm, plan, and visualize ideas together—whether in class, at work, or remotely—with our intuitive, unlimited-space virtual whiteboard.
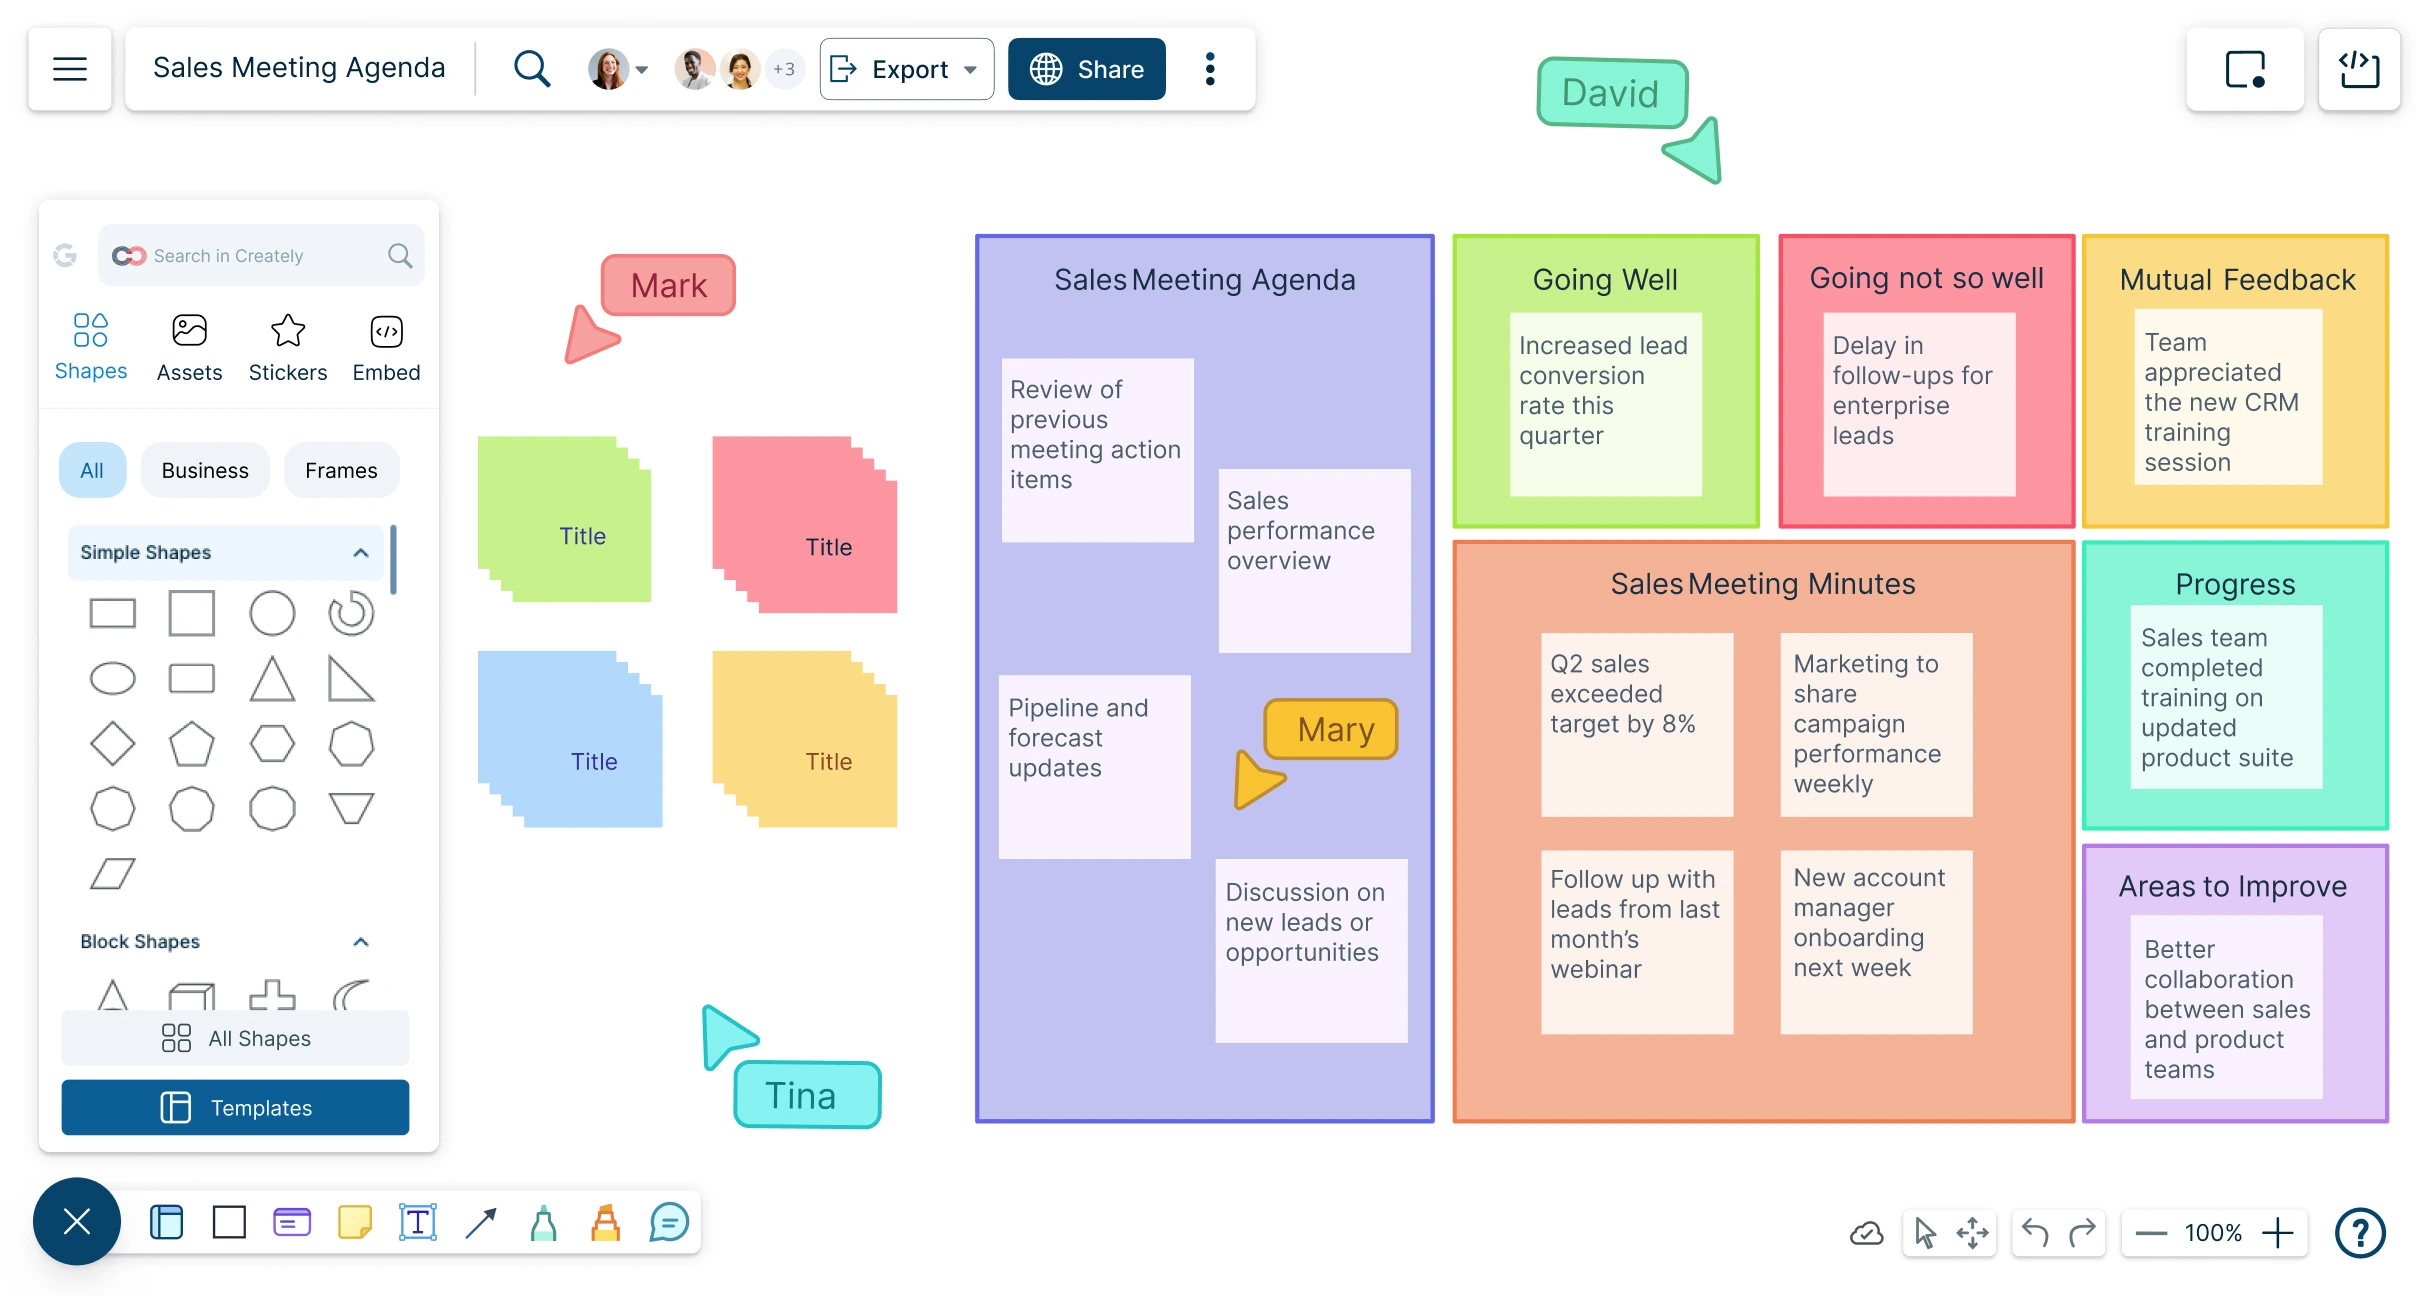
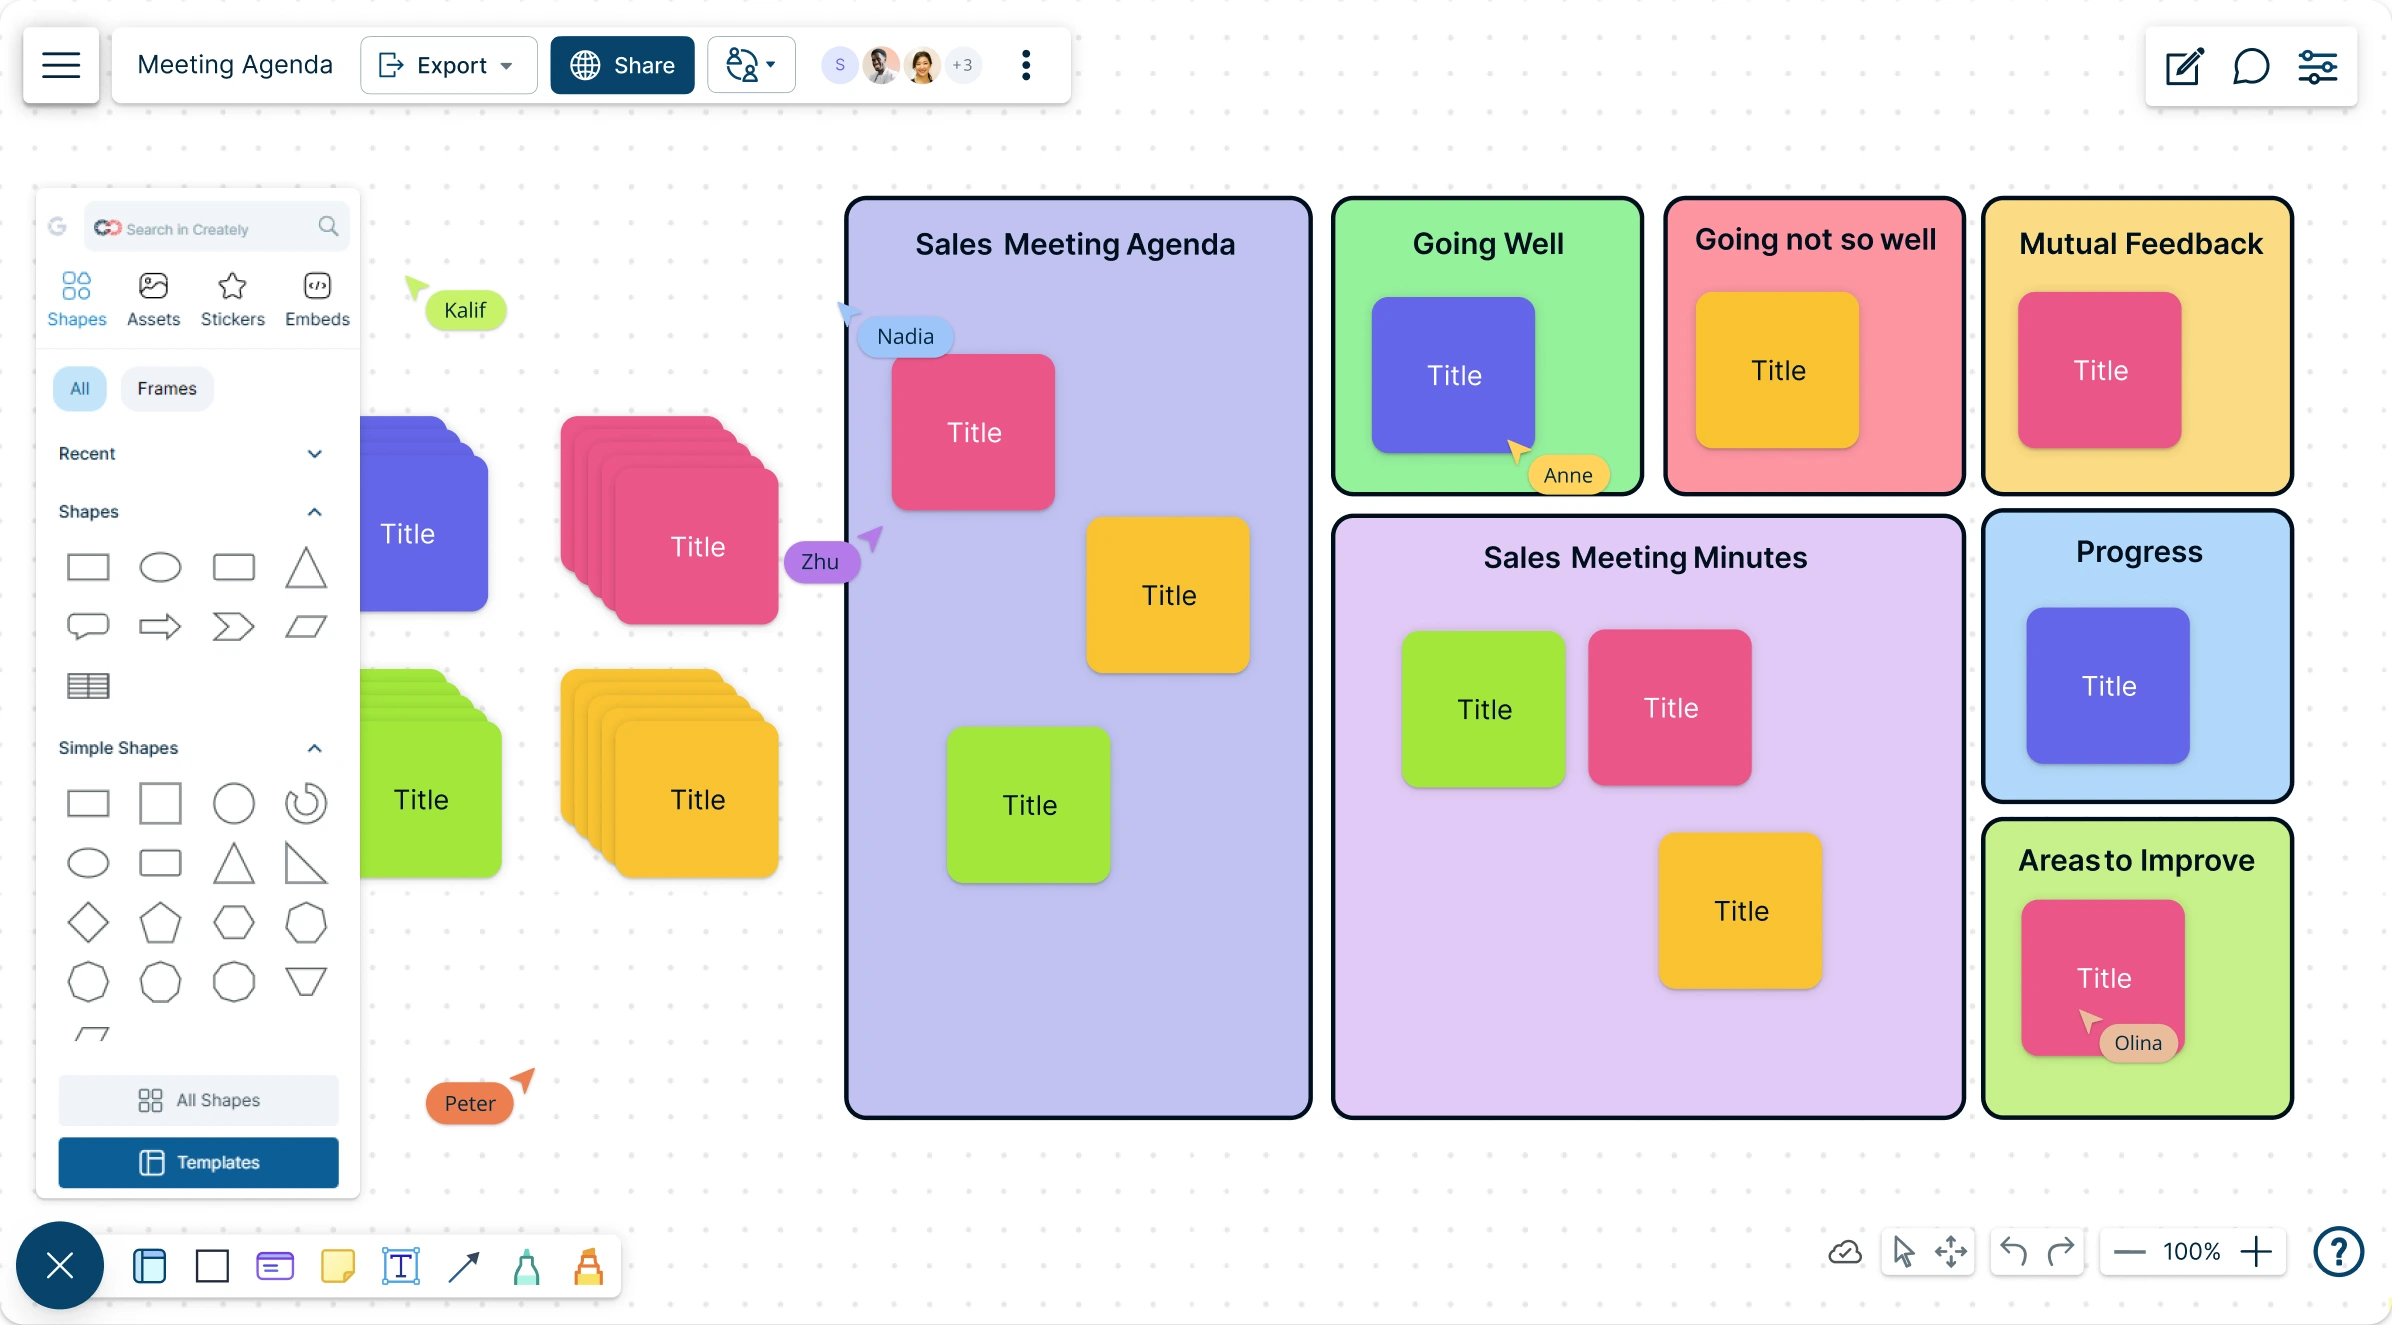
Plan with precision, stay on track, and turn discussions into actionable outcomes using customizable, collaborative meeting agendas.
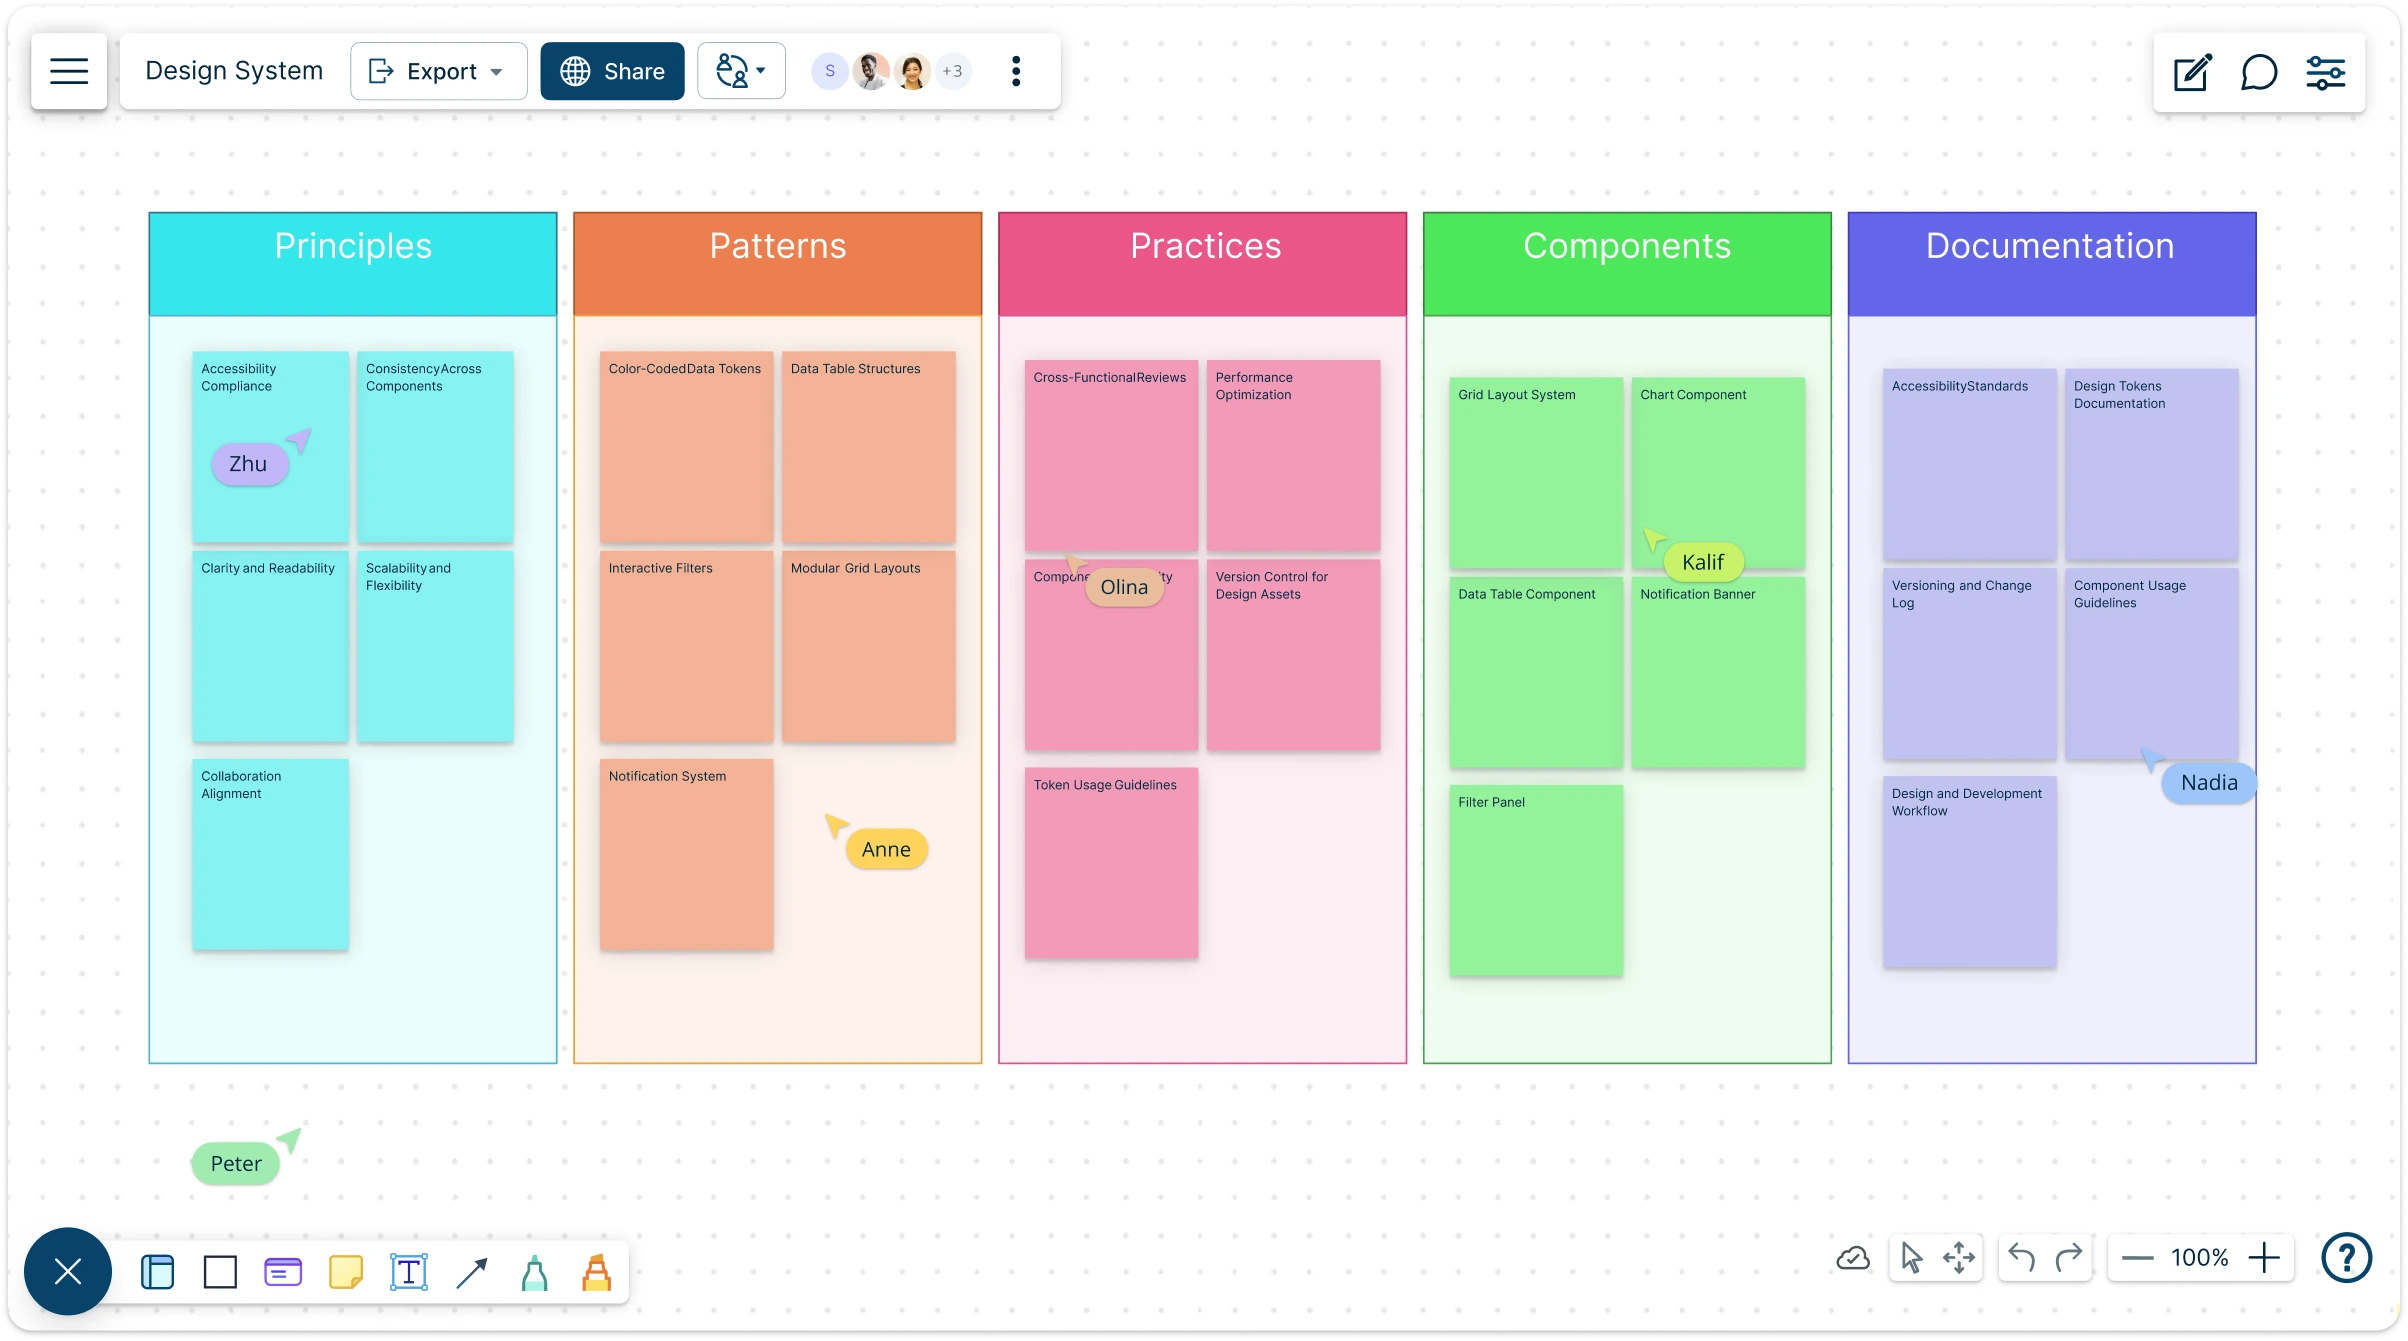
Build your own design system template to unify brand identity, streamline UI/UX, and accelerate workflows. Explore ready-made design system examples, libraries, and tools to guide your team from concept to launch.
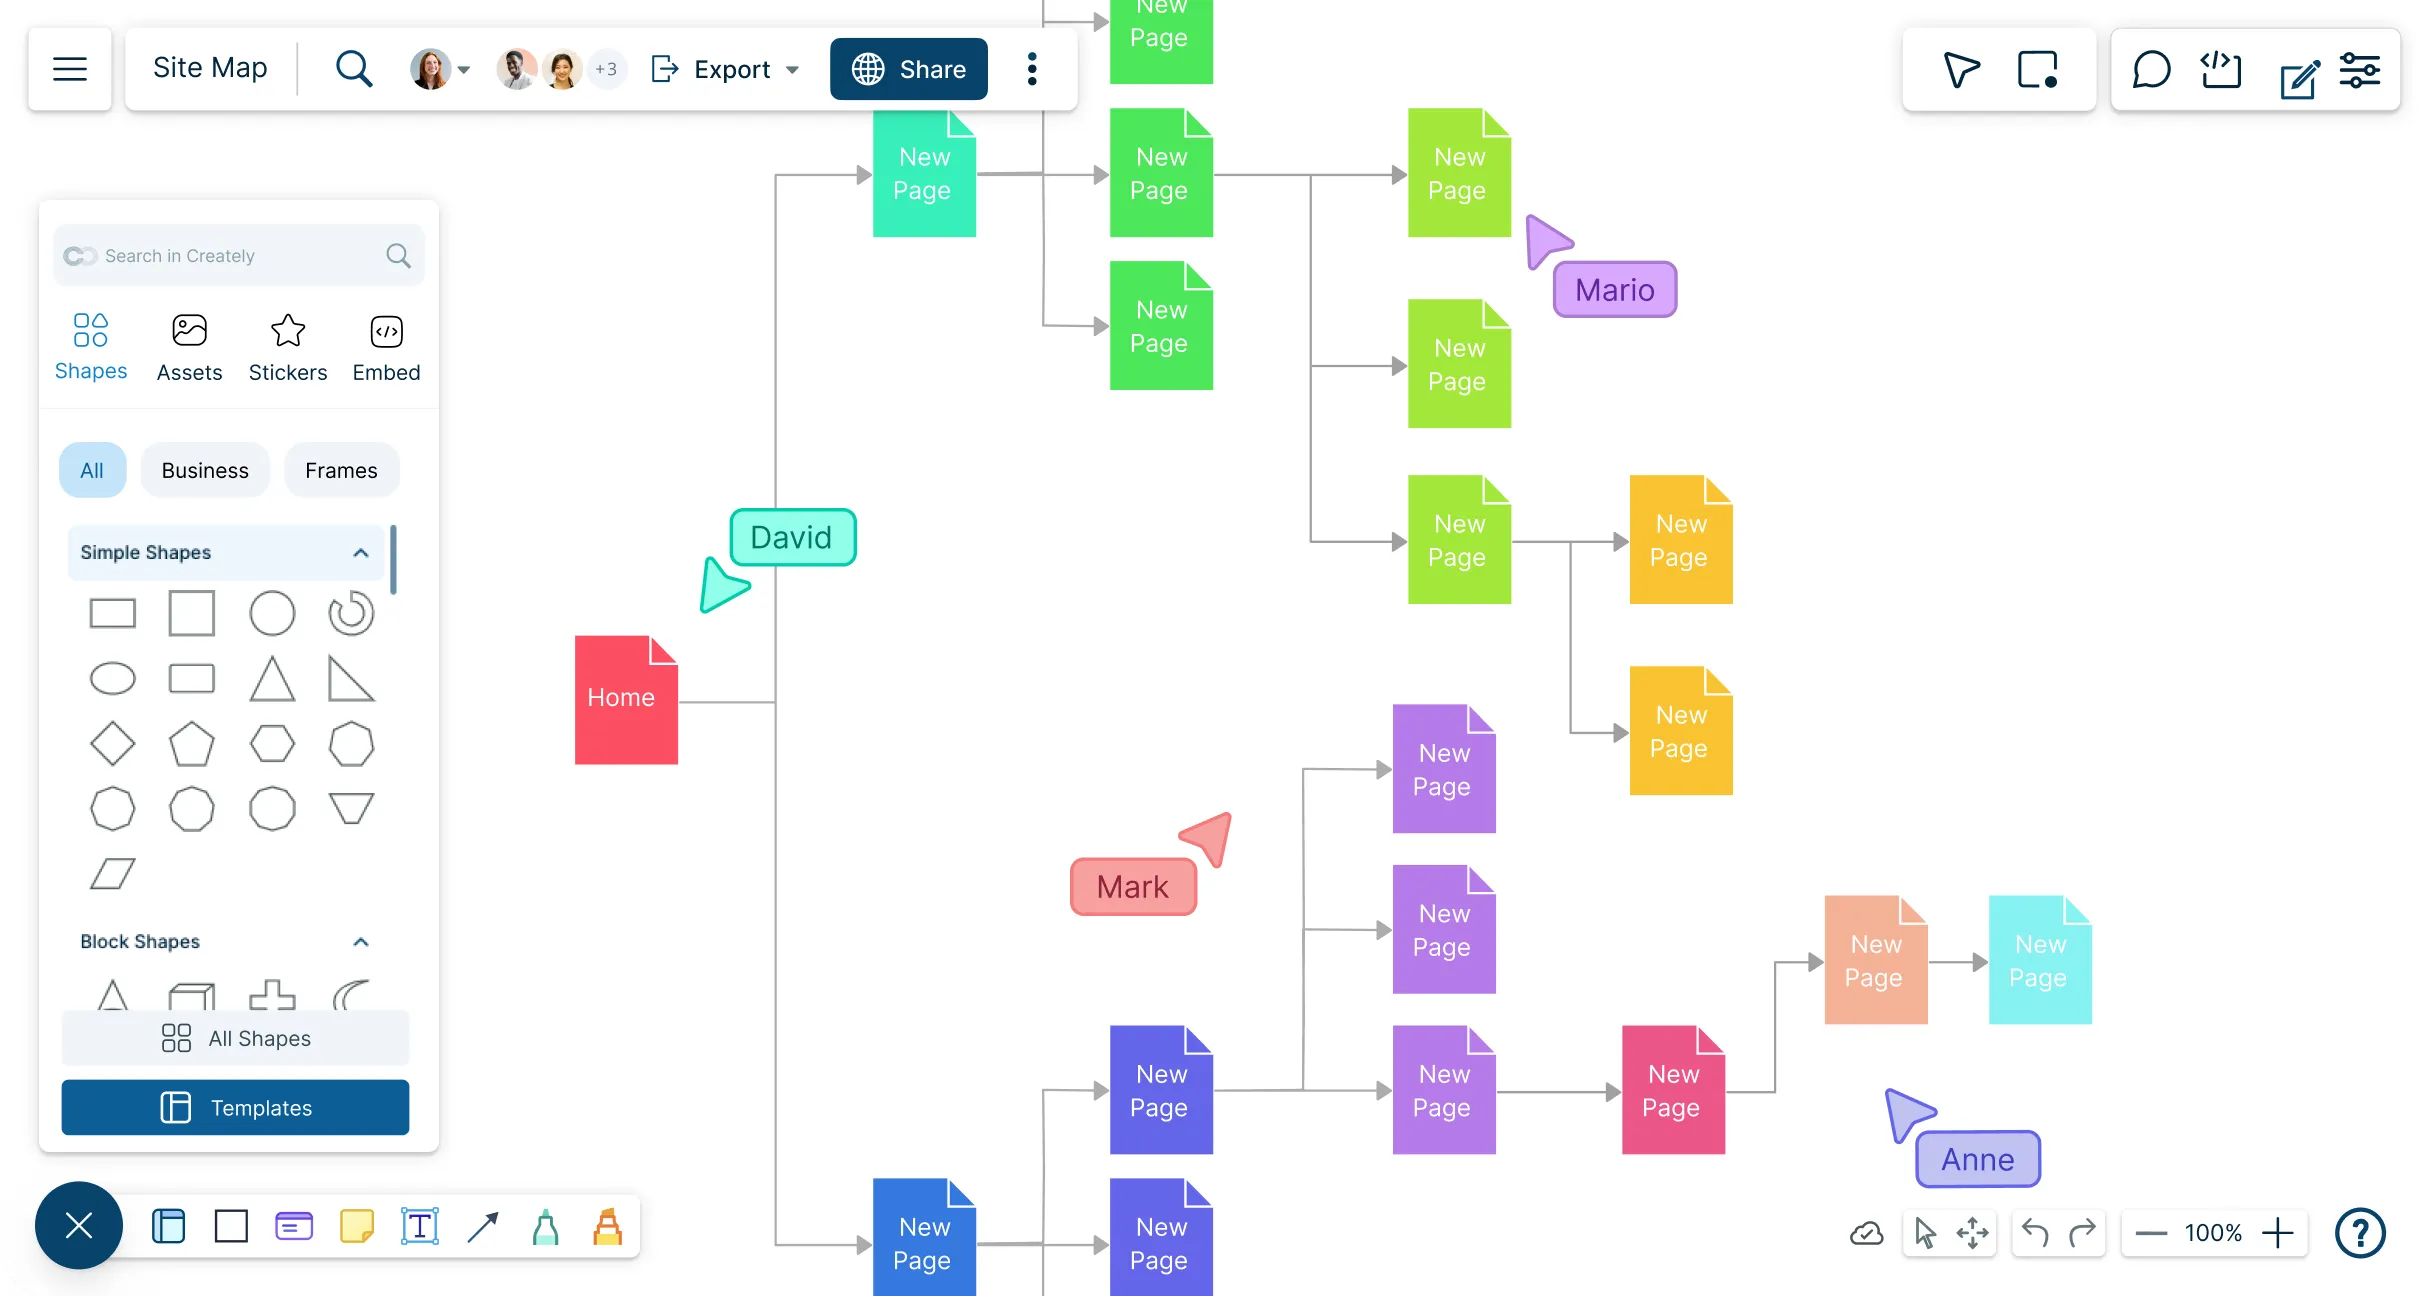
Sketch out your site’s structure in minutes — collaborate in real time, design with drag-and-drop, and make your information architecture crystal clear for users, designers, and stakeholders alike.
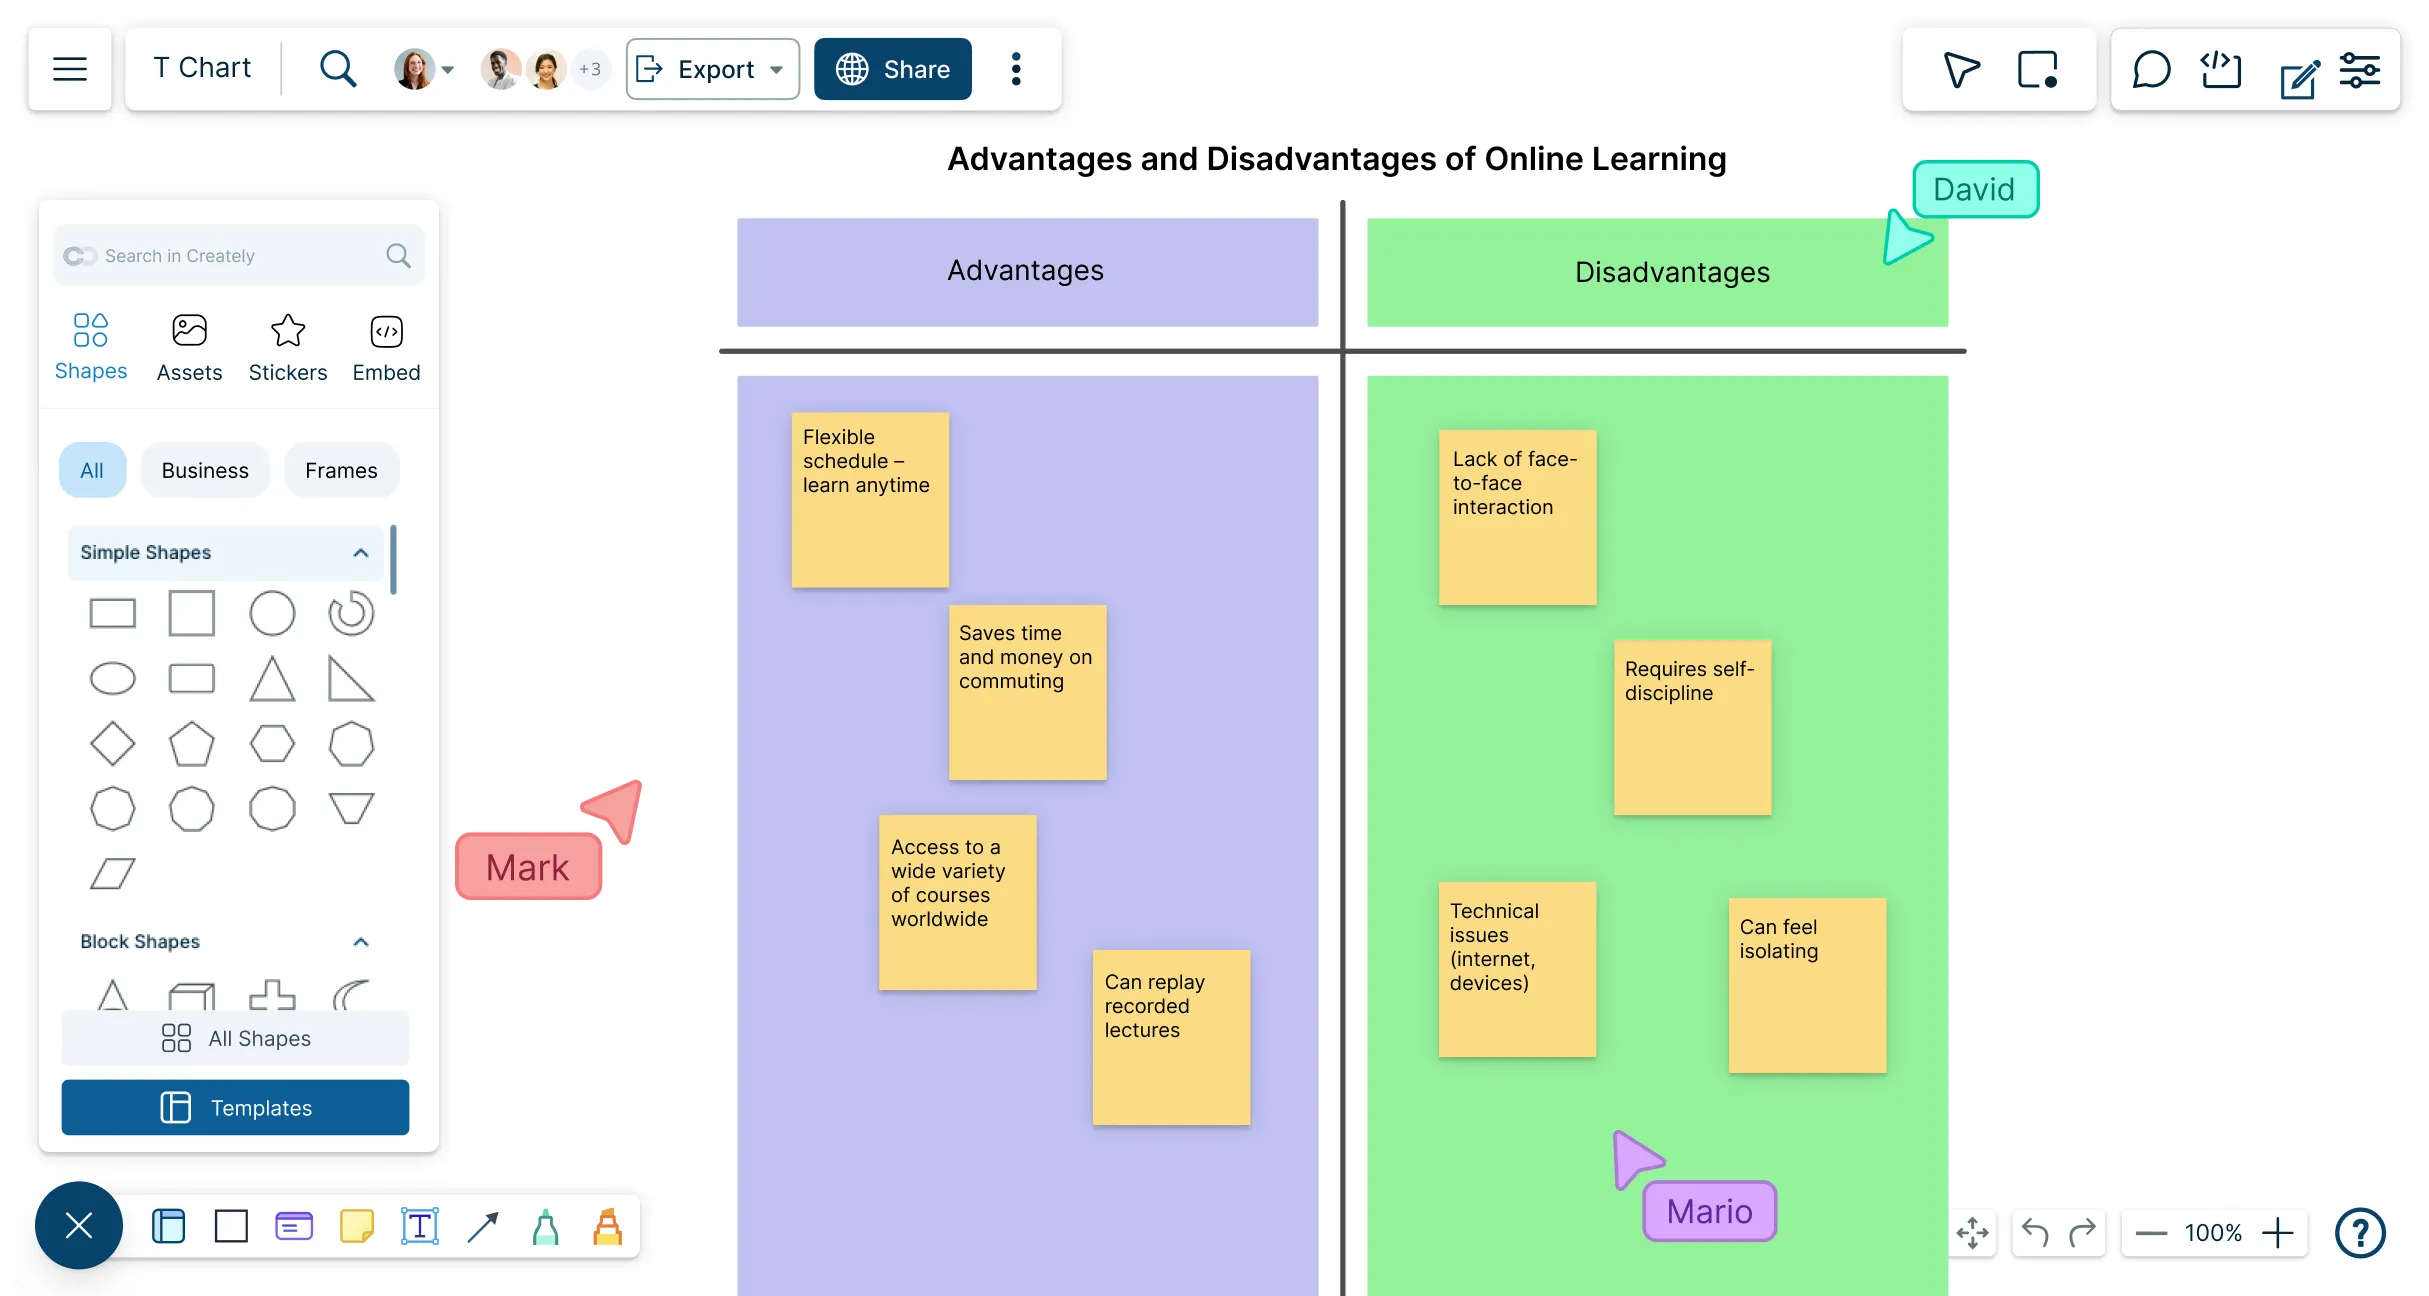
Compare and contrast opposing views, including facts vs. opinions, advantages vs. disadvantages or strengths vs. weaknesses, with our free intuitive T chart creator.
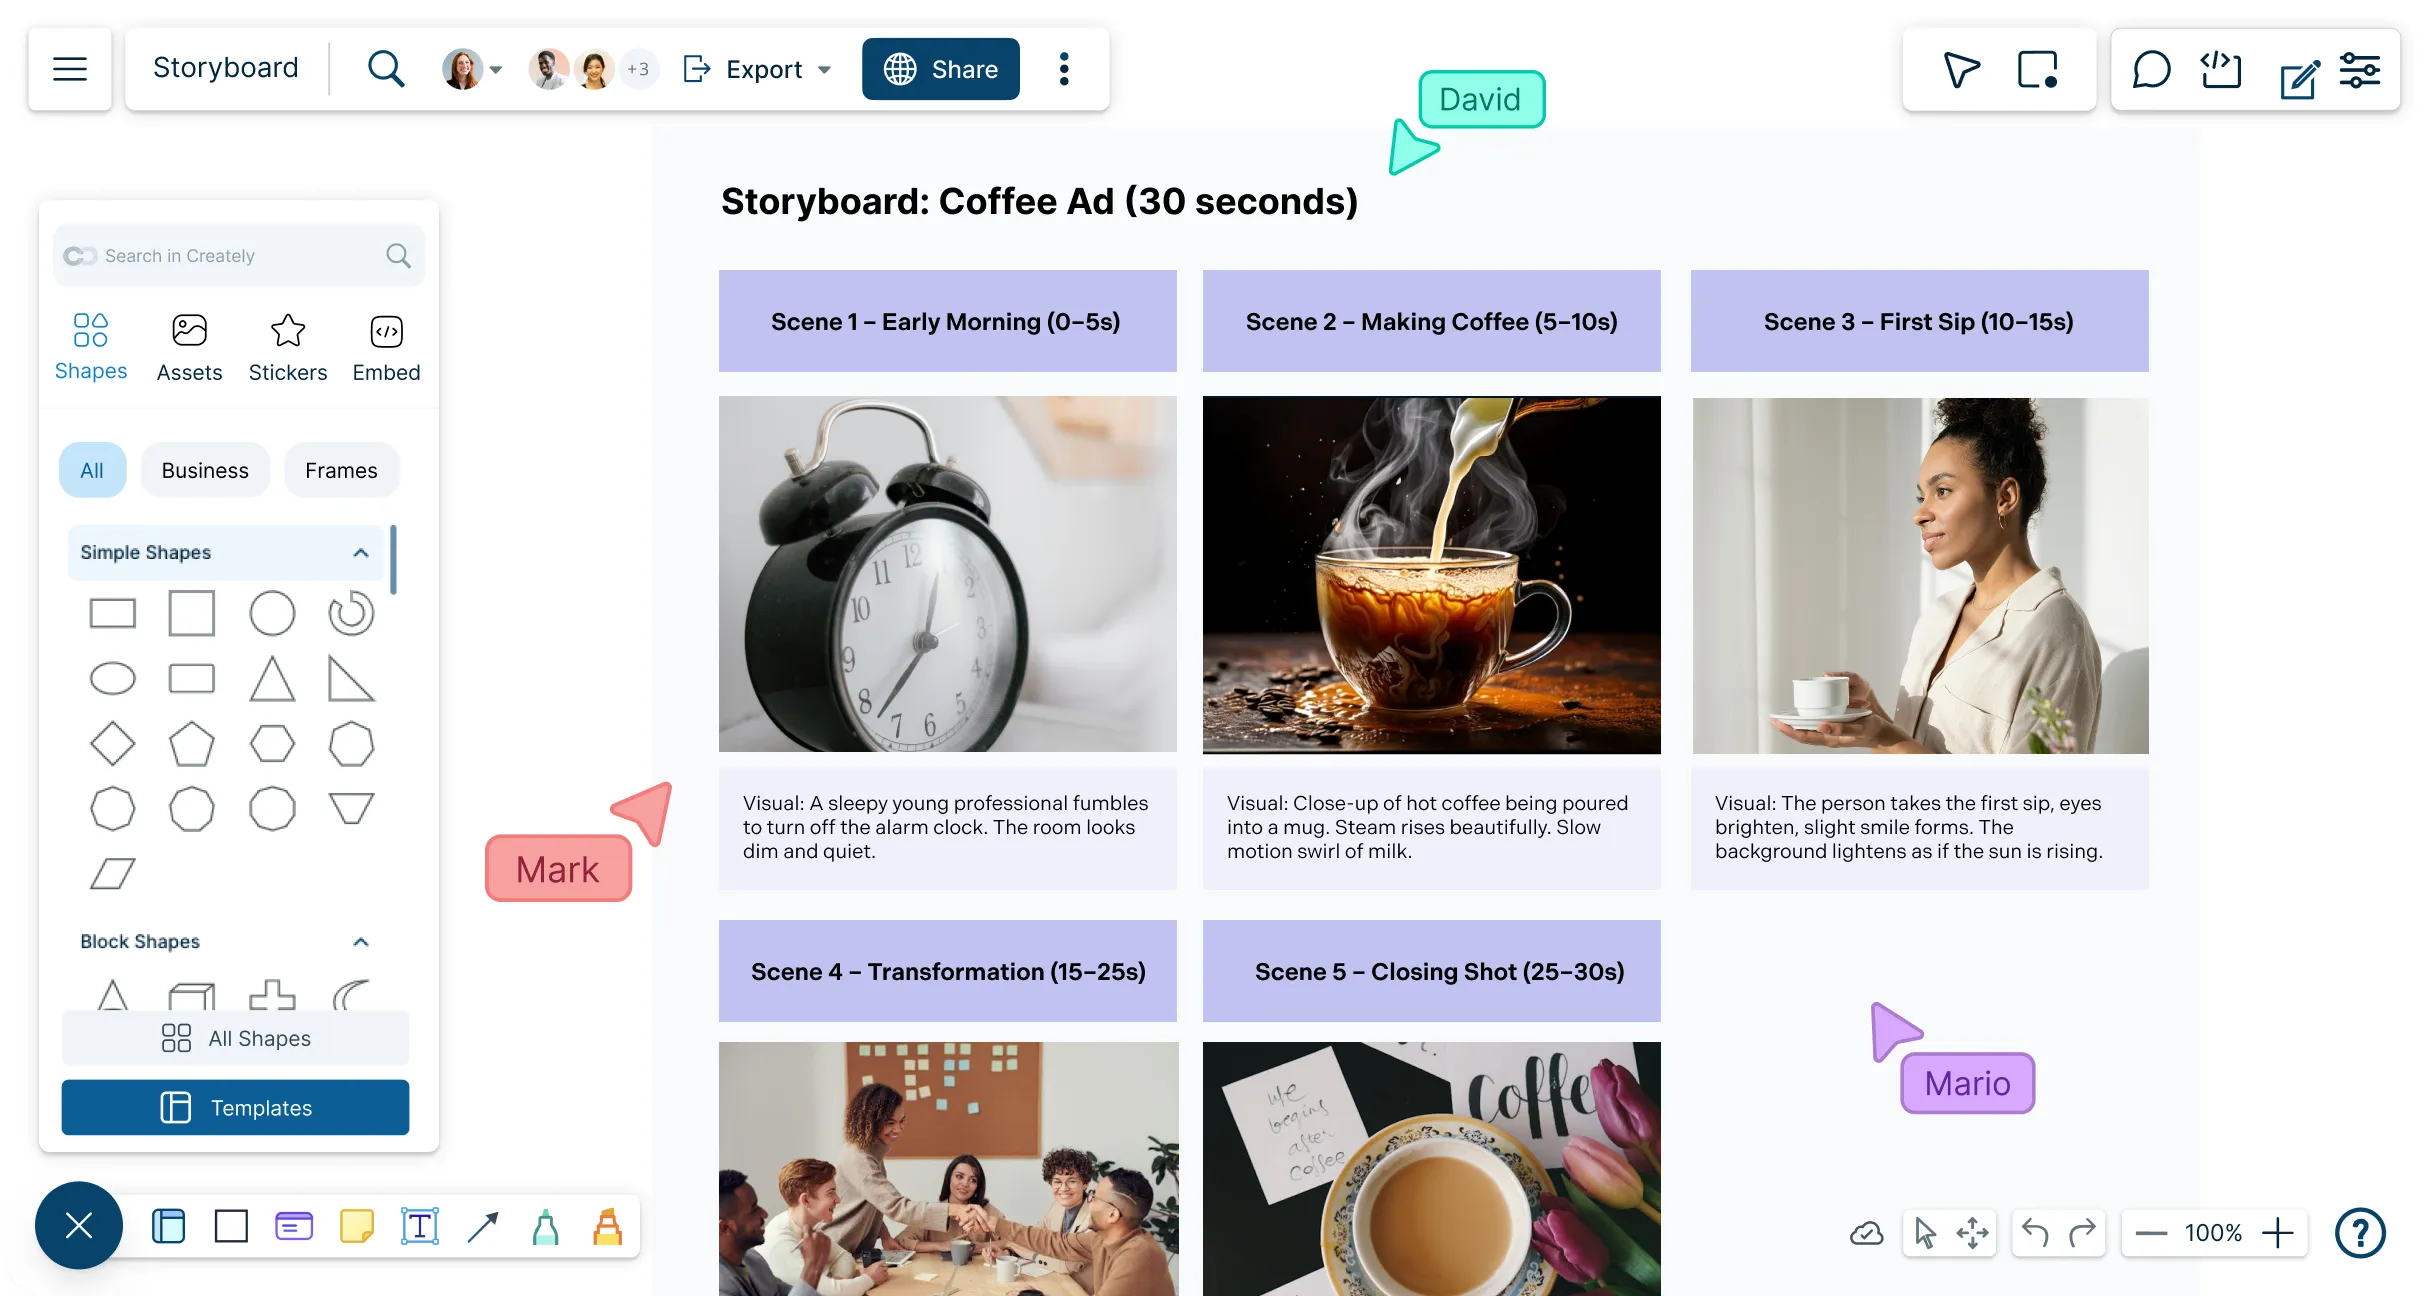
Plan, design, and bring your video ideas to life with Creately’s intuitive storyboard maker. Collaborate in real time to create storyboards that clearly communicate your vision.
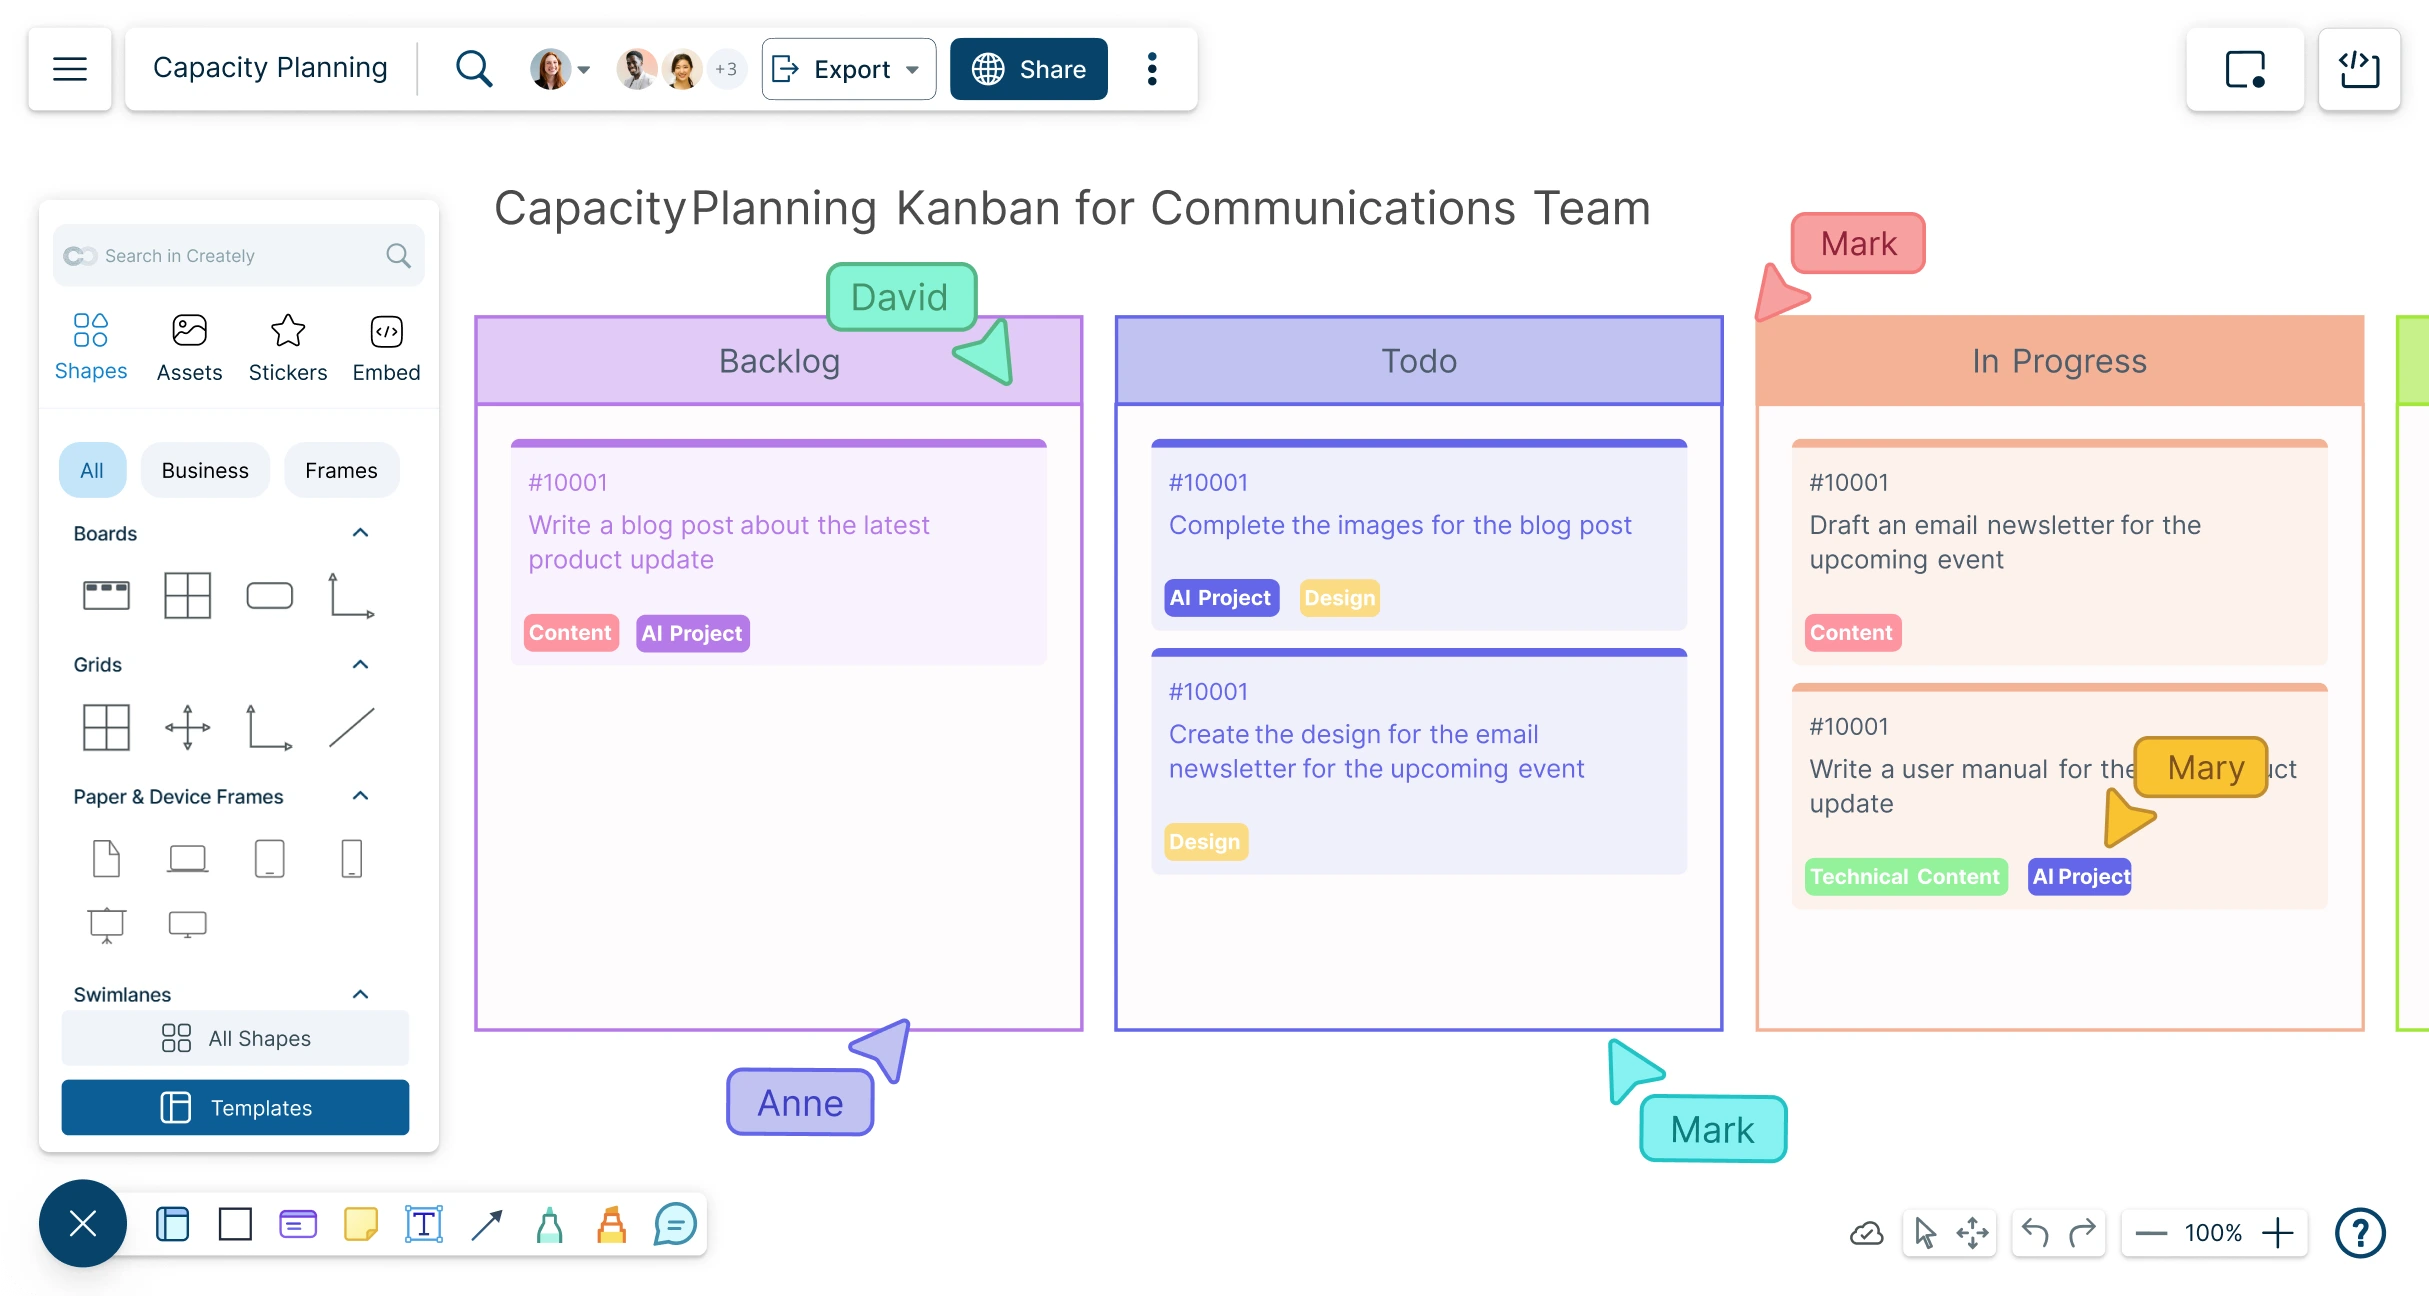
An online Kanban board to streamline projects, track task progress, and collaborate in real-time. Plan, prioritize, and get work done, visually and efficiently.
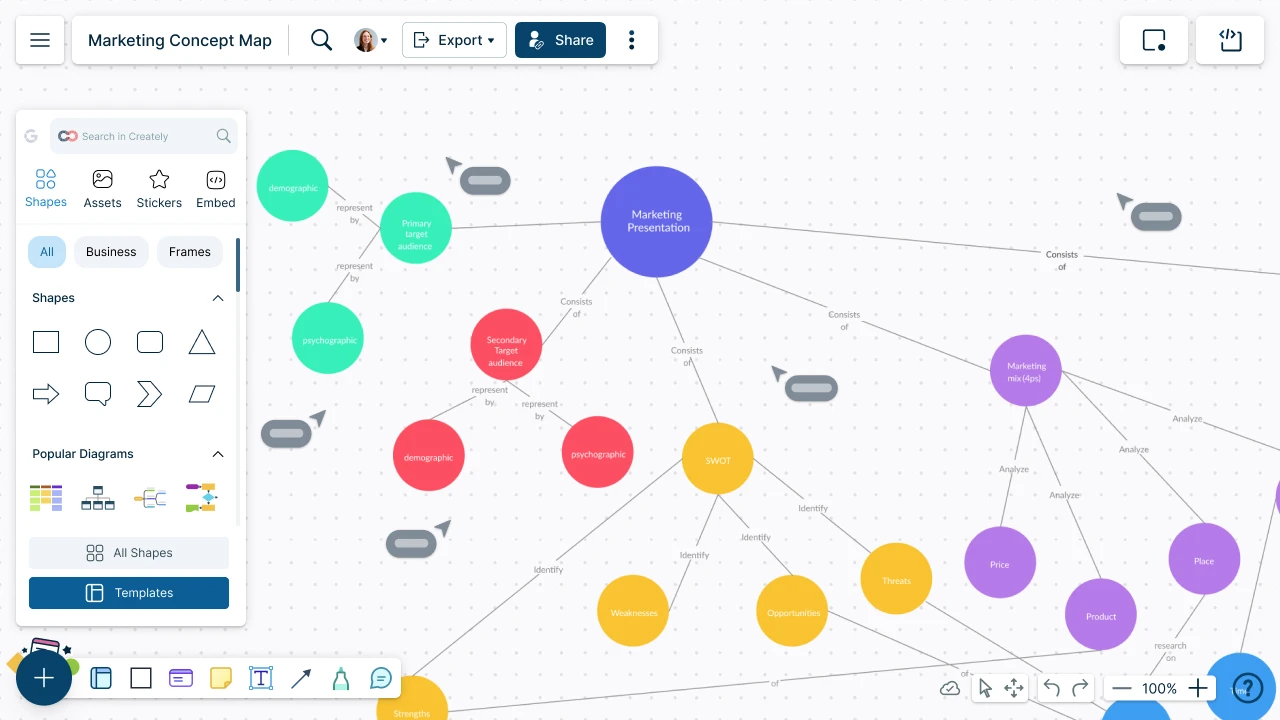
Organize ideas visually and map out relationships between concepts with an intuitive online concept map. Simplify complex information and enhance learning with customizable concept map designs.
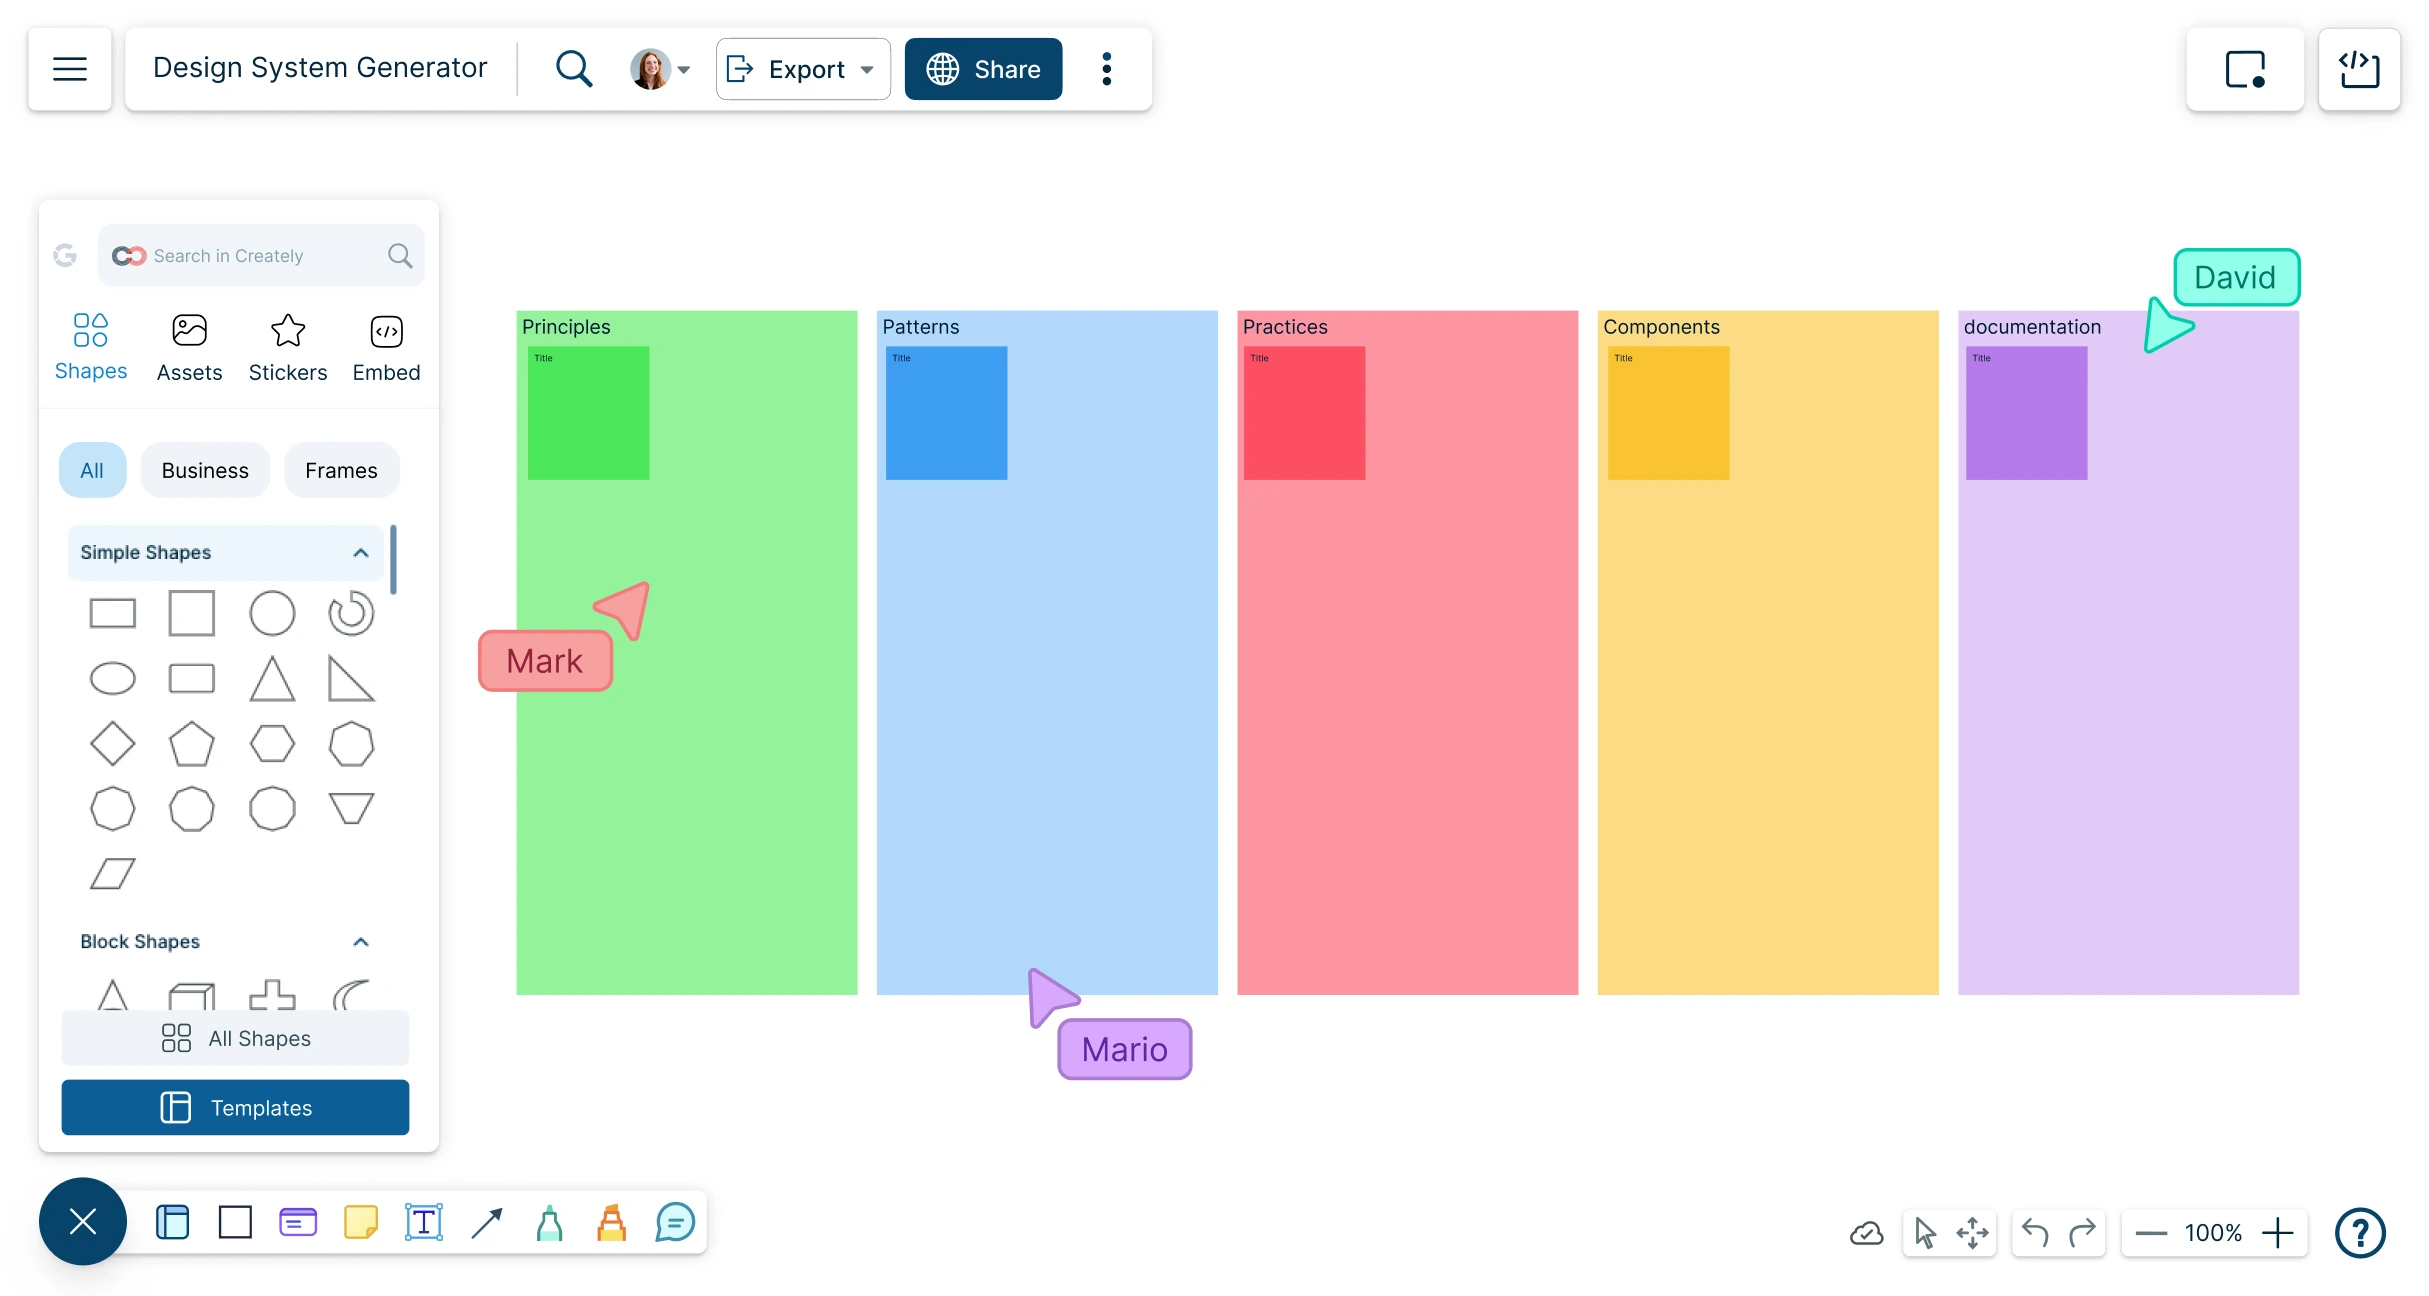
Powerful visual design system generator to create, manage, and scale design tokens, UI components, and documentation—all in one responsive collaborative workspace.
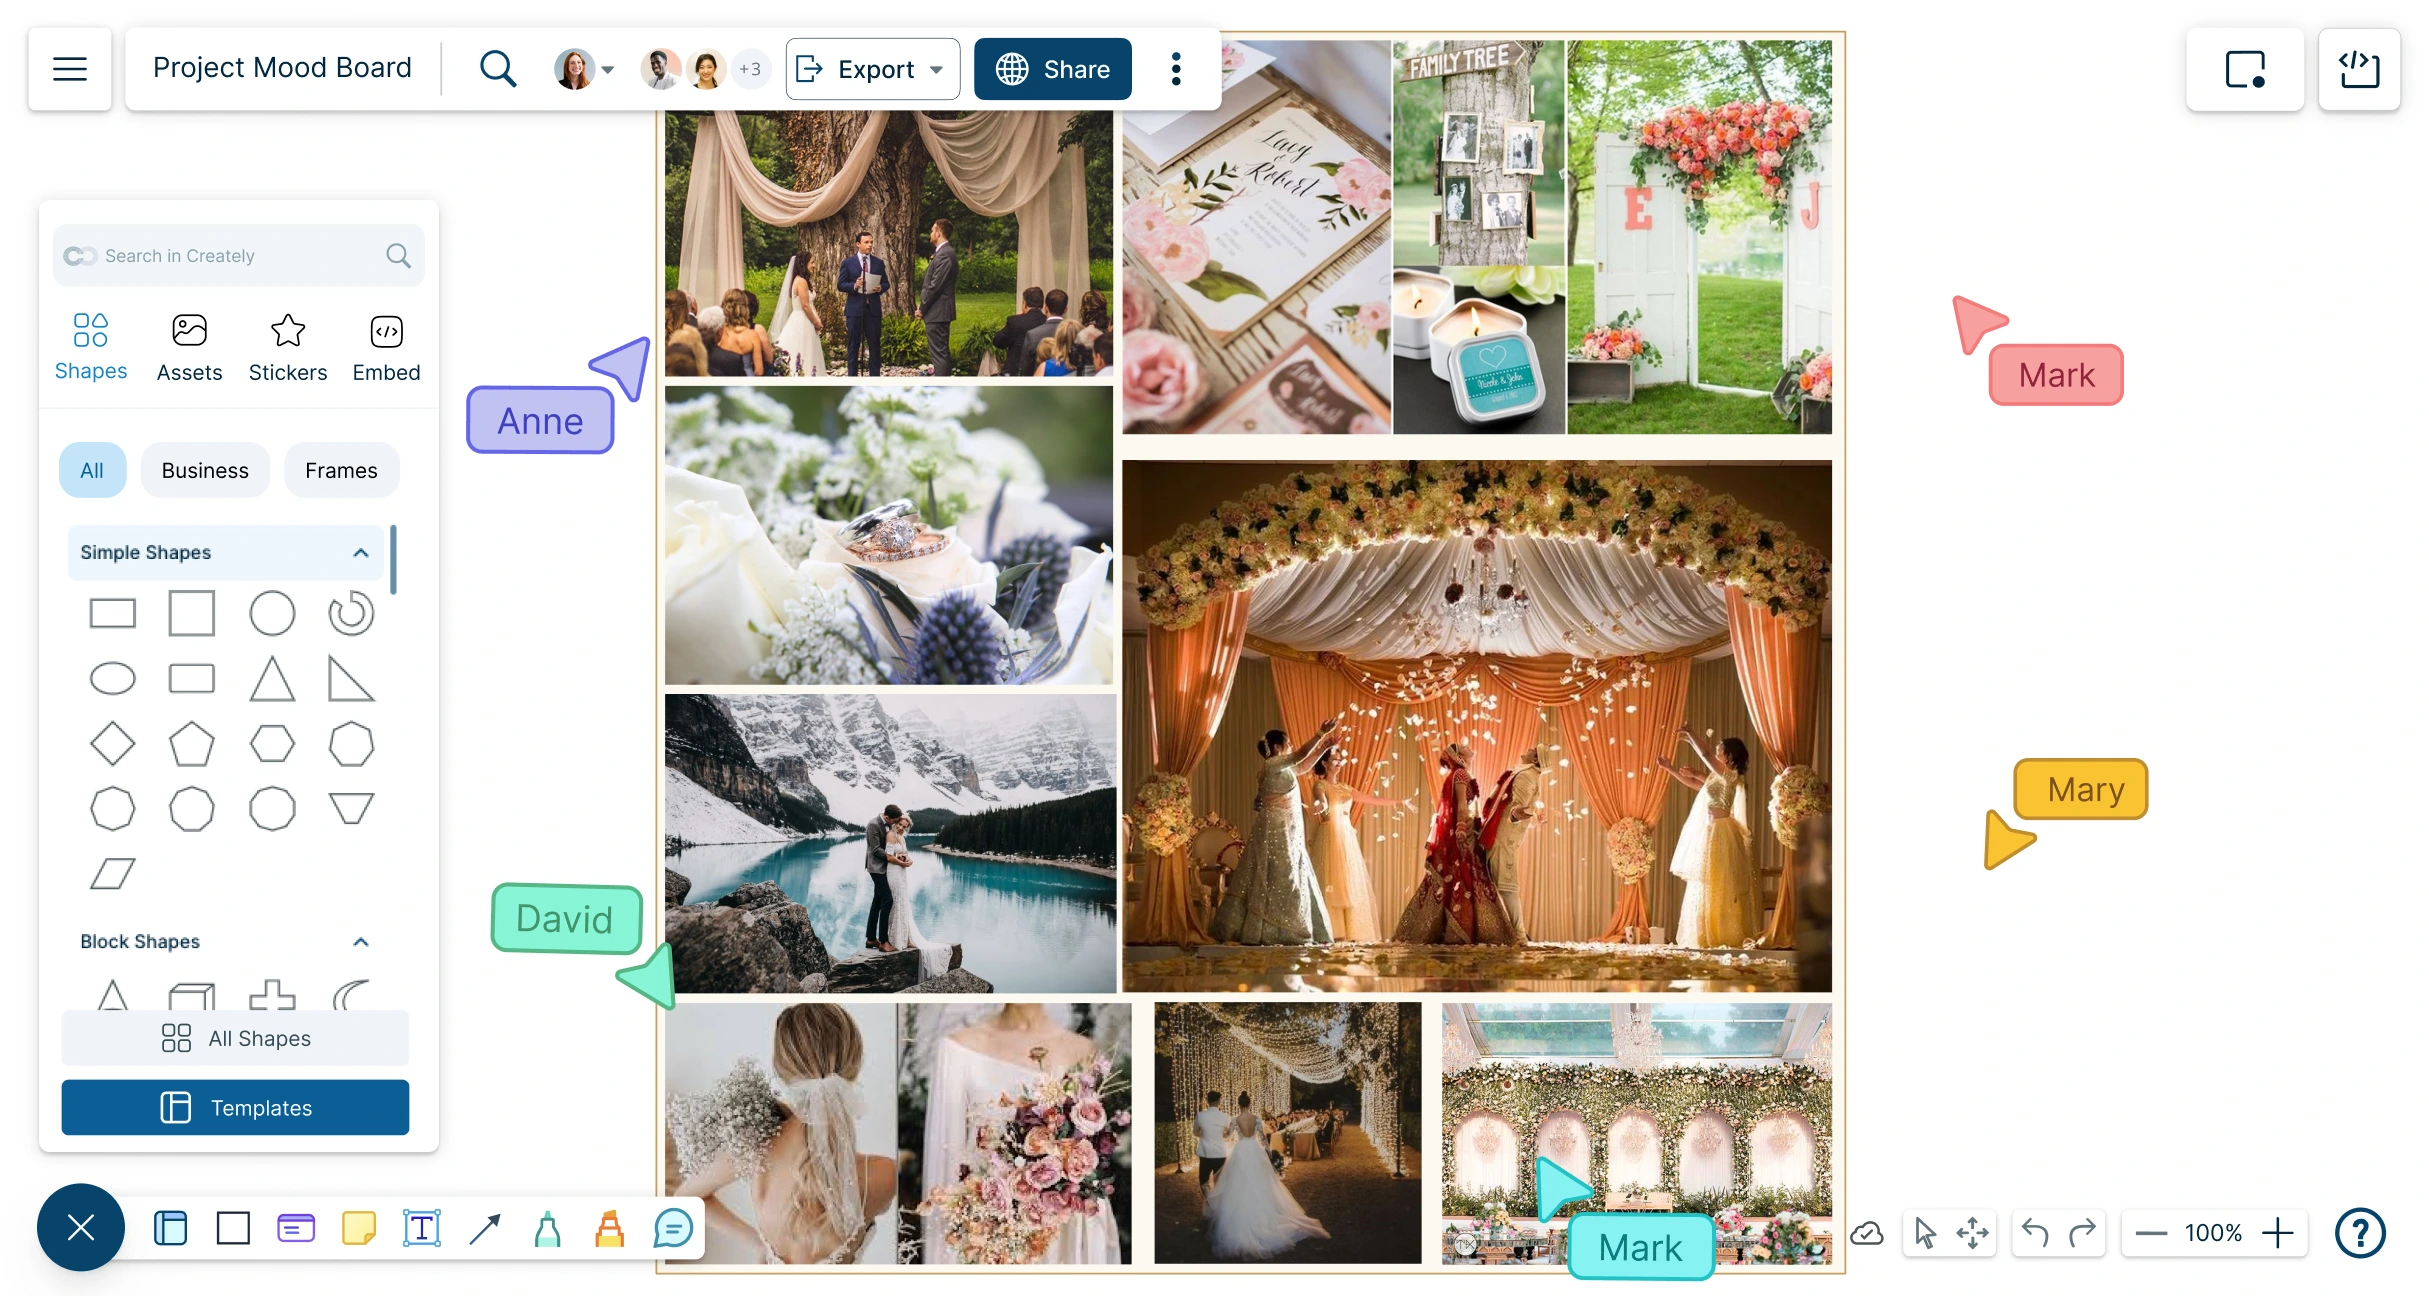
Effortlessly craft inspiring mood boards online and turn your creative ideas into stunning visual stories.
Easily visualize systems and processes with a block diagram online, and document and analyze their functional blocks and relationships.
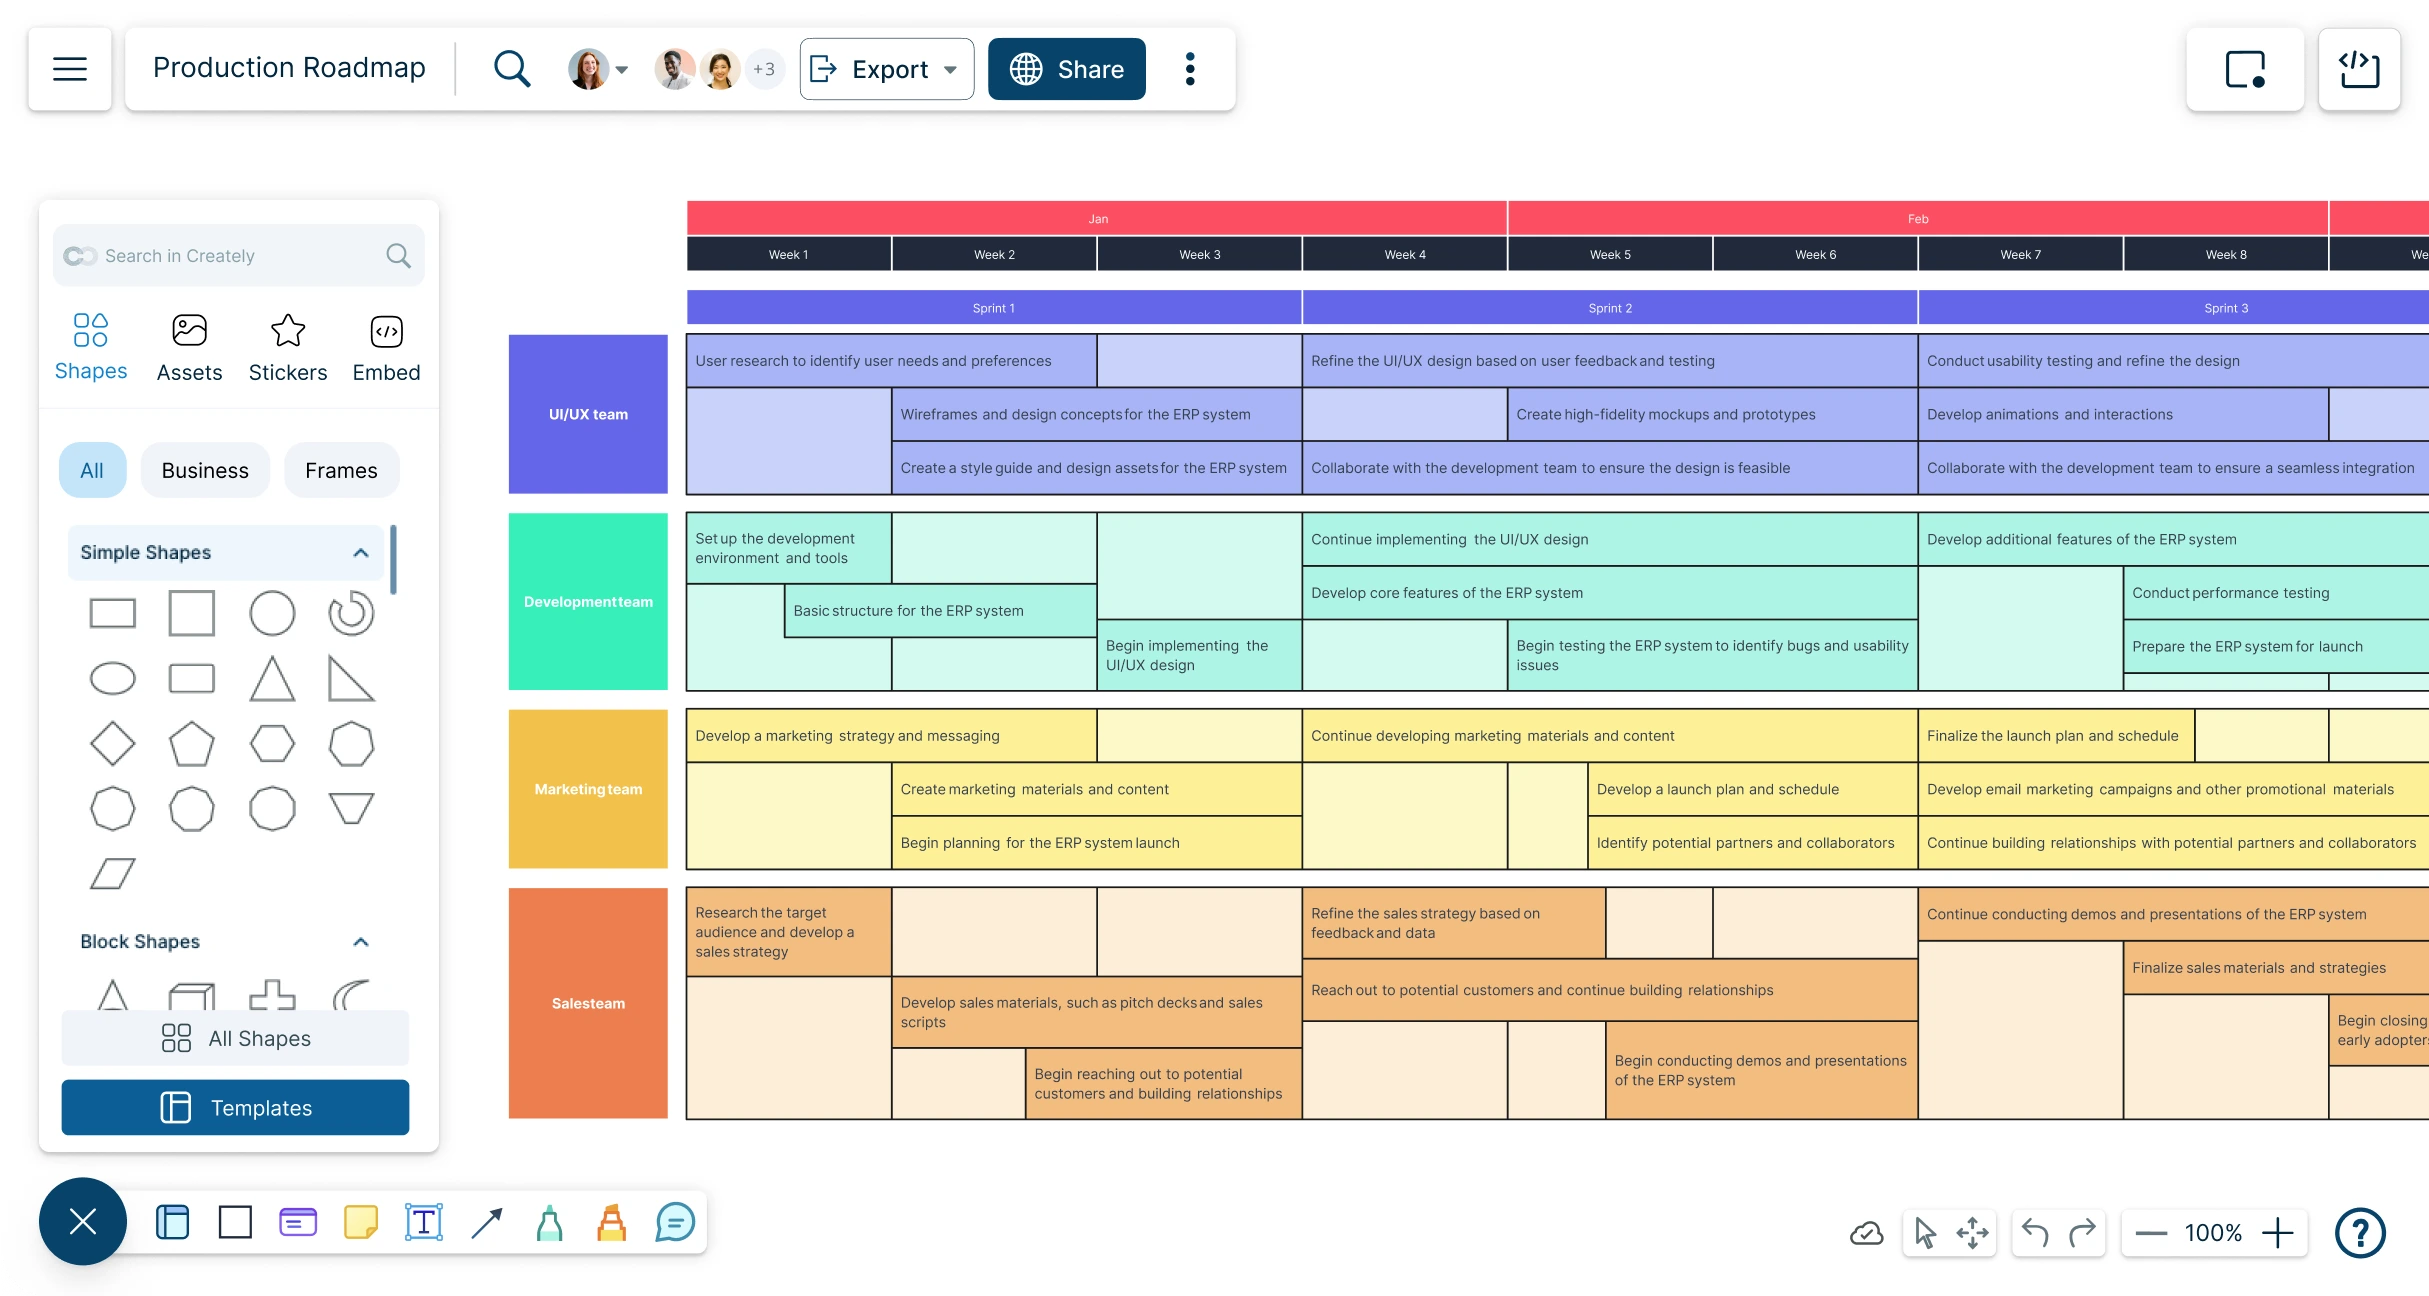
Make clear, goal-driven roadmaps that align vision, enhance communication, and improve execution for your business with Creately’s Roadmap Maker.
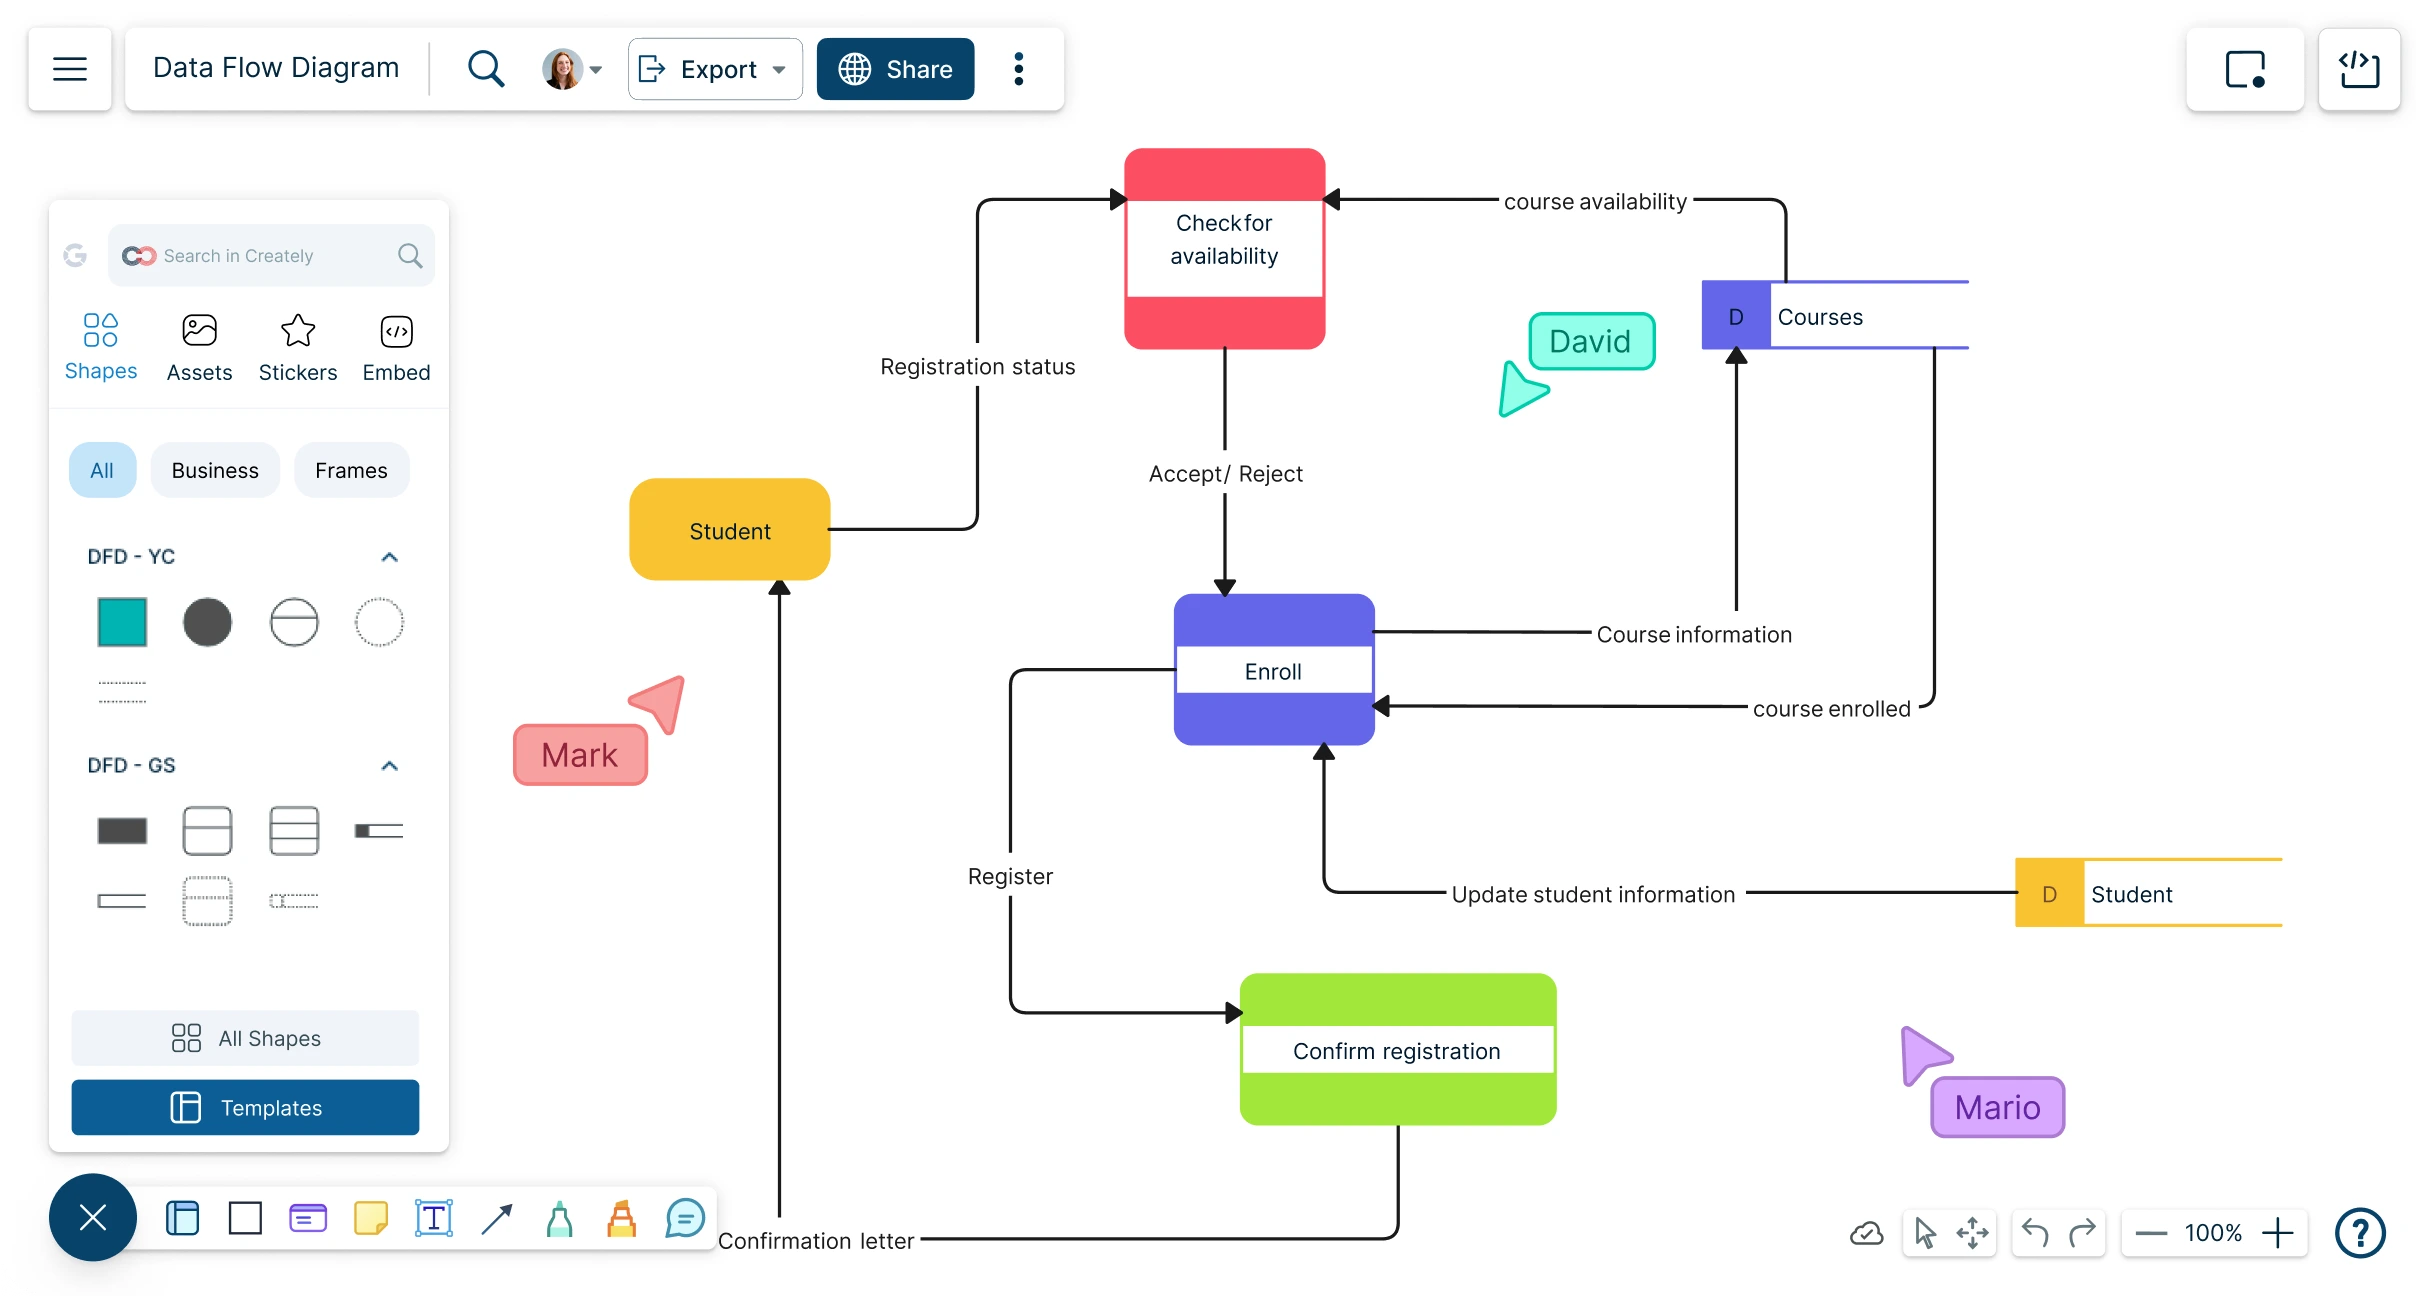
Use Creately’s Free DFD maker to visualize how data flows through systems. Collaborate in real-time with your team to show how data interacts and how it's stored.
Creately's intuitive network diagram creator empowers you to create clear, professional network diagrams in minutes.
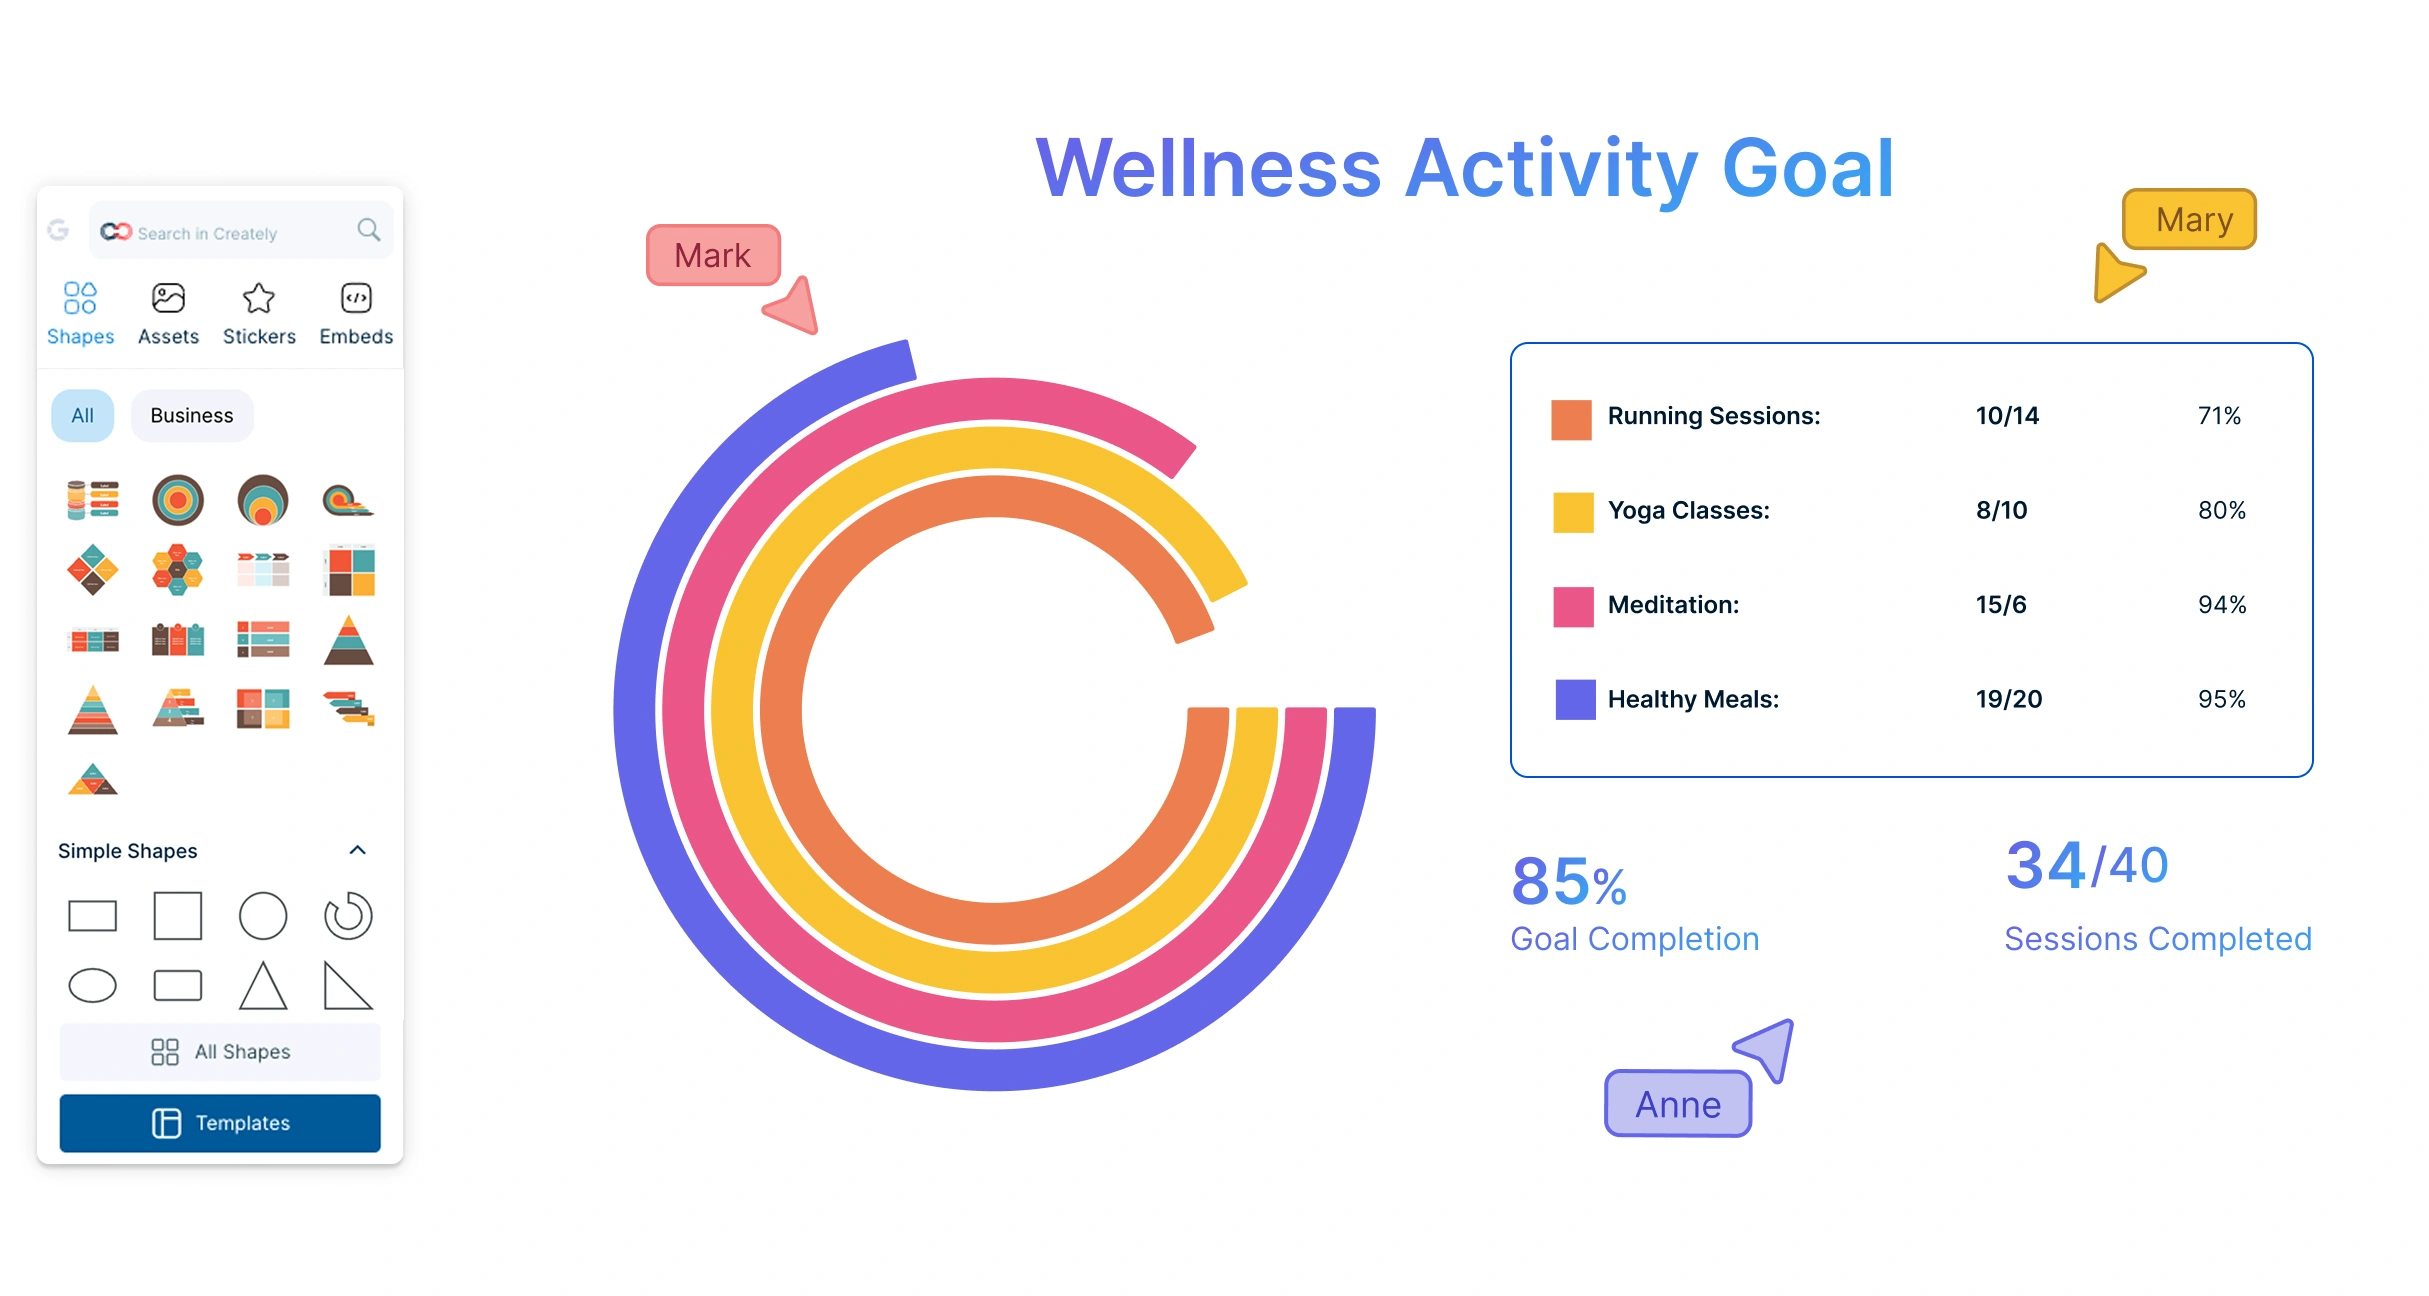
Effortlessly transform your data into visually engaging donut charts. Visualize sales data, project progress, or survey insights with clarity.
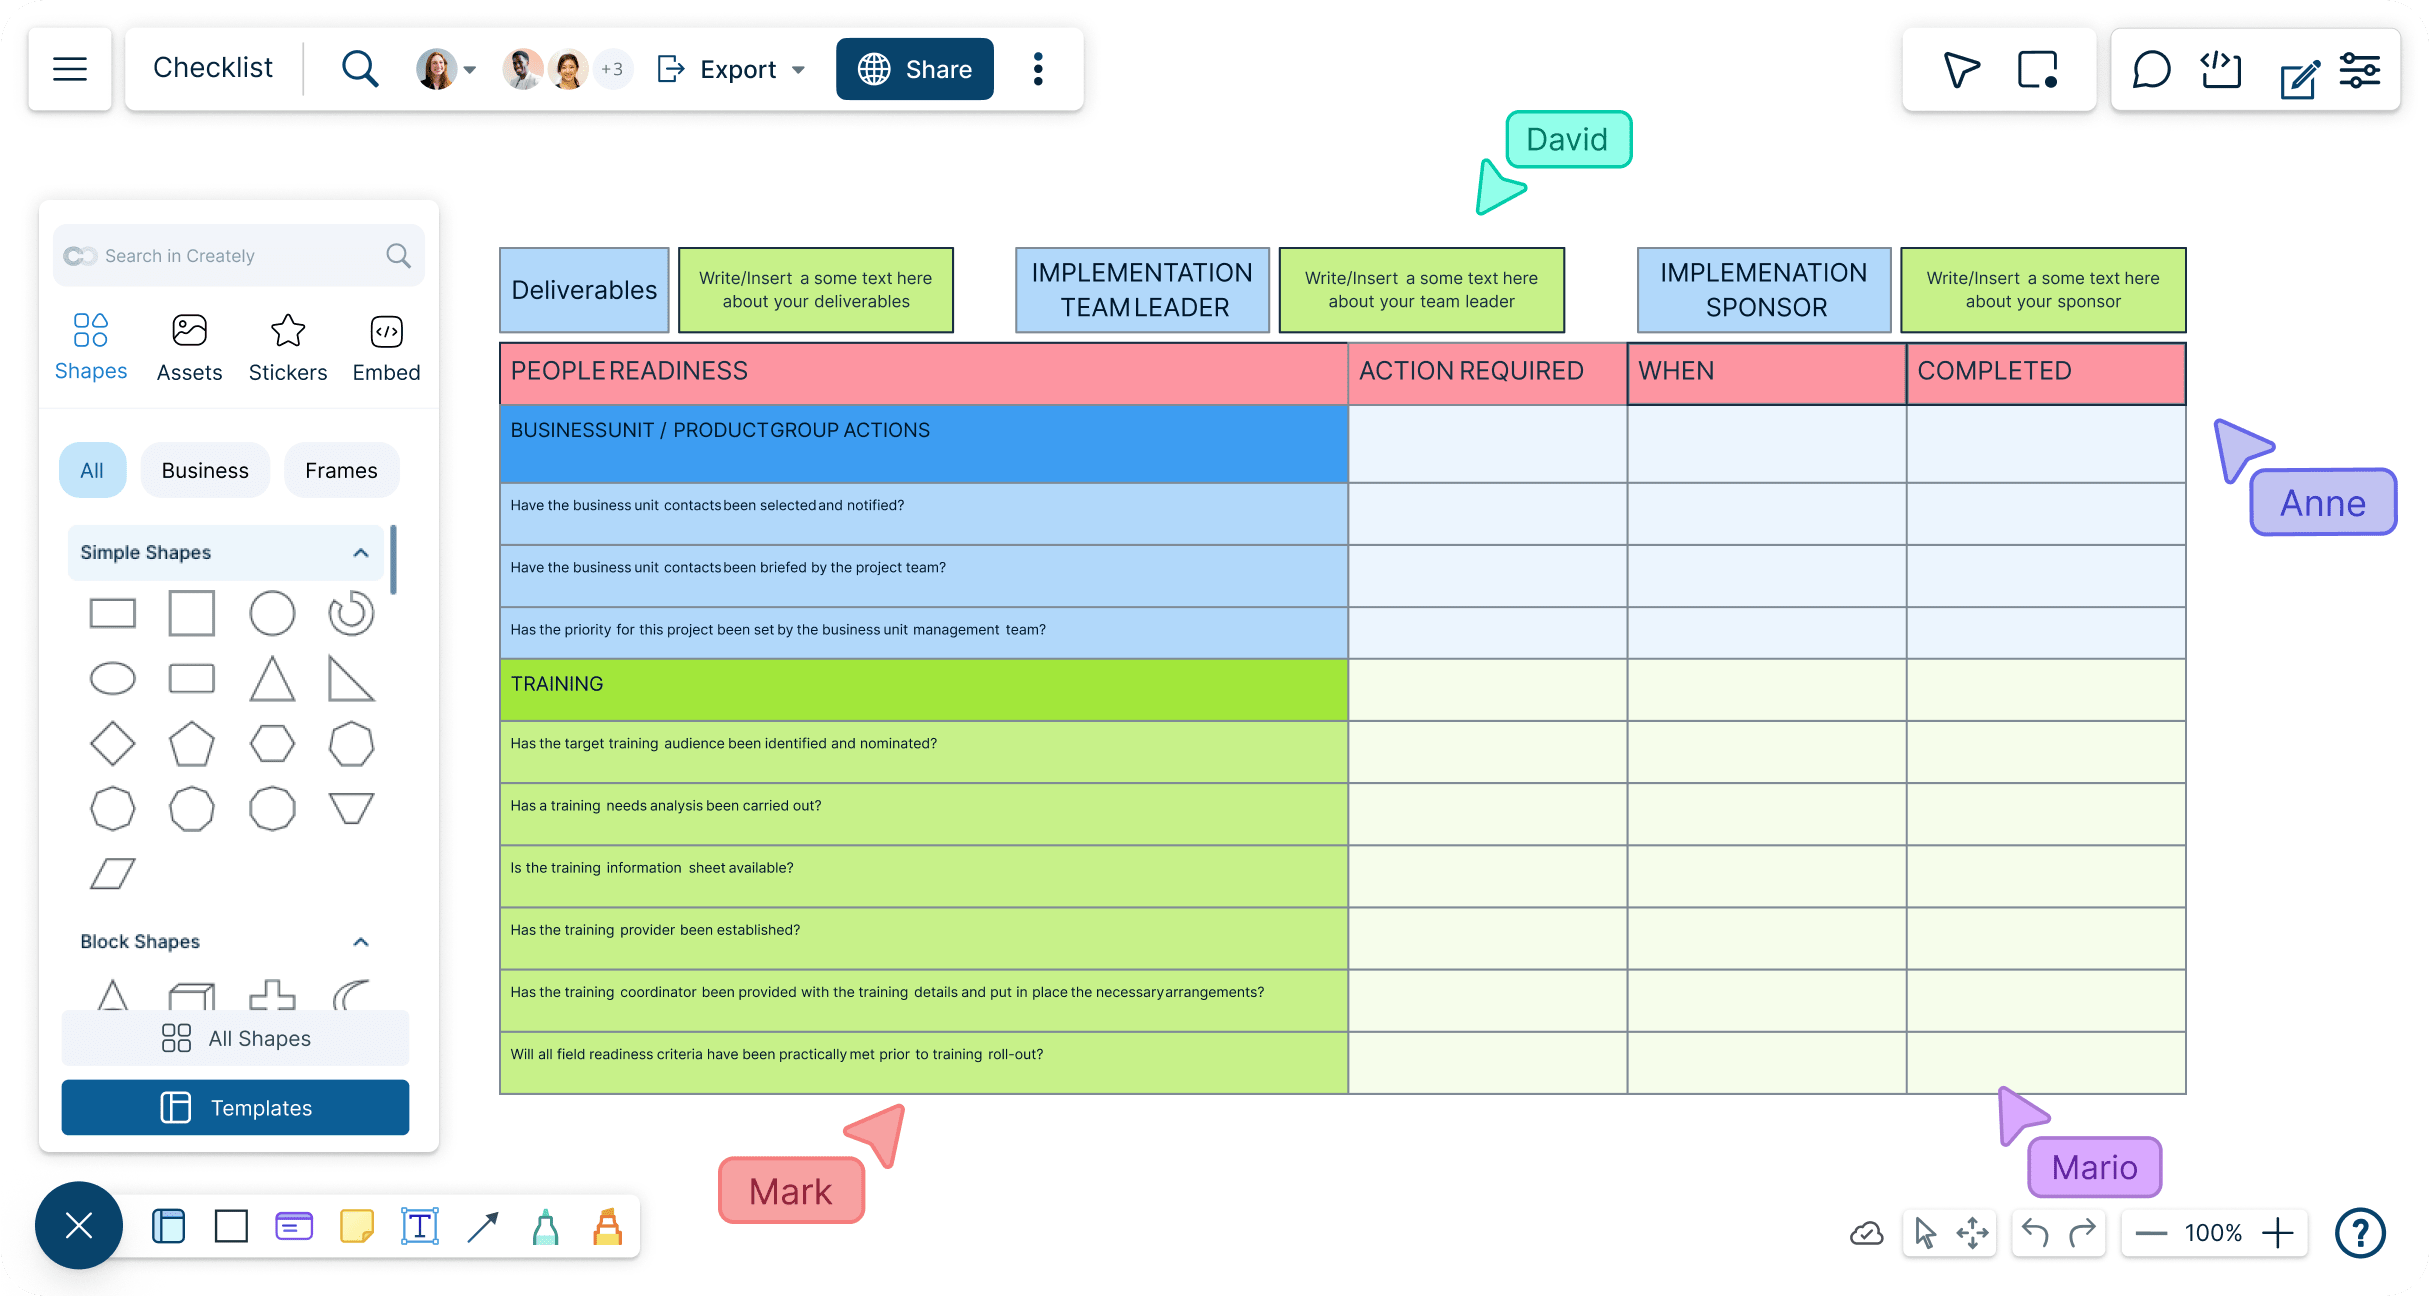
Use our intuitive checklist maker to create visually stunning checklists in minutes. Keep track of tasks online, stay organized, and streamline your activities with ease.
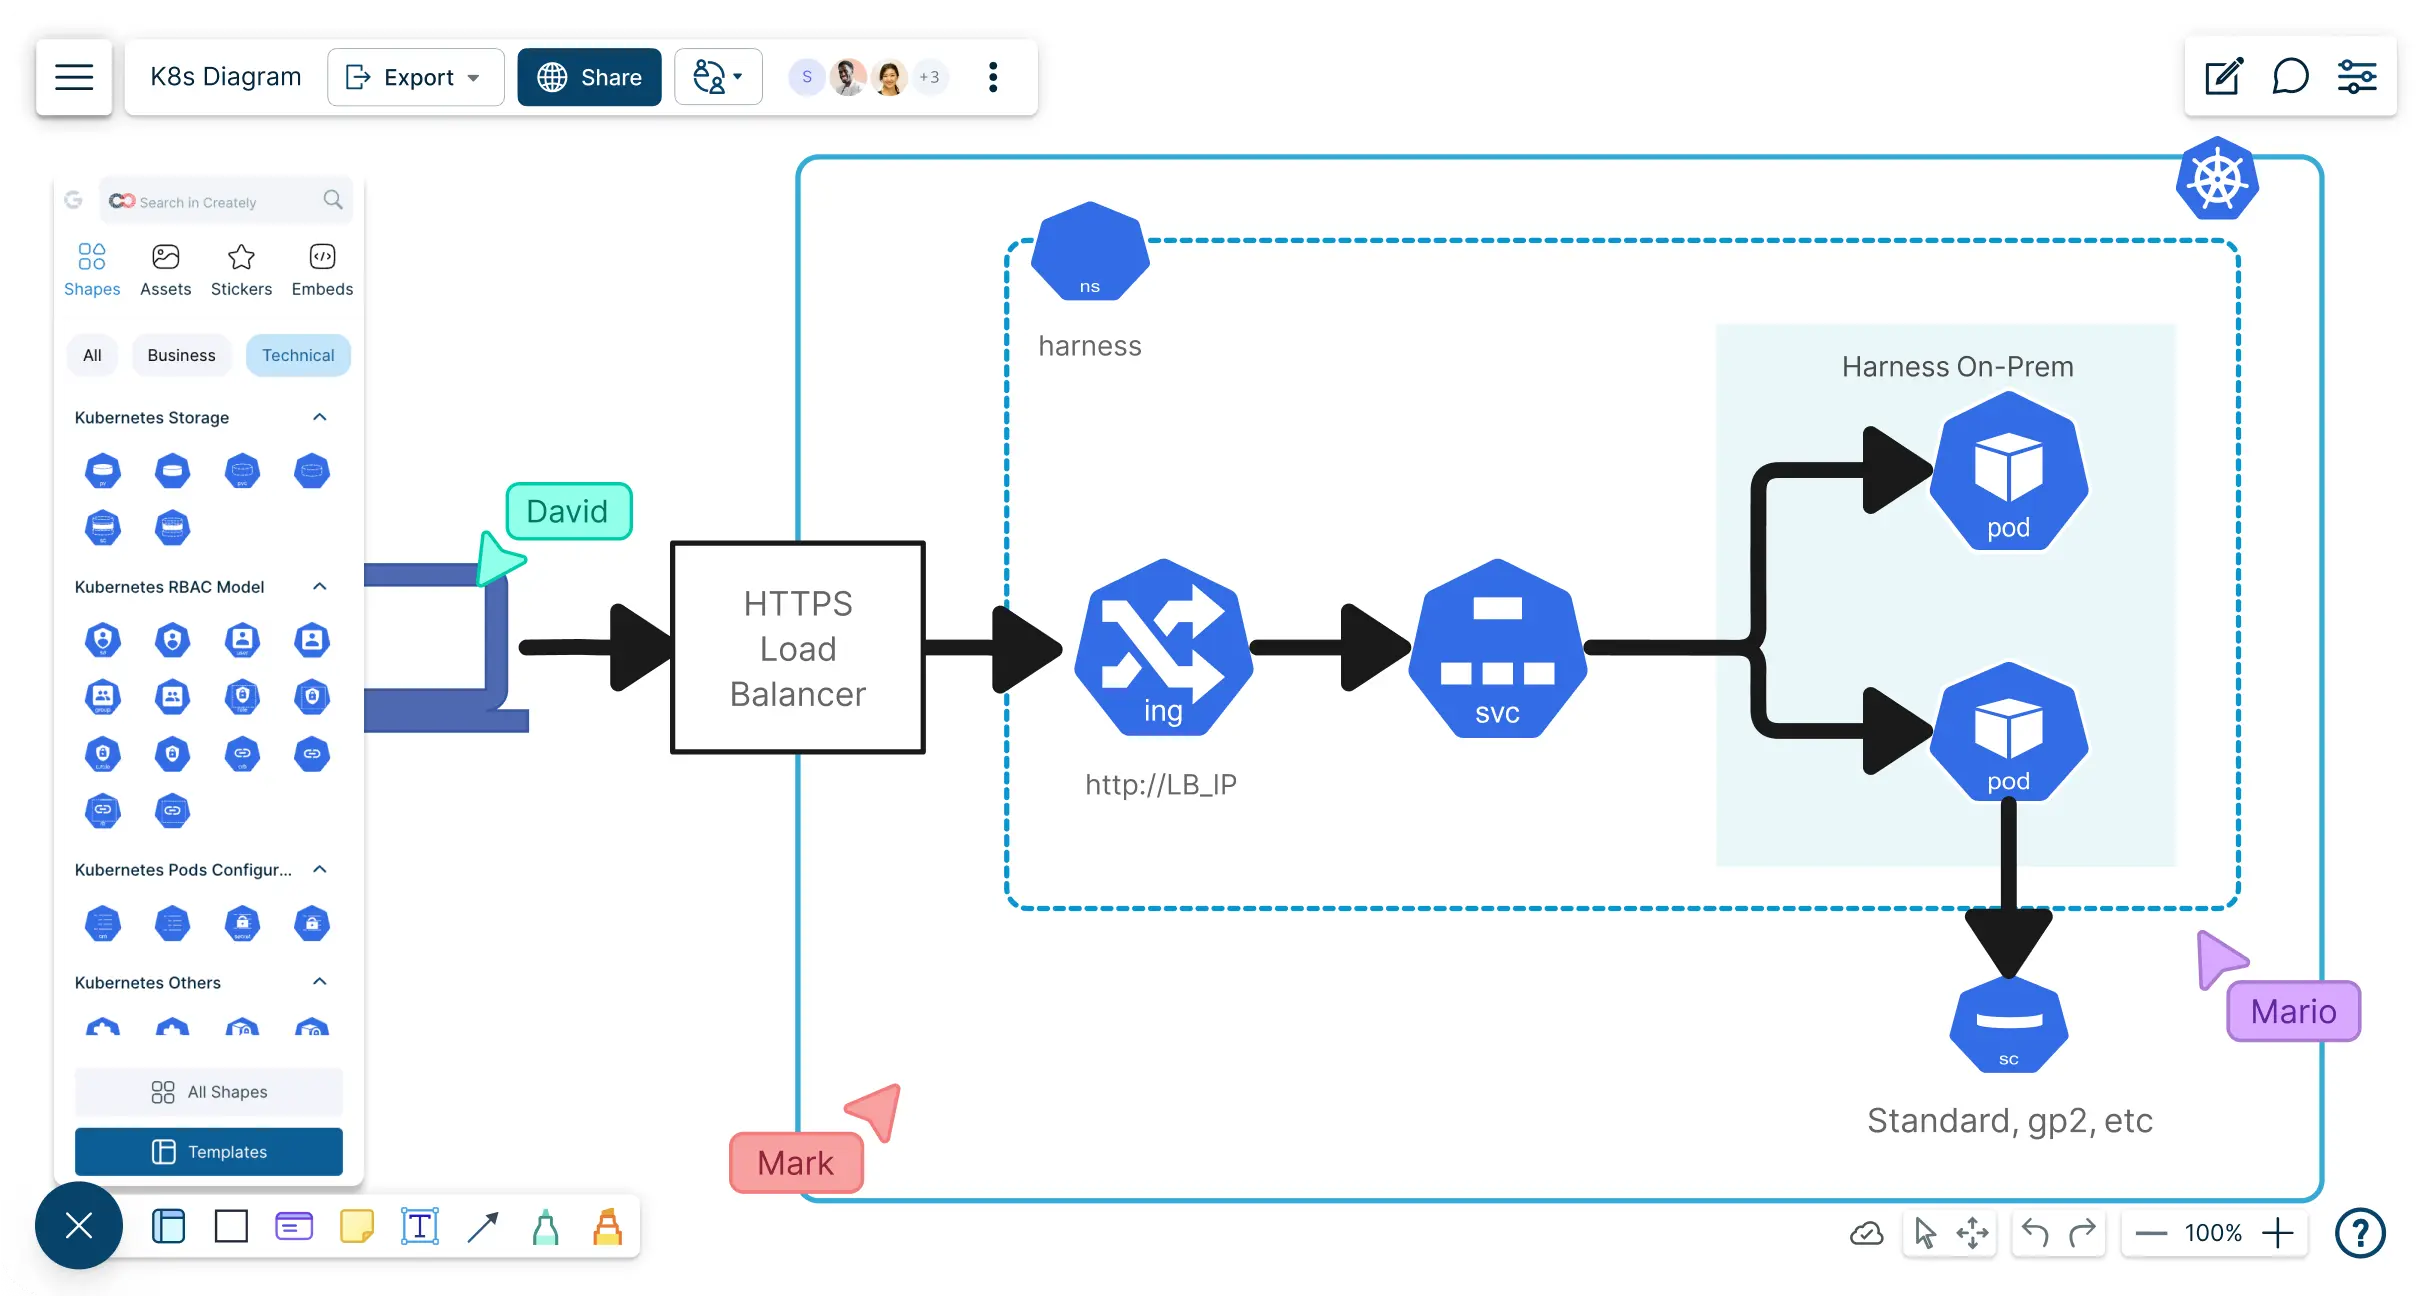
Create, edit, and share Kubernetes architecture diagrams with Creately. Easily represent the deployment, scale, and management of your containerized applications.
Effectively visualize and represent any type of data using Pictogram maker app. Discover useful insights for better decision making using colourful pictogram.
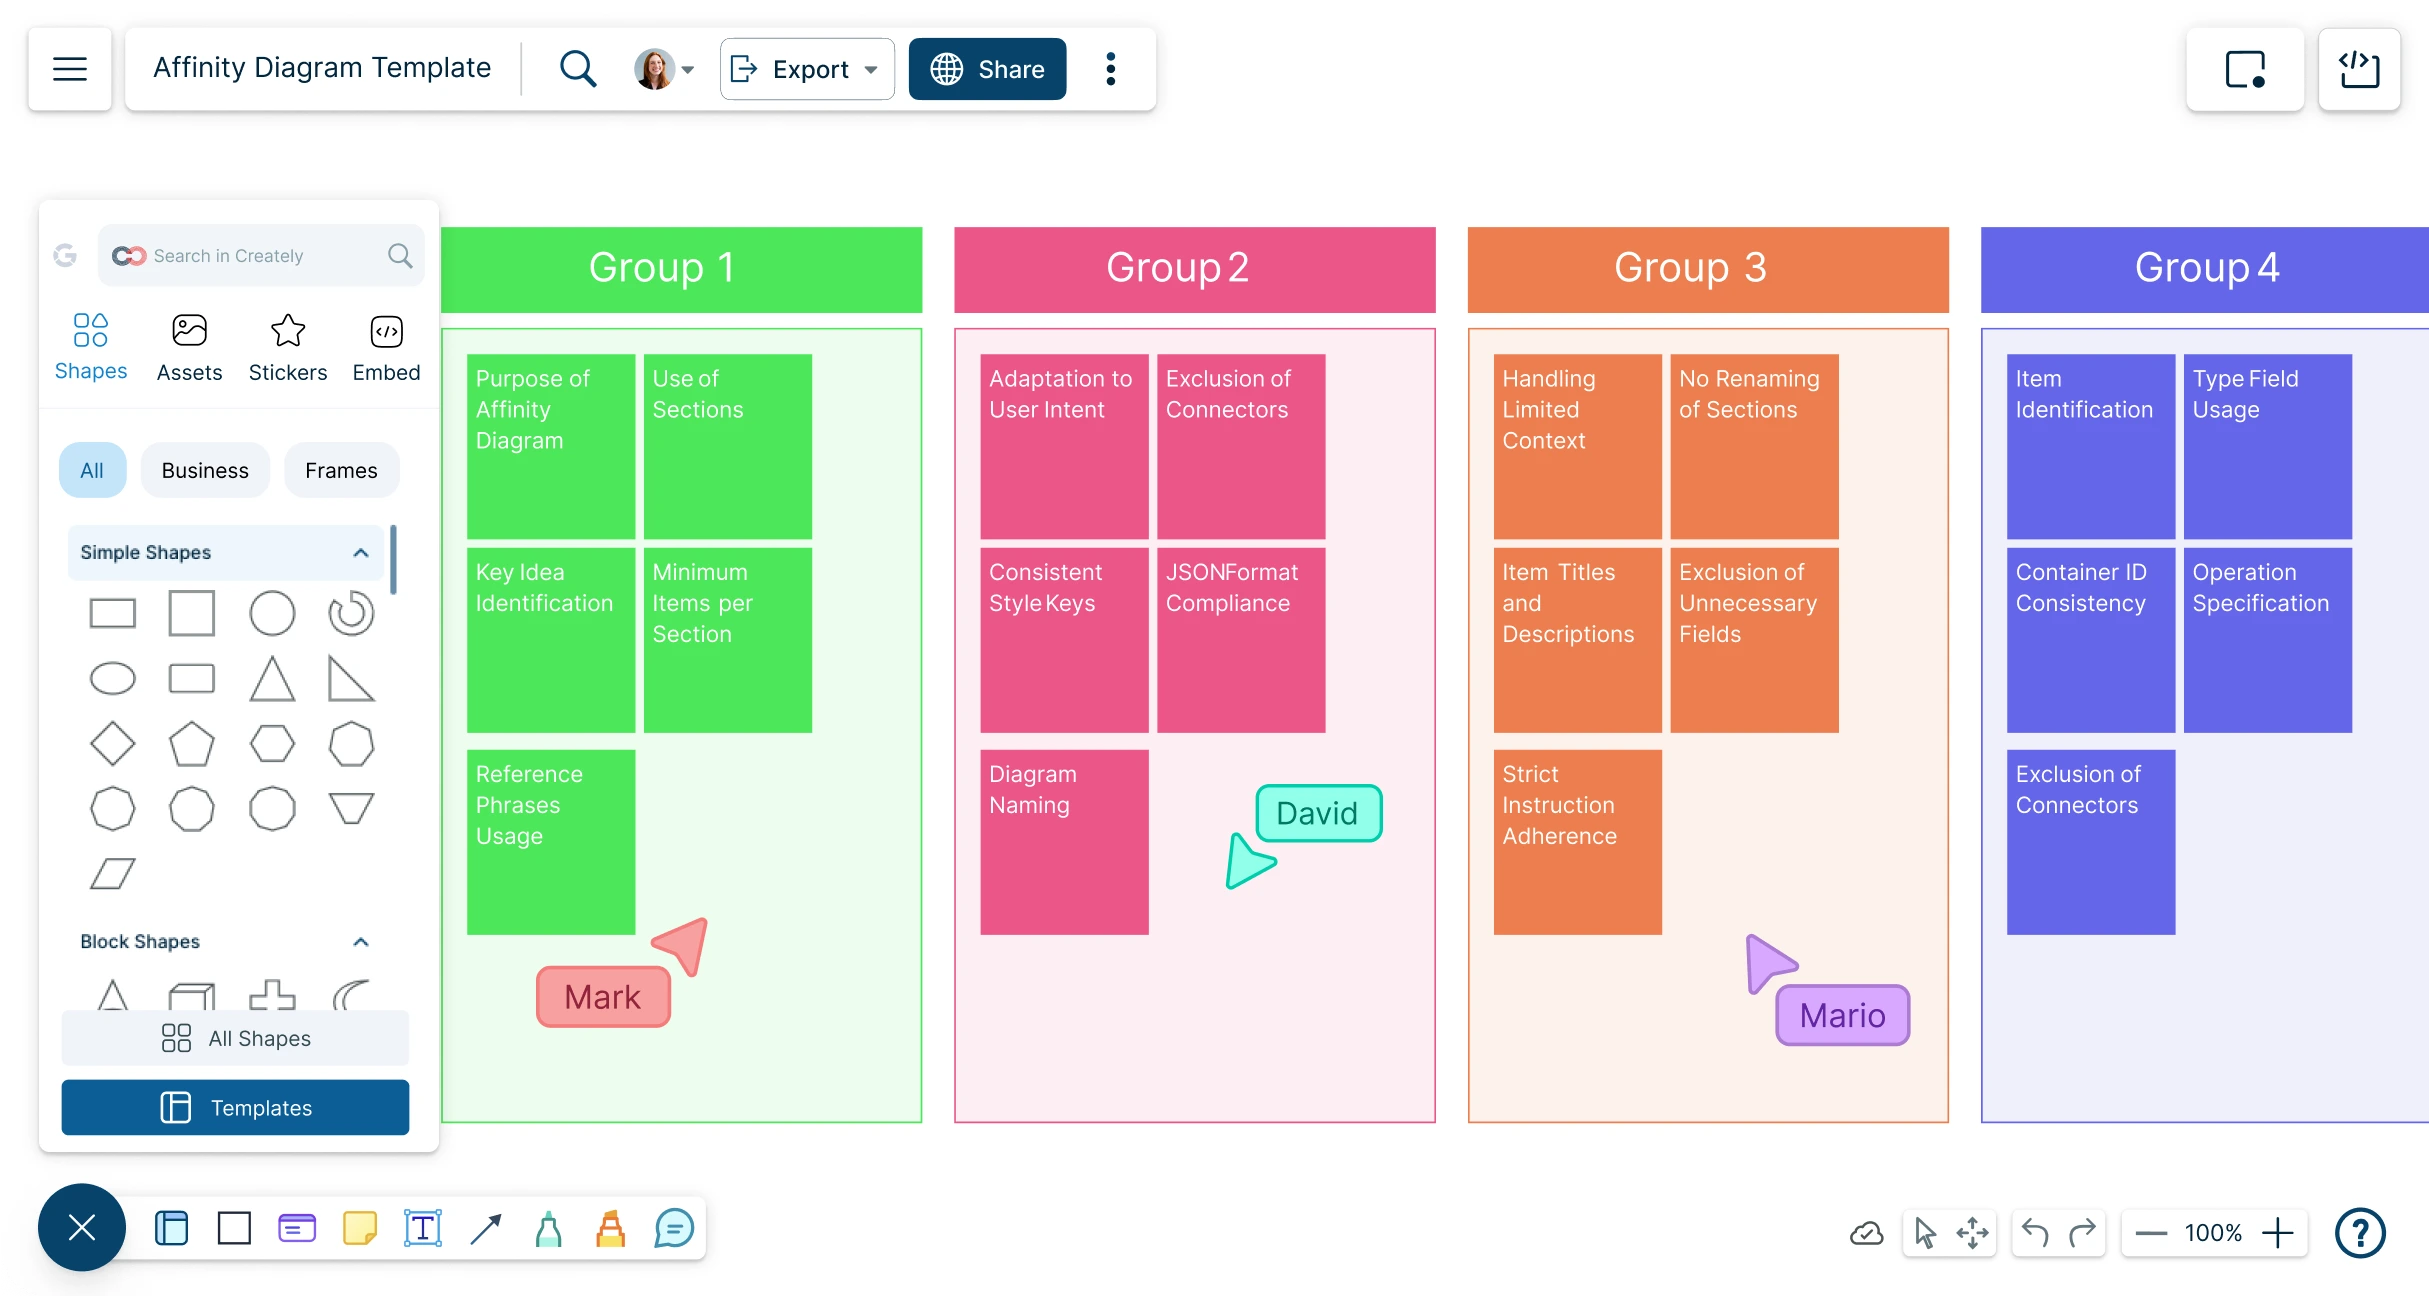
Intuitive affinity diagram tool to visually organize & group large volumes of data, streamline idea clustering, and analysis to support powerful decision-making.
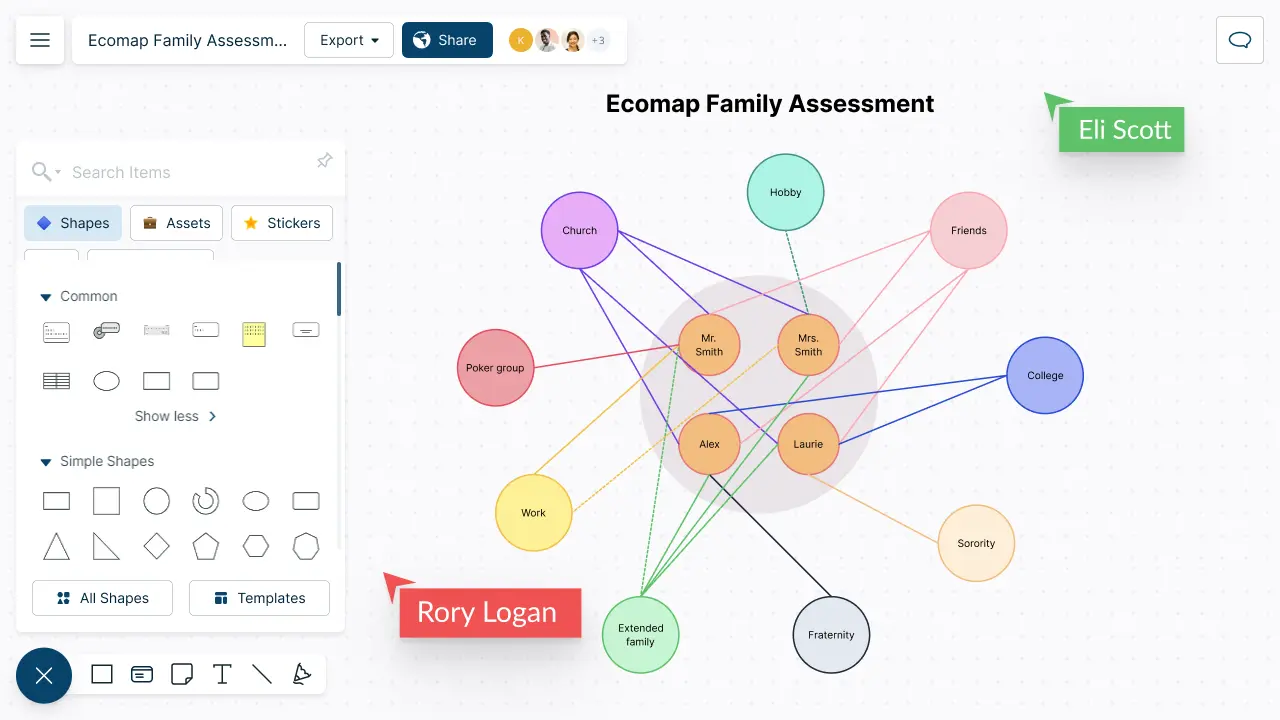
Gain deeper insights into relationships, uncover emotional connections, and identify behavioral patterns to guide more effective counseling and intervention strategies.
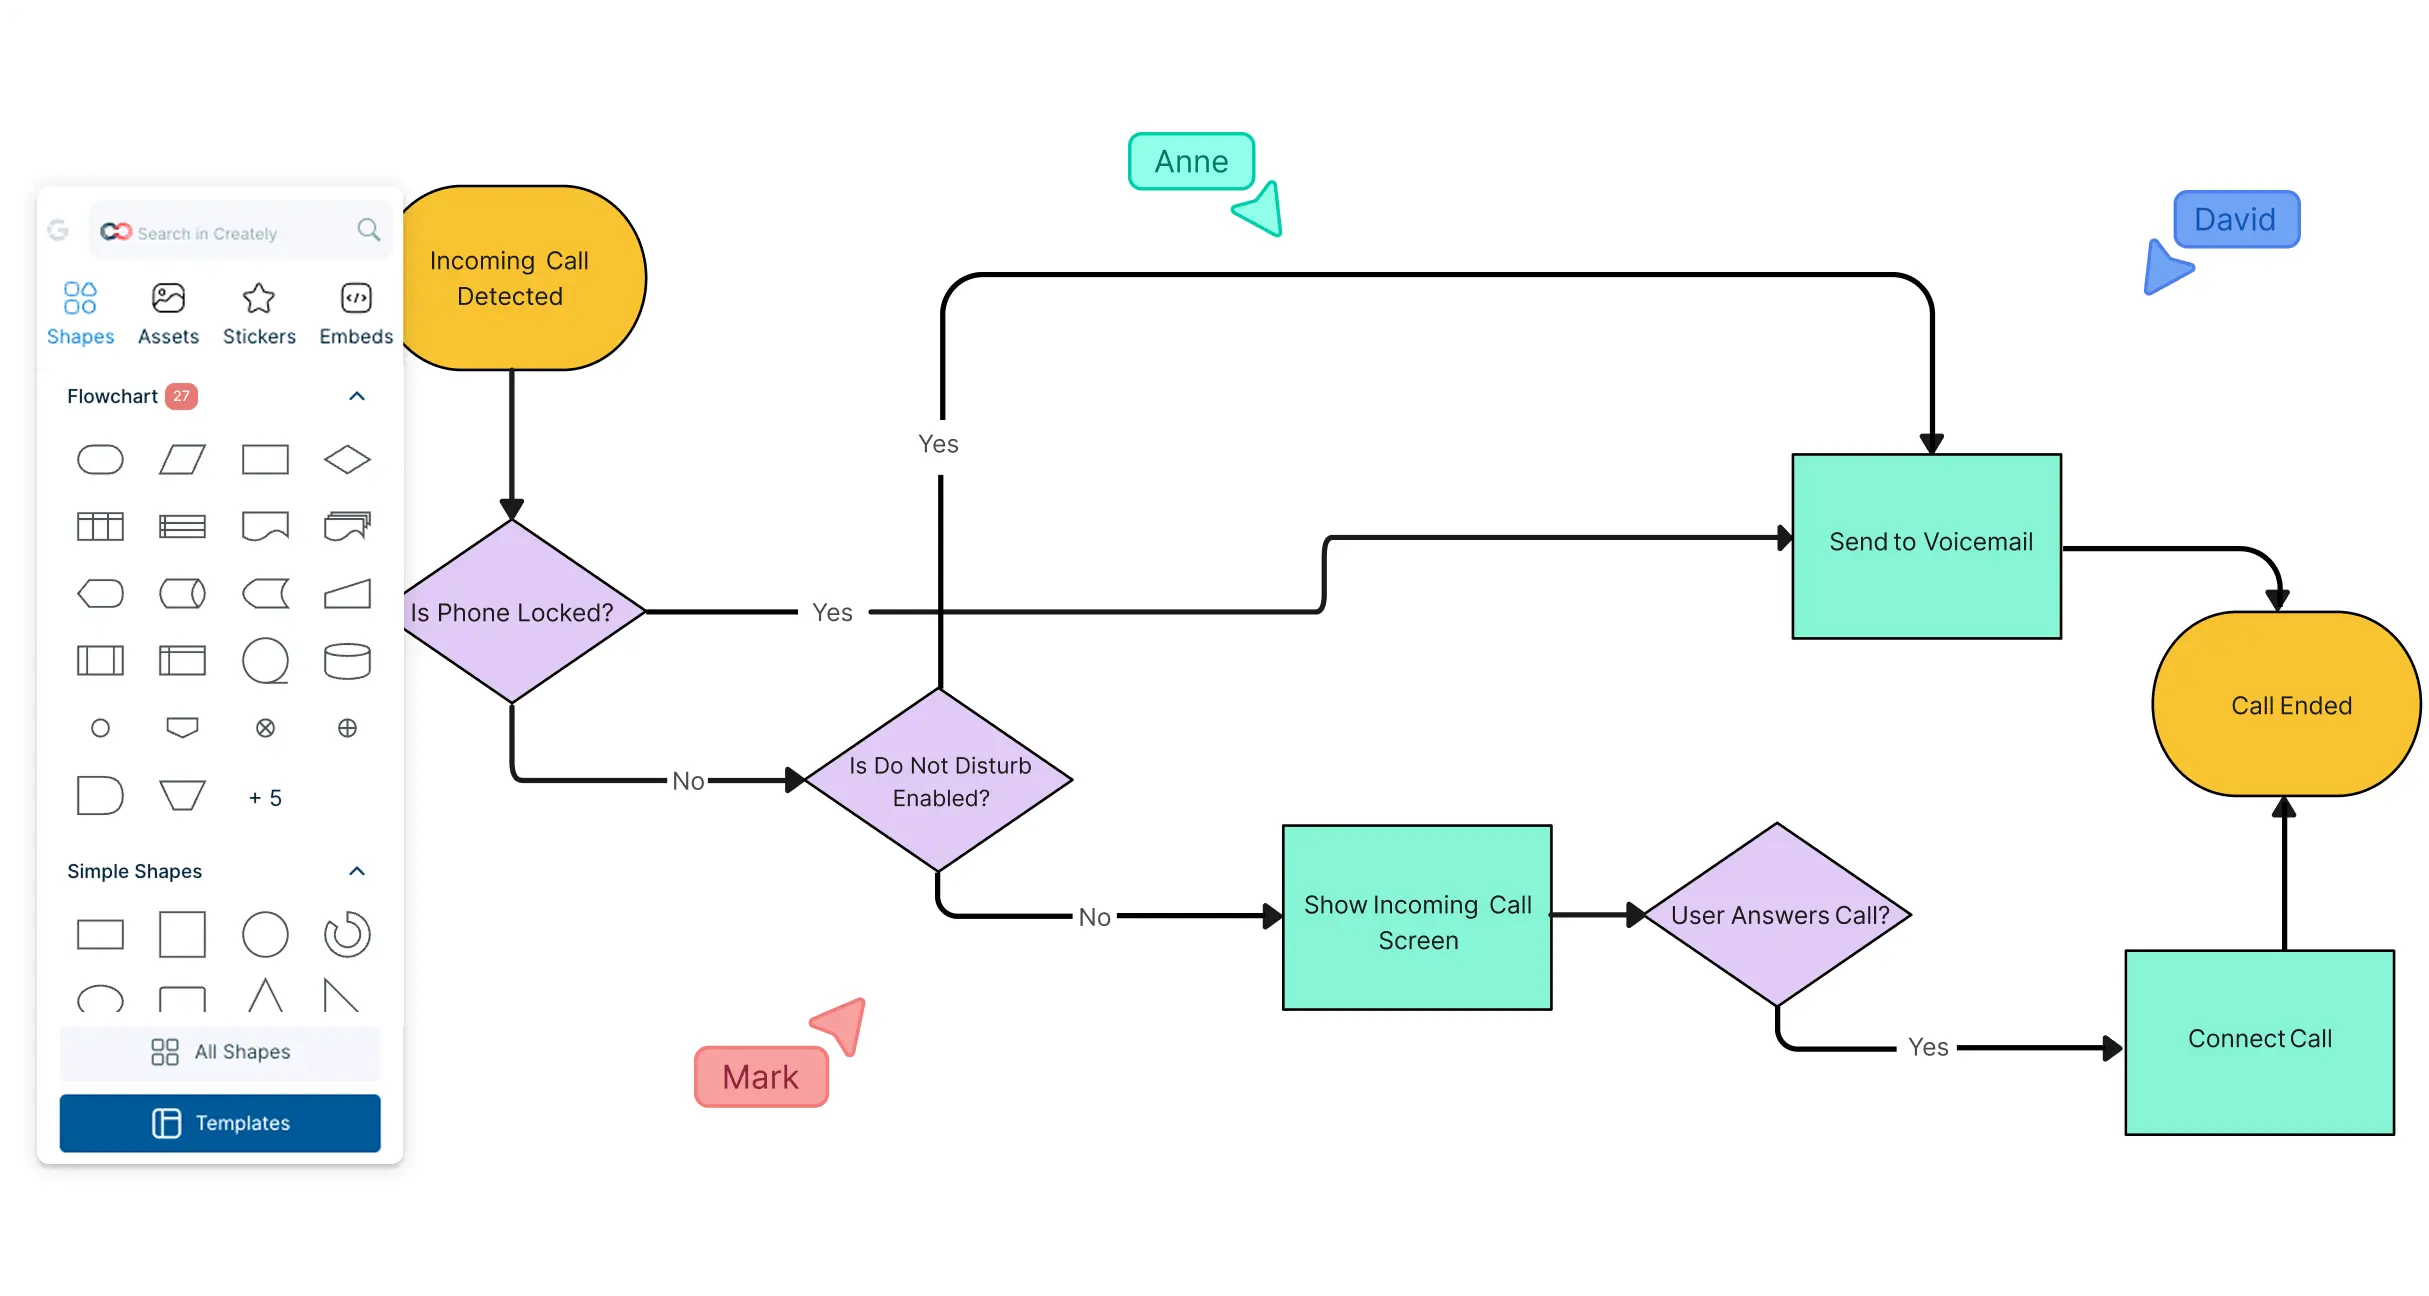
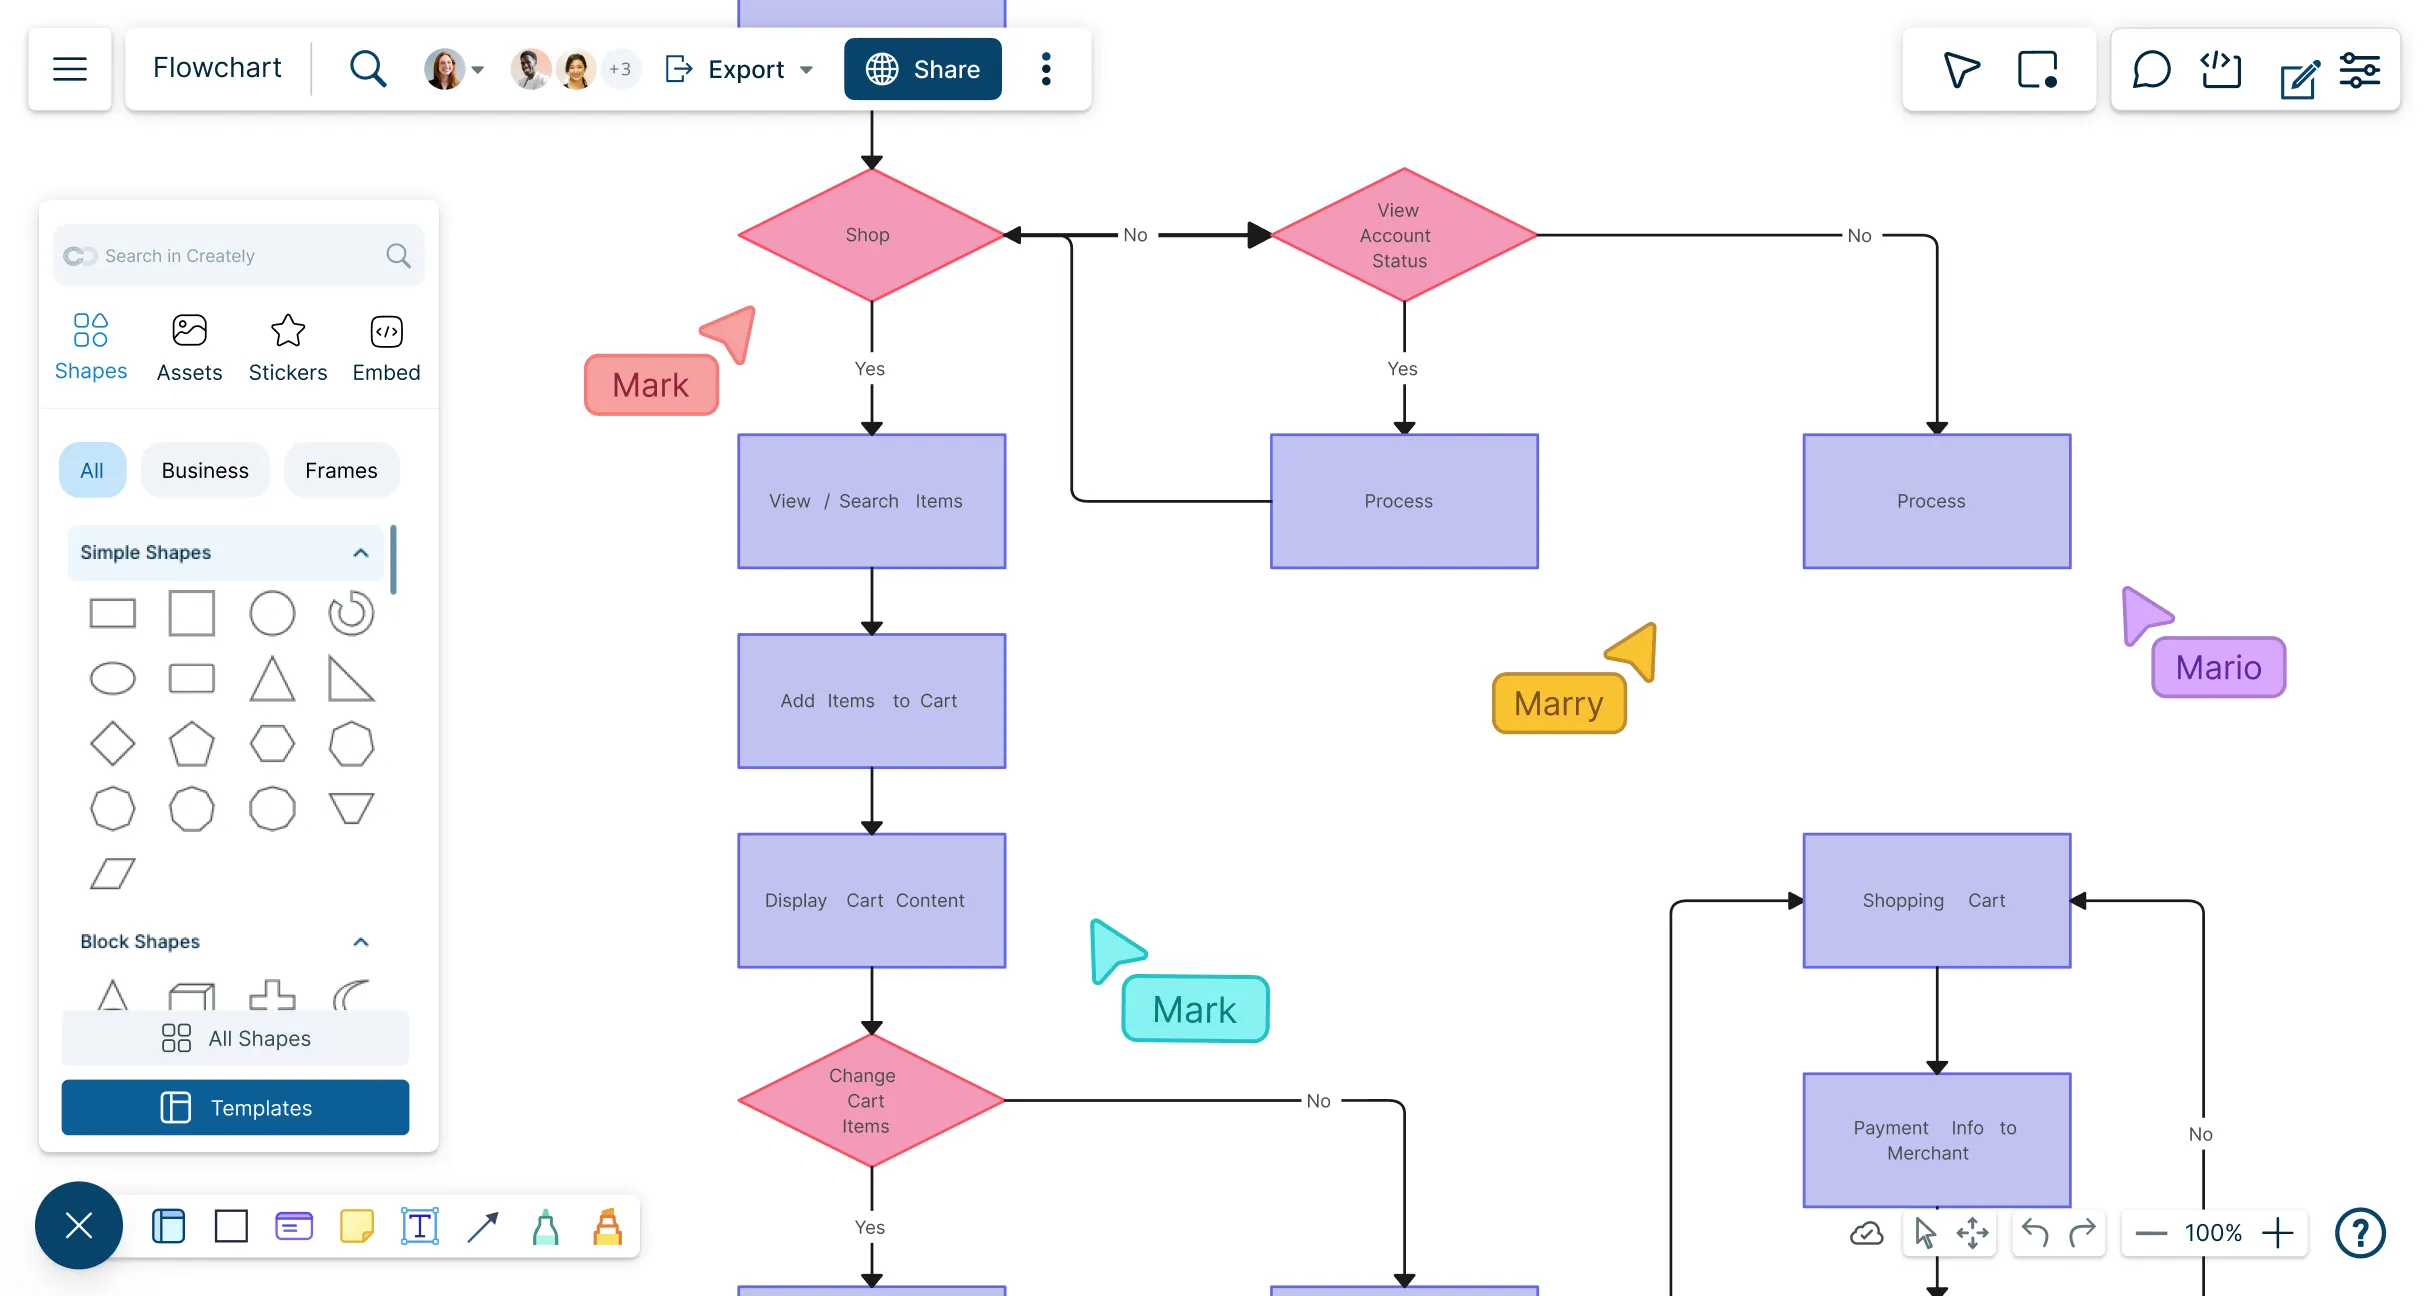
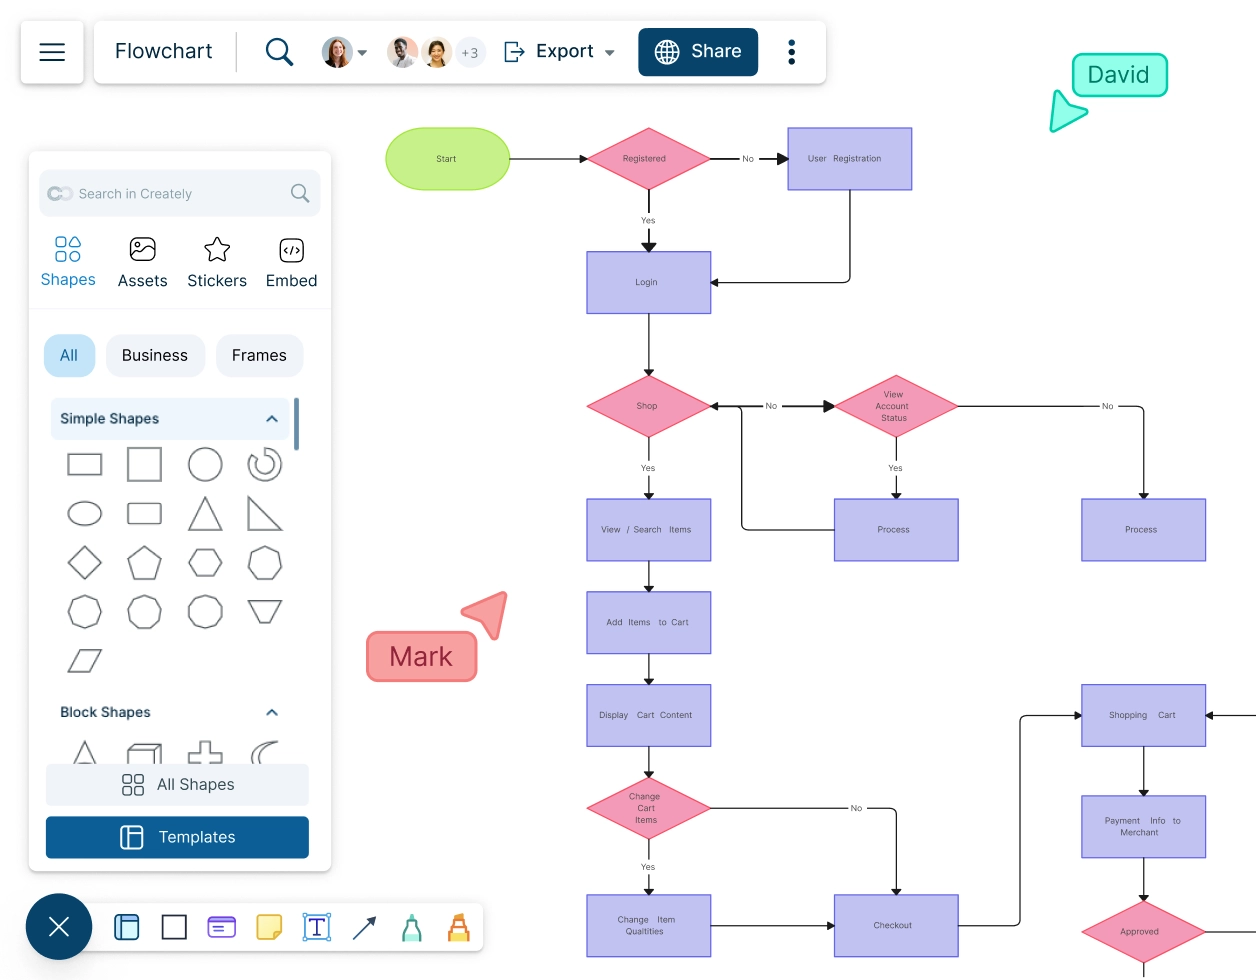
Effortlessly create and share flowcharts, improving team communication and simplifying workflows with our intuitive online tool.
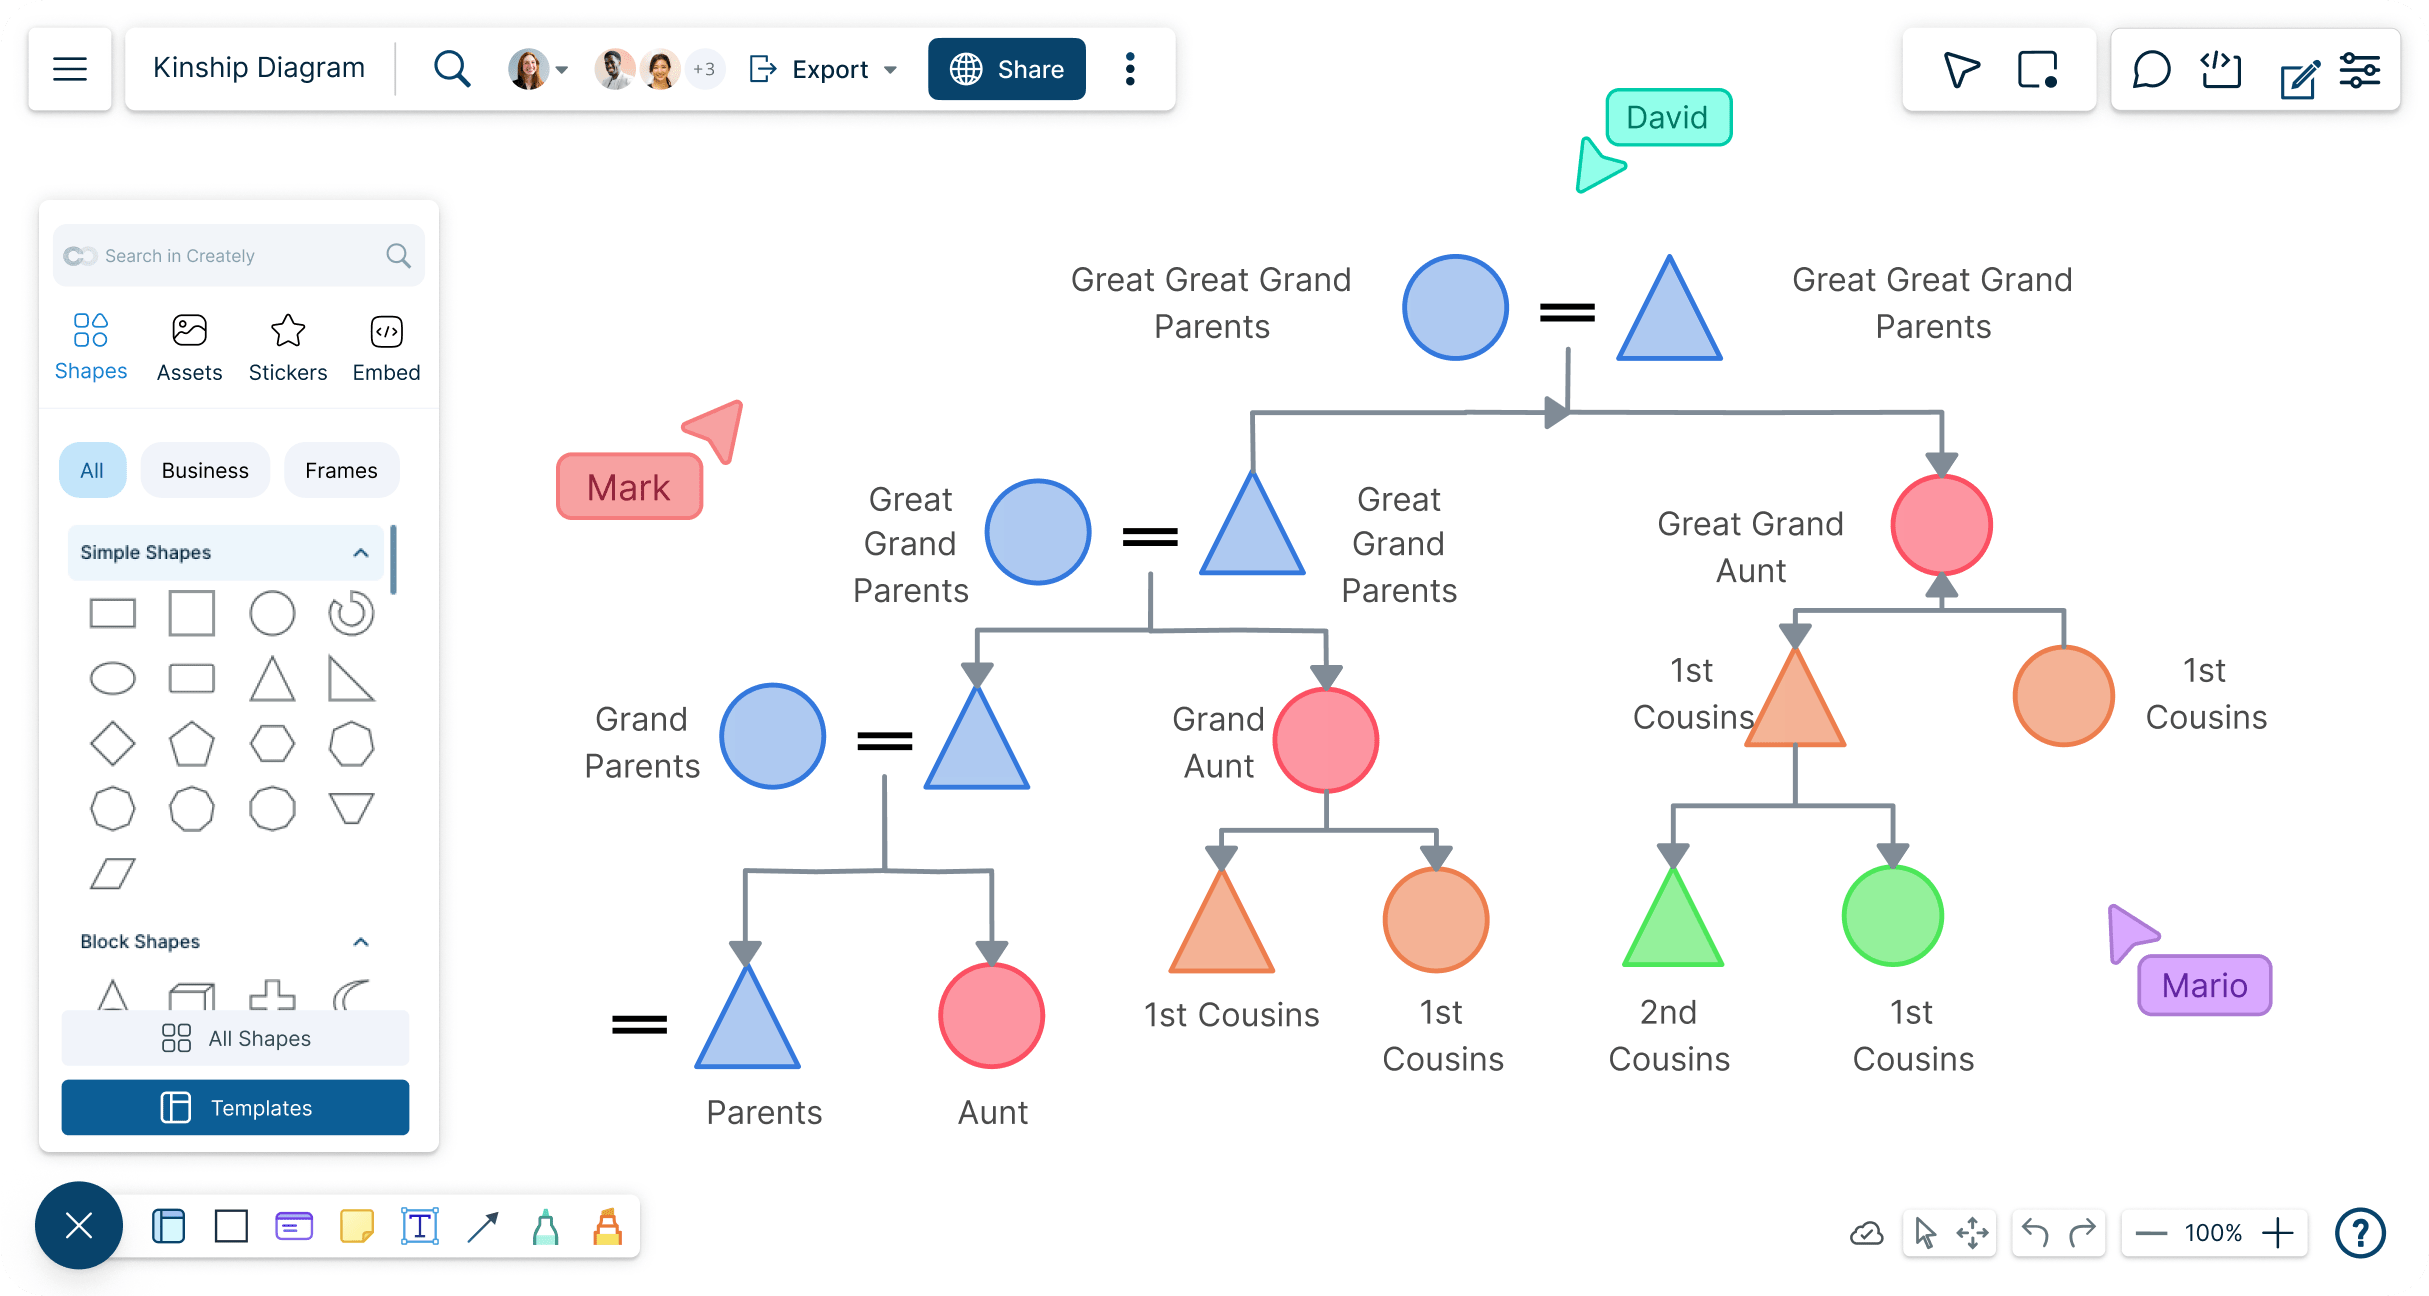
Visualize biological relationships and understand how they translate into social and cultural realities with Creately’s Kinship diagram maker.
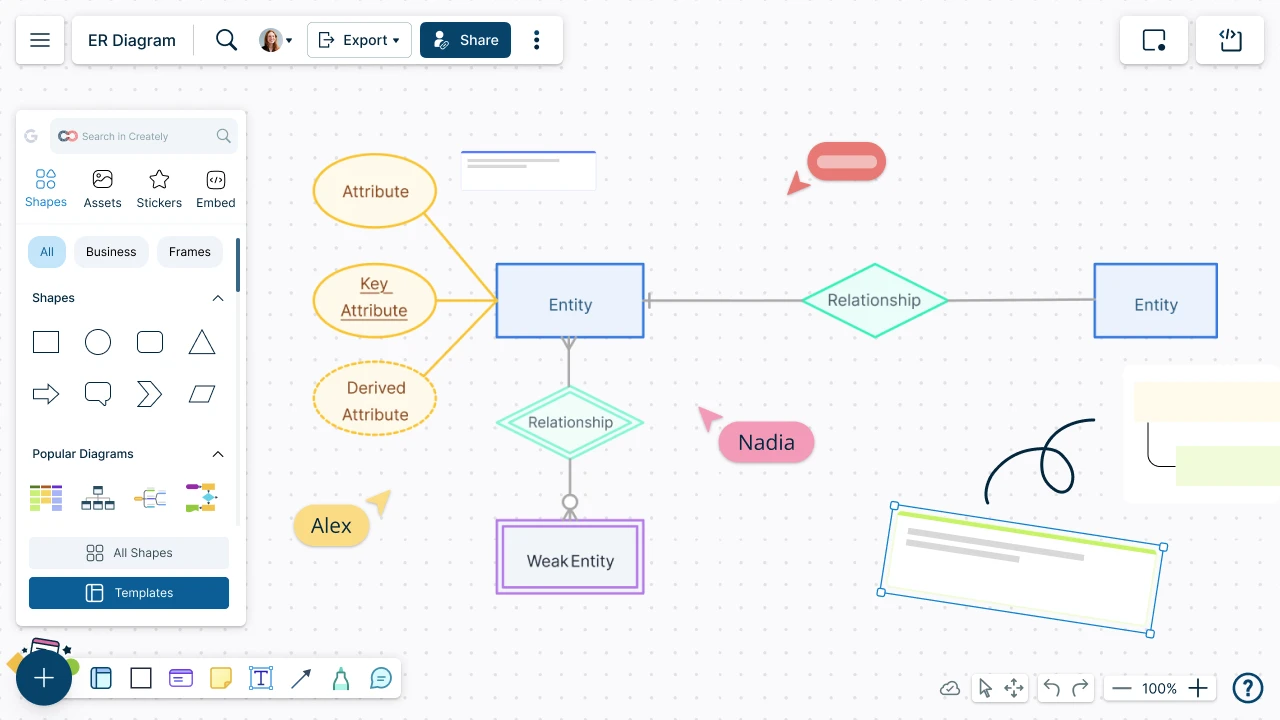
Quickly create your ER diagrams online, collaborate with your team, and maintain & track changes as the design evolves.
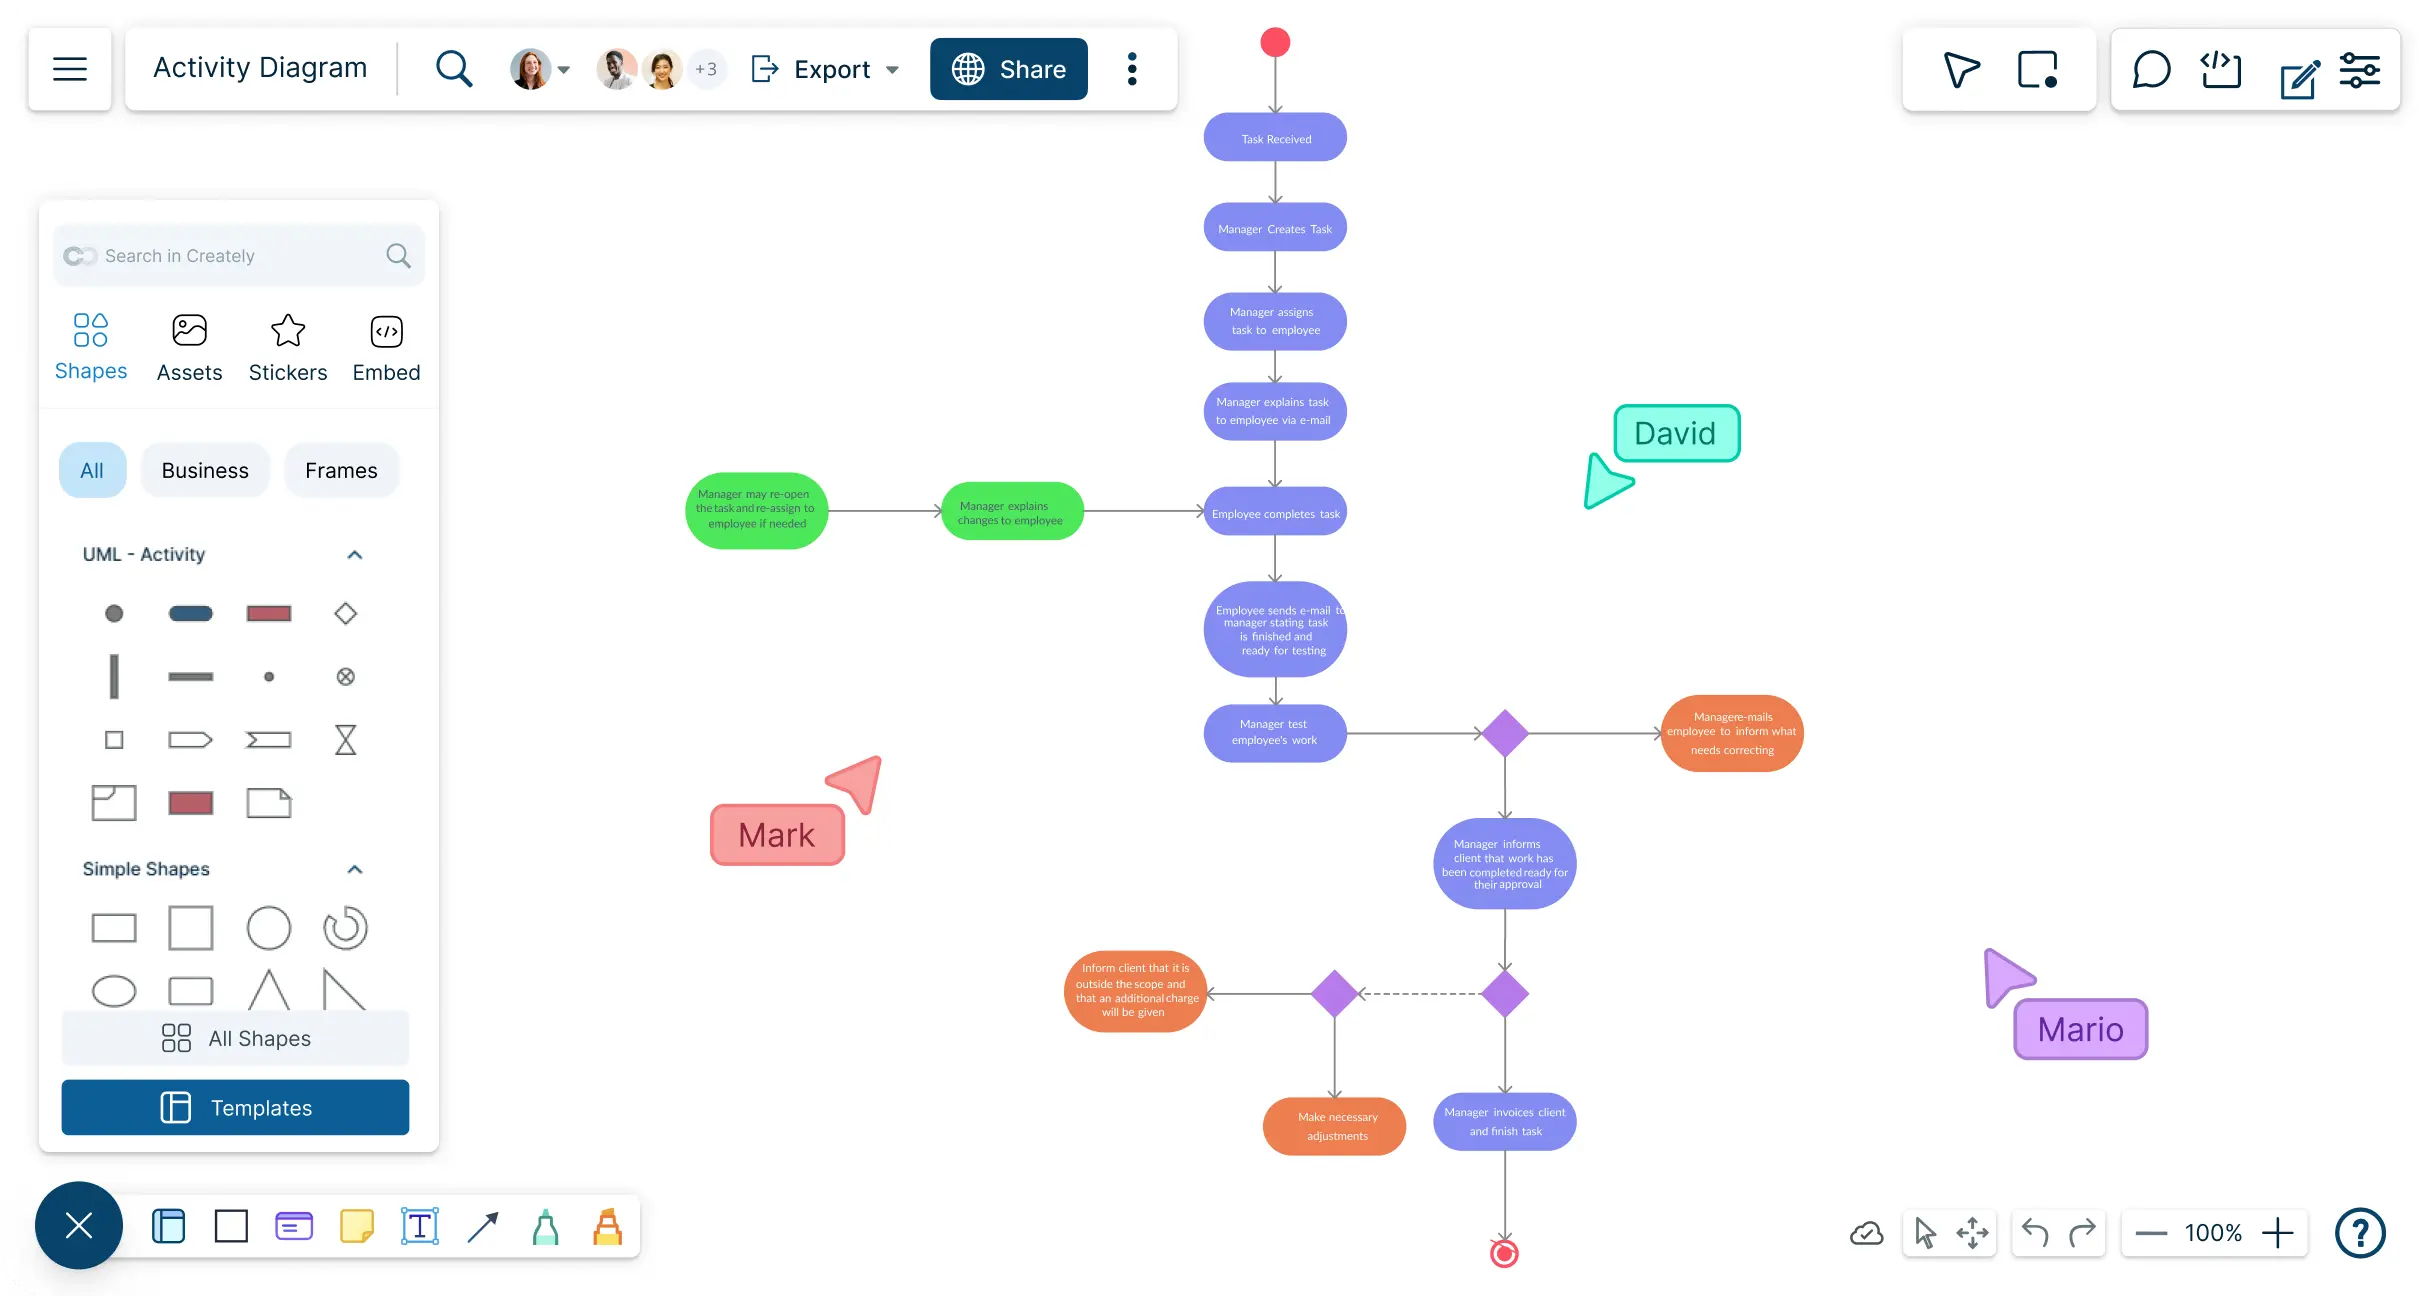
Intuitive activity diagram maker to visualize complex activity flows. Coordinate efforts with your team & develop a shared understanding of systems behavior.
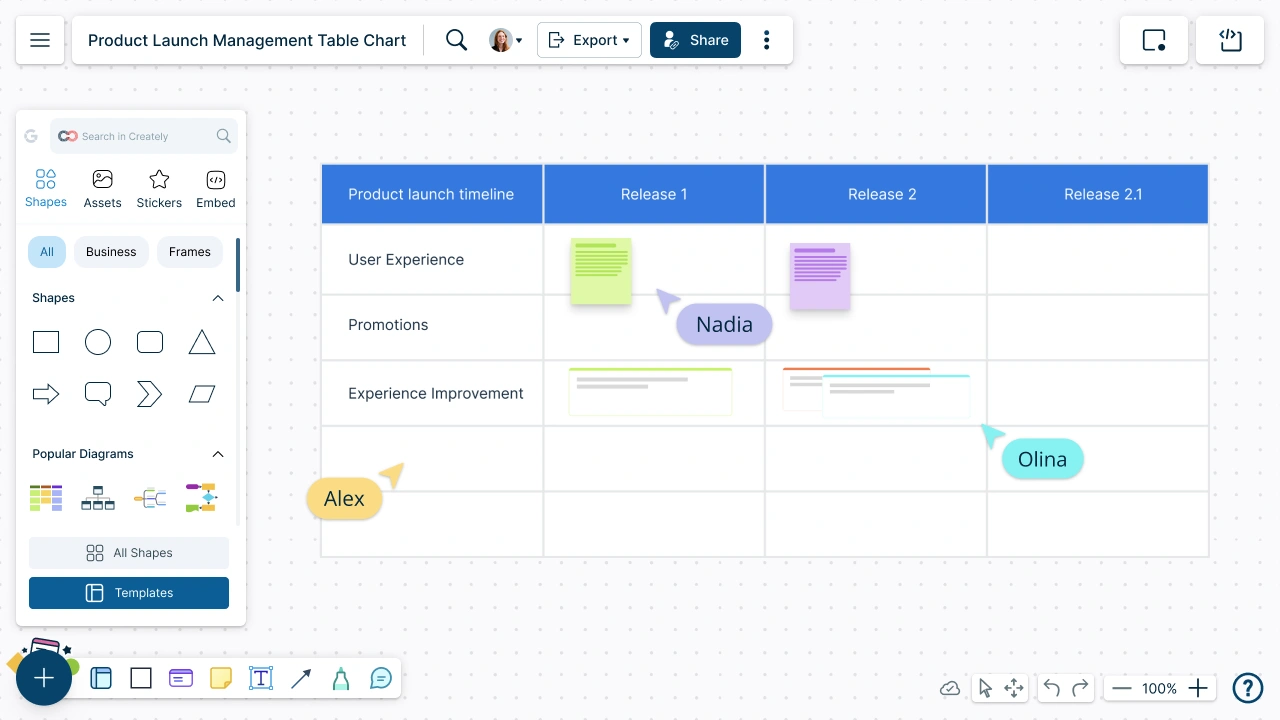
Create visually stunning table charts to organize your information and data with Creately’s table creator. Arrange your data in meaningful ways and interact with them to make effective data-driven decisions.
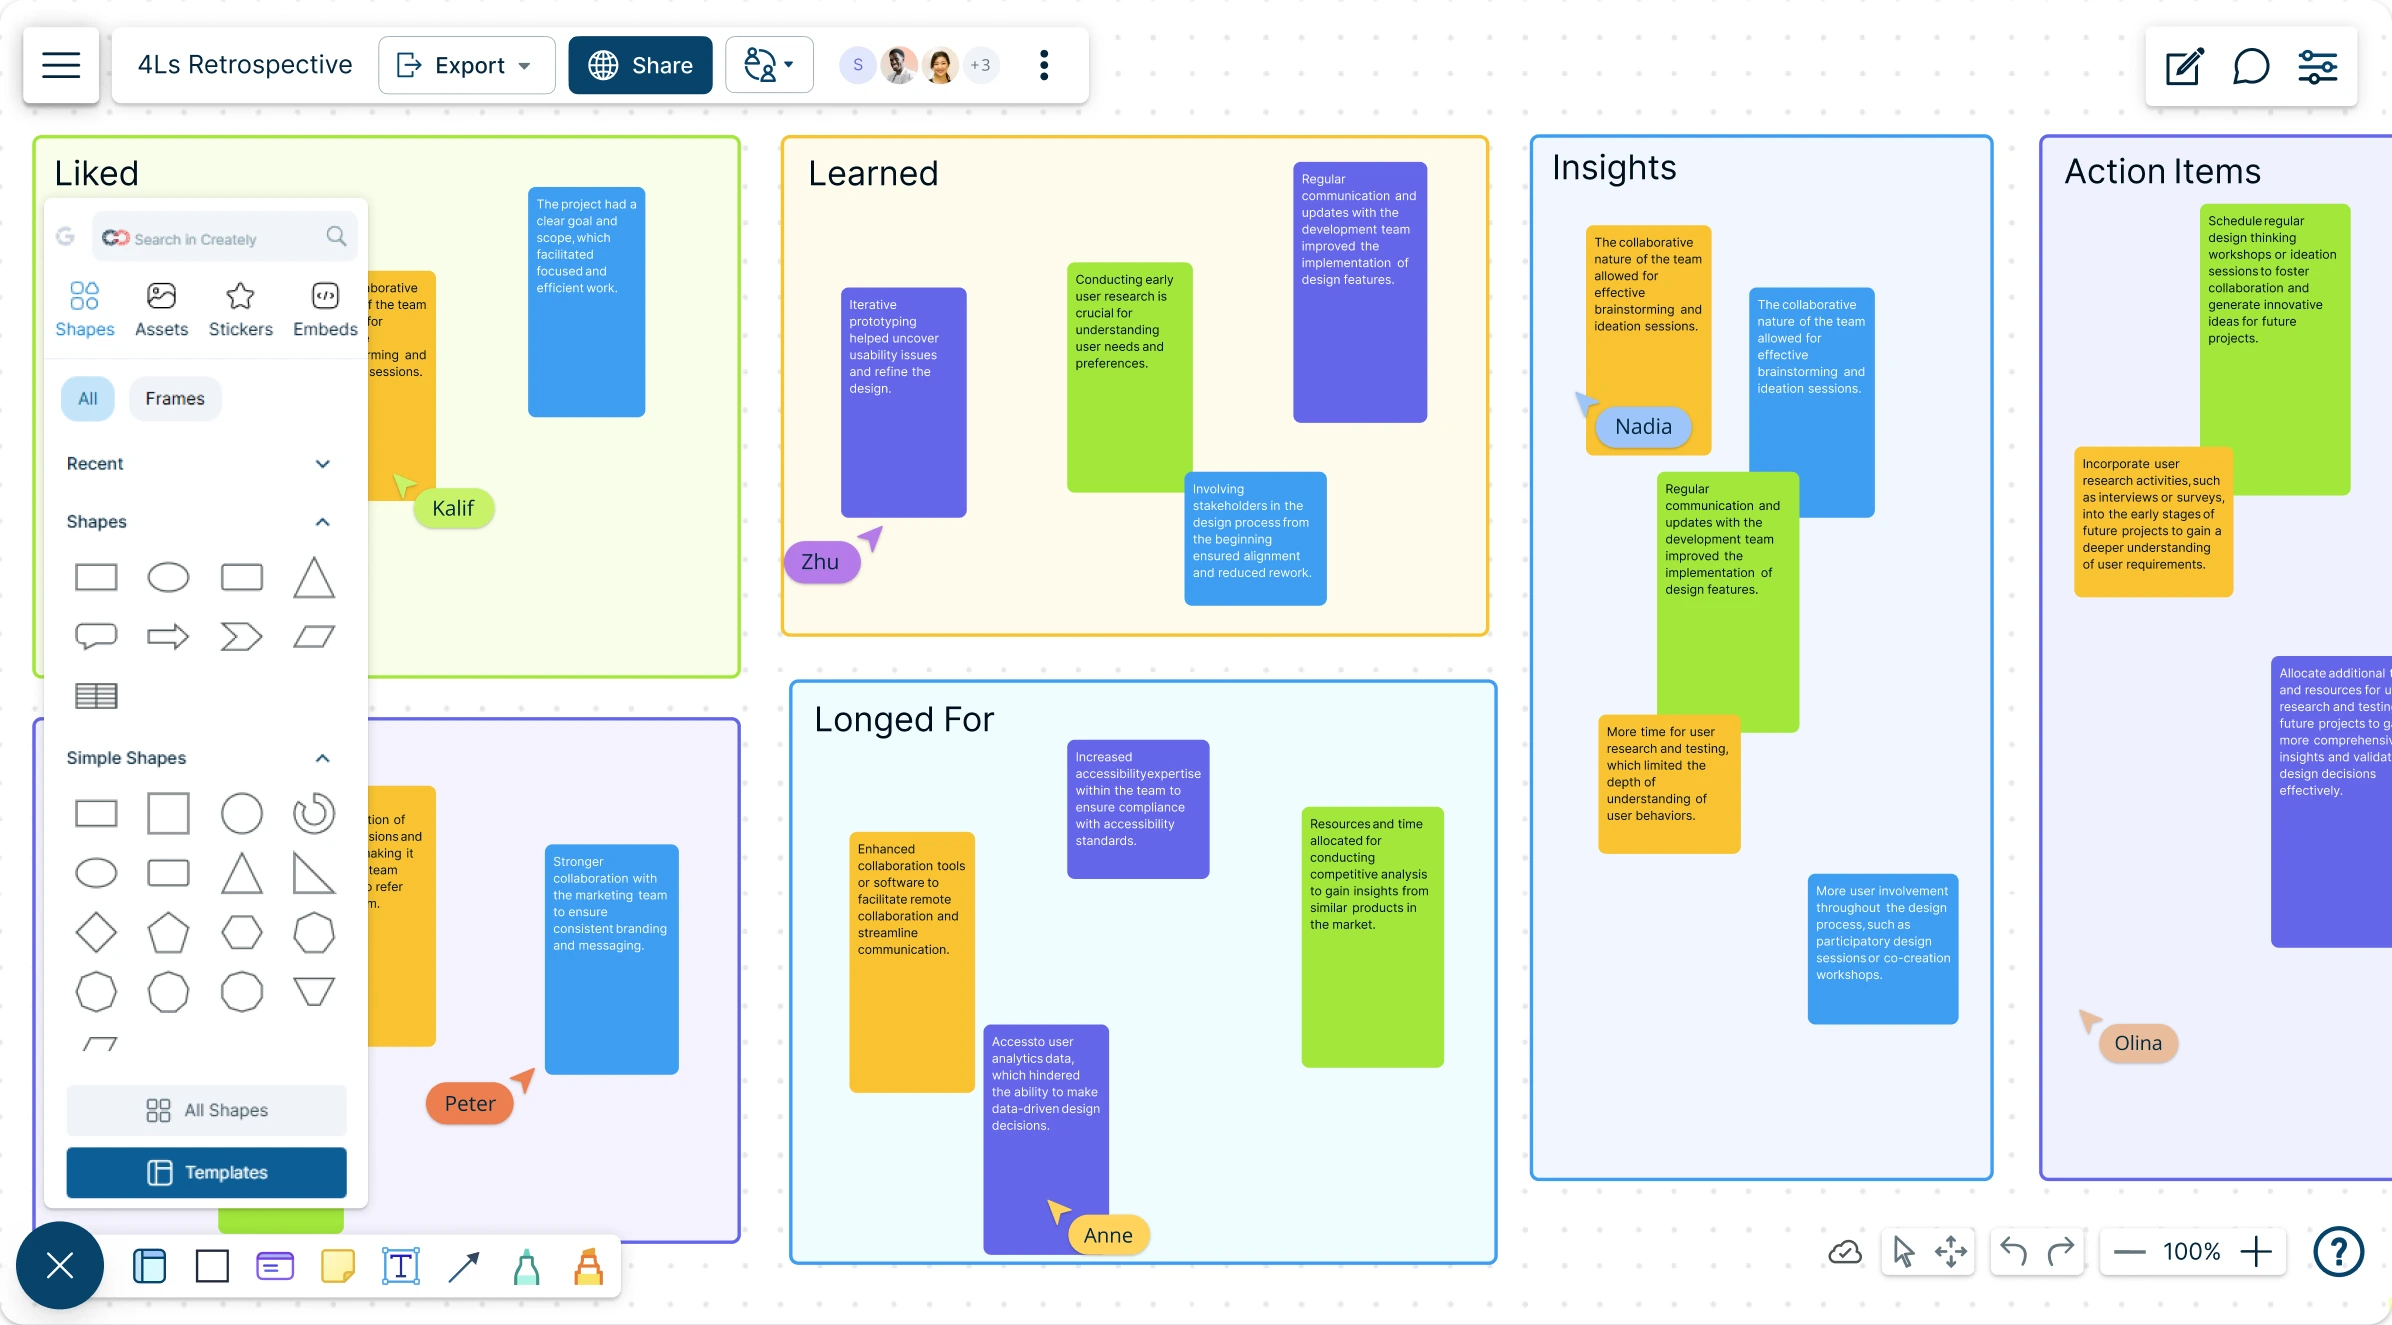
Run your 4Ls retrospective with Creately’s professionally-made templates to visualize, plan, and organize meaningful team reflections.
Make your meeting agenda online using Creately’s ready-to-use templates to visualize, plan and organize impactful meetings.
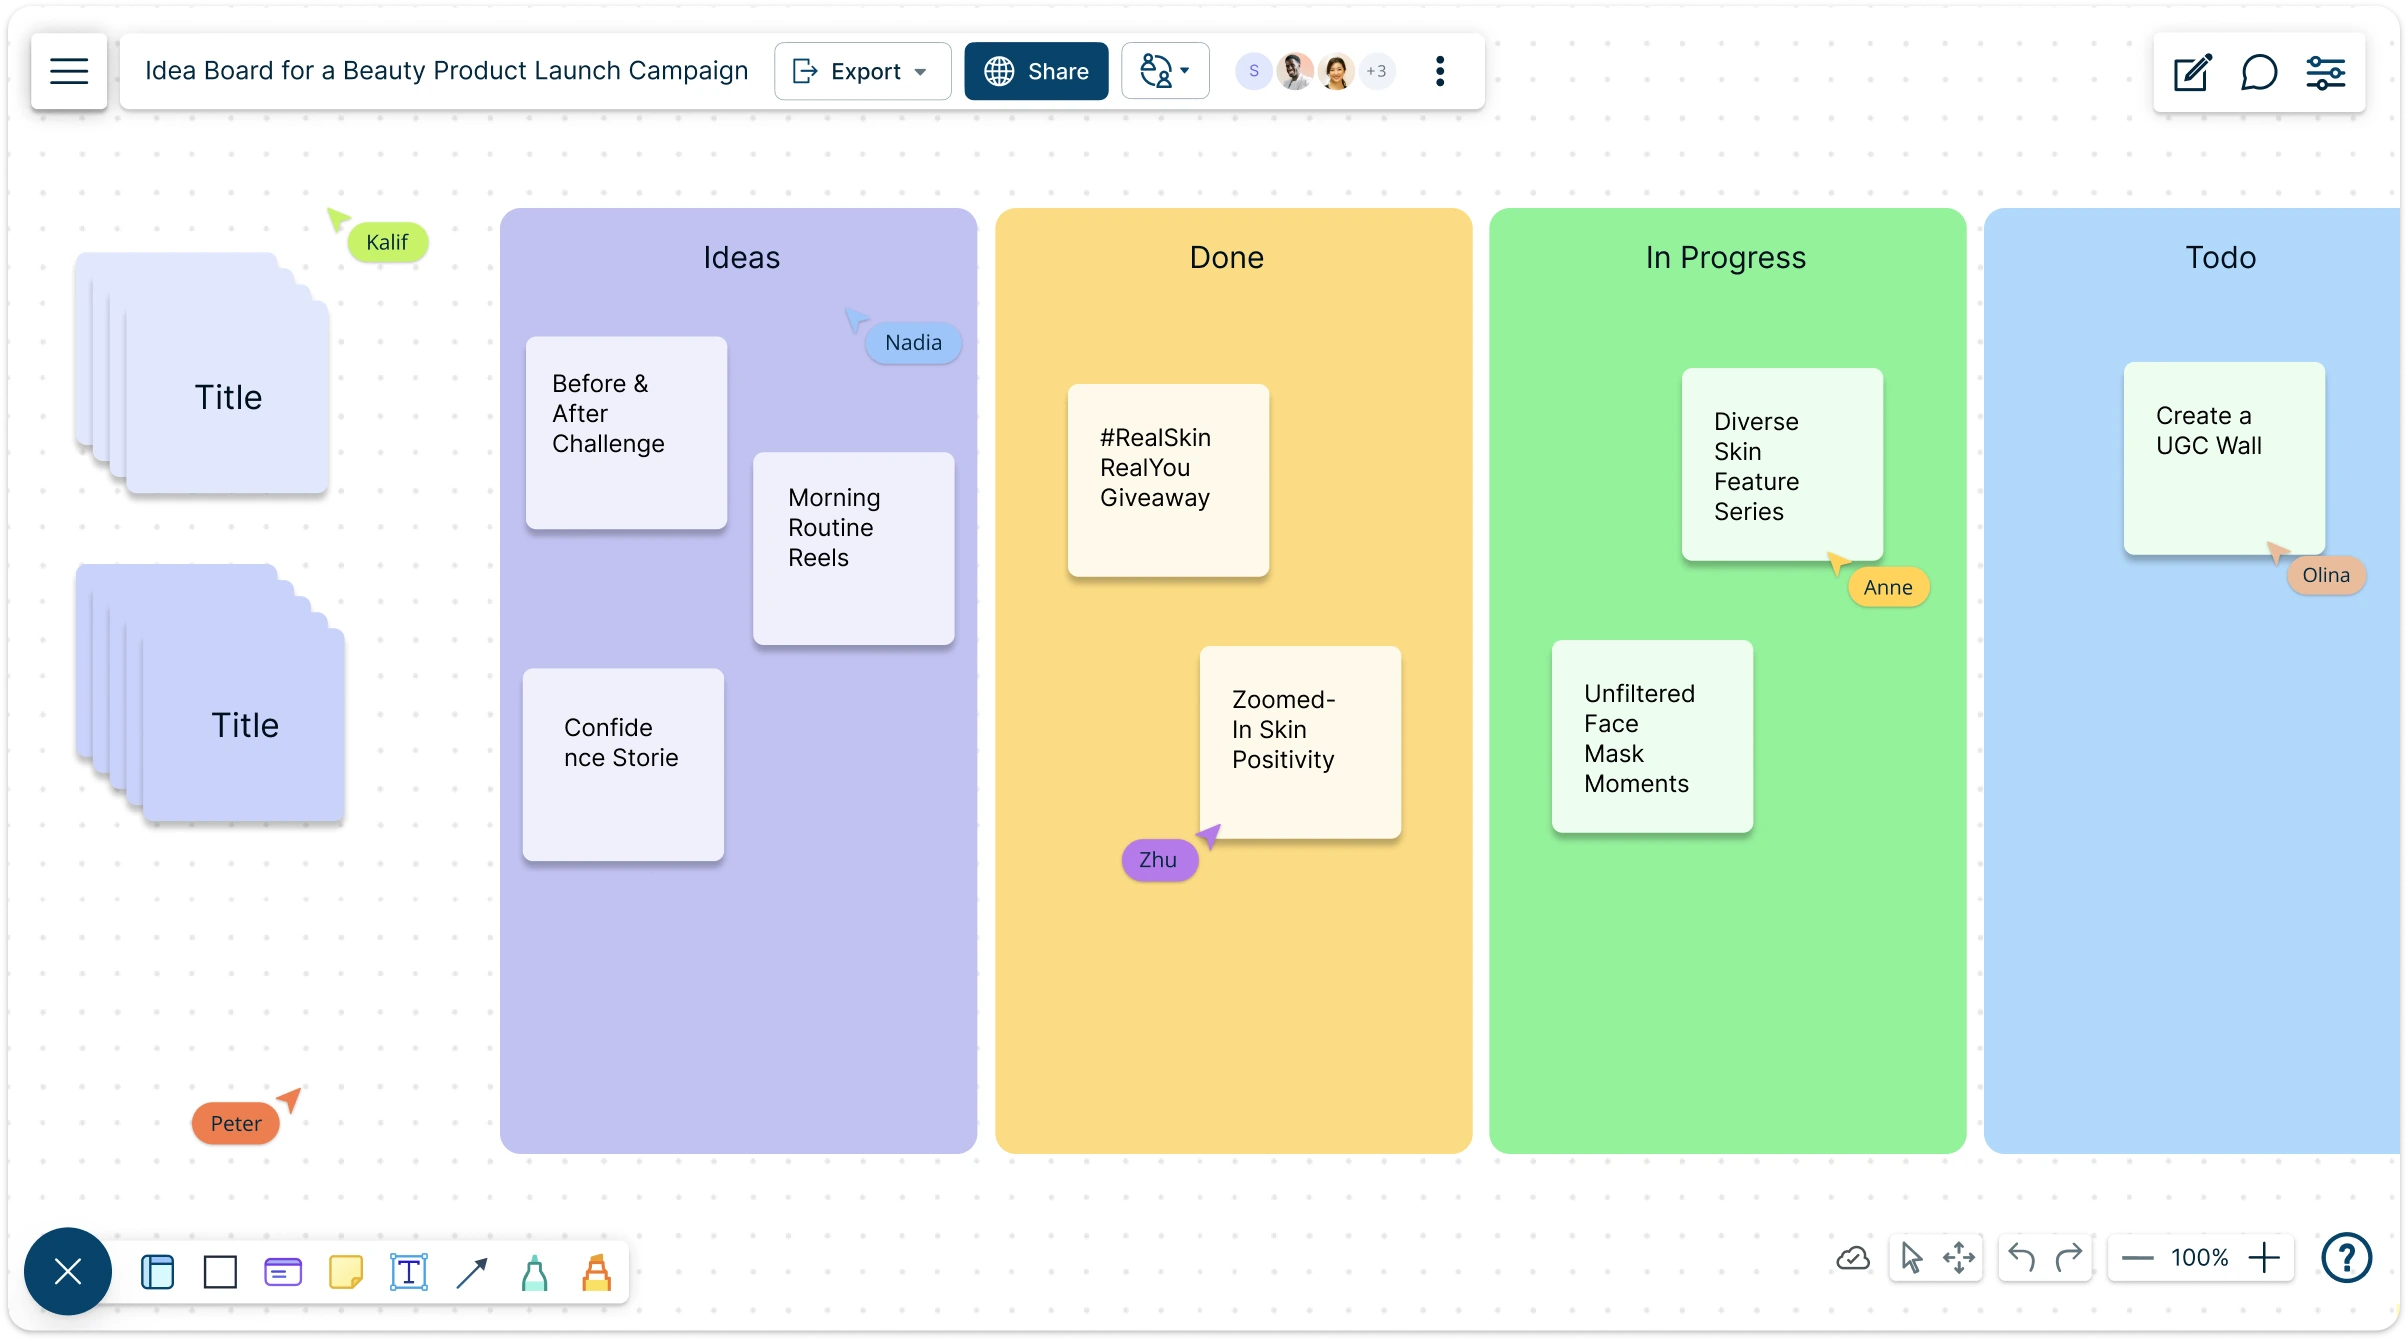
Brainstorm, organize, and refine your best ideas to bring your creativity to life with a collaborative digital idea board template.
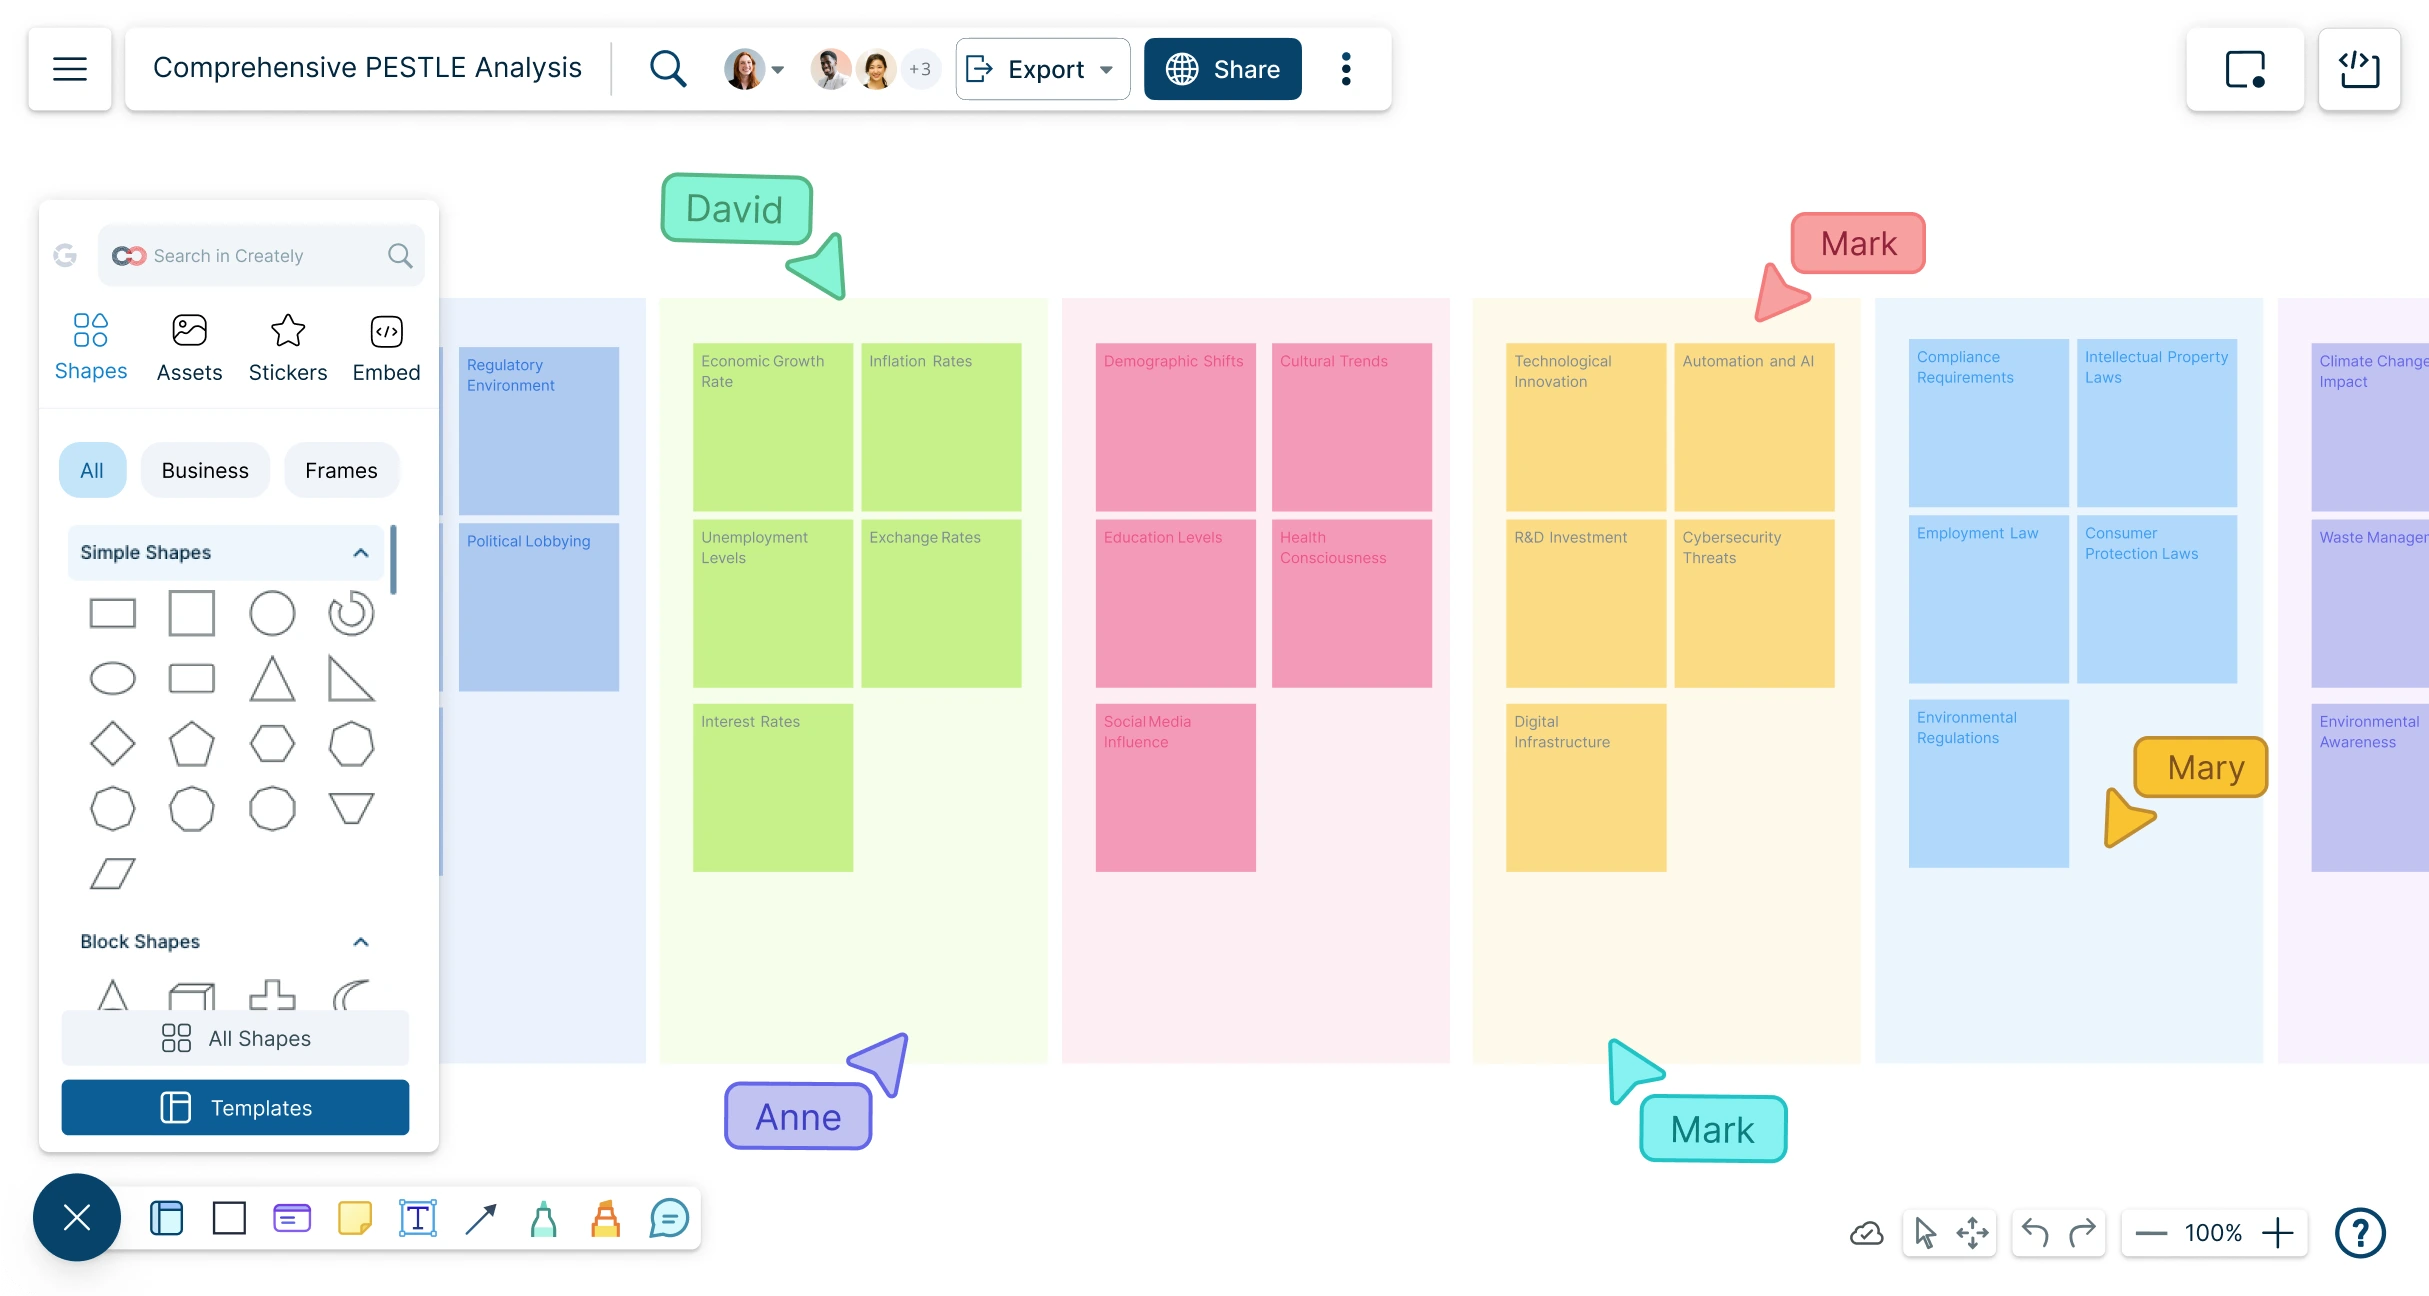
Creately’s PESTEL Analysis Generator instantly identifies key external factors, offers smart suggestions, and enables easy team collaboration—no manual work required.
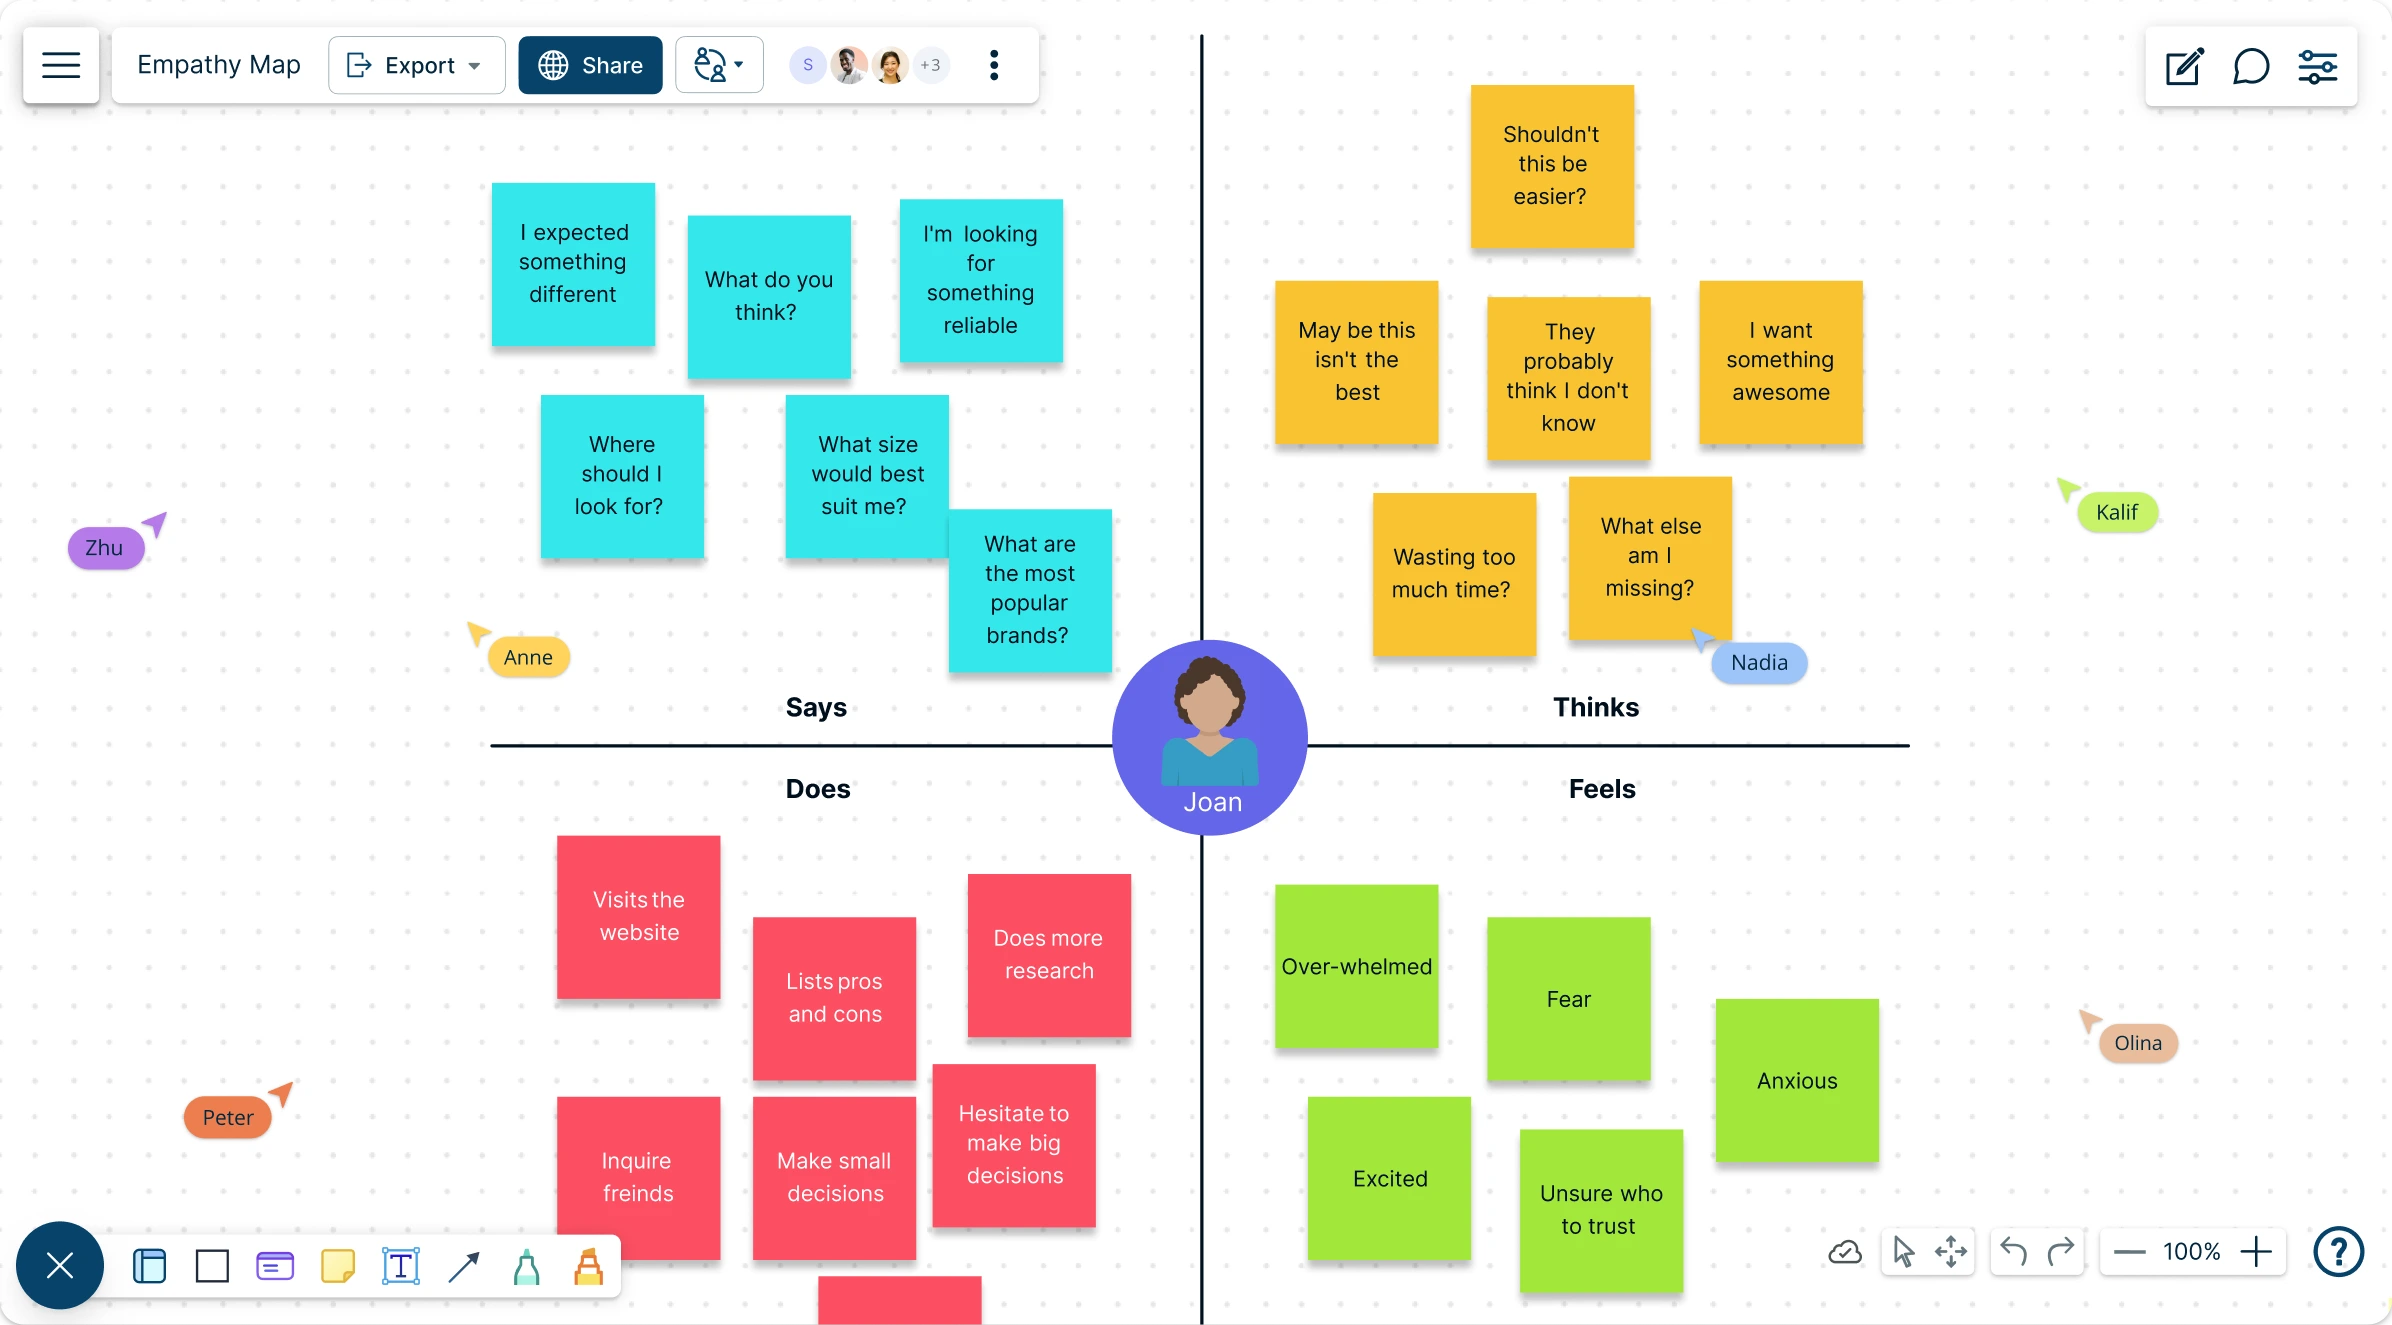
Use Creately’s empathy map template to gain a deep understanding of the user attitudes, behaviour, experiences, and needs.
Visualize your workflows and processes to identify operational bottlenecks and areas for improvement with Creately’s Flowchart Creator.
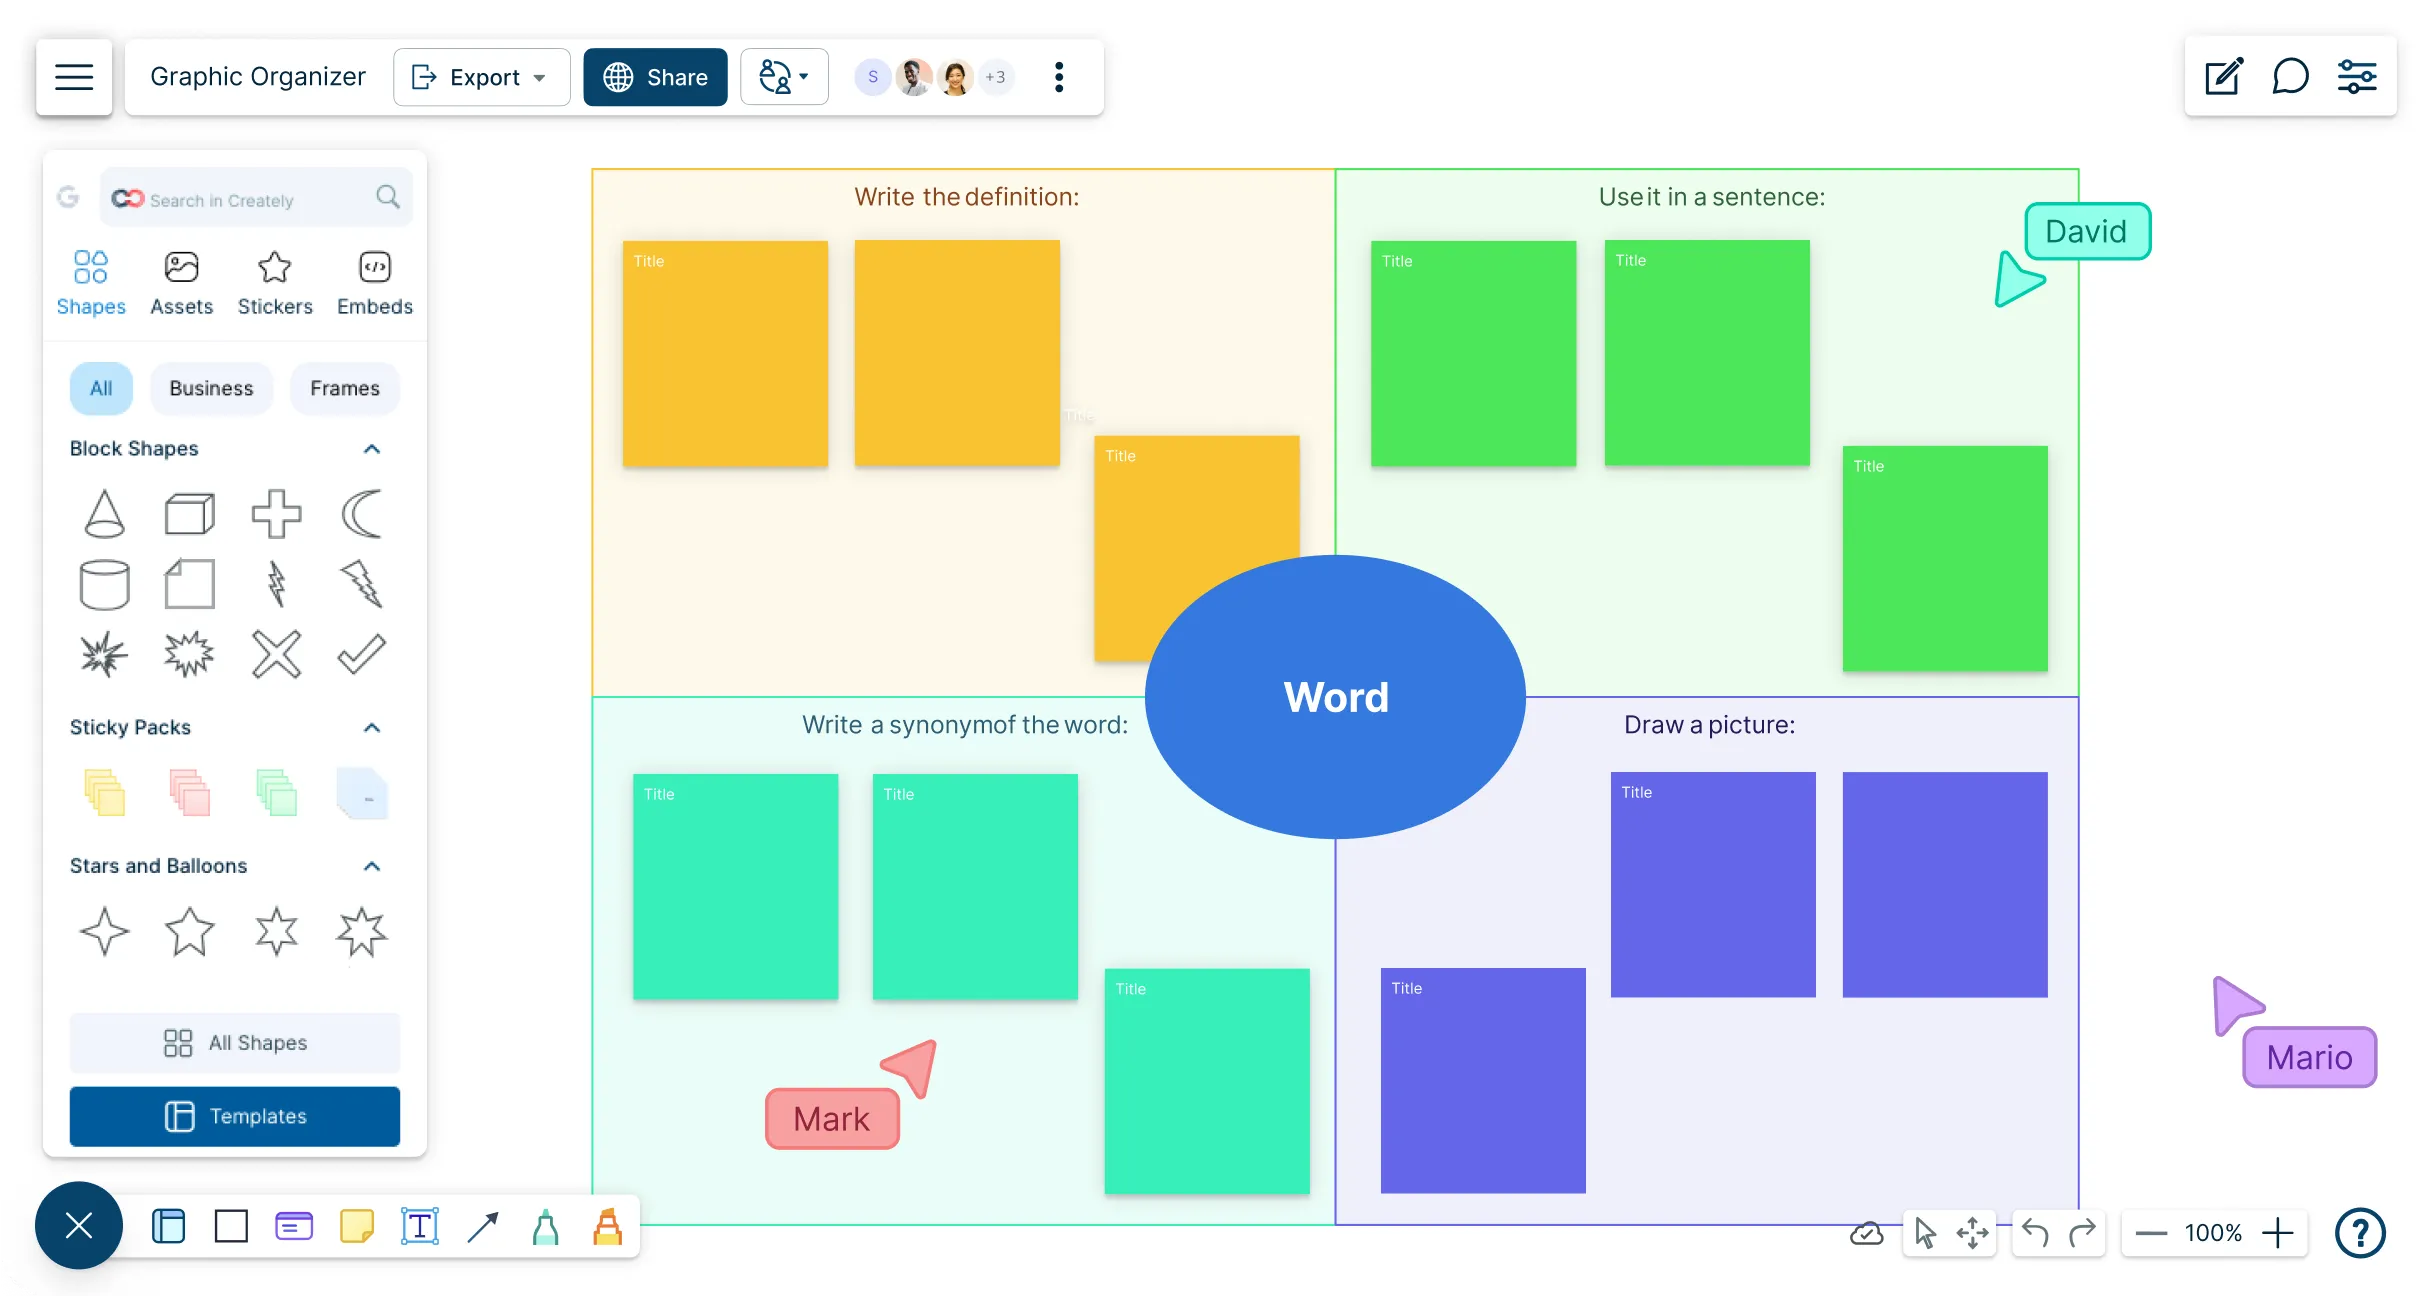
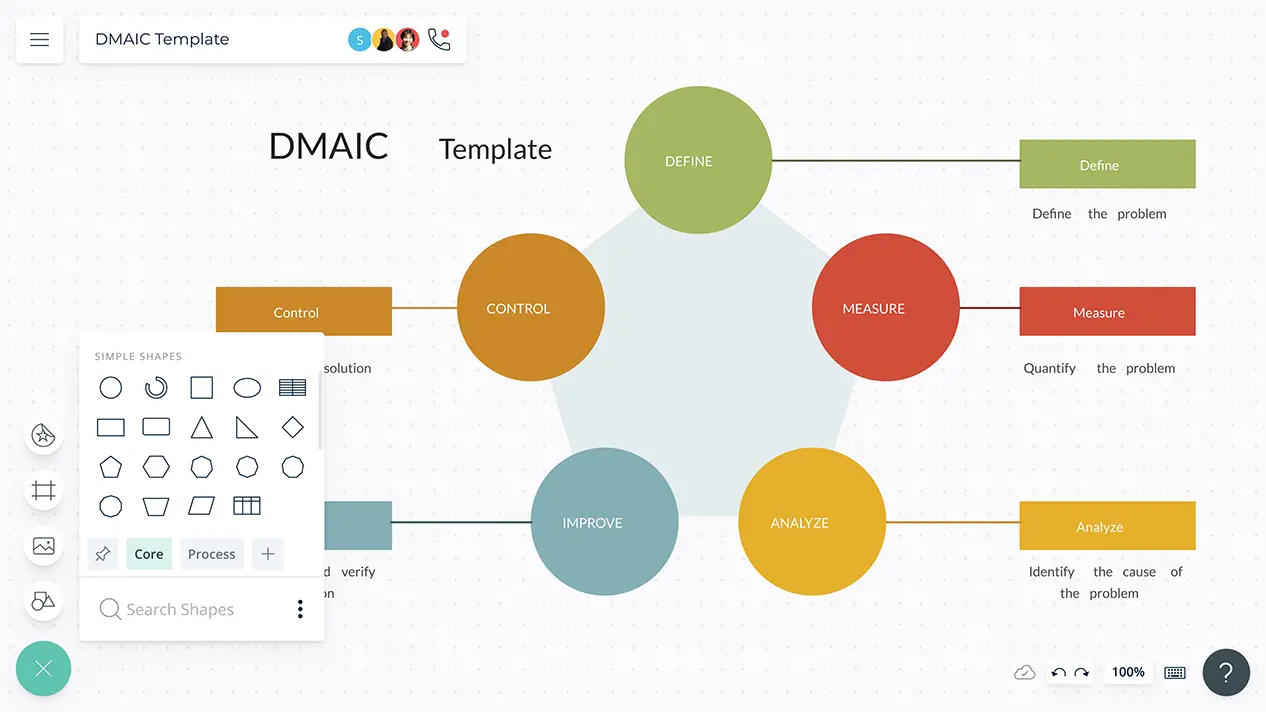
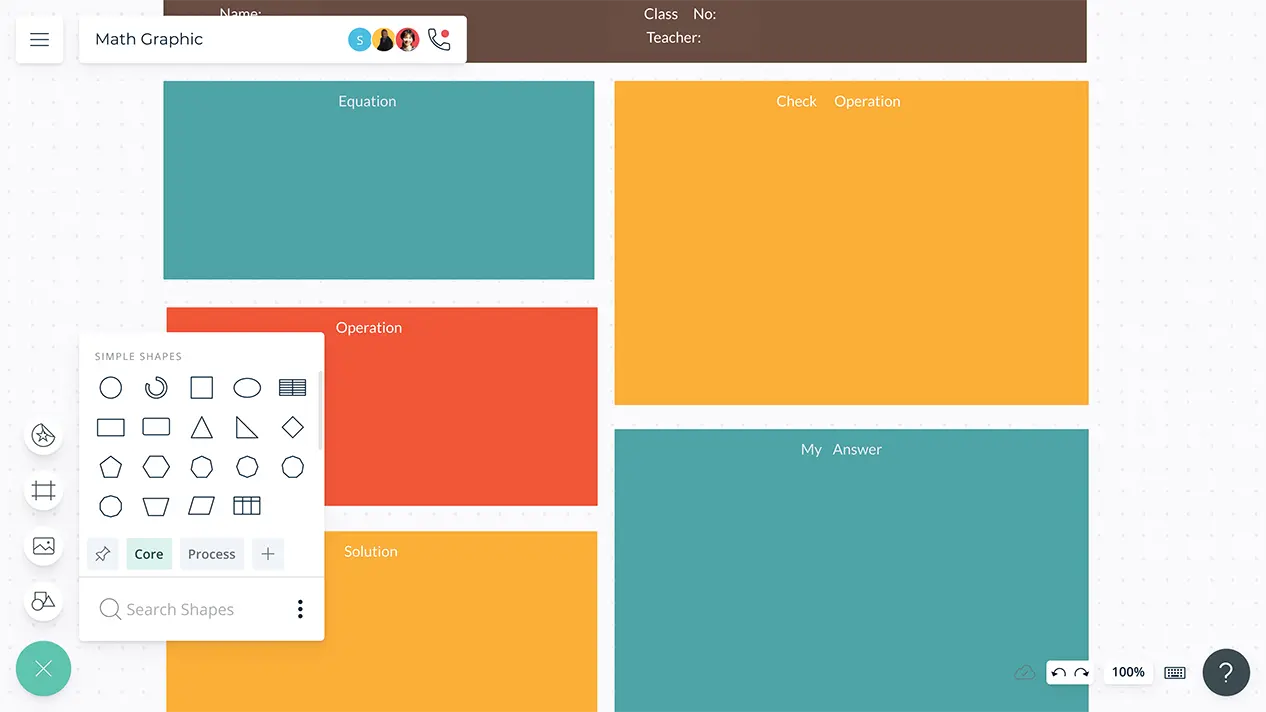
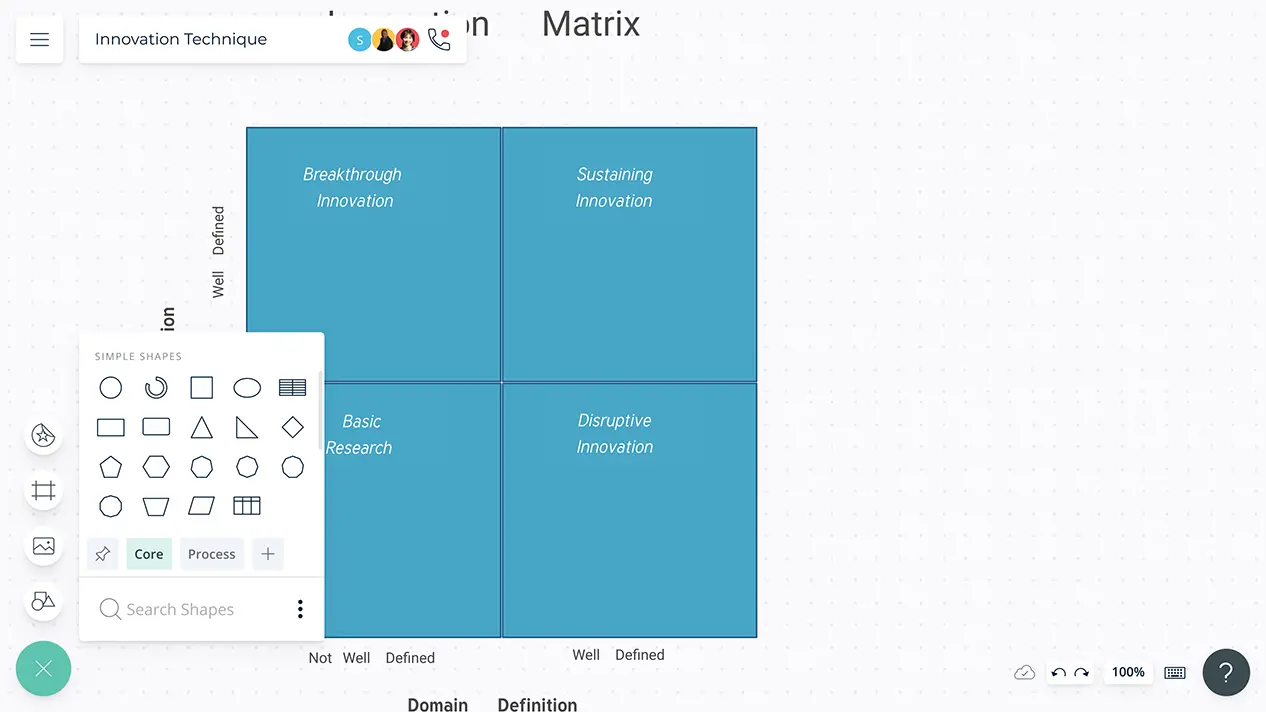
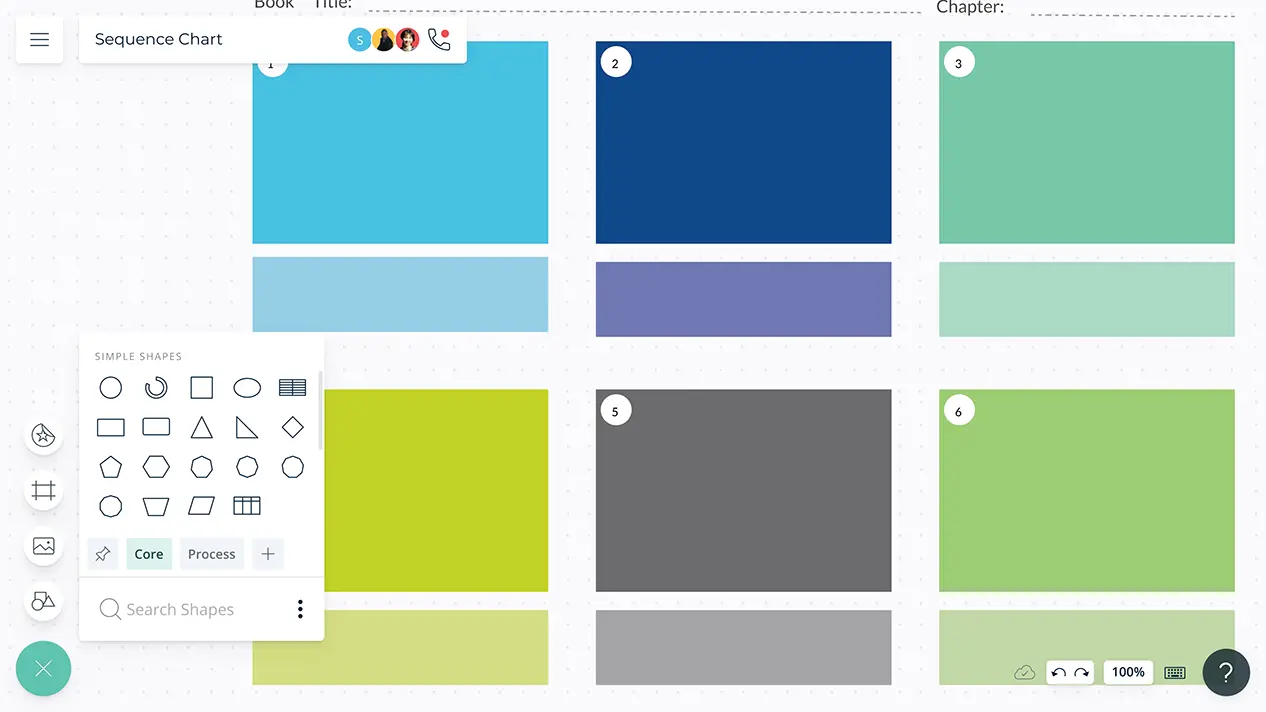
Intuitive graphic organizer software designed to bring your graphic organizer ideas into reality, making learning more interesting and engaging with interactive, visually stunning graphic organizers.
Visualize your decisions from anywhere using Creately’s decision tree diagram maker.
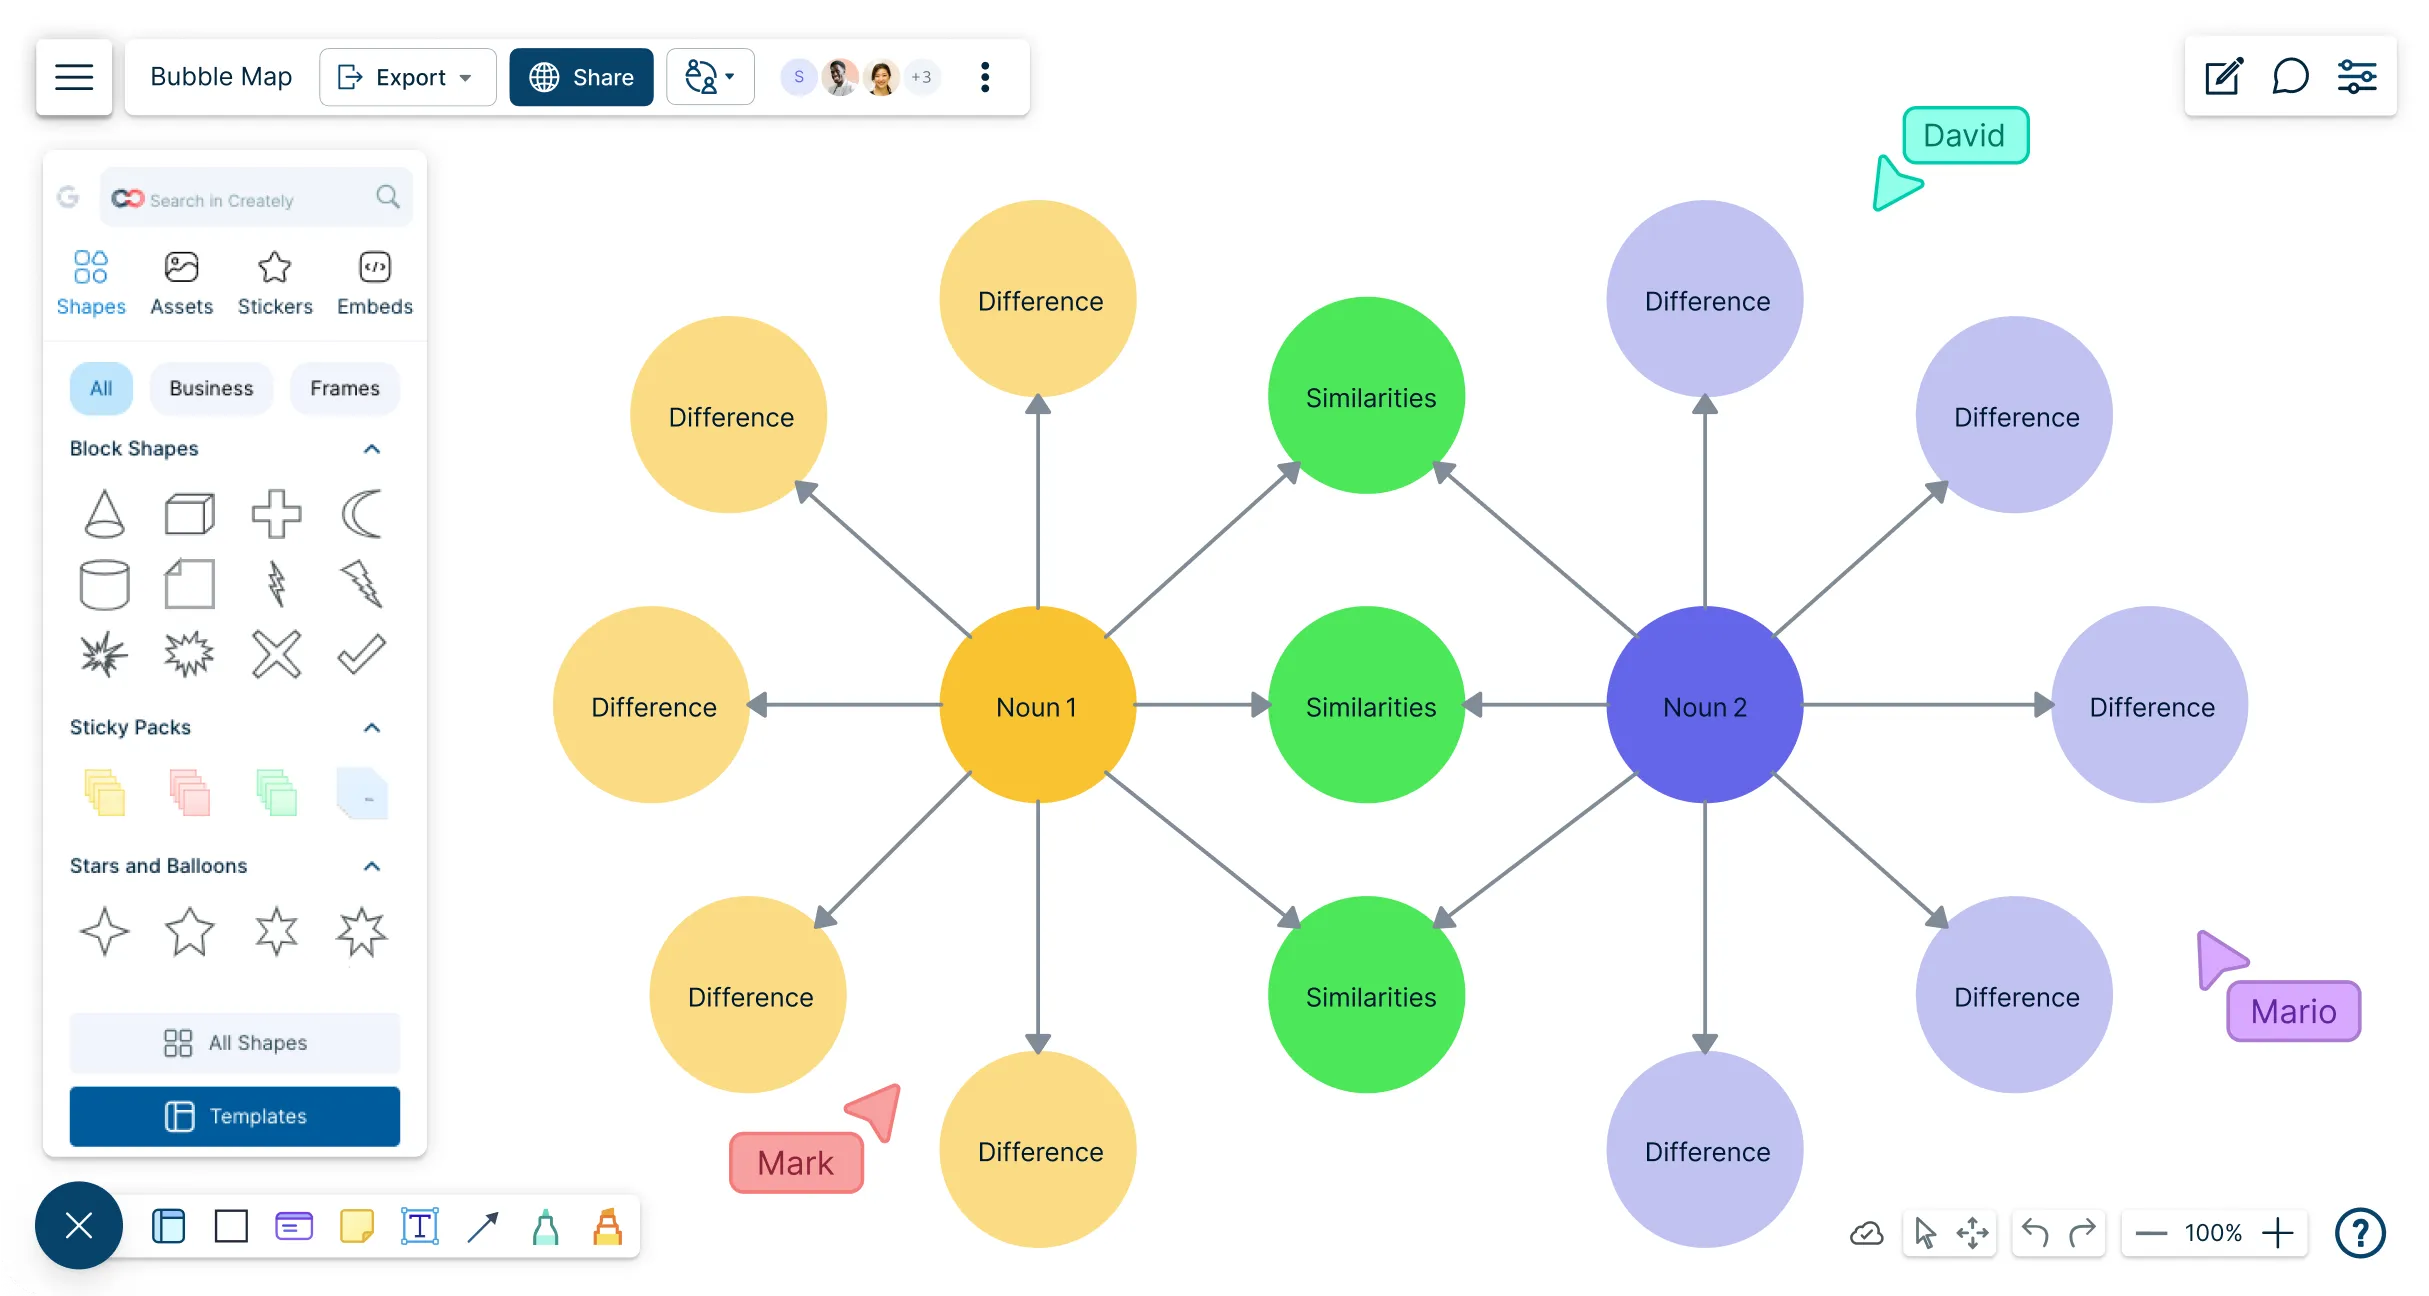
Visualize ideas, organize information, and boost creativity with Creately’s online bubble map maker. Create functional and creative bubble map that turn your thoughts into clear, actionable plans.
Our easy genogram creator allows you to easily visualize the family structure and the relationships between family members. This allows you to quickly identify hereditary patterns and psychological factors that affect relationships.
A single, connected workspace to bring together data, people, and research to streamline counseling and social work assessment.
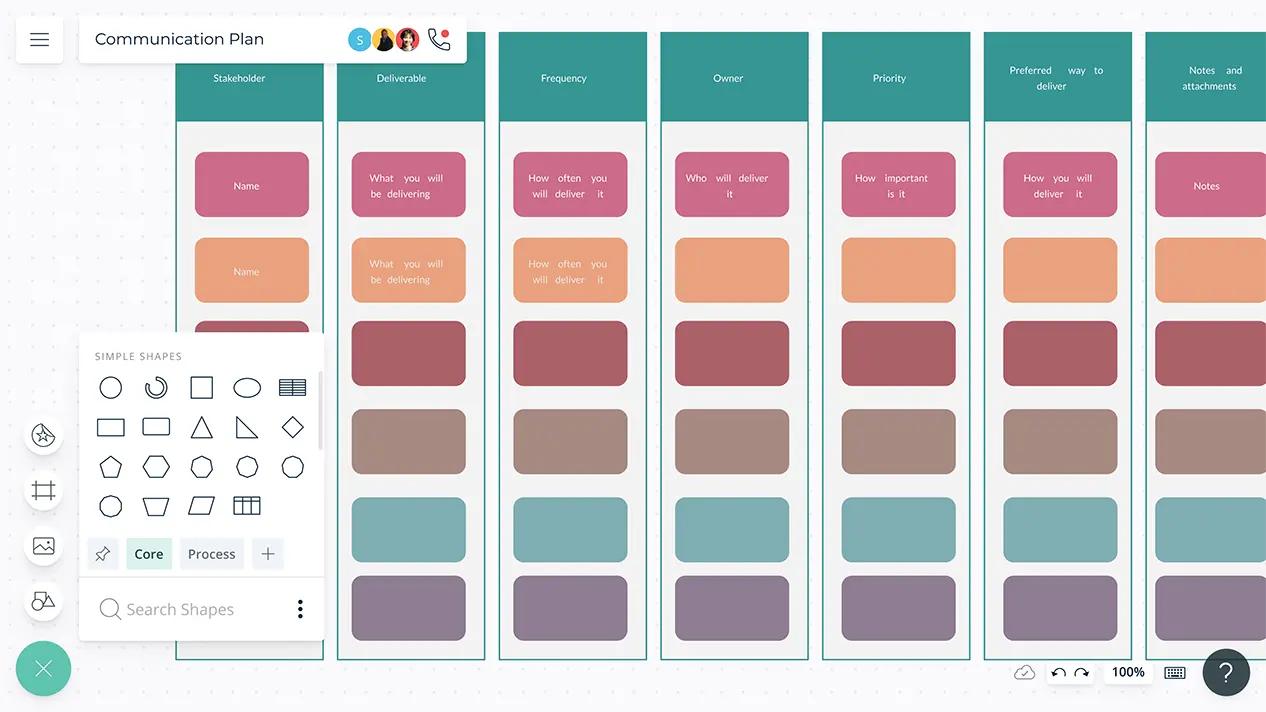
Plan and promote a communication plan for your brand or business that effectively delivers the message to the target audience.
Visually map out ideas and collaborate with team members to organize and structure information, innovations and processes.
Intuitive canvas and visual tools for capturing and organizing your ideas and projects effortlessly.
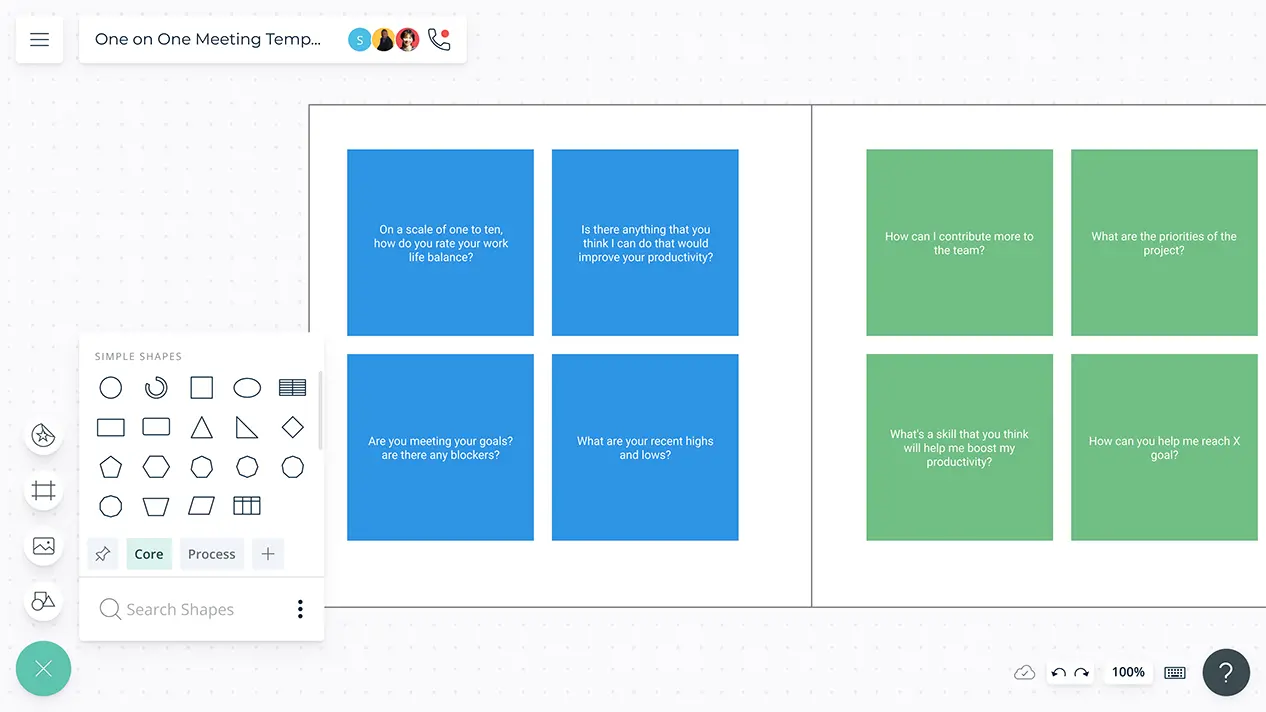
Maintain consistency across your team during one-on-one meetings & effectively understand their priorities, challenges, & professional development needs.
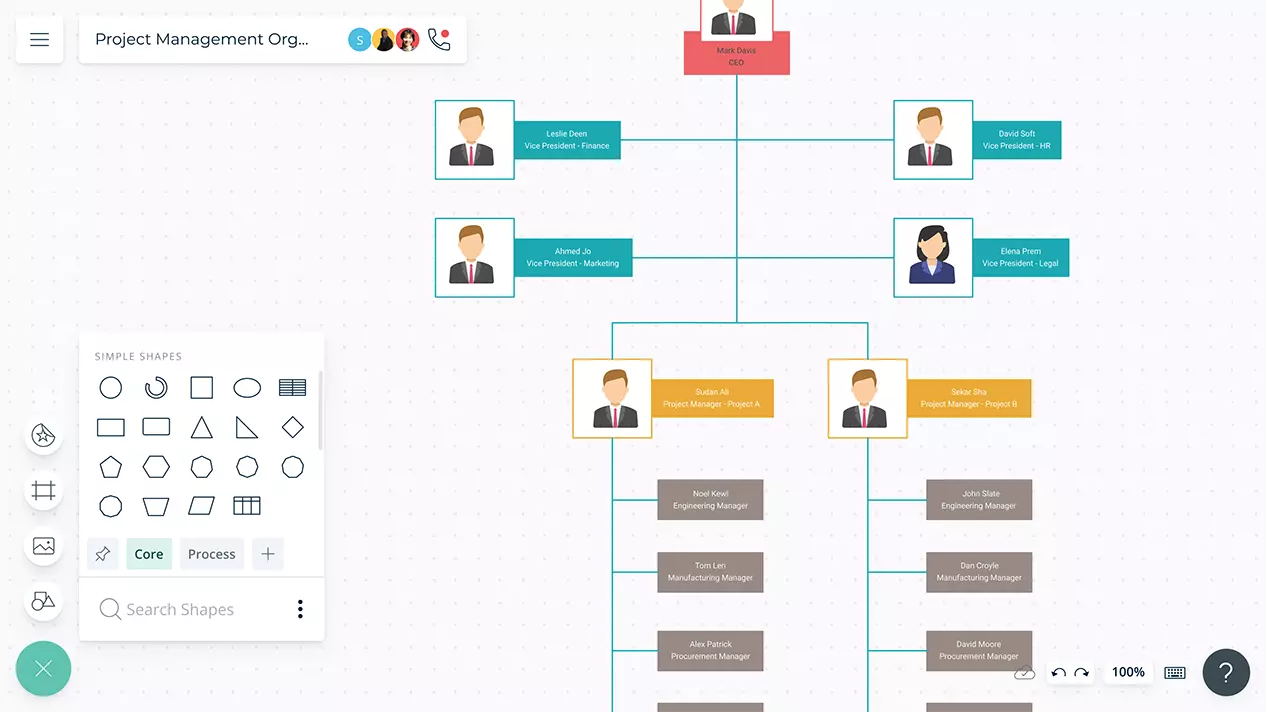
Visualize project roles, responsibilities, and employee relationships with editable online templates.
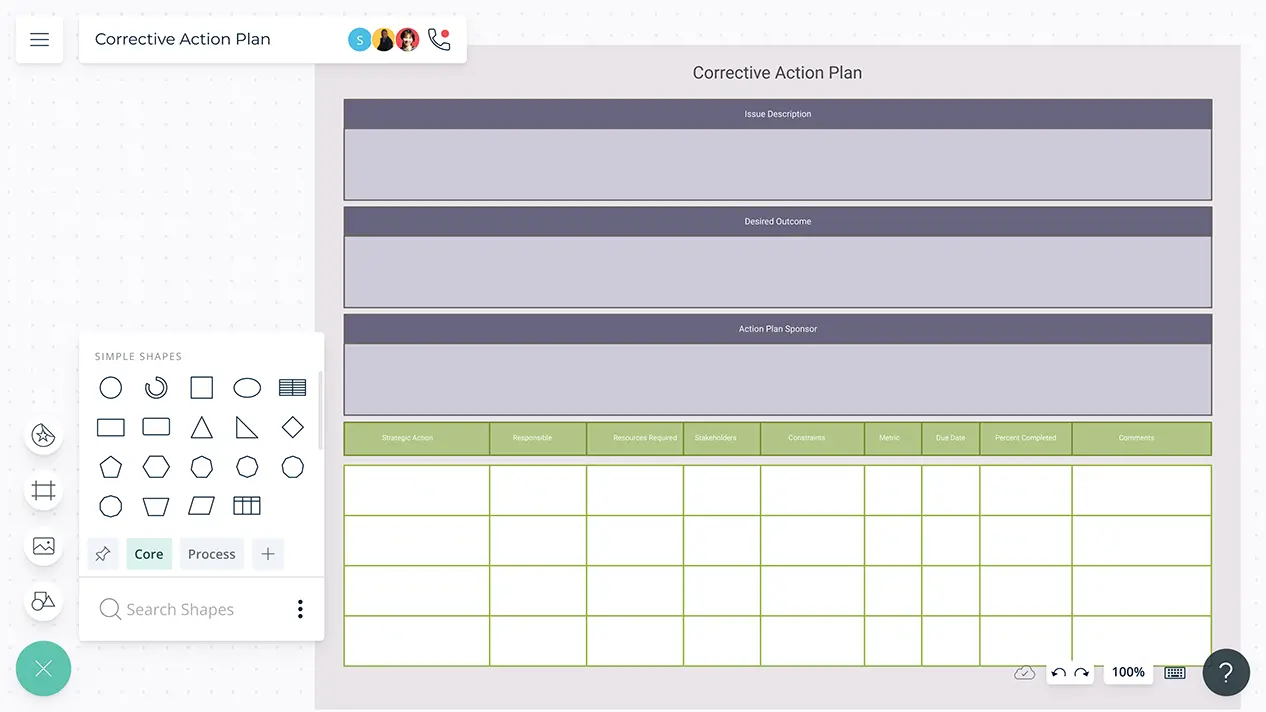
Improve inefficient processes in your organization by identifying root causes of problems and successfully mapping out corrective actions.
Conduct collaborative brainstorming sessions to unlock team creativity and generate deep insights.
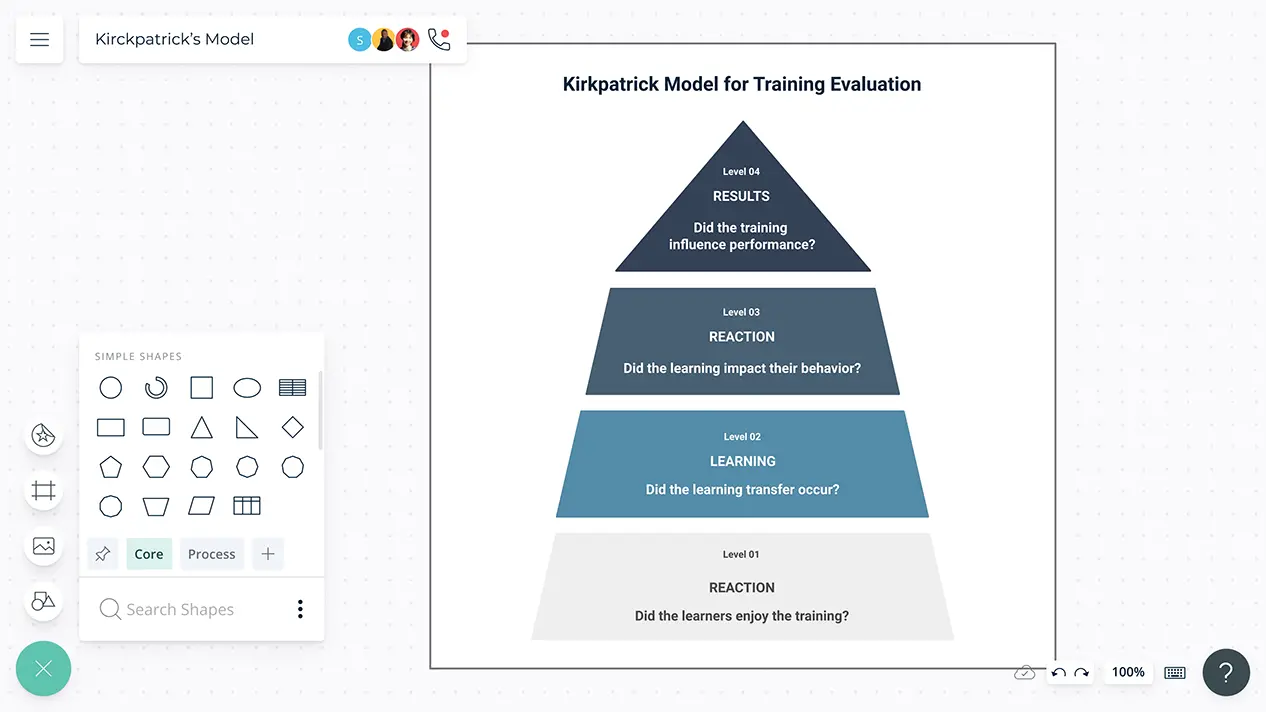
Evaluate organizational training programs and take measures to improve them.
Conduct seamless, collaborative problem-solving and brainstorming sessions online.
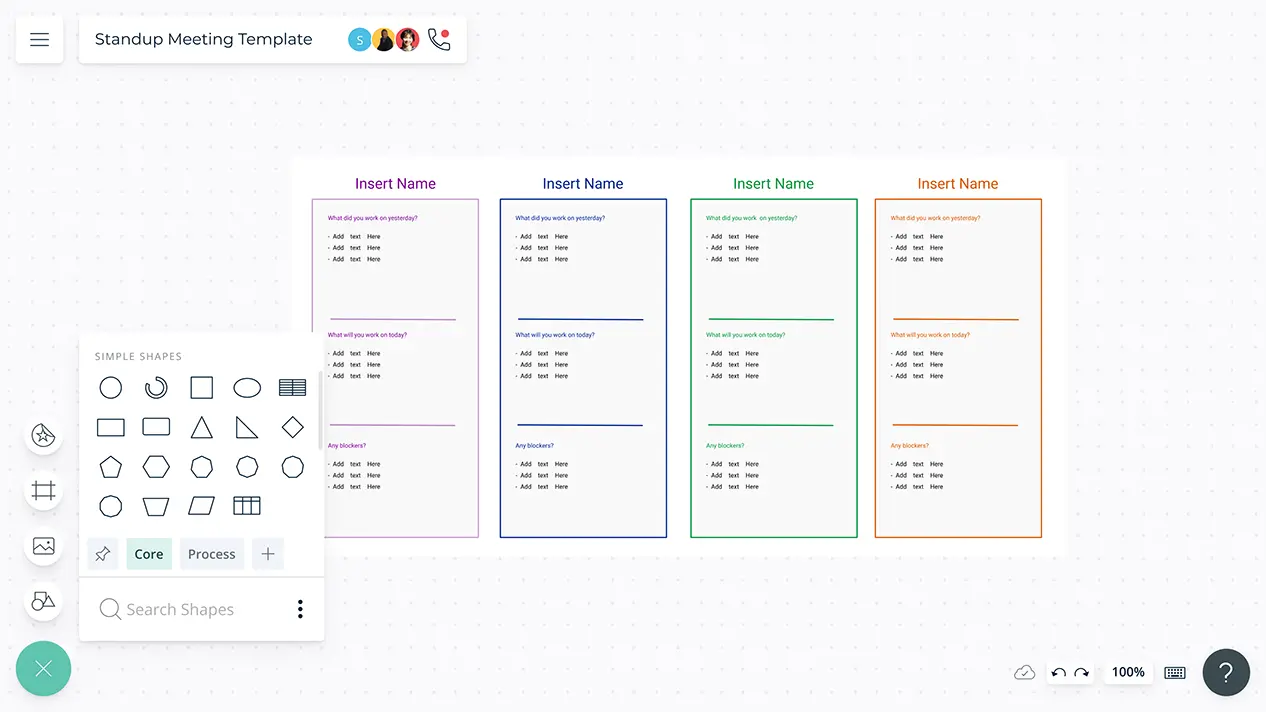
Conduct interactive team meetings that quickly take stock of project progress, identify blockers and plan next steps.
Identify inefficiencies in your processes and make needed improvements to increase productivity.
Easily clarify and simplify complex ideas, concepts, and lessons. Collaborate with colleagues and plan your lessons beforehand.
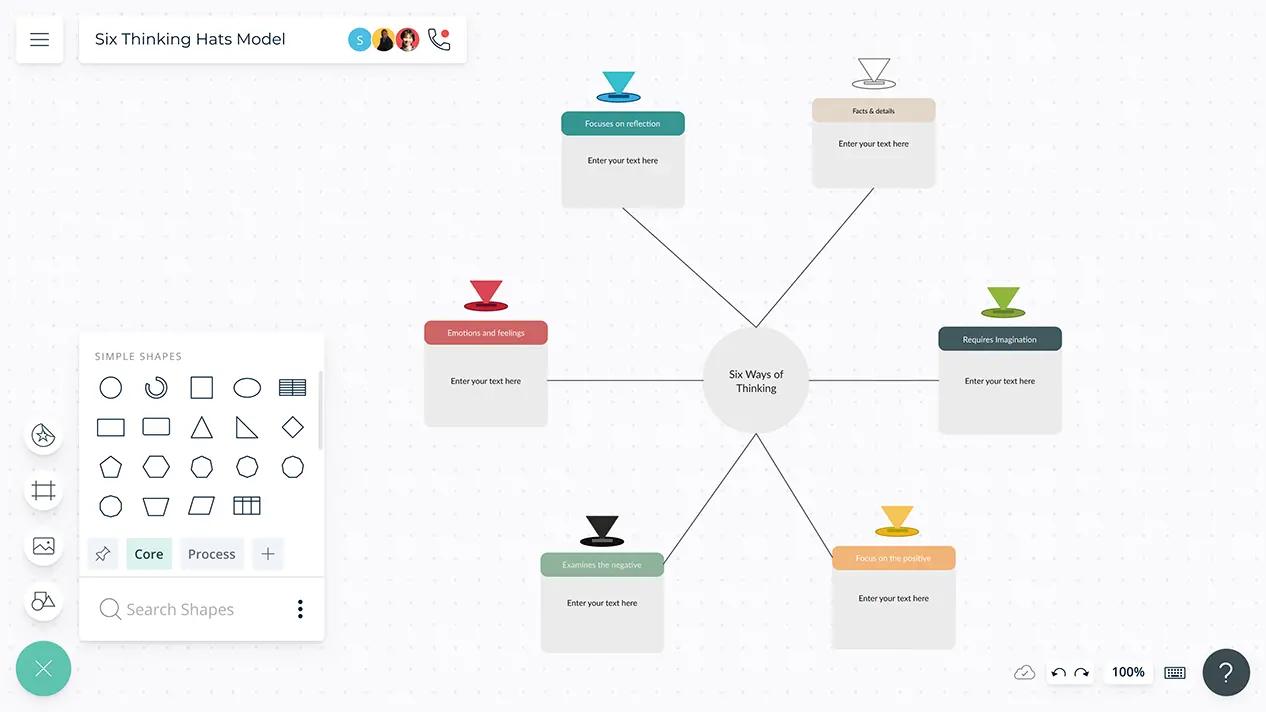
Powerful visual ideation tools to generate innovative ideas for products and services collaboratively.
Work with students on improving their comprehension of complex information.
Conduct rapid idea-generation sessions on Creately’s infinite canvas.
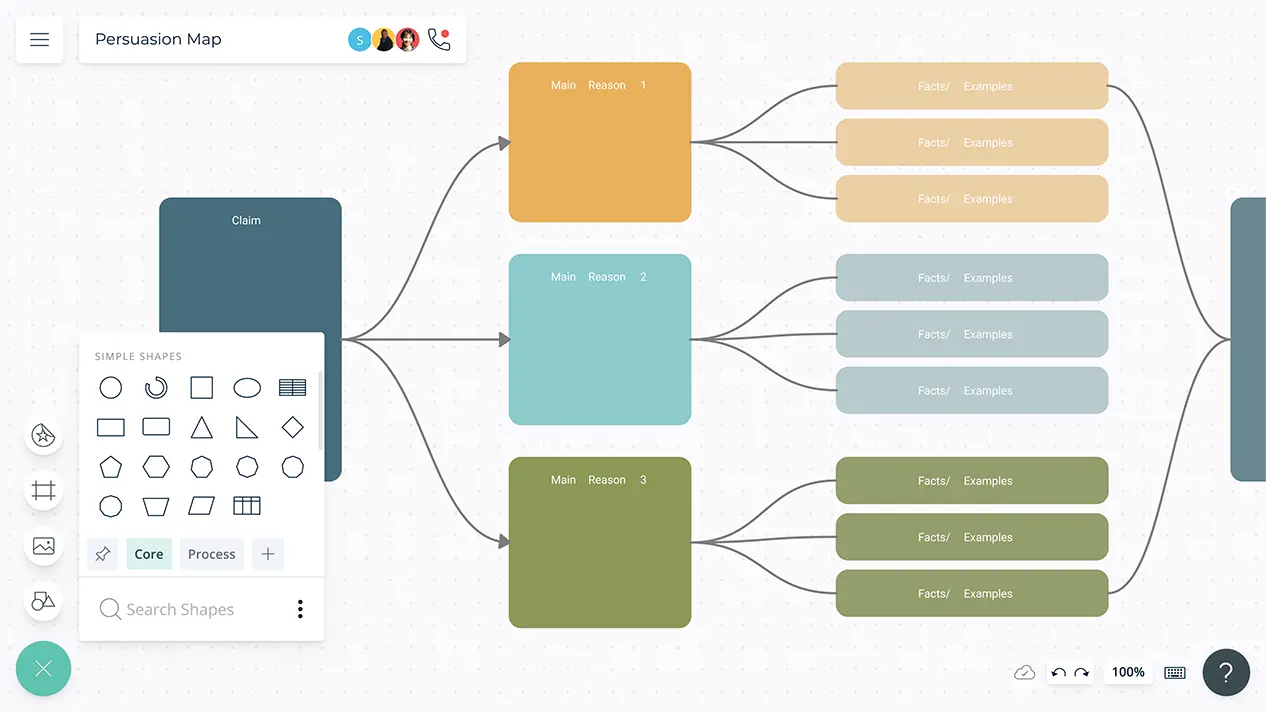
Visually map out your arguments for persuasive essays, debates or speeches.
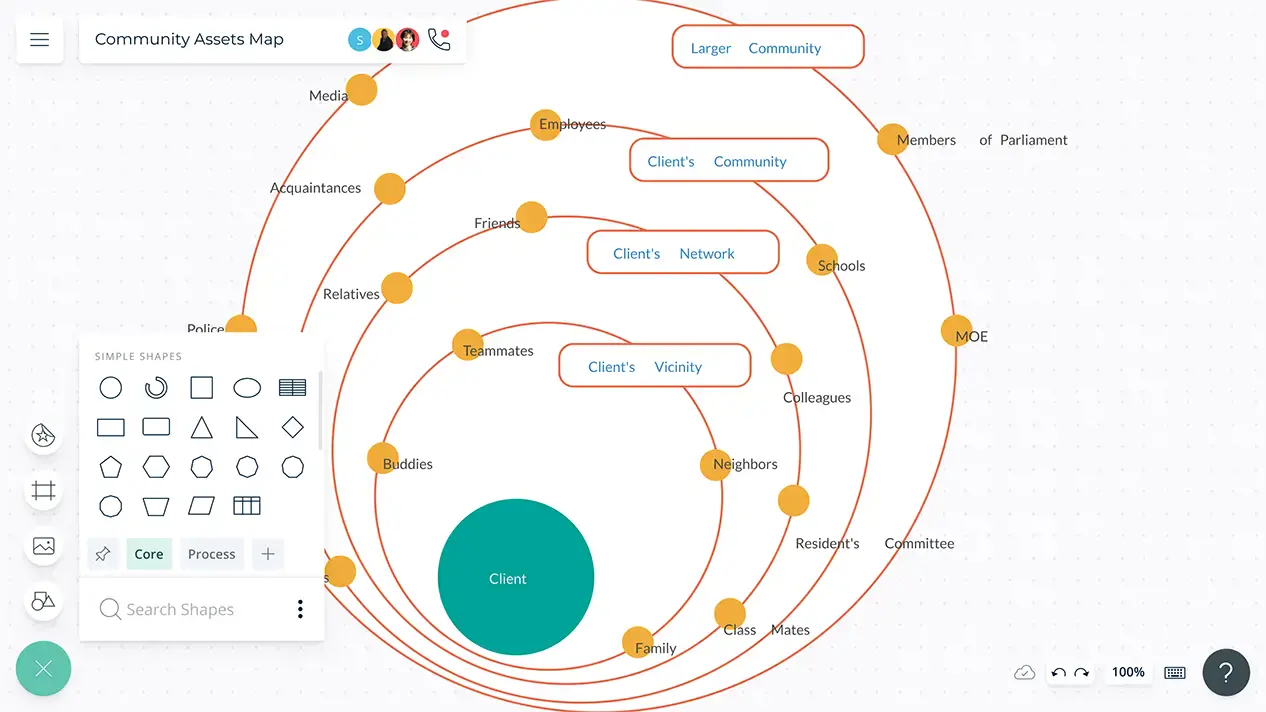
Visually depict the shared resources of a community and conduct a detailed analysis of how they are utilized.
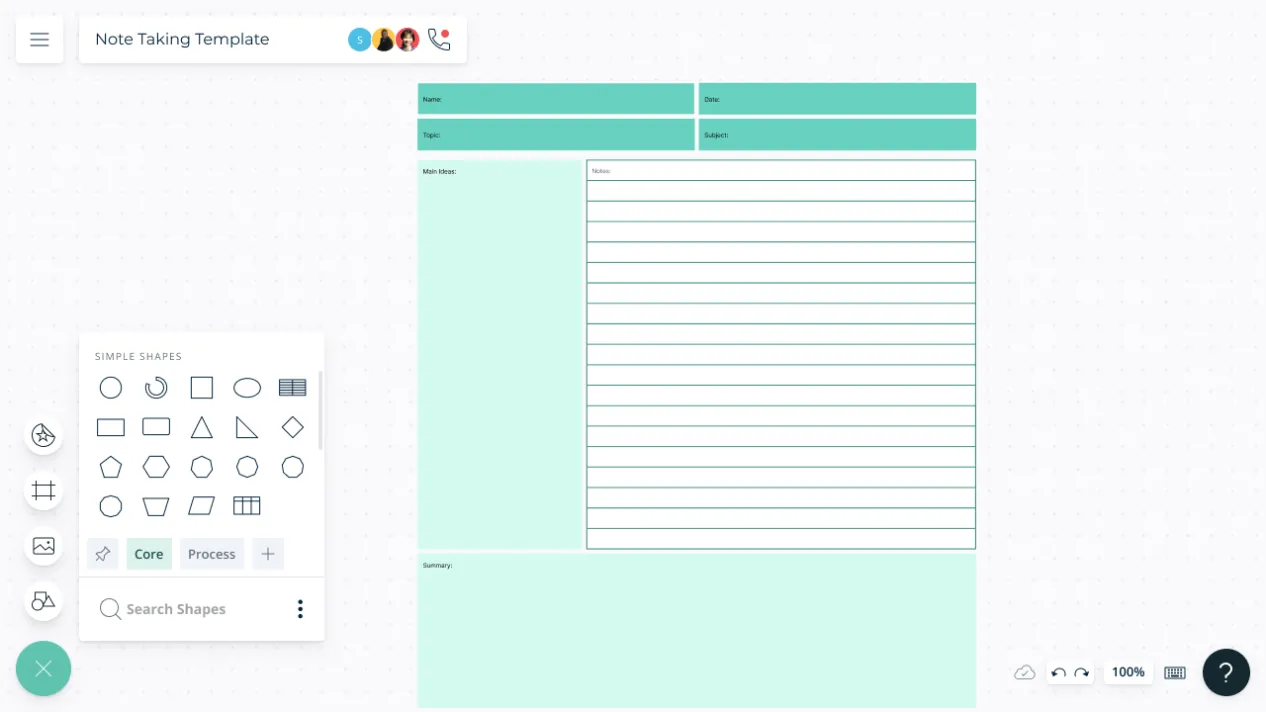
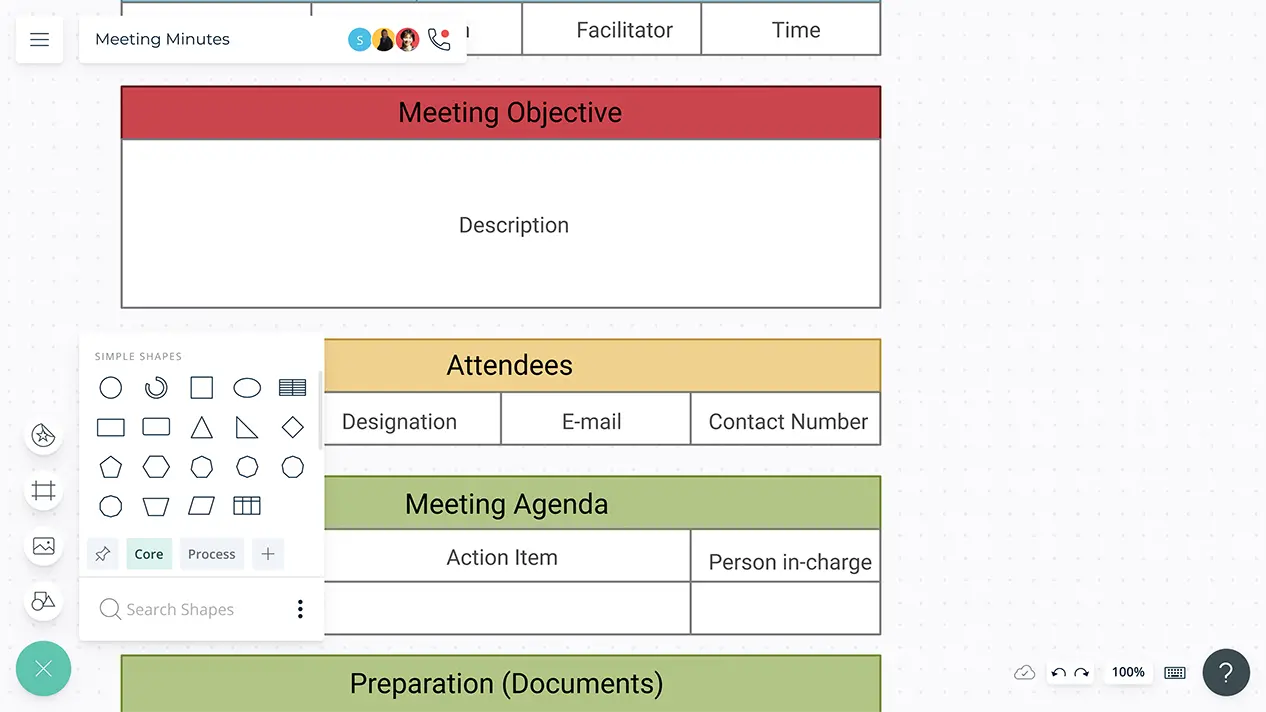
Maintain efficiency and improve productivity by being organized for meetings. Keep track of the suggestions, feedback, and important messages in one place, refer later easily for effective follow-up.
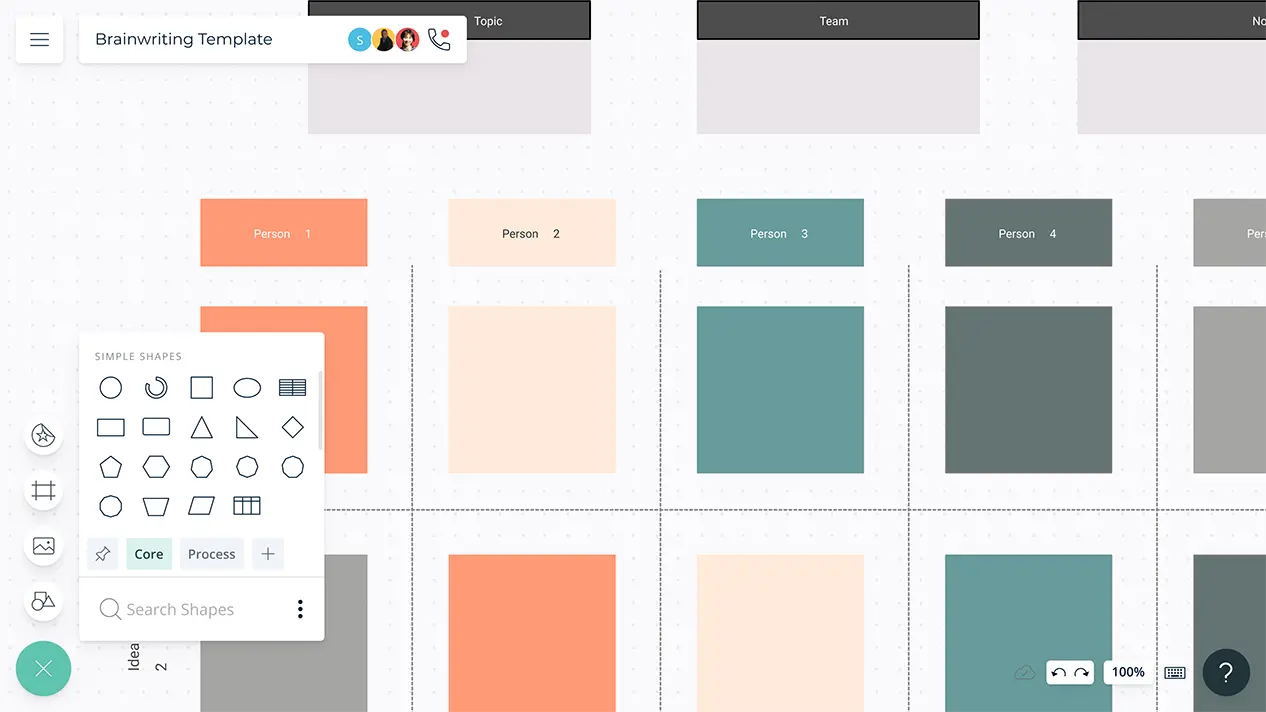
Organize ideas or concepts around a new topic for brainstorming and creative thinking.
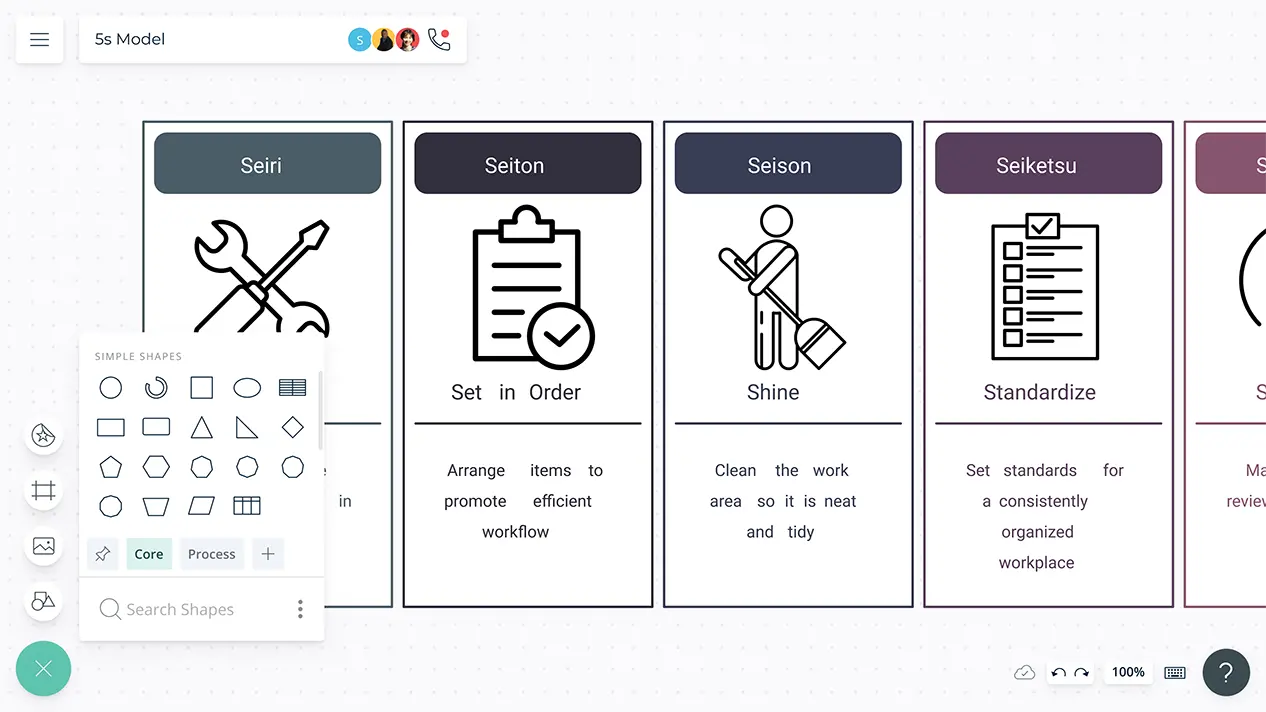
Originally from Japan, 5S stands for Sort, Straighten, Shine, Standardize, and Sustain. The 5S tool allows companies to organize and use space more effectively, efficiently, and safely.
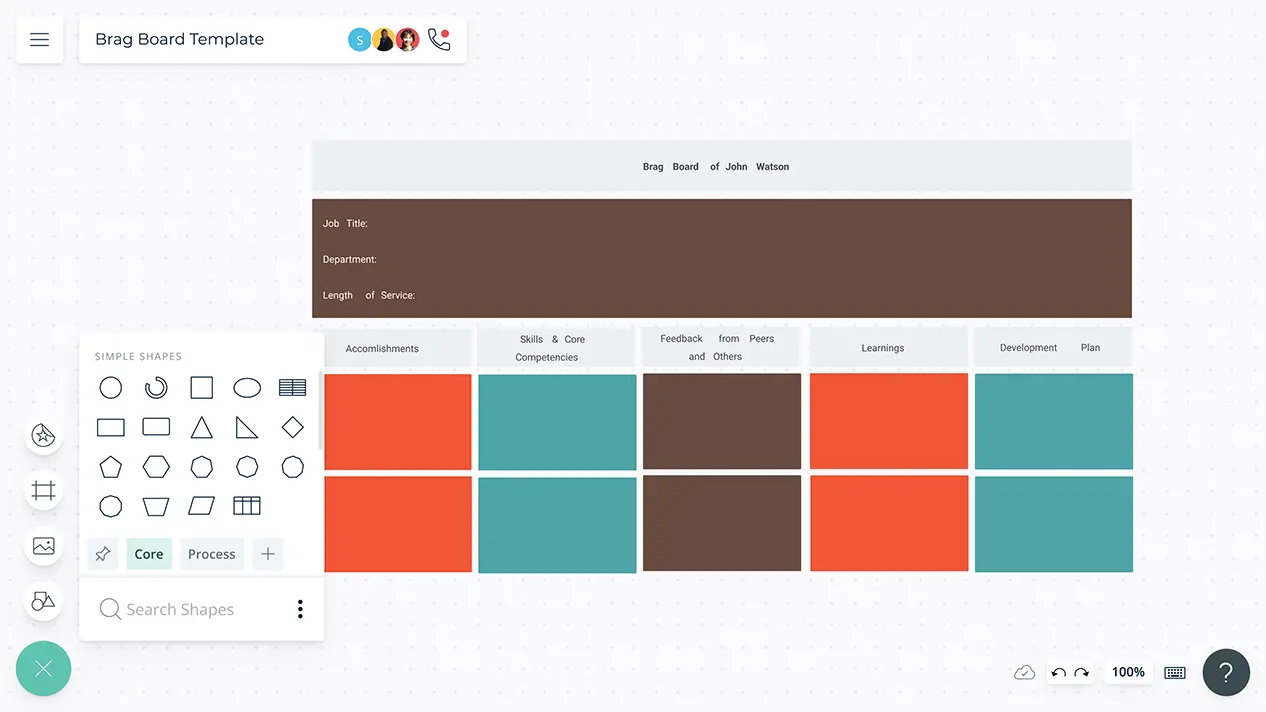
Celebrate your wins by creating a brag board to keep track of achievements, wins, and appreciations, while visualizing your professional growth and career progress.
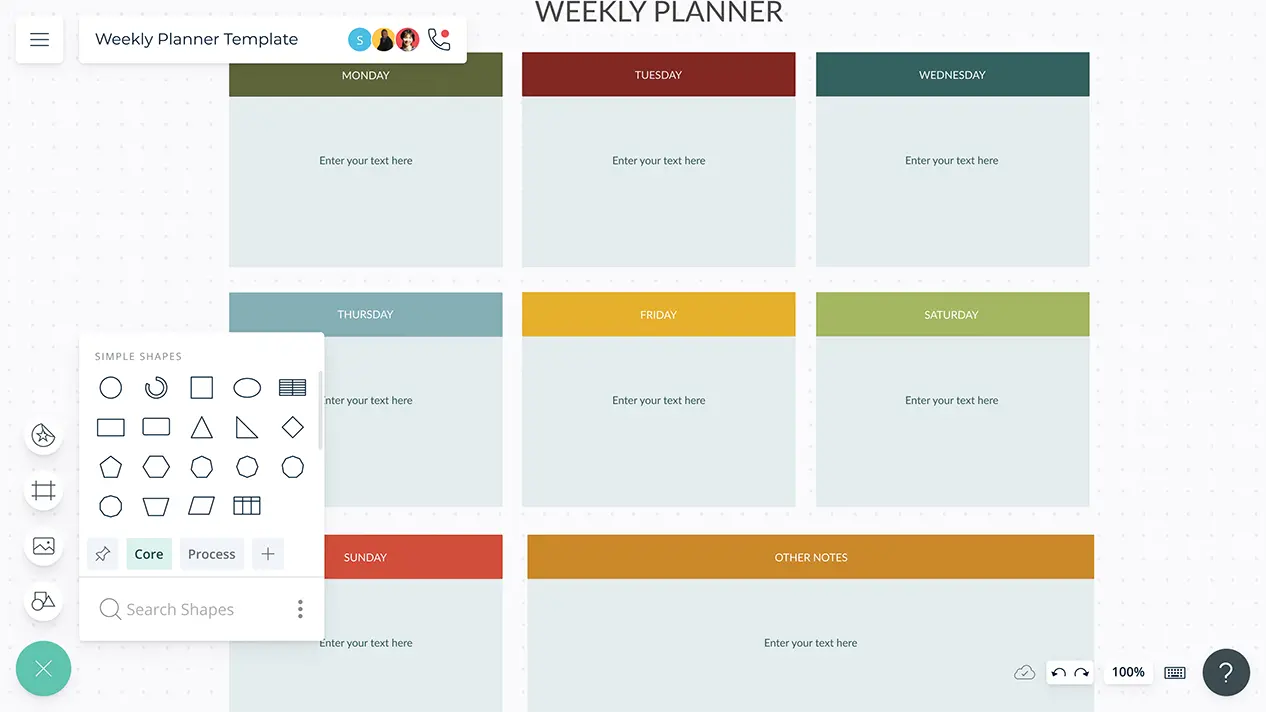
Visual templates to plan your goals and schedule your week. Use Creately’s customizable shapes and shape data capabilities to organize and arrange tasks and prioritize in a single place using frames.
Visually collaborate with your team on understanding what users need, what they expect, what's important to them, how they behave, and the challenges they face when using your products.
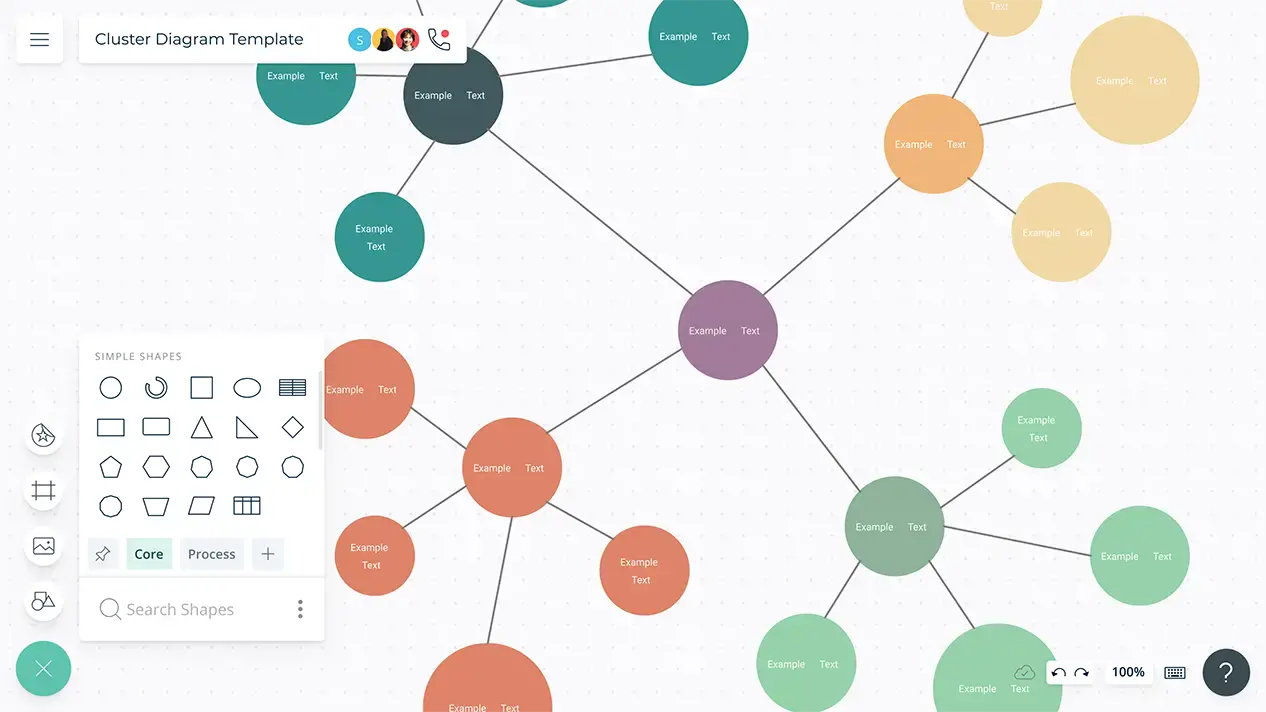
Organize ideas, categorize data, and visualize relationships with ready-to-use cluster diagram templates.
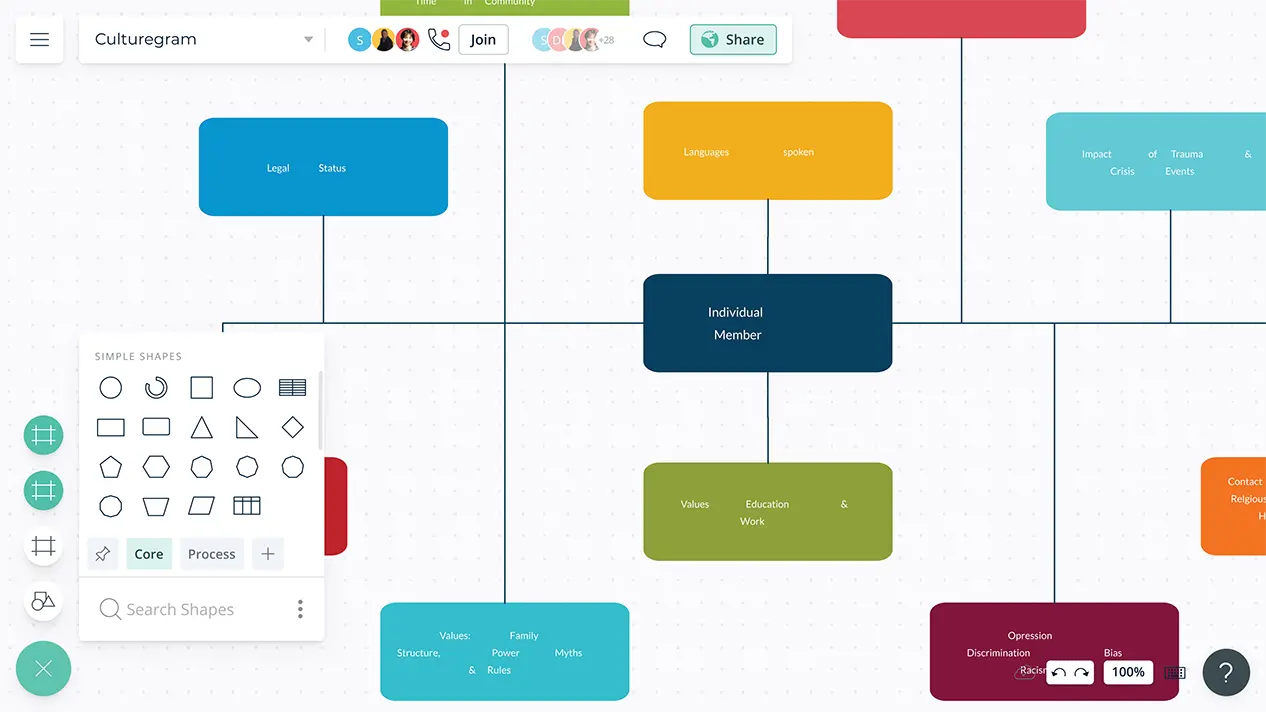
Effectively visualize and assess cultural backgrounds of the clients you work with to facilitate better social work assessment.
Visualize and explore the relationships between interdependent variables to bring clarity and context to your research theories.