Data Flow Diagram Maker
Easily Design and Model Data Flow Diagrams Online
Turn complex system data movement into a clear visual map your team can review, explain, and use for better documentation or development planning.
- Create multi-level DFDs with an easy visual workspace
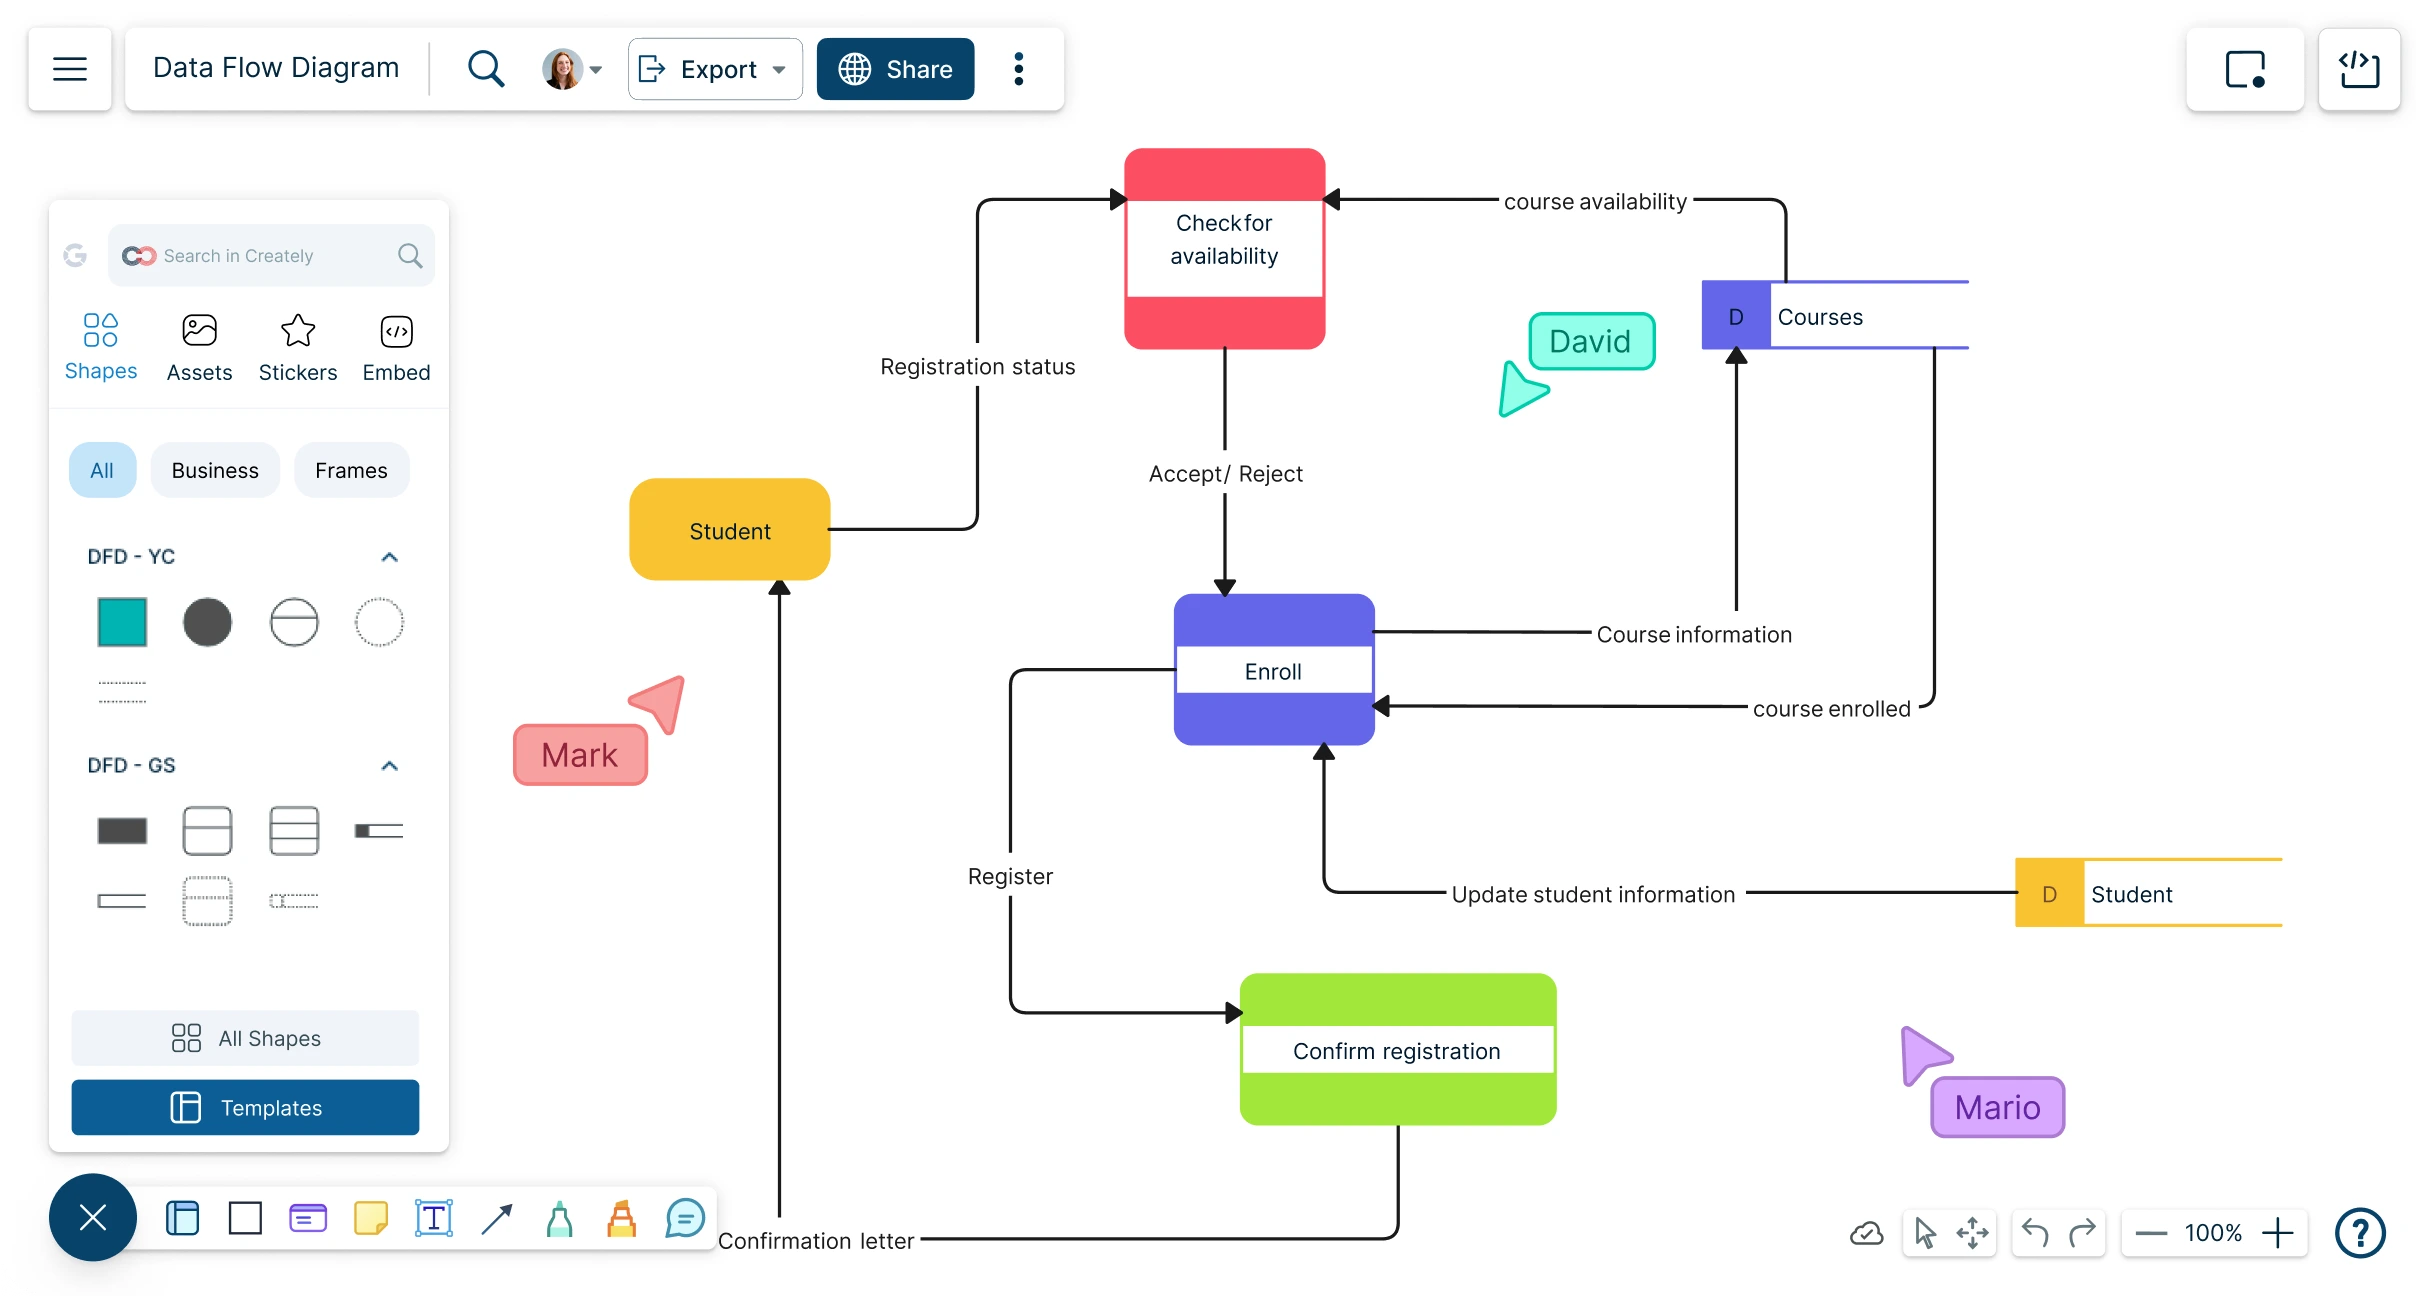
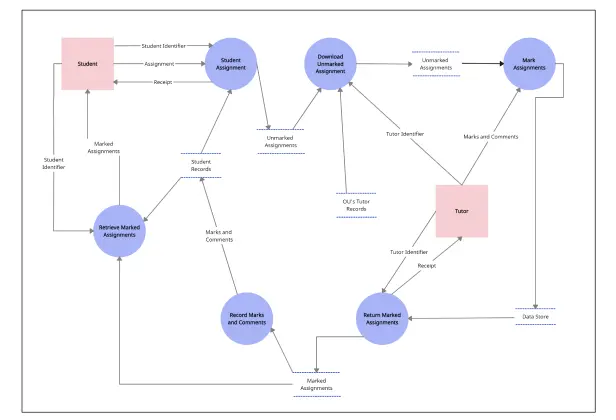
- Use standard DFD shapes to map entities, processes, data stores, and flows
- Review data movement with teams using comments, sharing, and real-time collaboration


 Diagramming Visual Collaboration Org Chart


How to Create a DFD Diagram in Creately?
Start With a DFD Template
Choose a data flow diagram template that matches the system, process, app, or workflow you want to map.
Add the Main DFD Shapes
Add processes, data stores, external entities, and data flows using standard DFD shapes.
Connect How Data Moves
Use connectors and arrows to show where data comes from, how it is processed, where it is stored, and where it goes next.
Organize the Diagram by Level
Create a context diagram first, then build Level 0, Level 1, or Level 2 DFDs to show more detail where needed.
Review, Share, and Export
Add notes or comments where more context is needed, review the diagram with your team, and export or share it for documentation, presentations, or development handoff.
Watch this quick walkthrough to see how to create a data flow diagram, use standard DFD shapes and connectors, organize data flows across levels, and share your diagram with others.
Turn Scattered System Details Into a Clear Data Flow Map

Requirements, process notes, stakeholder input, and technical details often live in different places. Bring that information into one visual workspace so you can see how data moves through the system before decisions are made.
Start with editable DFD templates instead of a blank canvas.
Use standard DFD shapes for processes, data stores, external entities, and data flows.
Map high-level system context first, then break complex processes into lower-level DFDs.
Organize related diagrams by system, module, team, or workflow area.
Use visual layouts to make complex data movement easier to explain.

Review Data Flows With Teams and Stakeholders
Data flow diagrams are more useful when analysts, developers, product teams, IT teams, and stakeholders can review them together. Gives everyone a shared space to clarify how data moves before a system is built, updated, or documented.
Bring analysts, developers, IT teams, and stakeholders into one shared DFD workspace.
Use real-time cursors to follow what others are reviewing or editing.
Add comments and @mentions on specific processes, data stores, entities, or flows.
Share diagrams with the right access level for review, feedback, or editing.
Use presentation mode to walk stakeholders through the data flow step by step.
Keep Requirements and Decisions Connected to the Diagram

A DFD should stay readable, but the details behind it still matter. Keep notes, rules, assumptions, files, and decisions attached to the right diagram elements without overcrowding the canvas.
Add notes to explain what a process does or what data it handles.
Attach files, links, or references to support requirements and decisions.
Store assumptions and open questions next to the relevant flow or data store.
Export DFDs as PDF, PNG, or SVG for documentation, reports, and handoff.
Use the workspace as a central place for DFD context, review notes, and documentation.
What Can You Create with Creately’s Data Flow Diagram Software?
- Context Diagrams:
Show the system as a whole and how it connects with external users, teams, tools, or systems. Use this when you need to define the system boundary before going into the details.
- Level 0 Data Flow Diagrams:
Map the main processes, data stores, external entities, and data flows in one high-level view. Use this to explain how the system works before breaking it down further.
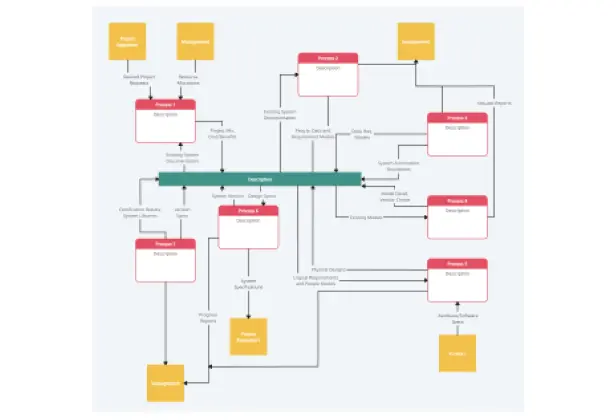
- Detailed Data Flow Diagrams:
Create Level 1 and Level 2 DFDs to break large processes into smaller steps. Use these when teams need to understand exactly how data moves inside a specific workflow or system area.
- Logical Data Flow Diagrams:
Focus on what data moves through the system and what happens to it, without showing the technical setup. Use this for business analysis, requirements discussions, and stakeholder review.
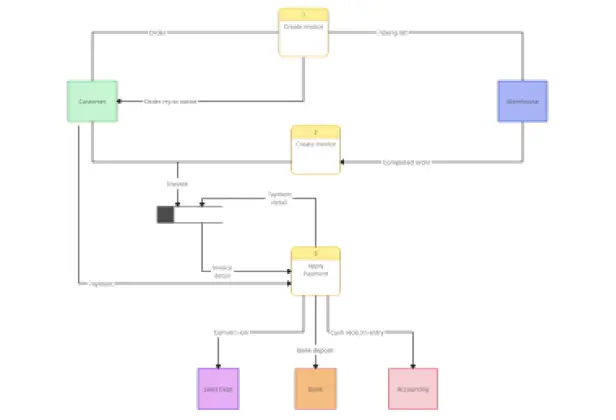
- Physical Data Flow Diagrams:
Show how data moves through actual systems, databases, files, applications, teams, or devices. Use this when developers, IT teams, or implementation teams need more technical detail.
- System and Software DFDs:
Document how data moves between applications, services, databases, users, and external systems. Use this for software requirements, system design, integration planning, and technical documentation.
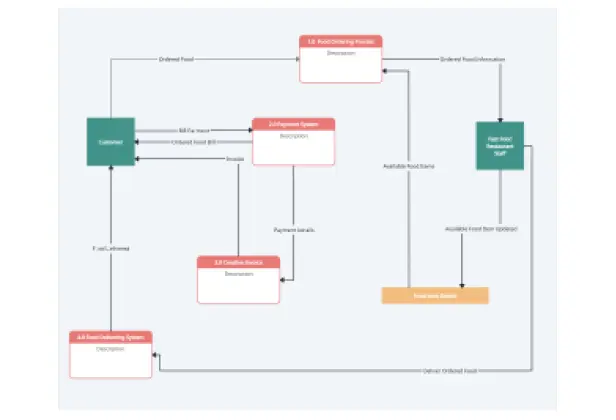
- Business Process Data Flow Diagrams:
Map how information moves through a business process, department, or operational workflow. Use this to review handoffs, data ownership, approvals, and process gaps.
- Current-State and Future-State Data Flows:
Compare how data moves today with how it should move after a system change, process improvement, or new implementation. Use this to explain what needs to change and why.
- DFDs for Documentation and Stakeholder Review:
Create clear diagrams for requirement documents, project discussions, audits, presentations, or handoff. Use this when written explanations alone are not enough to align everyone.
Create Data Flow Diagrams Easily and Faster with these Premade Templates
FAQs About the DFD Creator in Creately
What are Creately’s data flow diagram maker pricing plans?
- Free Plan — $0/month for basic data flow diagram creation and collaboration
- Starter & Team Plans — $8/month or $5/month billed annually
- Business Plan — $149/month or $89/month billed annually
Annual billing helps you save more while unlocking advanced collaboration, workspace management, and enhanced data flow diagram features. You can compare all available plans and features on the Creately Pricing Page.
How can you create data flow diagrams faster?
Are there templates for different data flow diagram use cases?
Can teams collaborate on data flow diagrams?
Can I add notes, data, and files?
Can I share, present, or export data flow diagrams?
What is a data flow diagram?