Context Diagram Maker
Create Context Diagrams Online in Minutes
Define system boundaries, external entities, inputs, outputs, and interactions in one clear visual workspace. Turn scattered requirements into context diagrams that are easier to review, explain, and share.
Start faster with editable context diagram templates
Map users, systems, inputs, and outputs with drag-and-drop shapes and connectors.
Add notes, comments, files, and sharing options to review scope with stakeholders.



 Diagramming Visual Collaboration Org Chart


How to Create a Context Diagram in Creately?
Open a Context Diagram Template
Start with a ready-made context diagram template or open a blank workspace. Add the system name, project goal, and key stakeholders so everyone understands what the diagram is meant to explain.
Identify the System Boundary
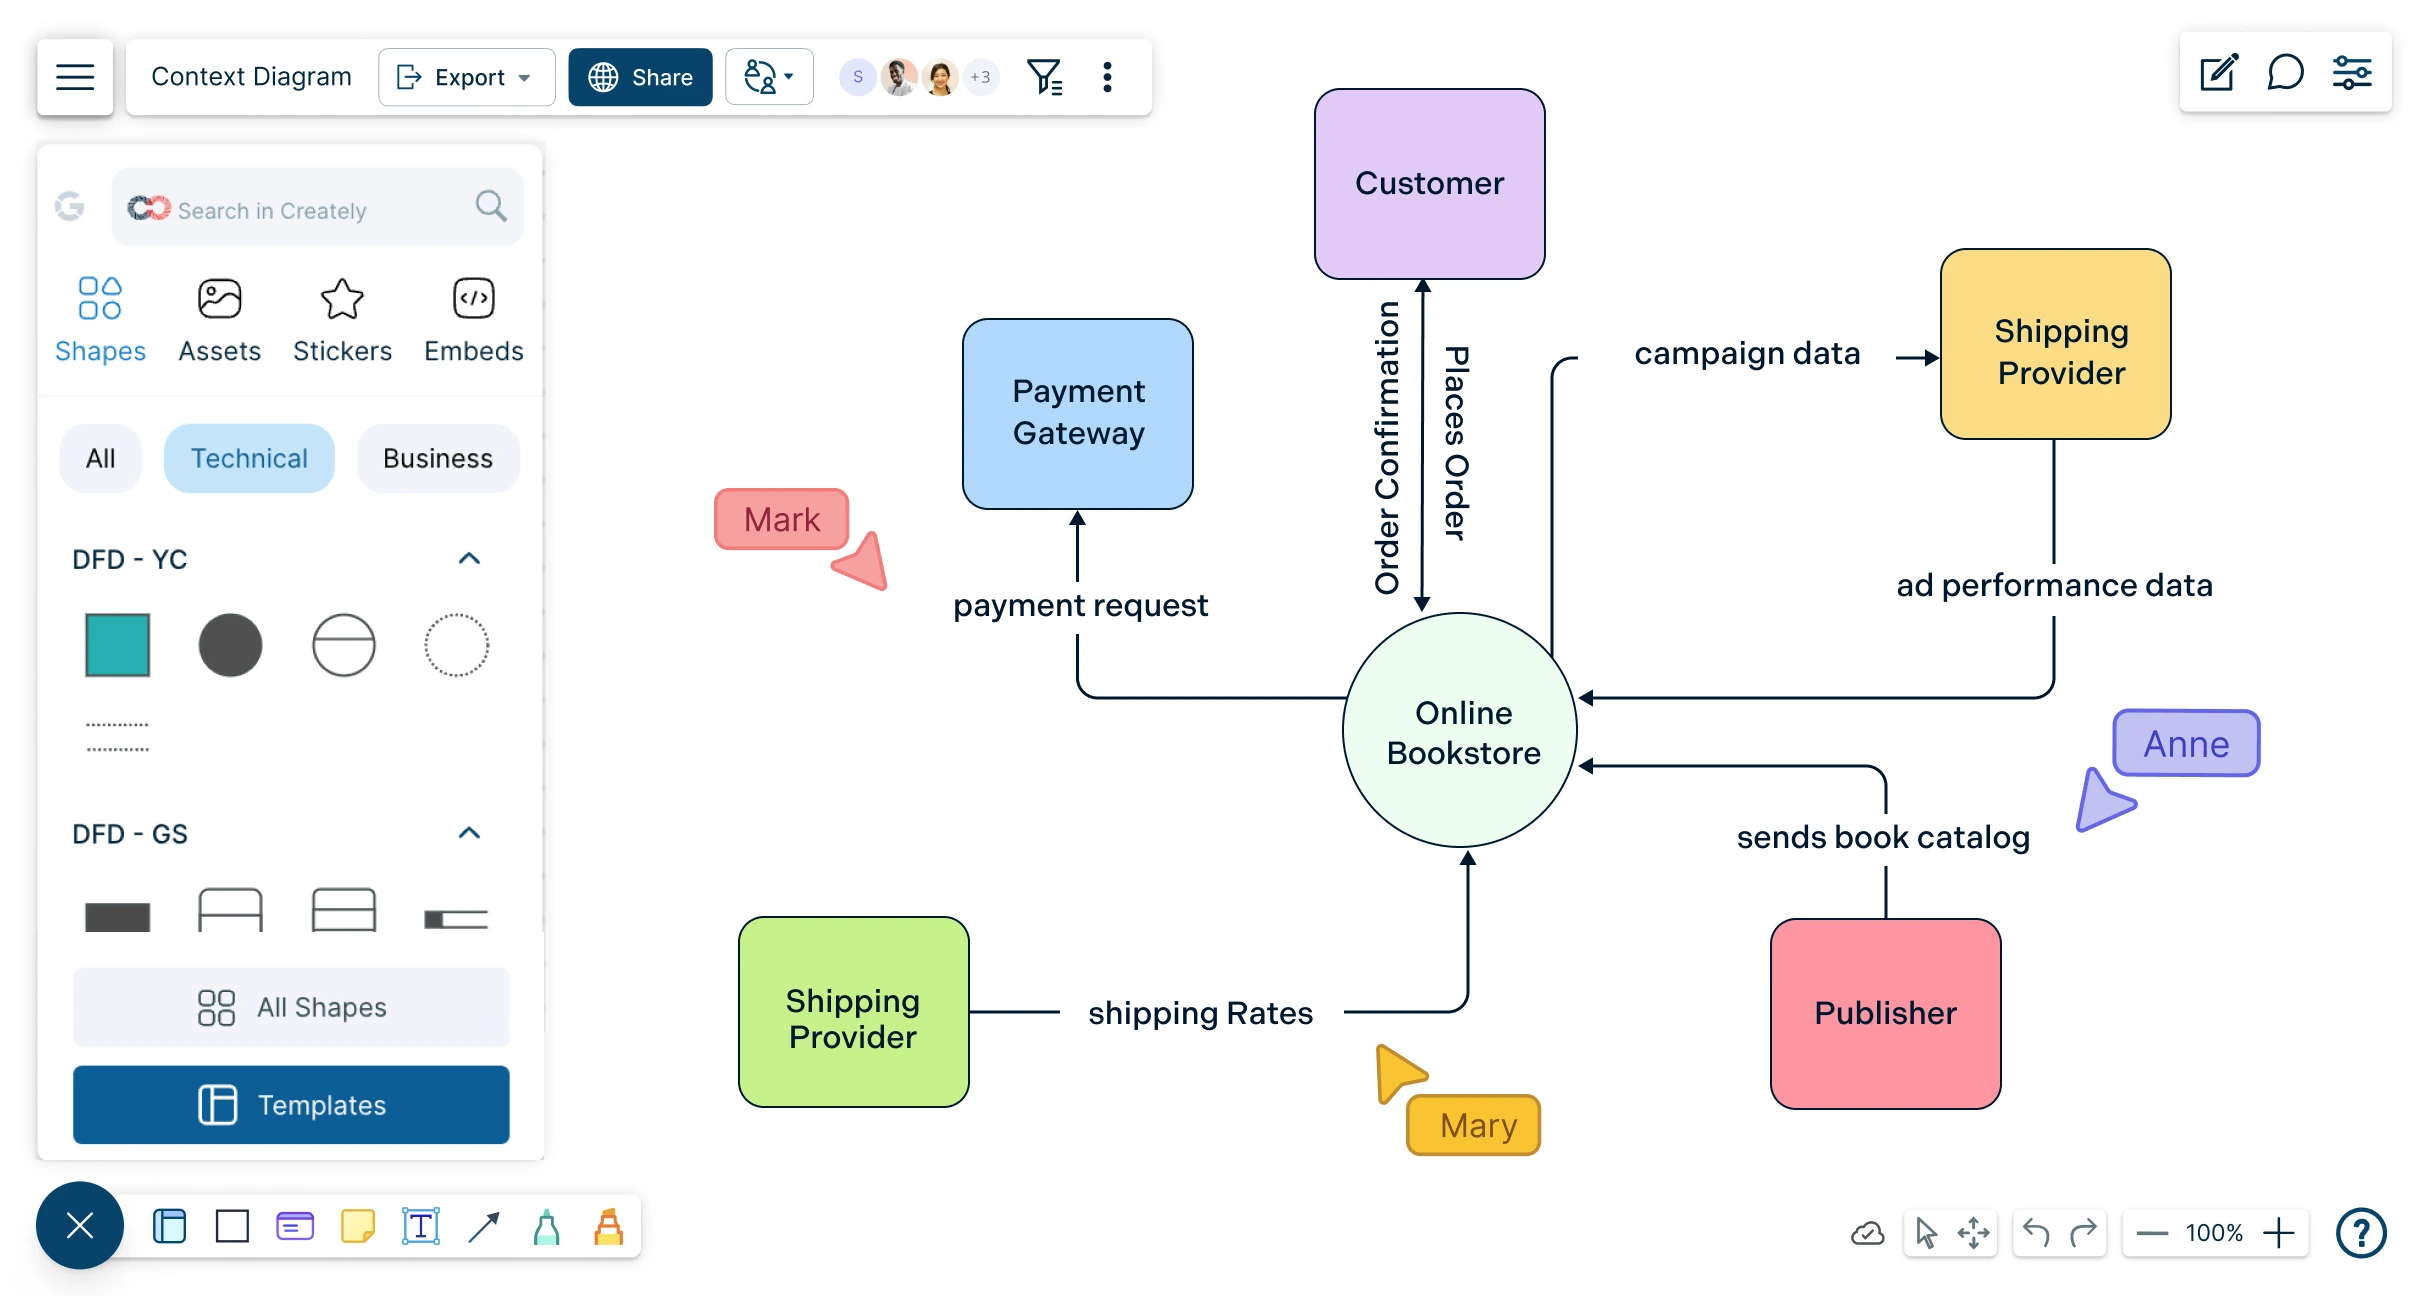
Place the main system or process at the center of the diagram. Use a clear system boundary to show what is included in the scope and what sits outside it.
Add External Entities
Add the people, teams, departments, applications, databases, or third-party systems that interact with the system. Keep each entity clearly labeled so the diagram is easy to read.
Map Inputs, Outputs, and Interactions
Use connectors and labels to show what information moves between the system and each external entity. Label each flow with the data, request, response, file, report, or action being exchanged.
Review, Share, and Update
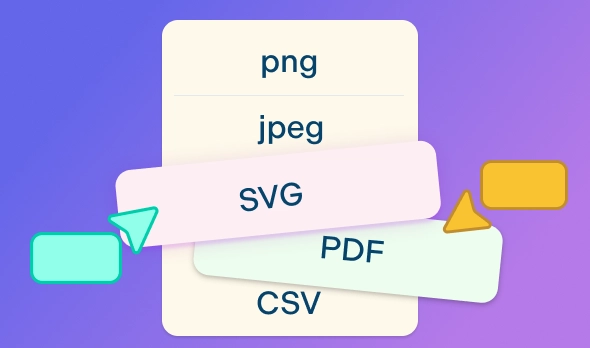
Use comments, @mentions, notes, and sharing permissions to collect feedback from stakeholders. Present the diagram during reviews, export it as PDF, PNG, SVG, or JPEG, or embed it in documentation.
Define System Boundaries Before Work Begins
When users, systems, inputs, outputs, and requirements are scattered across notes or conversations, it becomes difficult to explain what the system should include. Build a clear context diagram that helps teams agree on scope before moving into detailed requirements, design, or development.
Start with editable context diagram templates to frame the system faster and avoid building the structure from scratch.
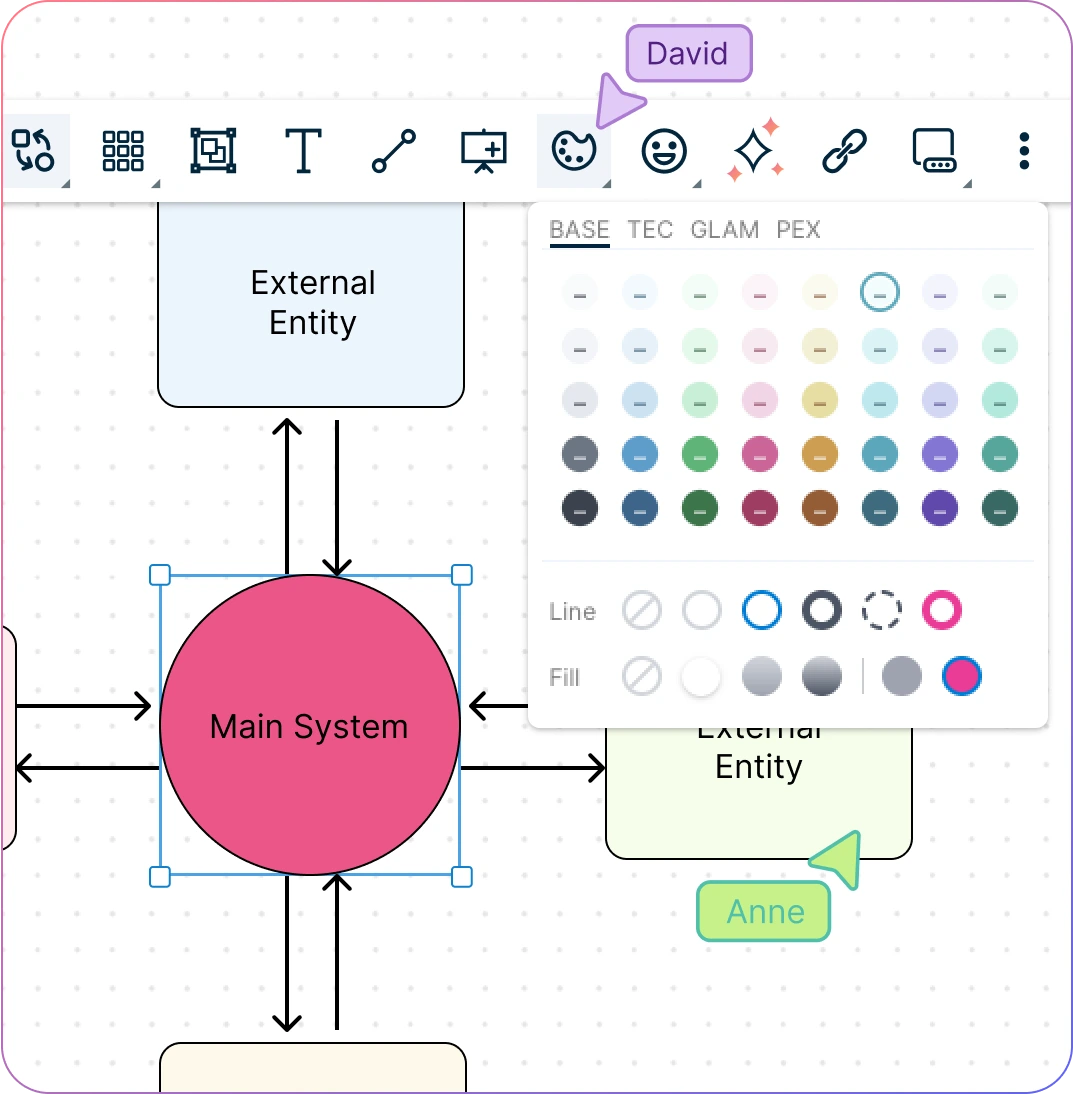
Use system boundary shapes to show what is inside the system and what stays outside it.
Add external entities for users, teams, apps, databases, and third-party systems so every interaction is visible.
Label connectors with inputs, outputs, requests, responses, and data flows to reduce confusion during reviews.
Keep Scope Details Connected to the Diagram
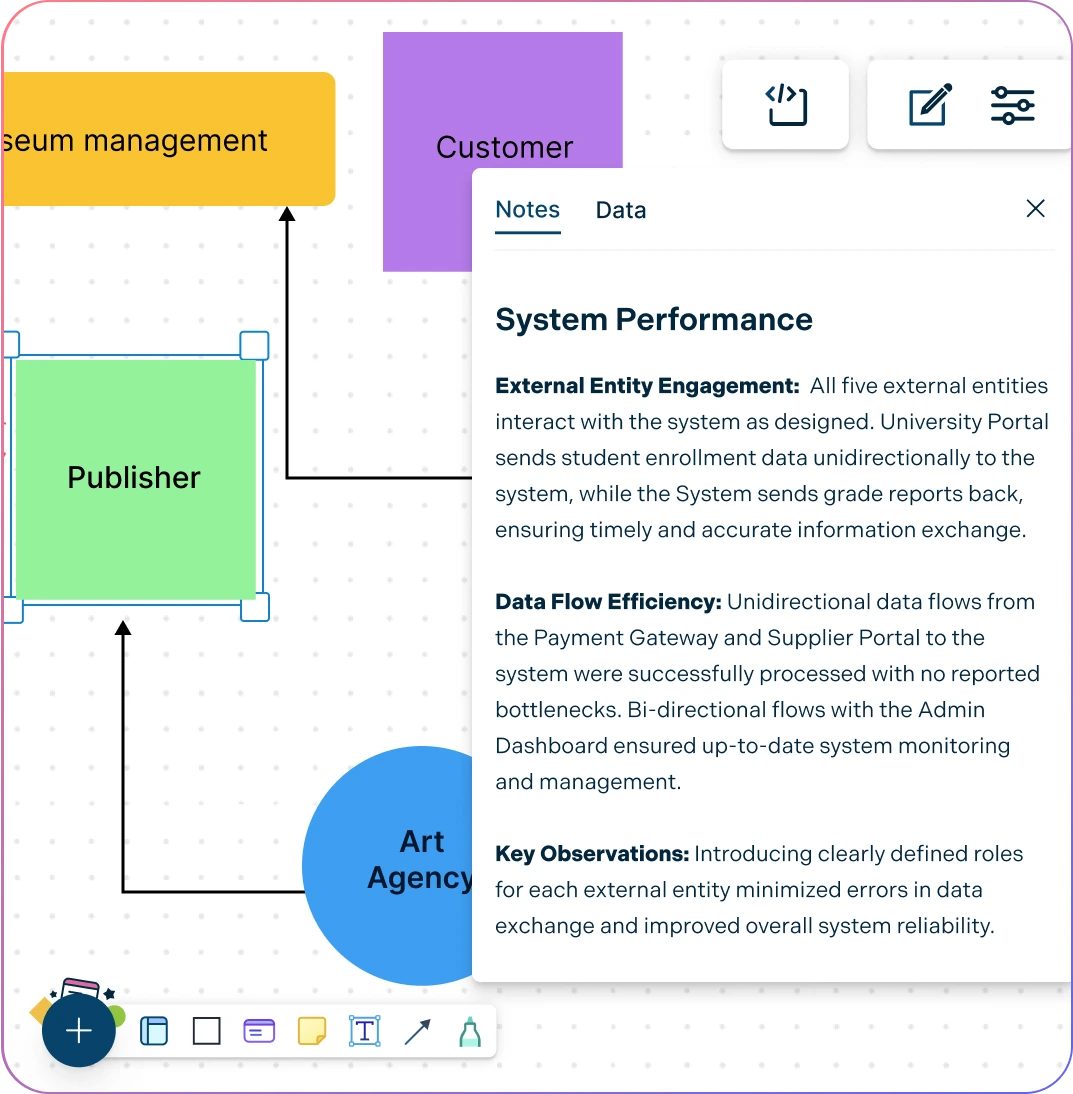
A context diagram should stay simple, but the decisions behind it still need to be easy to find. Keep requirements, assumptions, business rules, files, and open questions connected to the right system, entity, or interaction without cluttering the main visual.
Attach notes to systems, entities, or flows so assumptions and business rules stay connected to the right part of the diagram.
Add links, files, and documents to keep requirements and reference material available during analysis.
Use in-app previews to review supporting documents without switching between tools.
Group related users, systems, and interactions on the canvas so larger system views remain easier to scan.
Review Scope With Business and Technical Teams
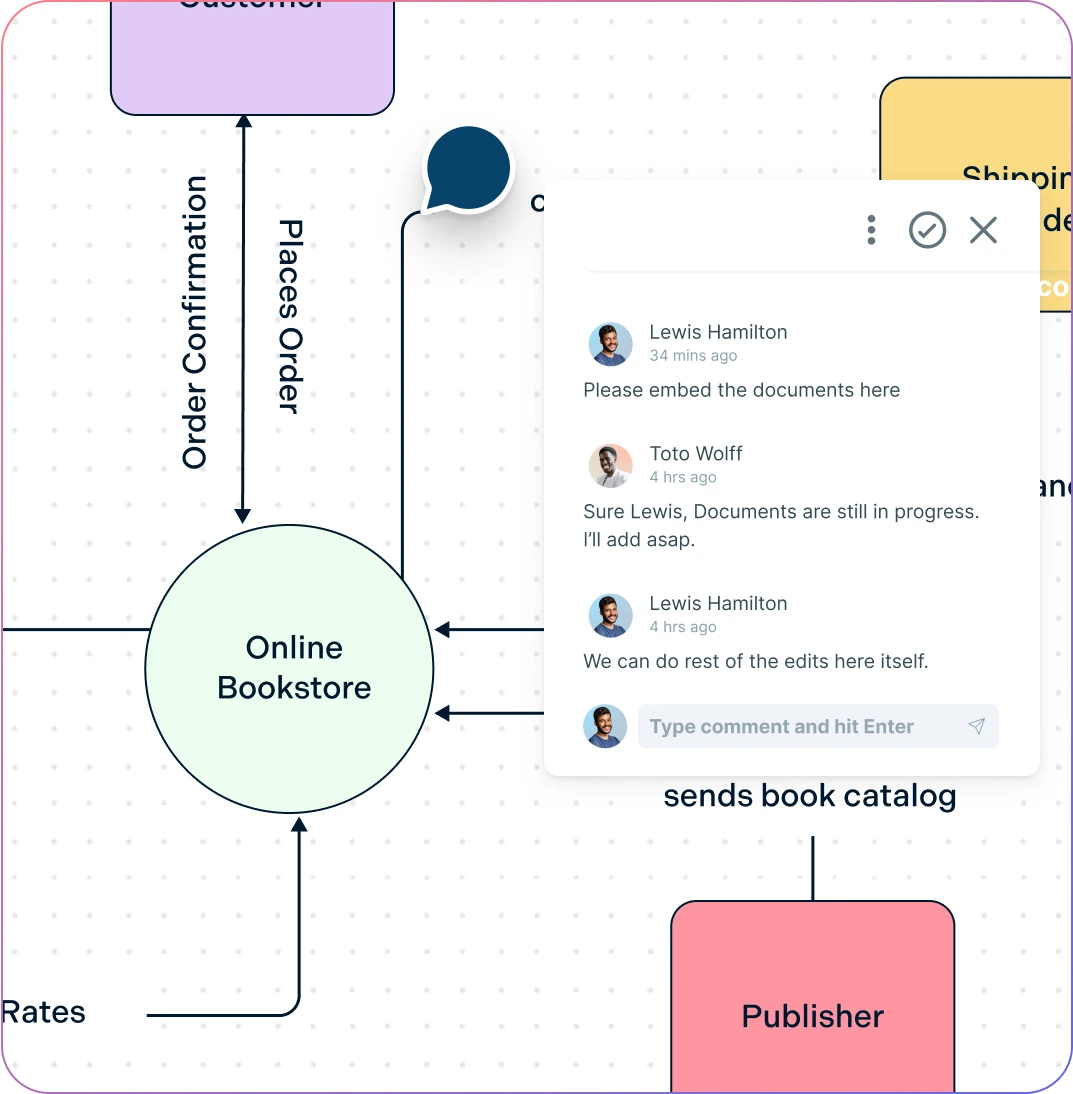
Context diagrams help teams align early, especially when business stakeholders and technical teams see the system from different angles. Collaborate in one shared workspace to confirm boundaries, identify missing interactions, and reduce misunderstandings before detailed work begins.
Share diagrams with view or edit access so each stakeholder can review or update the diagram at the right level.
Use comments and @mentions to resolve unclear flows, missing entities, or scope questions directly on the diagram.
Use presentation frames to walk stakeholders through the system context step by step during workshops or reviews.
Export diagrams as PDF, PNG, SVG, or JPEG so finalized system views can be added to reports, specs, and handoff documents.
What Can You Create With Creately’s Context Diagram Software?
System Context Diagrams
Show the main system, its boundary, external entities, and the inputs and outputs that connect them.
Software Context Diagrams
Define how a software application interacts with users, third-party tools, databases, APIs, payment systems, or other platforms.
Business System Context Diagrams
Map how a business process connects with customers, internal departments, vendors, reports, forms, and external services.
Product Scope Diagrams
Help product managers and teams define what a product includes, what it depends on, and which user groups or systems it must support.
IT and Integration Context Diagrams
Visualize how internal systems, external applications, data sources, and teams interact before planning integrations or system changes.
Classroom and Training Diagrams
Create simple context diagrams for assignments, lessons, workshops, or training sessions to explain system thinking and scope definition.
Create Your Context Diagram with Editable Templates


FAQs About Context Diagrams
What are Creately’s context diagram maker pricing plans?
- Free Plan — $0/month for basic context diagram creation and collaboration
- Starter & Team Plans — $8/month or $5/month billed annually
- Business Plan — $149/month or $89/month billed annually
Annual billing helps you save more while unlocking advanced collaboration, workspace management, and enhanced context diagram features. You can compare all available plans and features on the Creately Pricing Page.
How can you create context diagrams faster?
Are there templates for different context diagram use cases?
Can teams collaborate on context diagrams?
Can I add notes, data, and files?
Can I share, present, or export context diagrams?
What is a context diagram?