Cluster Diagram Template
Visualize & Analyze Clusters of Ideas
Organize ideas, categorize data, and visualize relationships with ready-to-use cluster diagram templates.
- Advanced diagramming for seamless idea generation
- AI-powered brainstorming for faster creative solutions
- Real-time collaboration for meetings and workshops
FREE Cluster Diagram Examples to Jumpstart Your Ideas


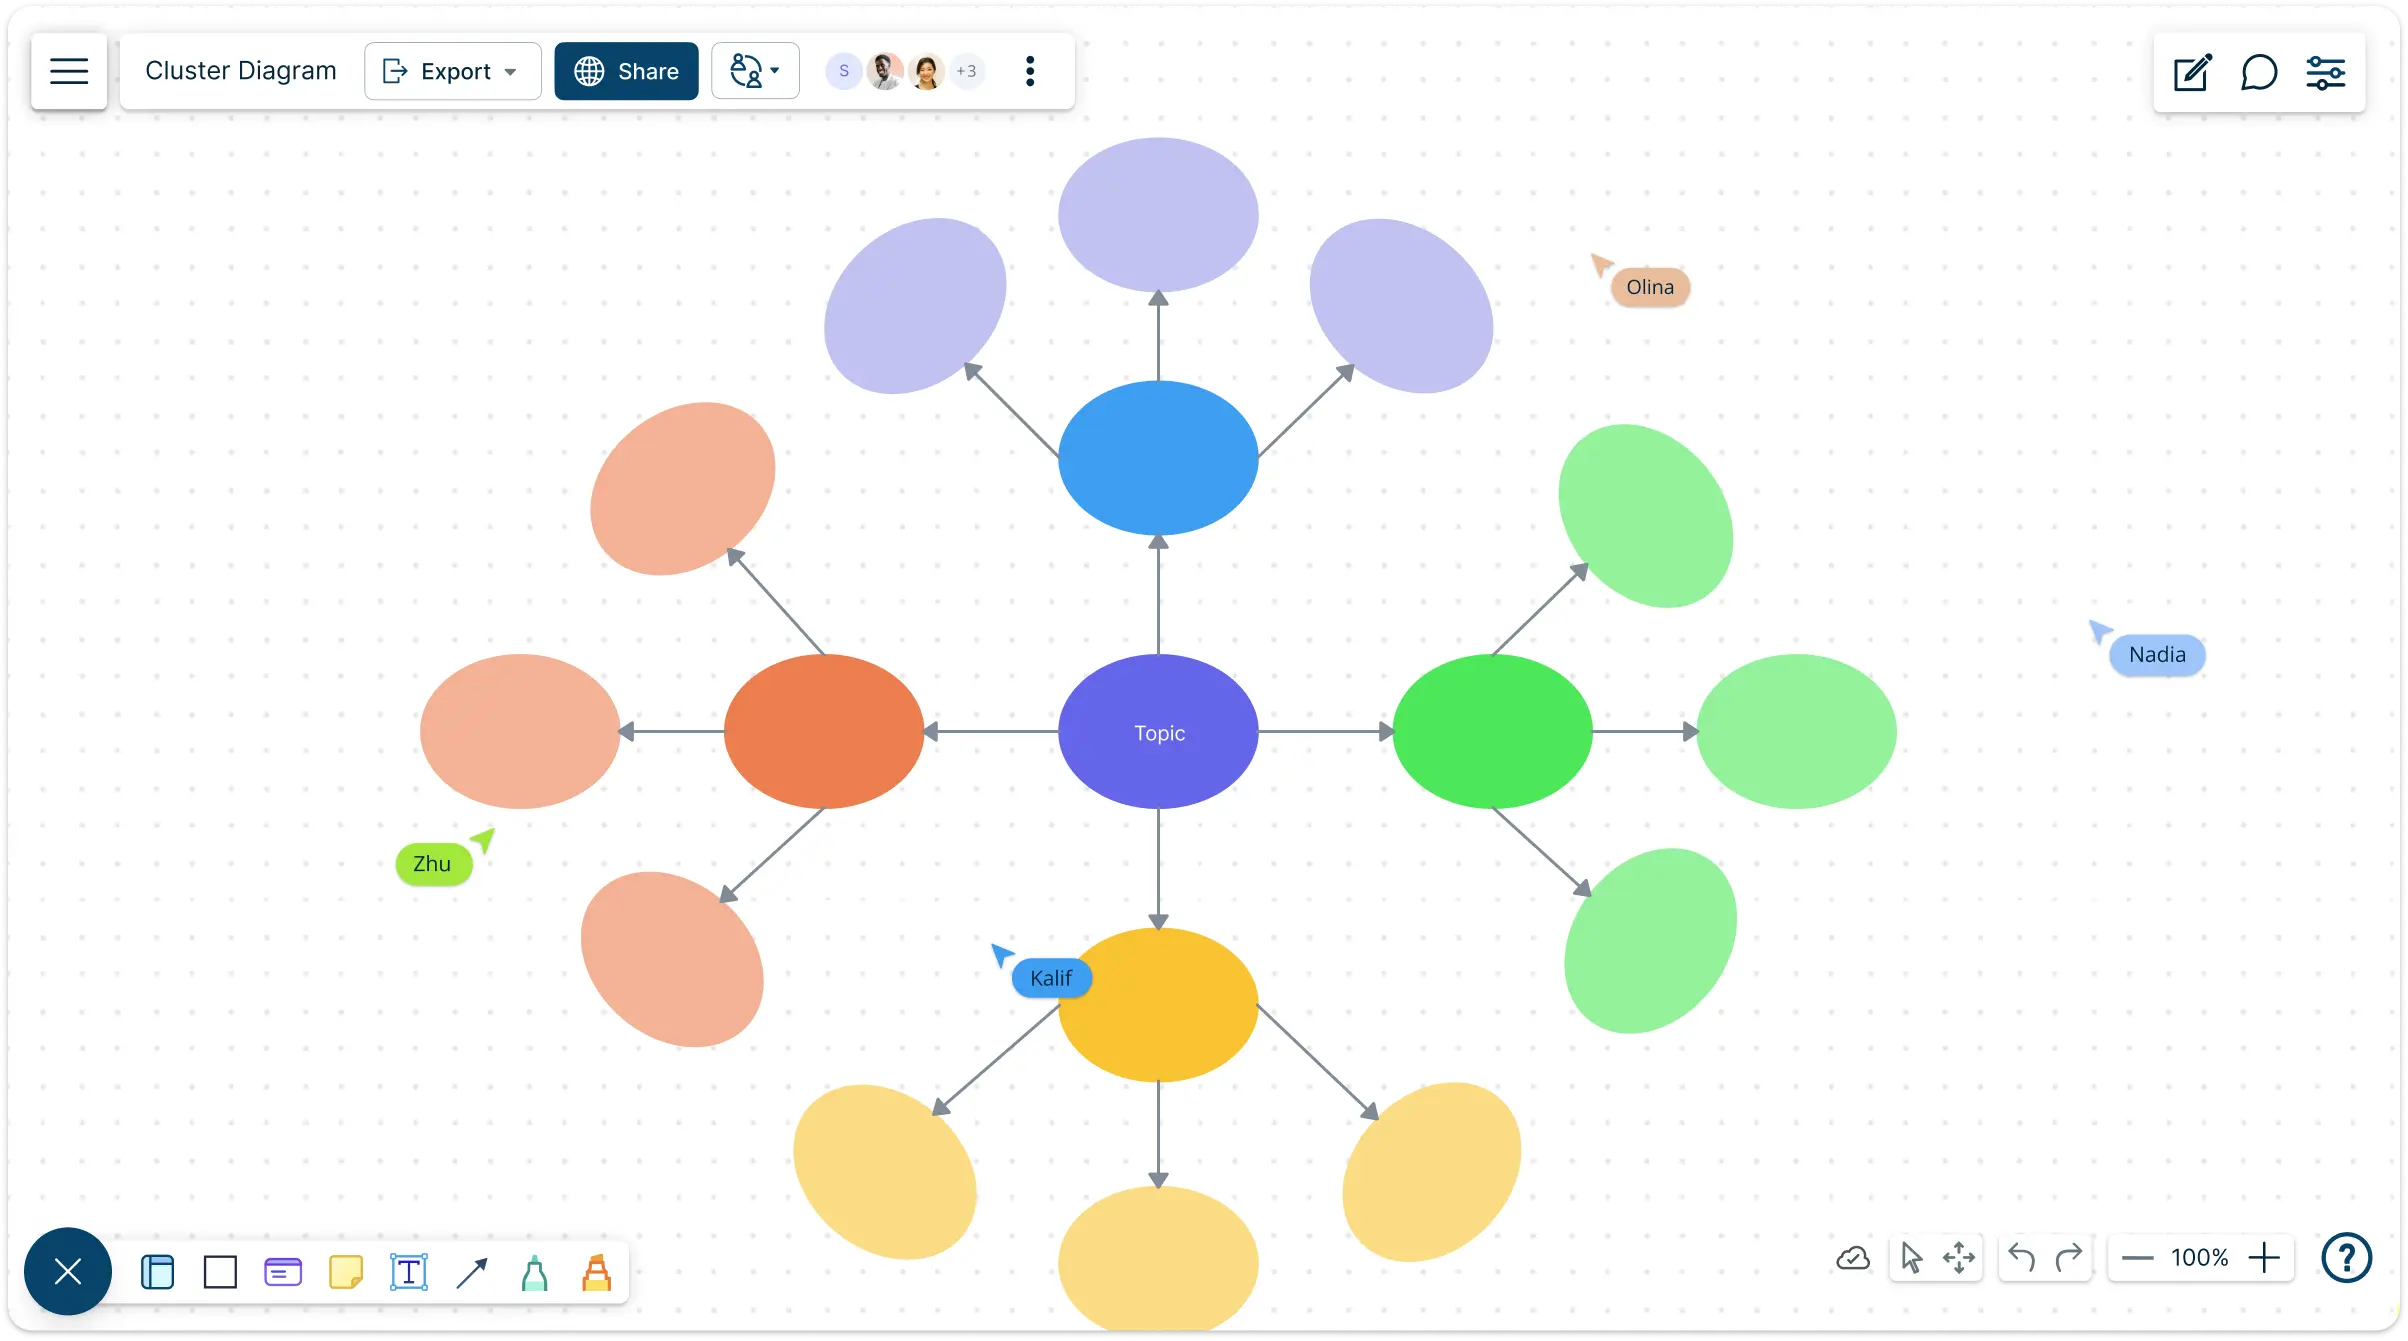
Promote Innovative Thinking with Clear Visuals

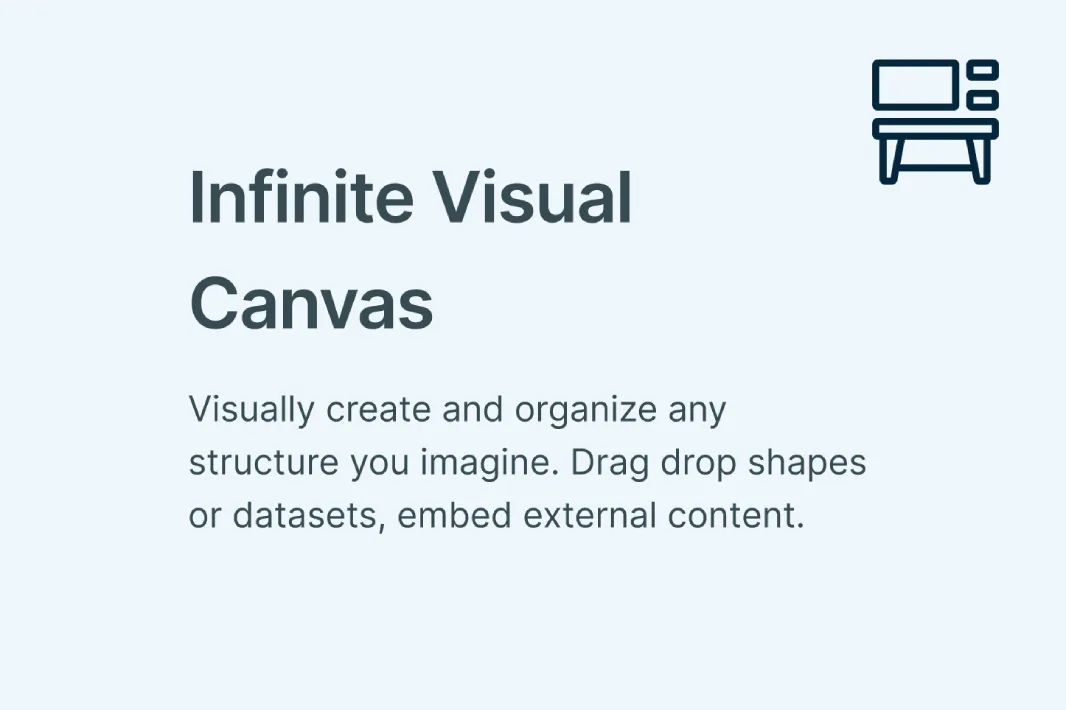
Bring your ideas to life with multiple cluster diagram templates designed to help you visualize and organize information quickly and intuitively. Use the infinite canvas and comprehensive shape libraries to structure brainstorming sessions, plan projects, or map out complex concepts. With drag-and-drop shapes, customizable layouts, and pre-built templates, organizing your thoughts has never been easier.
Creately AI acts as a creative partner, helping you overcome blocks, generate unique solutions, and expand on ideas seamlessly. Store notes, add data fields, and attach relevant information directly to your diagrams, making every cluster map a centralized, actionable hub for your ideas. Creately’s cluster diagram tool helps make everything is fast, intuitive, and keeps your team aligned and inspired.

Centralize Insights and Spot Patterns Fast
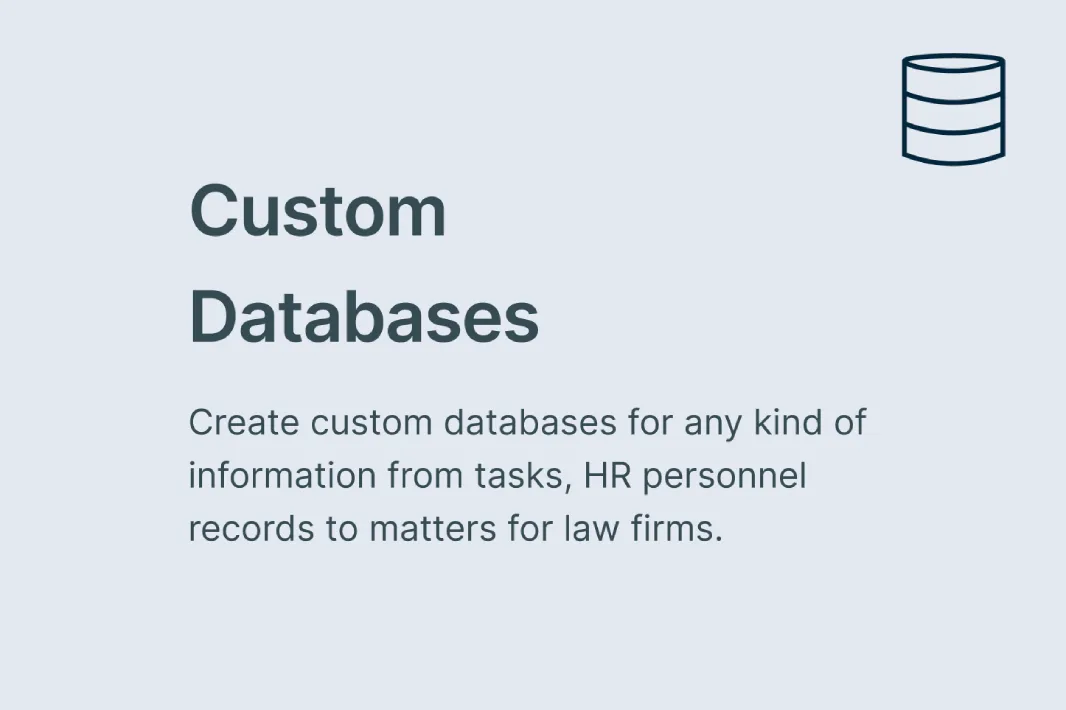
Never miss an idea with Creately’s cluster diagram tool, designed to help you organize, analyze, and summarize your thoughts in one intuitive workspace. Quickly identify trends, group related concepts, and bring clarity to scattered ideas with smart visualization features. Add detailed notes, attachments, links, and context directly to each cluster, keeping all your information in a centralized space.
Import images, vectors, or embed documents and multimedia files with in-app previews, giving your diagrams richer context and making every cluster map a fully actionable hub for strategy, planning, and decision-making. Whether using a cluster diagram maker or an online cluster diagram generator, everything stays fast, visual, and easy to navigate.
Co-Create and Stay Synced in Real Time

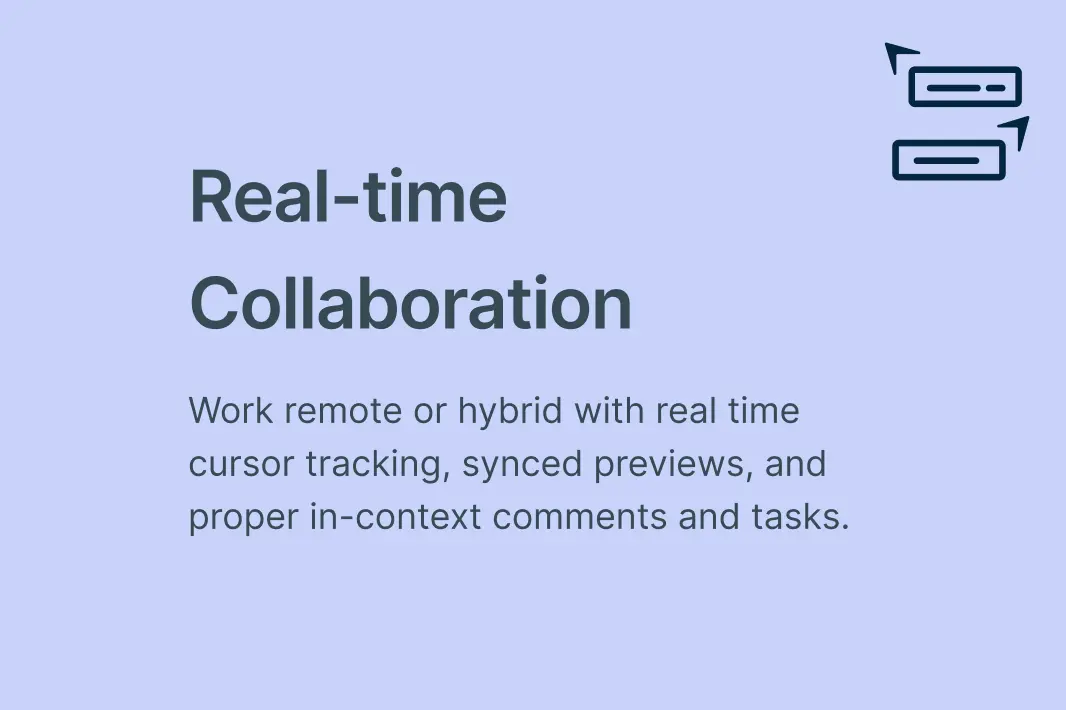
Bring your team together with Creately’s cluster diagram software and collaborate seamlessly on a shared canvas. Track changes with full version history, revert to previous iterations, and use real-time cursors so multiple participants can work simultaneously without missing a beat.
Link ideas, tasks, and media with @mentions to get immediate feedback and keep everyone aligned. Whether you’re using a cluster diagram maker or an online cluster diagram tool, every team member can contribute, comment, and iterate effortlessly, making brainstorming, planning, and strategy faster, more visual, and more connected than ever.

Publish, Share, and Present Your Cluster Diagrams Anywhere
Take your cluster diagram map beyond the canvas with flexible sharing and export options. Easily embed your diagrams into Google Docs, Slides, and Sheets, or integrate them on any website and share directly via email. Export high-quality SVGs, PDFs, or PNGs for presentations, reports, or printing. With Presentation mode, instantly turn any item on your canvas into interactive slides for engaging team reviews or client demos. Whether using a cluster diagram maker, cluster diagram generator, or online cluster diagram tool, extending your ideas has never been faster, more intuitive, or more professional.
What Is a Cluster Diagram?

How To Make A Cluster Diagram?
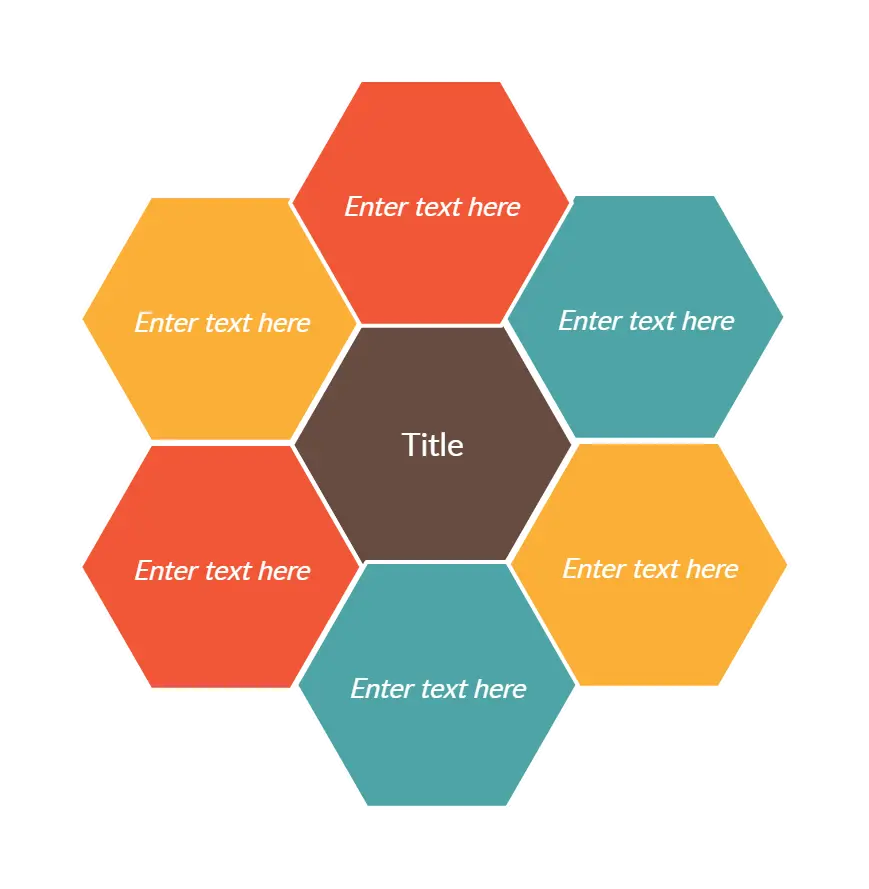
Choose Your Main Topic:
Pick a topic of interest to explore. Place it in the center of the Creately canvas. Alternatively, pick a pre-built Creately cluster diagram template to get a head start.
Brainstorm Related Ideas:
Think and list down as many ideas related to the main topic.
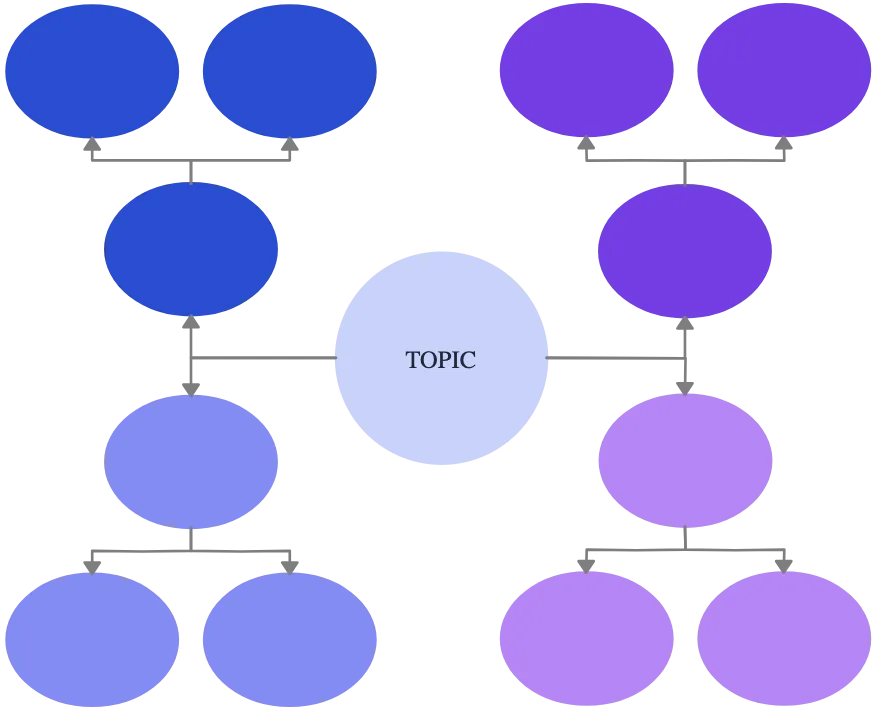
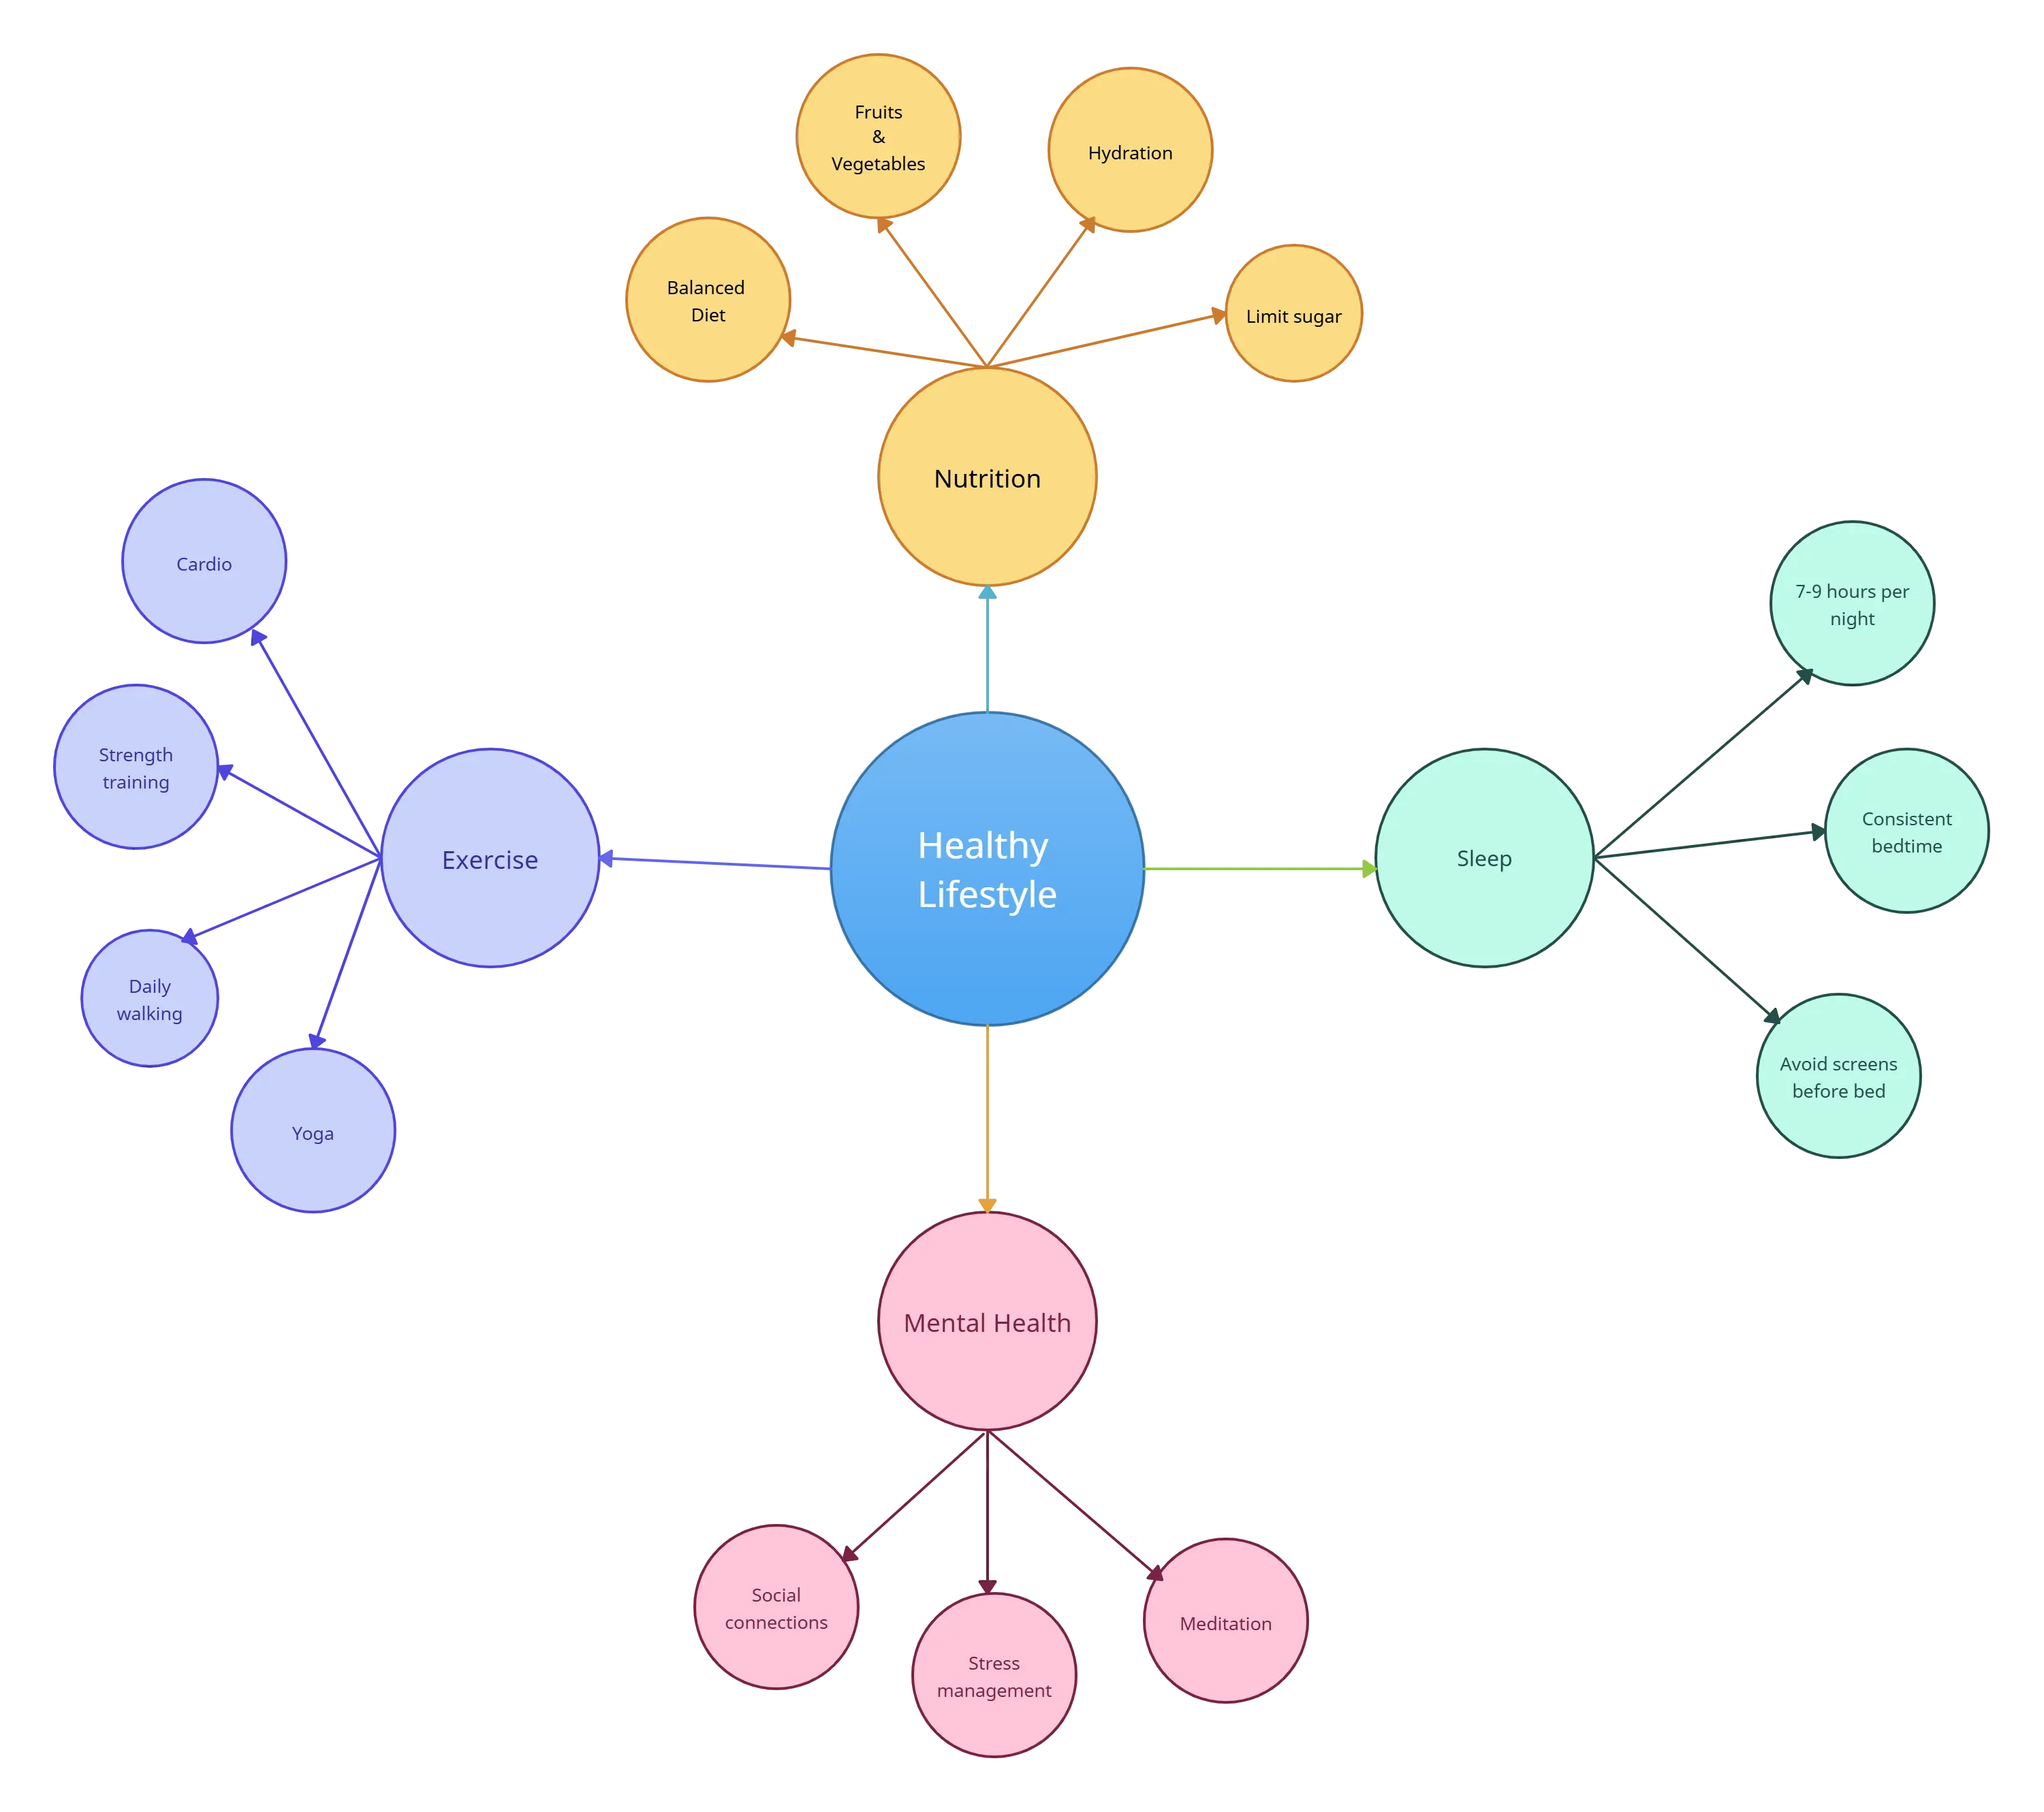
Arrange Subtopics Around the Center:
These should be placed around the central topic. For example, subtopics for a topic like sports could be football, badminton, hockey, etc.
Expand Each Subtopic:
Take each of these subtopics and brainstorm around them. Ideas related to these subtopics in the example above could be the number of players, the equipment used, etc.
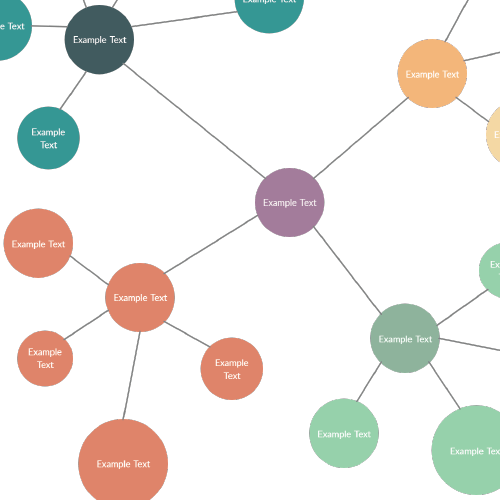
Connect Ideas and Add Levels:
Use connectors and Plus Create to easily add as many levels as possible to the cluster diagram until you run out of ideas.
Style and Highlight Your Diagram:
Using Creately’s wide range of color themes, you can quickly style them to look more presentable as well as to highlight the different parts of the cluster diagram for easier analysis.
Export and Share:
Once completed, you can download it as an SVG, PNG, JPEG, or PDF to publish, embed in presentations, or print.
FREE Editable Cluster Diagrams for Any Project
FAQs on Online Cluster Diagram Template
What are Creately’s cluster diagram template pricing plans?
- Free Plan — $0/month for basic cluster diagram creation and collaboration
- Starter & Team Plans — $8/month or $5/month billed annually
- Business Plan — $149/month or $89/month billed annually
Annual billing helps you save more while unlocking advanced collaboration, workspace management, and enhanced cluster diagram features. You can compare all available plans and features on the Creately Pricing Page.
How can you create cluster diagrams faster?
Are there templates for different cluster diagram use cases?
Can teams collaborate on cluster diagrams?
Can I add notes, data, and files?
Can I share, present, or export cluster diagrams?