Some projects are easy to manage, while others take a lot of effort. In either case, having a proper project plan will help you make sure that it gets completed flawlessly.
If you have a clear view of everything that needs to happen and how you are going to get them done within a specific time period, you can minimize – if not altogether eliminate – the chance of project failure.
In this post, we have compiled a list of project planning techniques that you can use to create a solid project plan and execute it successfully. We’ll be looking at different areas of project planning such as planning process, resource planning, knowledge management, process mapping, decision-making, and risk management.
Planning Process
At the first stage of project planning, you need to set goals, create a project plan outline and analyze your budgetary needs. You can use the project planning techniques below to quickly complete these tasks.
SMART Goals
SMART is a criterion for setting goals and objectives for projects. According to SMART, your project goals should be Specific, Measurable, Attainable, Relevant and Time-bound.
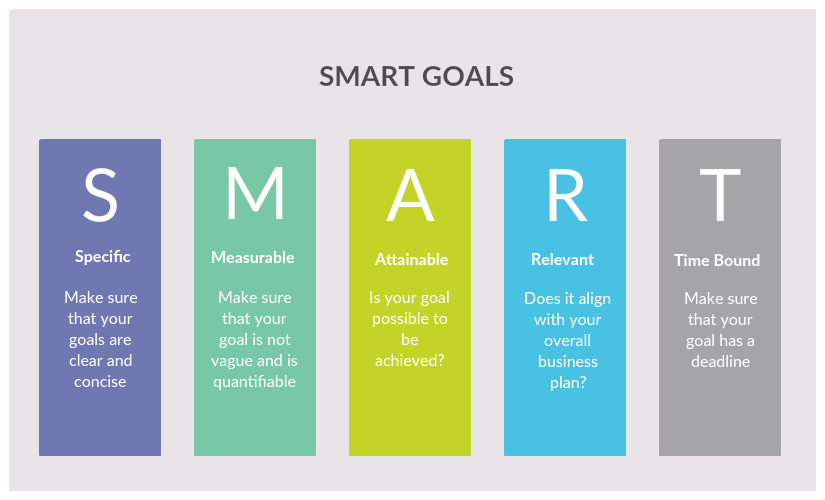
SMART Goal Criteria
Check out our The SMART Guide to Streamlining Your Project Planning Process to learn how to properly use the SMART criteria in project planning.
Work Breakdown Structure
Work breakdown structure (WBS) is a project management tool used to visualize the outcomes a project will deliver in a hierarchical structure. It helps project managers break down complex project activities into simple and manageable tasks.
How to use it
Step 1: First step of creating a WBS is to understand the scope of the project. This means you need to identify the project goals, deliverables, tasks, deadlines etc.
Step 2: Identify the key deliverables. These key deliverables are the ones that are essential to the success of the project and they should appear at Level 2 of your work breakdown structure.
Step 3: Identify work packages or the project deliverables at the lowest level of your WBS. Gather your project team and stakeholders to figure out all the work necessary to complete the key deliverables.
Step 4: Create a WBS dictionary that contains the definition and scope of the elements (work packages) in the chart.
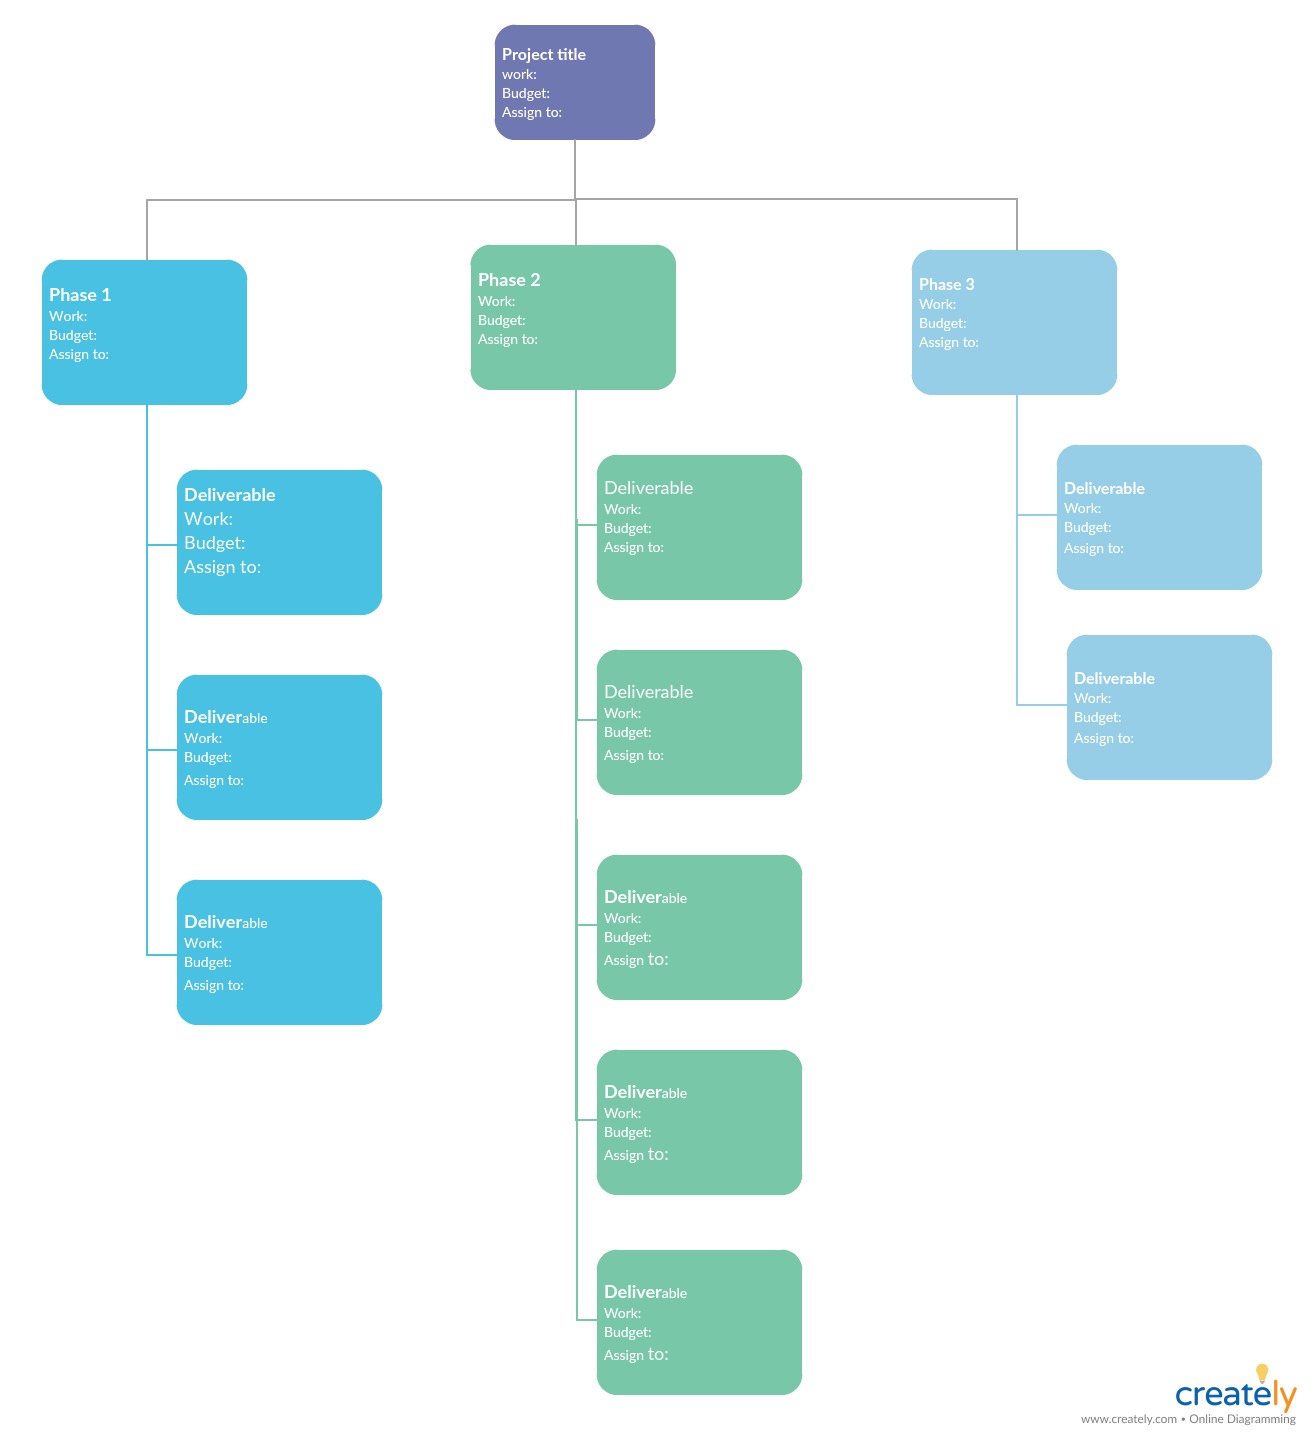
Work Breakdown Structure Example (Click on the template to edit it online)
Action Priority Matrix
The action priority matrix is a project planning tool that is used to determine which activities to prioritize and which activities to avoid in order to make the most use of your time and resources. It helps in making better decisions.
How to use it
In the action priority matrix, the effort of the activity should be marked on the x-axis and the impact of it on the y-axis. The action priority matrix creates 4 possibilities;
- Quick wins/ Urgent – these are the activities that have a high impact and takes a low effort to complete. It’s better to focus on these kinds of projects as much as you can.
- Major projects/ Not urgent – these are the projects/ activities that have a high impact and take a high effort. While you shouldn’t let these projects overshadow the quick wins, you should plan well for them before executing.
- Fill-ins/ Delegate – these are the low priority projects that have a low impact and low effort. You can work on them when you have time in between quick wins and major projects. Or you can delegate them to another team.
- Hard slogs/ Postpone or ignore – these are the tasks that have a low impact but requires high effort. It’s advised to avoid performing them, or if they cannot be avoided, take the help of an expert who can finish it efficiently
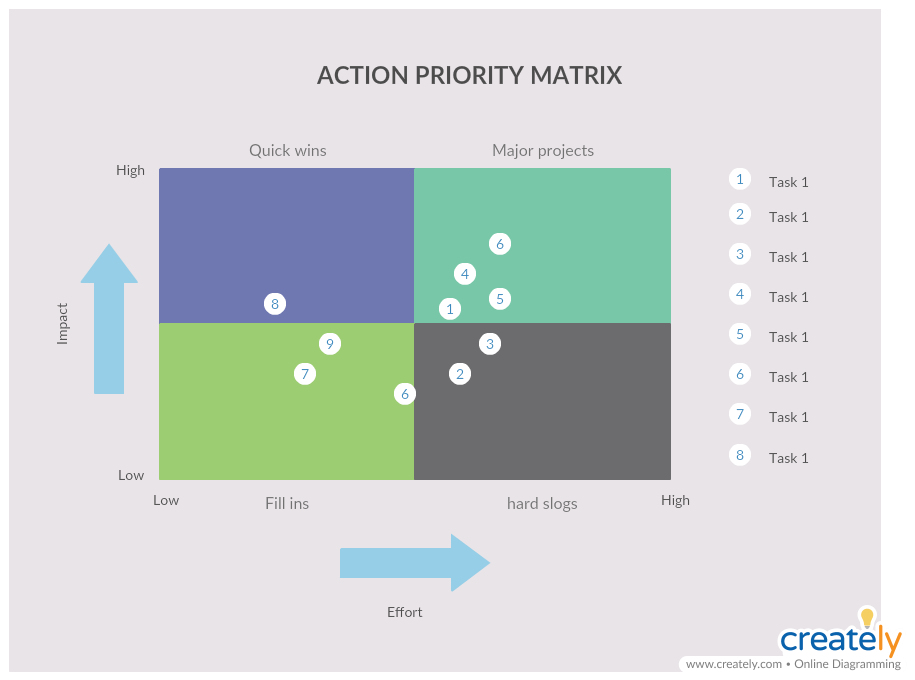
Action Priority Matrix (Click on the template to edit online)
Cost Breakdown Structure
Cost breakdown structure (based on the WBS) is one of the project planning techniques that is used to allocate costs to different parts of a project (to the activities in the lowest level of your work breakdown structure). It is used to compare the actual costs with the budget.
How to use it
Step 1: In your work breakdown structure, make sure that all work packages represent a discrete and definable task from one another. And assign each work package a start and finish date.
Step 2: Give each work package you have identified a specific budget amount. Make sure that you have also assigned a responsible budget owner for this.
Step 3: Examine the costs and determine how much the project will cost you at each level of the work breakdown structure.
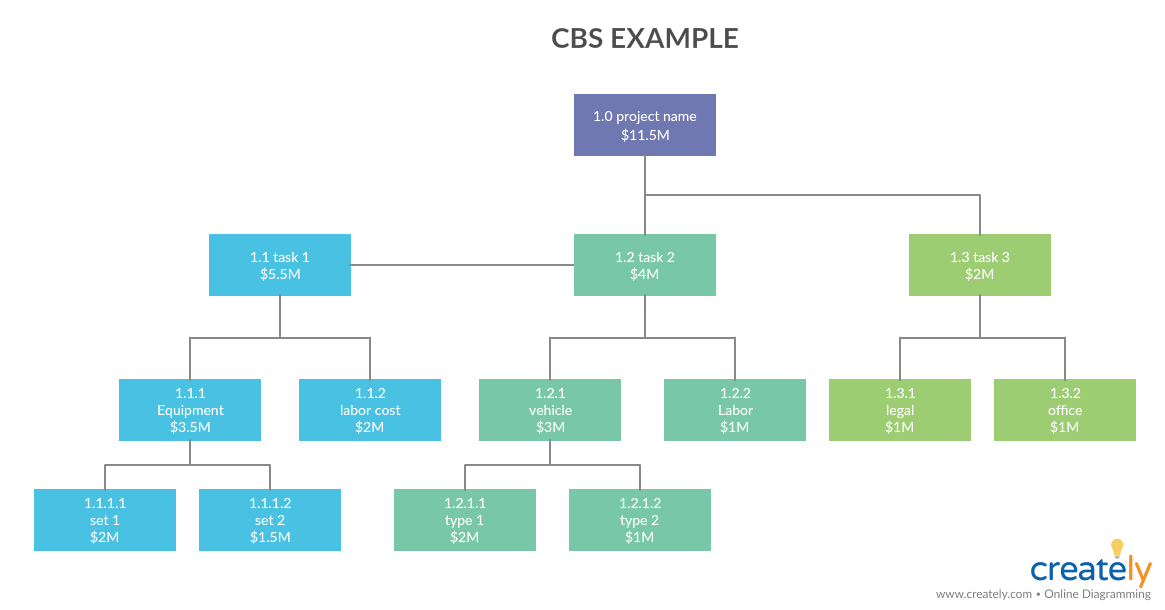
Cost Breakdown Structure (Click on the template to edit online)
Milestone Trend Analysis
Milestone trend analysis is a project planning technique for tracking milestones in a project. It helps identify if the work related to a project milestone is ahead of or behind schedule.
How to use it
Step 1: Refer to your project schedule and define the milestones of your project. It’s better to not have a lot of milestones, lest it would look confusing on your milestone trend analysis chart.
Step 2: In the MTA chart, the y-axis represents the project timescale, and the x-axis represents the report timescale. You can use a specific line with a specific color or specific marker shape to symbolize the milestone in the chart. Add the milestones to the chart at the end of each reporting period.
Step 3: Refer to the MTA chart to identify milestone trends in your project.
Refer to this post to learn how the milestone trend analysis works in detail.
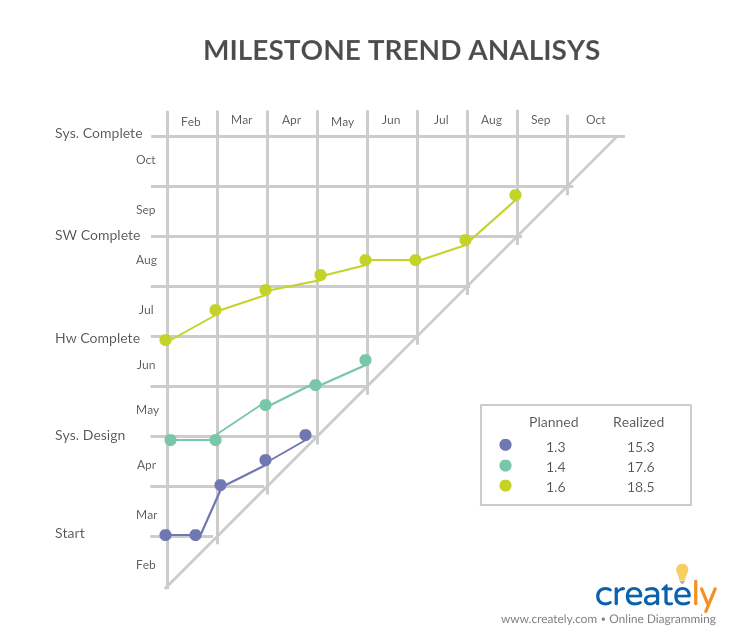
Milestone Trend Analysis (Click on the template to edit it online)
Resource Planning
In order to execute projects more effectively, you need to allocate your resources properly. In the resource planning stage, you need to take note of the types of resources you need for the project tasks and determine the duration of each task.
Gantt Charts
Gantt charts are a project planning tool and technique that is used to schedule and monitor tasks. They can also be utilized to convey cost and expenditure at different staged of a project.
How to use it
Step 1: Break down the project into individual tasks and assign them rows in the Gantt chart.
Step 2: Each task has a timeline, and you can color code them as you need. Overlaying the timeline is a progress line and using it, mark how much work has been done on the task.
Refer to our post How to Use Gantt Charts to Plan Projects Like a Boss to learn more about using Gantt charts in planning projects.
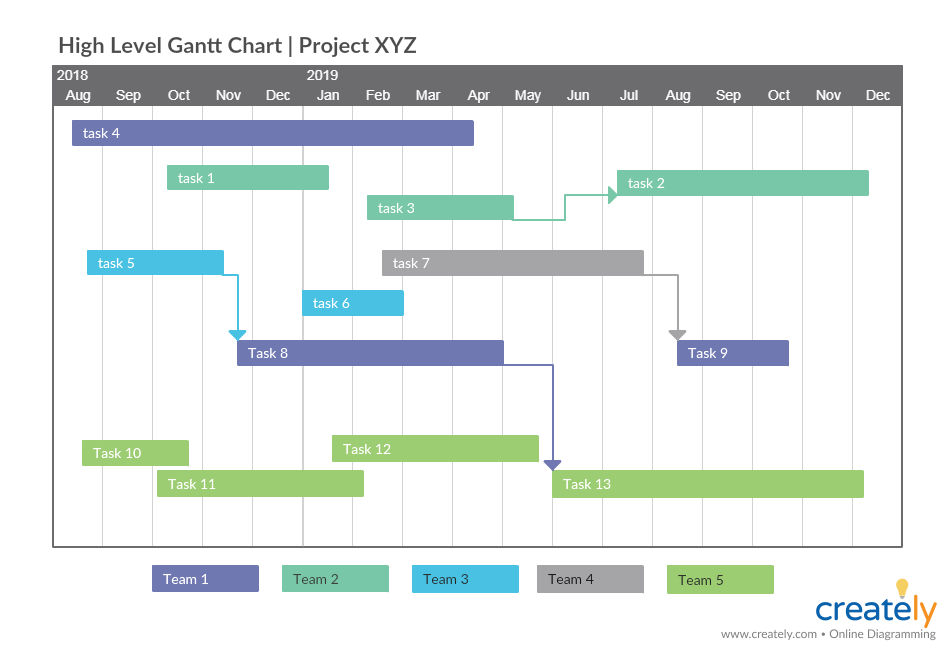
Gantt Chart for High-Level Project Plan (Click on the template to edit it online)
Organizational Charts
Organizational charts are project planning techniques that you can use to visualize the project team – their roles and responsibilities. Using it you can not only highlight the hierarchy and the reporting structure, but you can actually use it when assigning tasks to individuals.
How to use it
Step 1: Examine the available resources to you, and associate them with the tasks.
Step 2: Understand the hierarchy/ reporting structure of the project team.
Step 3: Using an org chart template like the one below, you can assign each individual a place in the chart. You can add the necessary information, like the roles and responsibilities, availability etc. on the org chart. Referring to it, you can assign each individual relevant tasks.
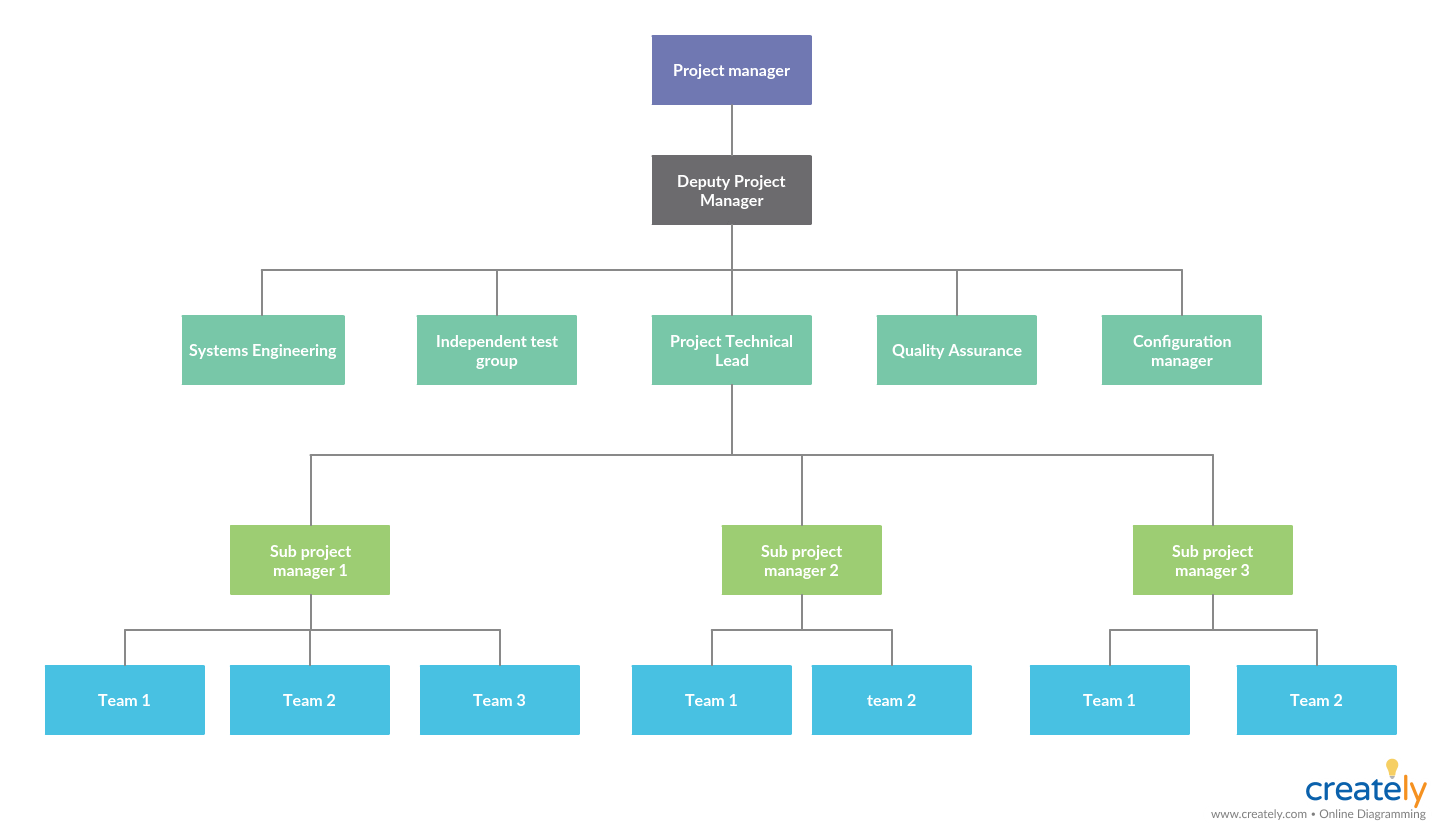
Project Management Organizational Chart (Click on the template to edit it online)
More Organizational Chart Templates
Knowledge Management
When working on projects, the team needs to refer to different resources like tutorials, meeting minutes, process documents etc. to get some areas of their work done. If there’s a single place – something like a database – where they can access all information, it would save a lot of time.
Knowledge Maps/ Mind Maps
Mind maps are a tool that is used to organize information. Project teams use mind maps during brainstorming sessions to capture the free flow of ideas and structure them in an easy to understand manner. They can also be used as knowledge maps that store necessary information.
How to use it
Step 1: Gather the resources the team needs to refer to and categorize them. Eg: In a website building project, blog posts, videos, infographics on website planning can be categorized as Website Planning Tutorials.
Step 2: Using Creately, you can add the relevant links. Simply click the shape, access Properties and add your link under Link to a URL or a Diagram
Step 3: If you are embedding the diagram on a web page, publish it as an interactive diagram with the Creately Viewer.
Process Mapping
If you have clarified how to execute a certain task step by step, it would be easy for anyone – whether familiar with the process or not – to carry it on without a struggle. This is where mapping your processes comes in to play.
Process Maps
Process maps are a tool that is used to visualize the steps of a work activity and the people who are responsible for it.
To learn what process maps are, process maps symbols, process map types and how to draw a process map, refer to our Easy Guide to Process Mapping.
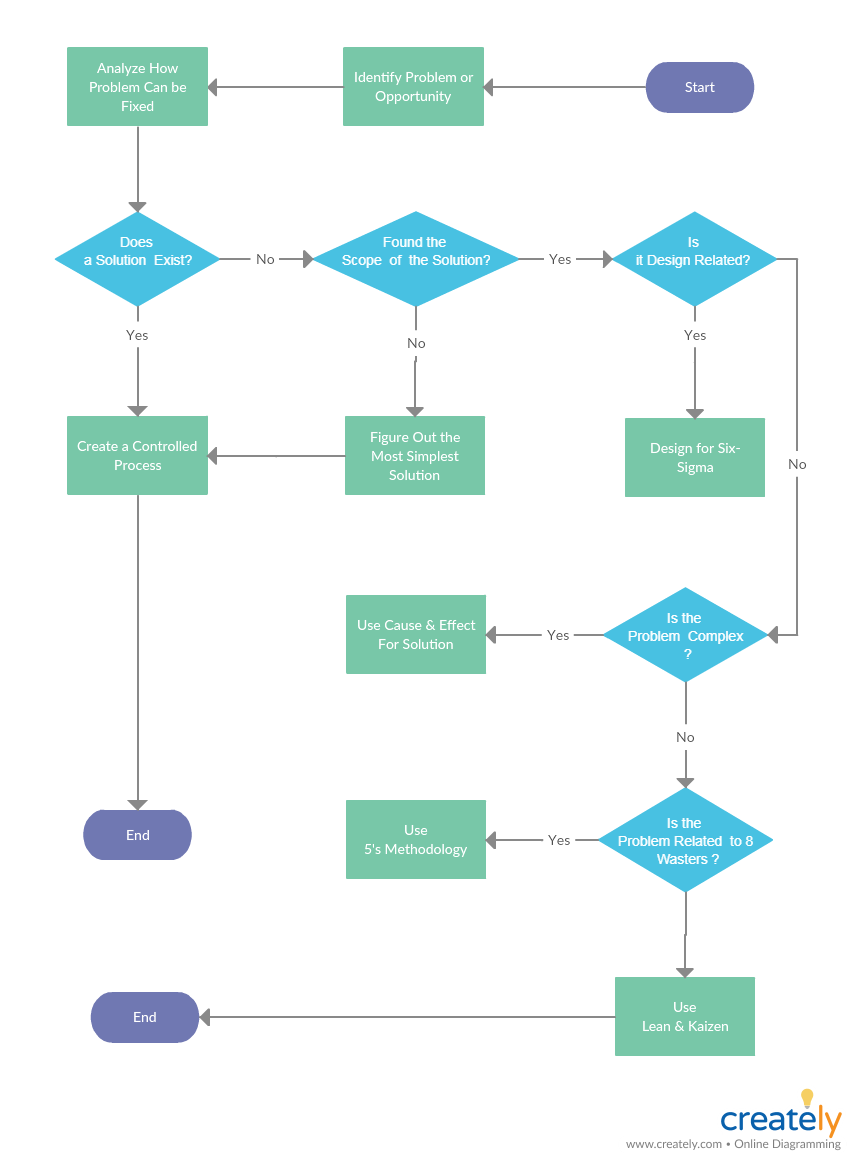
Project Management Process Map Template (Click on the template to edit it online)
PERT Chart
PERT stands for Project Evaluation Review Technique. It helps map your processes from start to finish.
PERT chart helps teams to quickly identify ‘bottlenecks’ in projects which can then be instantly addressed. This helps to save so much time in the long-term, rather than waiting for problems to come up.
In this detailed guide to PERT charts, we have covered how to use this project planning technique and what benefits you can gain by using it.
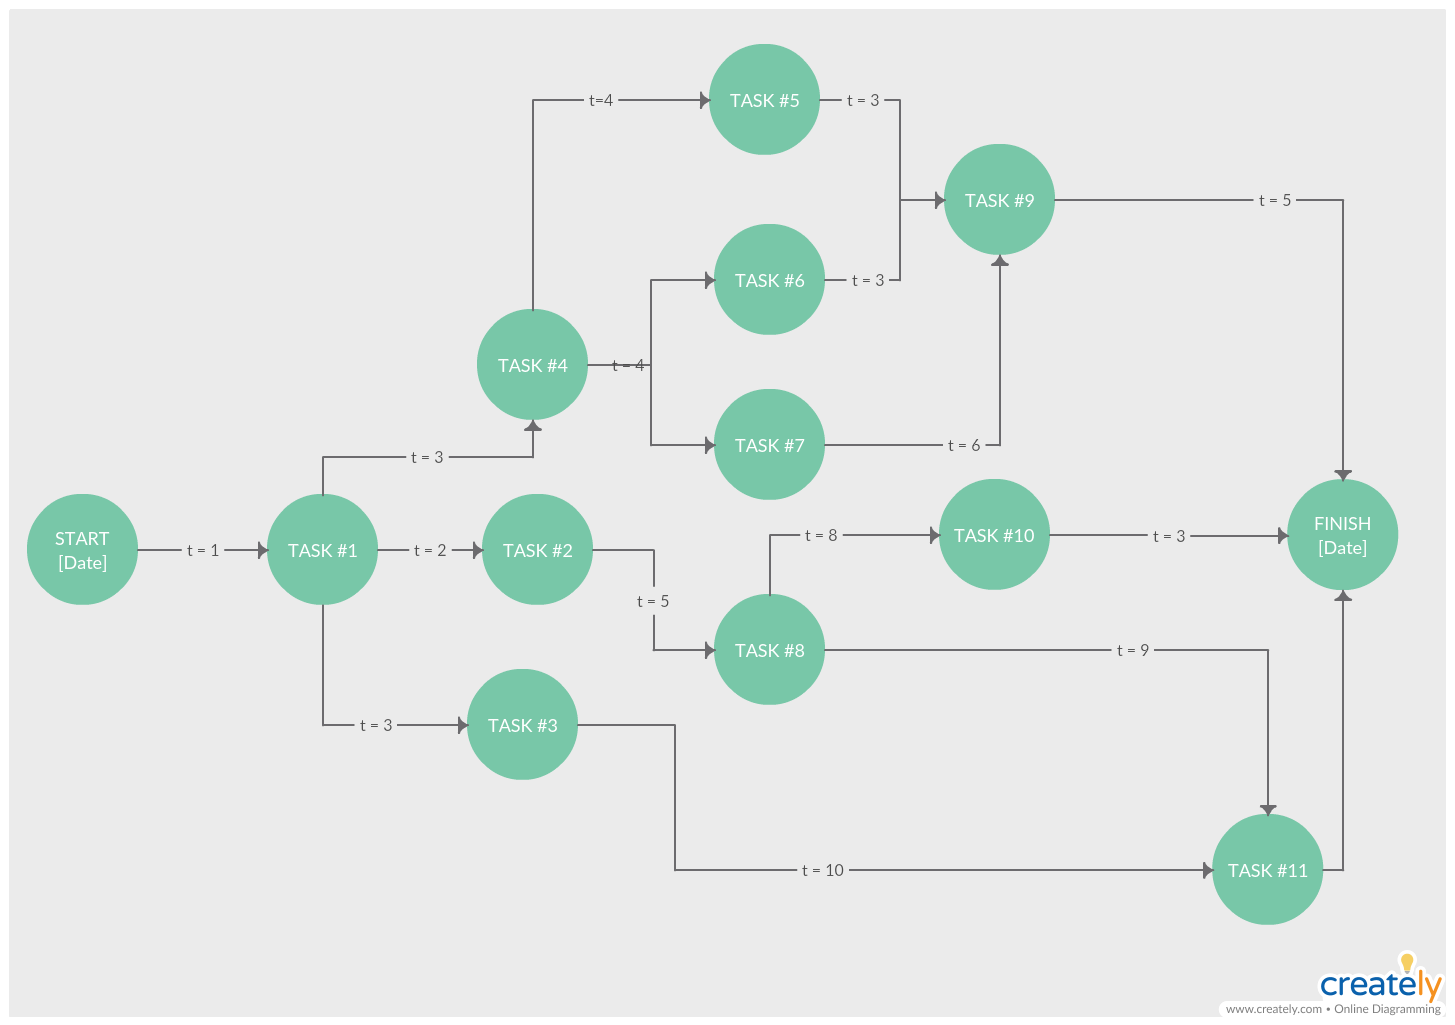
PERT Chart for Project Planning (Click on the diagram to edit online)
Brainstorming/ Decision Making
Brainstorming and decision-making sessions tend to take a lot of time during the project planning process and throughout the project. While brainstorming is necessary to come up with creative ideas, it’s an indispensable technique when making decisions and solving problems.
Affinity Diagrams
Affinity diagrams are used to group a large set of ideas/ data/ opinions under a particular theme or category based on their relevance to each other. It can be used to arrange ideas generated from a brainstorming session, in a logical manner.
How to use it
Step 1: Get together a competent team for the brainstorming session
Step 2: Record each and every idea/ opinion shared during the session
Step 3: Sort the ideas according to their similarities
Step 4: Group them together, and give each group a name for identification
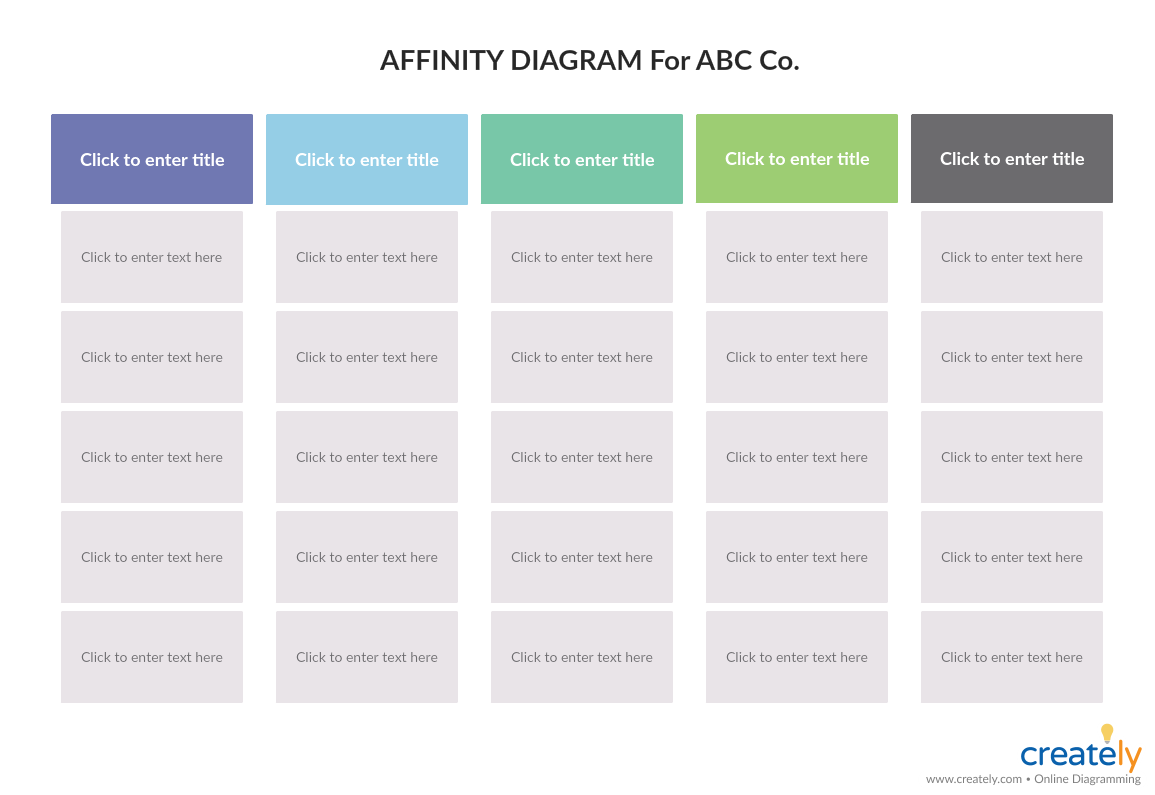
Affinity Diagram Template (Click on the diagram to edit it online)
PICK Chart
PICK chart is another project planning technique that you can use to organize ideas after a brainstorming session. It helps you identify which ideas are easy to implement and which has a high payoff or in other words which ideas are the most useful ones.
How to use it
According to the PICK chart, you can label your ideas as
- Possible: these are the ideas that are easy to implement but have a low payoff
- Implement: ideas in this section of the chart are easy to implement and have a high payoff
- Challenge: here the ideas are harder to implement and the payoff is difficult to determine
- Kill: these ideas are harder to implement and have a low payoff
Once you place your brainstormed ideas on the matrix, it will become clearer as to which idea you should work on first and which should be avoided.
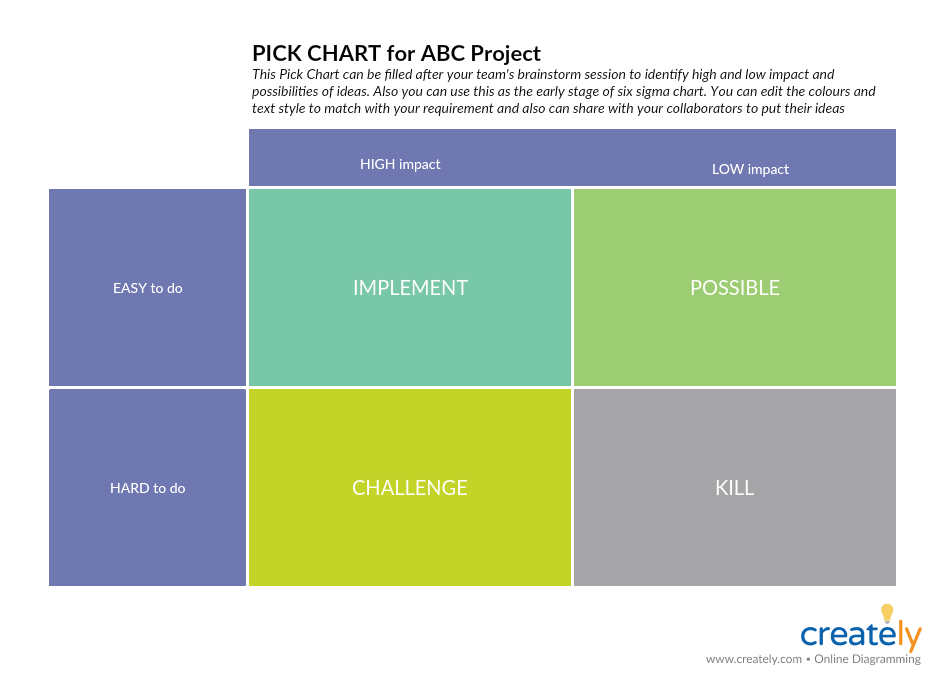
Pick Chart for Project Planning (Click on the template to edit it online)
Decision Tree
When you are presented with several courses of action, you can use a decision tree to analyze the different outcomes of choosing those options.
How to use it
Step 1: Identify and define the decision and place it at the beginning of the diagram
Step 2: Write down possible solutions on the lines connected to the next level of shapes of the decision tree.
Step 3: Put the outcome of these solutions on the shapes connected to the lines. You can use an oval to represent outcomes that are certain. And if an outcome leads to a new decision place it on a rectangle.
Step 4: Gather your team of decision-makers and review the analysis to make a final choice
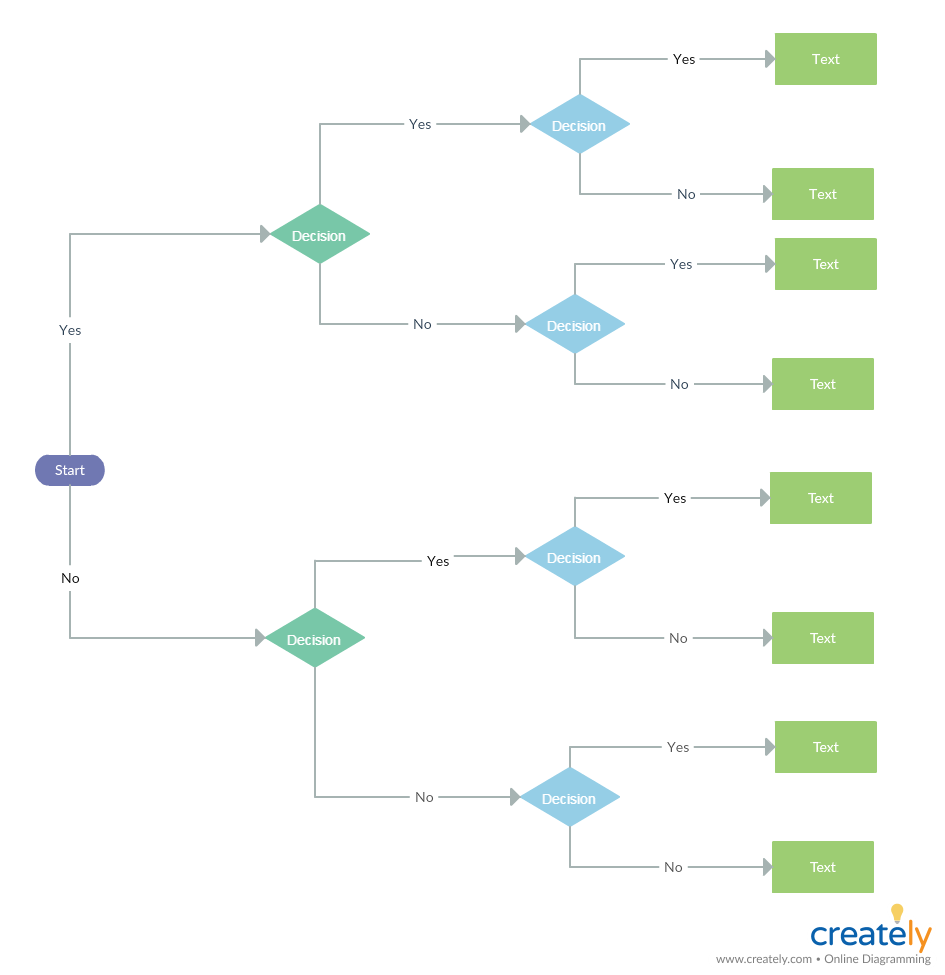
Decision Tree Diagram Template (Click on the diagram to edit it online)
Risk Management
Risks are an unavoidable element in projects, and the best way to minimize the impact they might have on your goals is to prepare for them in advance. By identifying and analyzing risks beforehand, you can avoid negative results that may affect the project outcomes.
In our Ultimate List of Visual Risk Management Techniques we have covered 11 effective risk management techniques that you can use to identify, assess and control risks.
Expand the List of Project Planning Techniques
Here we’ve covered useful visual techniques that you can use as project planning techniques. They are not only easy to use but effective when it comes to project planning, decision-making, problem-solving, managing knowledge etc.
Have you got more project planning techniques to add to the list? Let us know in the comment section below.


Thanks Amanda for the well done Job the content is very easy to follow and understand , it has also supported me with ideas to write the assignment.
Amanda,
your diagramming and collaboration tool are excellent. I made a good use for my assignment.
god bless you with lot of skills to serve anyone.