Processes shape how work gets done every day, but when steps exist only in people’s heads or across scattered documents, things can quickly become inefficient. Tasks slow down, responsibilities become unclear, and small issues grow into larger operational problems. Process mapping helps teams turn that hidden work into a visible workflow they can understand, improve, and standardize.
This guide explains what process mapping is, who uses it, and how to create a process map step by step. It will help you document workflows more clearly, identify inefficiencies faster, and give everyone a shared understanding of how work gets done.
What Is Process Mapping?
Process mapping is the practice of visually outlining how a process works from start to finish. It shows each step, decision point, input, and output involved in completing a task or delivering an outcome. By laying out the workflow in a clear diagram such as a flowchart or swimlane, process mapping helps you understand how work actually gets done, identify bottlenecks or inefficiencies, clarify roles and responsibilities, and find opportunities to improve or standardize processes.
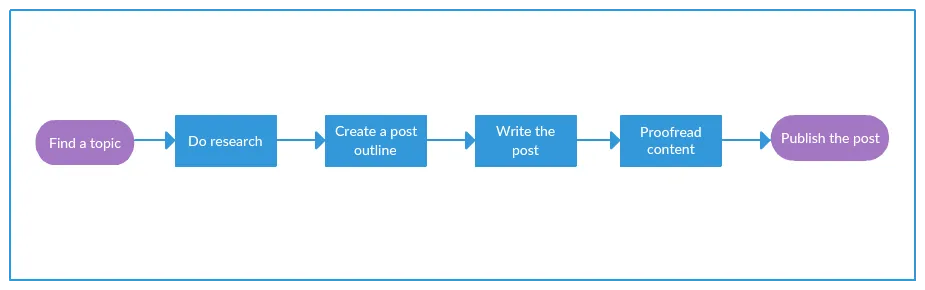
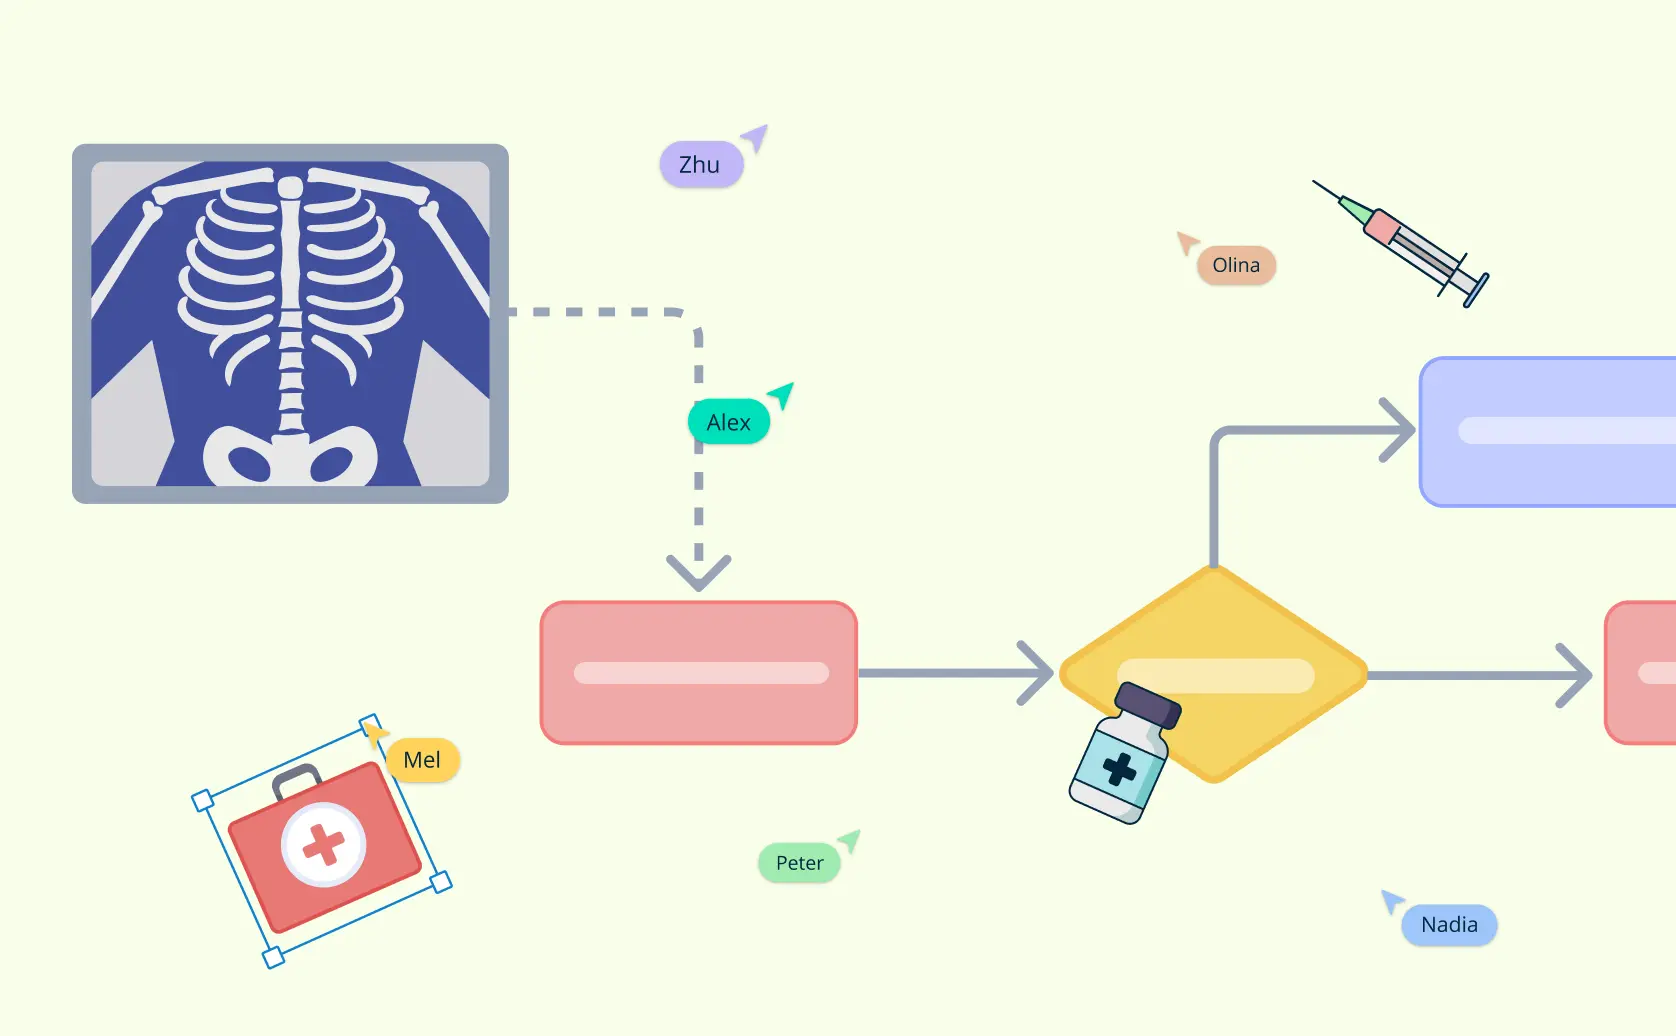
A basic process map would look like the example below.
Read our guide on types of process maps to learn more about the different kinds of process mapping and how each method can be used.
Who Uses Process Maps
Process mapping is used by a wide range of professionals and organizations to improve how things are done. Here are some of the key users:
Business analysts: They use process mapping to understand and document how business processes work, identify problems, and suggest improvements.
Managers and leaders: Managers use process maps to monitor and optimize workflows, ensuring efficiency and consistency across teams.
Operations teams: These teams use process maps to streamline daily operations and find ways to reduce waste or bottlenecks in their work.
HR and training teams: HR departments use process mapping to create clear training materials, showing new employees how to perform specific tasks or follow procedures.
Project managers: They rely on process mapping to plan, track, and improve project workflows, making sure everyone is aligned and tasks are completed on time.
Quality improvement teams: These teams use process maps to identify areas for improvement and ensure that processes meet quality standards.
Consultants: Consultants use process mapping to analyze a company’s operations, diagnose issues, and recommend improvements.
How to Make a Process Map
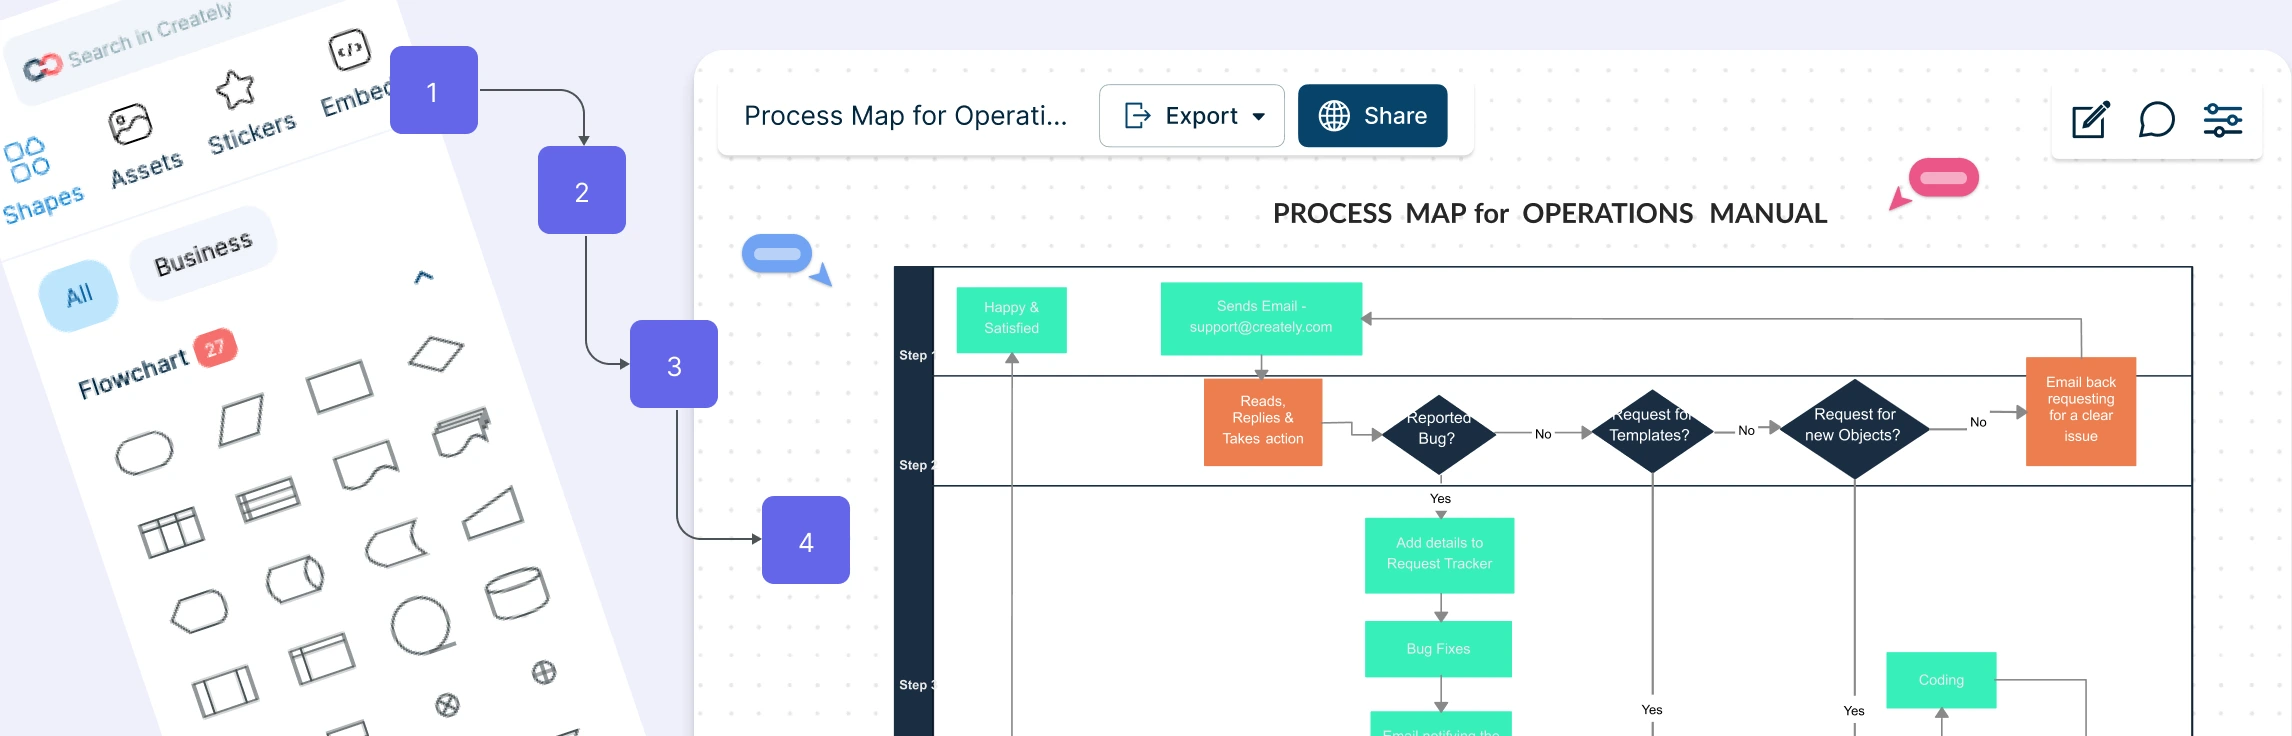
Here’s a step-by-step guide to help you map out any process clearly and effectively. You can use Creately’s process mapping tool to quickly map workflows, customize steps, and turn complex processes into diagrams everyone can align on.
Step 1: Identify the Process You Need to Map
First, choose the process you want to map. Think about what you’re trying to achieve. Are you mapping a process that’s not performing as well as it should? Maybe it’s a process that’s essential to a new strategy you’re rolling out, or one that affects customer satisfaction. Pick the process that aligns best with your goals, and give it a clear, descriptive name to keep everyone on the same page.
Step 2: Bring Together the Right Team
Creating an accurate process map requires input from the people who know the process best. Gather a team that includes everyone involved in this process, including those who do the work, oversee it, and depend on it. The team should include individuals from all roles in the process, so every step and detail is represented. This team will help ensure that your map covers everything, from start to finish.
Step 3: Gather All the Necessary Information
Next, start collecting the details about the process. Answer these essential questions to create a complete picture:
- Where does the process begin, and where does it end? Define the starting and ending points clearly.
- What steps happen in between? Identify every task that occurs from beginning to end.
- What are the inputs and outputs of each step? List any information, resources, or materials needed to complete each step, as well as what it produces.
- Who is responsible for each part? Note who does what, including any specific roles involved at each stage.
- When, where, and how does each step happen? Include details on timing, locations, and methods if they’re relevant.
This information will serve as the foundation for your process map.
Step 4: Organize the Steps in a Sequential Order
Once you have all the steps, arrange them in the exact order they happen, from the start of the process to the end. Organizing them sequentially is essential for clarity, as it shows how each step flows into the next. Work with your team to confirm that this sequence accurately represents the real-life process.
Step 5: Draw the Baseline Process Map
Now it’s time to create your first map, showing the process as it currently operates. This is known as the “baseline” map. Use process mapping symbols to represent each step, and connect them with arrows to show the flow.
Step 6: Analyze the Map to Find Areas for Improvement
Take a close look at the baseline map and identify any bottlenecks, inefficiencies, or unnecessary steps. Are there tasks that seem redundant or steps that cause delays? Use this analysis to pinpoint where changes could streamline the process. This step is crucial for making the process faster, more efficient, or more effective.
Step 7: Implement Improvements and Monitor Them
Once you’ve identified areas for improvement, introduce changes on a small scale to test their impact. This could mean adjusting a specific step or trying a different approach to see if it works better. If these changes lead to noticeable improvements, roll them out across the full process. Continue monitoring the process to ensure the improvements are working as planned and to see if any further adjustments are needed.
Tips to Create Effective Process Maps
Mapping process steps becomes far more effective when you follow a few practical guidelines. These tips help you create clear, accurate process maps that teams can easily understand and improve.
Start with a clear goal: Know exactly what you’re mapping and why. Whether you’re fixing delays, improving quality, or onboarding new team members, a clear goal keeps the process map focused and useful.
Keep it simple at first: Begin with the main steps before adding detail. A clean, high-level view makes the process easier to understand and prevents the diagram from feeling overwhelming.
Use consistent symbols and labels: Stick to standard flowchart or process mapping symbols and use clear, plain language for step names. Consistency helps everyone read and interpret the map quickly.
Show who does what: Clarify ownership by indicating roles, teams, or systems involved in each step. Swimlanes or labels make responsibilities obvious and reduce confusion.
Highlight decision points and handoffs: Pay close attention to approvals, decisions, and transitions between people or teams. These are often where delays, errors, or bottlenecks occur.
Validate with the people involved: Review the process map with those who actually do the work. Their feedback ensures accuracy and helps uncover gaps or assumptions you may have missed.
Design for change, not perfection: Processes evolve. Create maps that are easy to update so they stay relevant as tools, teams, or requirements change.
Advantages and Disadvantages of Process Maps
Process maps come with clear benefits, but they’re not a one-size-fits-all solution. Understanding both their advantages and limitations helps you use them more effectively.
| Advantages of Process Maps | Disadvantages of Process Maps |
|---|---|
| Make workflows easy to understand at a glance | Can become too complex if over-detailed |
| Reveal bottlenecks, delays, and inefficiencies | Require time and effort to create and maintain |
| Clarify roles, responsibilities, and handoffs | May oversimplify complex or dynamic processes |
| Improve communication across teams and stakeholders | Can become outdated if not reviewed regularly |
| Support process improvement and standardization | Depend on accurate input from participants |
| Help with training, onboarding, and documentation | Not always suitable for highly creative or non-linear work |
| Provide a shared visual reference for decision-making | Large processes may need multiple maps for clarity |
Why Choose Creately for Process Maps
When processes are hard to follow, work slows down and mistakes creep in. Creately helps you turn complex workflows into clear, usable process maps that teams can actually work with.
Ready-made process map templates to get started
Creately offers a variety of templates for different types of process maps. Whether you’re working on a simple workflow or a more complex system, you can start with a pre-made template or create your own from scratch.
Create faster with drag-and-drop tools
Use an intuitive drag-and-drop interface to add steps, symbols, and connectors with ease. Features like Plus Create help you build complete process flow maps quickly, without friction or design overhead.
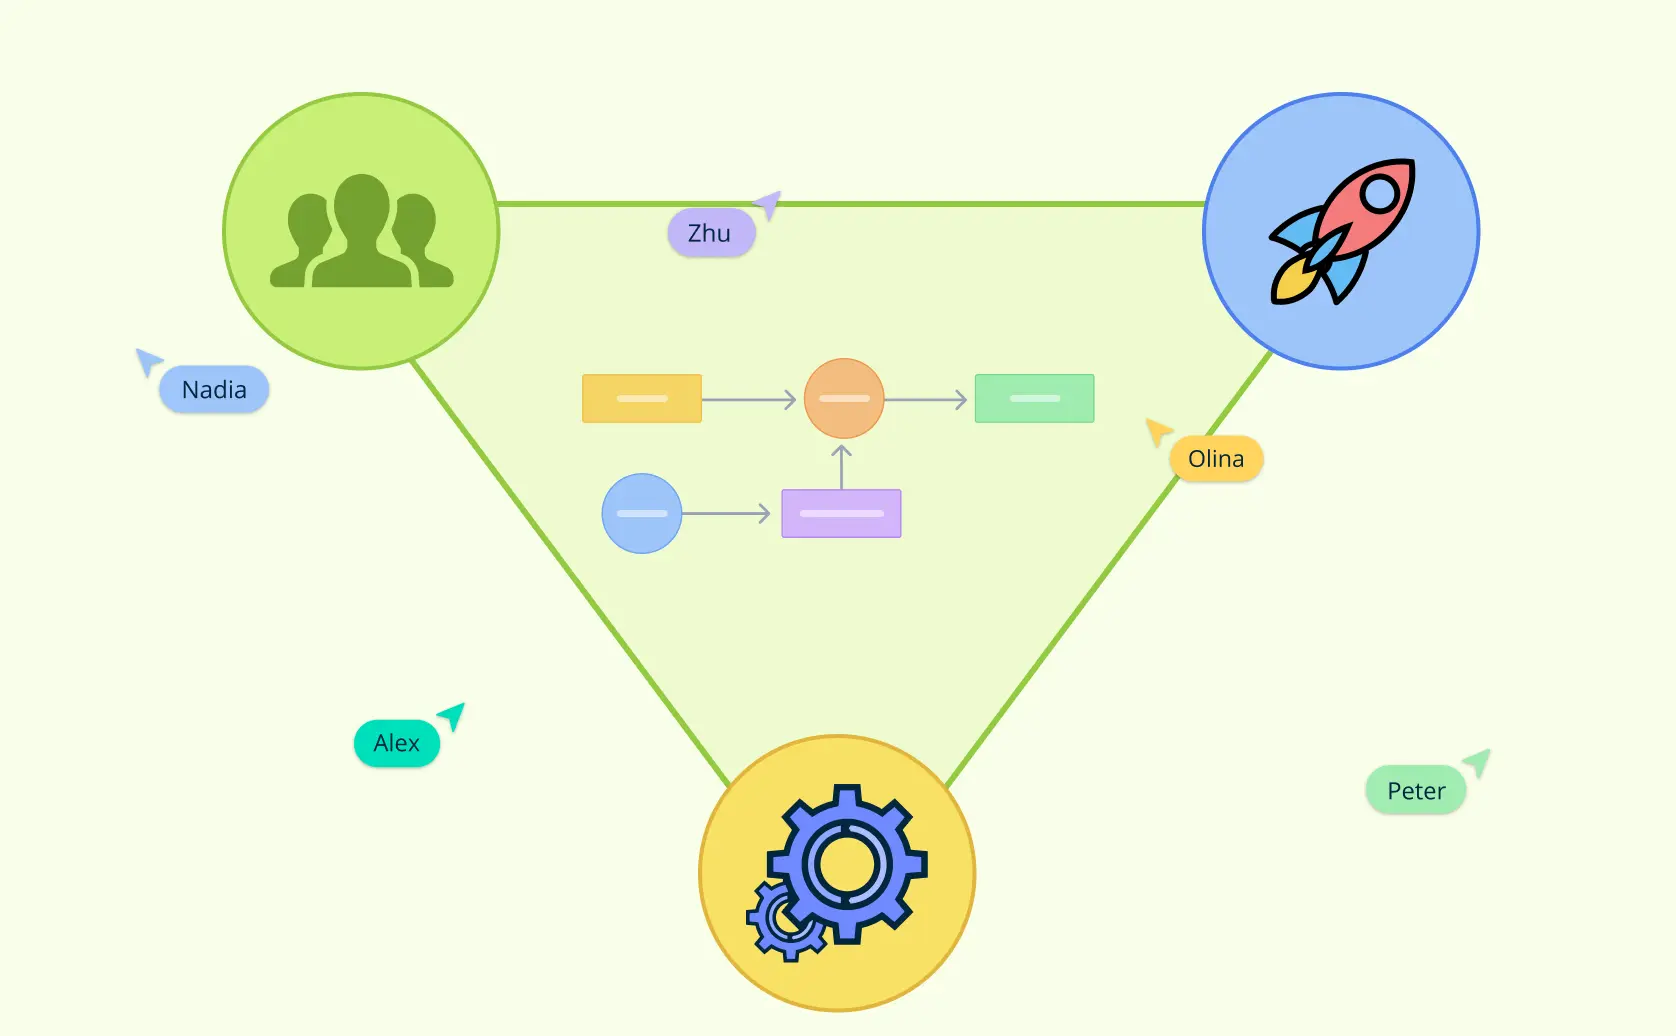
Collaborate in real-time, from anywhere
Work on the same process map together with real-time cursors, comments, and mentions. Gather feedback, make updates instantly, and avoid version control issues, so everyone stays aligned, even across teams or locations.
Add context with notes and attachments
Keep everything in one place by adding notes, screenshots, documents, forms, and links directly to each step. This extra context makes it easier to understand how the process actually works and reduces back-and-forth.
Centralize all process-related resources
Combine visual workflows with supporting information to create a single source of truth. With all resources attached to the process map, teams spend less time searching and more time executing.
Link processes for a complete picture
Connect multiple process maps together to create an interlinked workspace. This makes it easy to explore related workflows, understand dependencies, and see how individual processes fit into the bigger picture.
Use for planning, change management, and training
Use process maps to plan improvements, visualize changes, and guide teams through transitions. They also double as clear training and onboarding materials, helping new team members understand processes faster and with confidence.
Free Process Map Templates to Get Started


Helpful Resources for Making Process Maps
Learn step-by-step how to make a process map in Microsoft Word.
Learn step-by-step how to make a process map in Microsoft Excel.
Learn step-by-step how to make a process map in Microsoft PowerPoint.
FAQs about Process Mapping
How to choose the right process map template?
Are process flow maps only for linear processes?
How do decision points work in process maps?
Can process maps show exceptions or edge cases?
What is process mapping in business?
Resources
Antonacci, Grazia, et al. “The Use of Process Mapping in Healthcare Quality Improvement Projects.” Health Services Management Research, vol. 31, no. 2, 30 Apr. 2018, pp. 74-84, https://doi.org/10.1177/0951484818770411.
Klotz, Leidy, et al. “The Impact of Process Mapping on Transparency.” International Journal of Productivity and Performance Management, vol. 57, no. 8, 31 Oct. 2008, pp. 623-636, https://doi.org/10.1108/17410400810916053.


Bradley Briscoe
this was great