This guide explains how to create a process map in PowerPoint with SmartArt, from choosing a layout to reviewing and sharing the finished workflow. It also covers where PowerPoint works well, the limitations that appear as a process becomes more complex, and when a dedicated process mapping tool is a better fit. Free process map templates are included to help you get started.
What is a Process Map?
A process map shows each step in a process, the order in which those steps occur, and the decisions or handoffs involved along the way. By laying everything out visually, a process map makes it easier to understand how tasks flow, who is responsible for what, and where delays, gaps, or inefficiencies might be happening. Teams do process mapping to document existing workflows, improve inefficient processes, onboard new team members, and align stakeholders around a shared understanding of how work actually happens, not just how it’s supposed to happen.

How to Make a Process Map in PowerPoint
Let’s take a look at how to make a Microsoft PowerPoint process map.
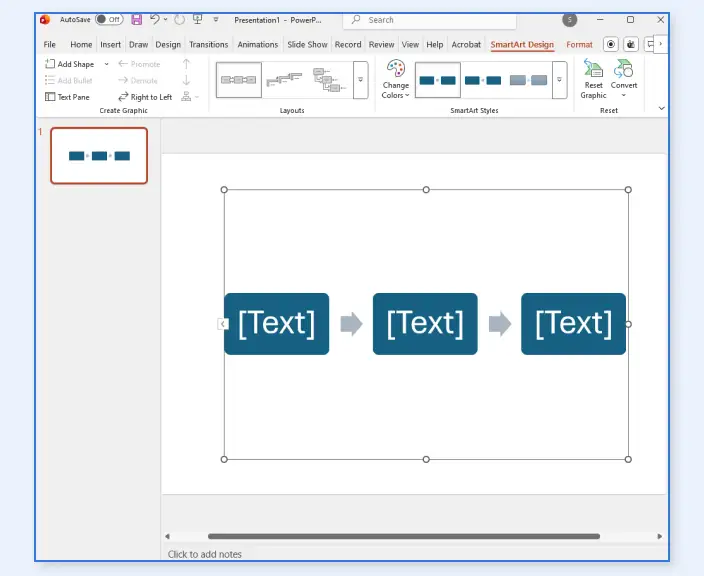
Step 1: Insert a SmartArt process layout
Go to Insert → SmartArt → Process and choose a layout that best matches your workflow, such as Basic Process or Chevron Process. These layouts work well for straight, sequential steps, but they offer limited flexibility if your process includes multiple paths or decision points.
Step 2: Enter your process steps
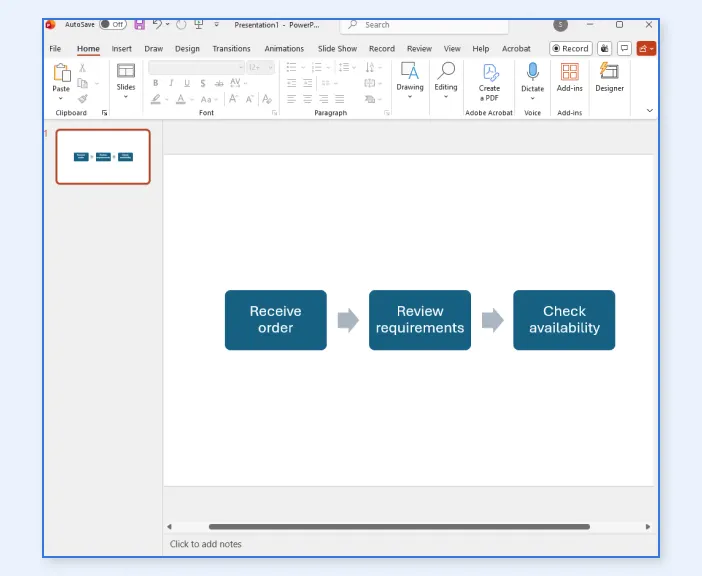
Click into each SmartArt shape and enter your step names directly. This keeps things quick and neatly aligned, though longer descriptions can be harder to fit without resizing shapes or affecting readability.
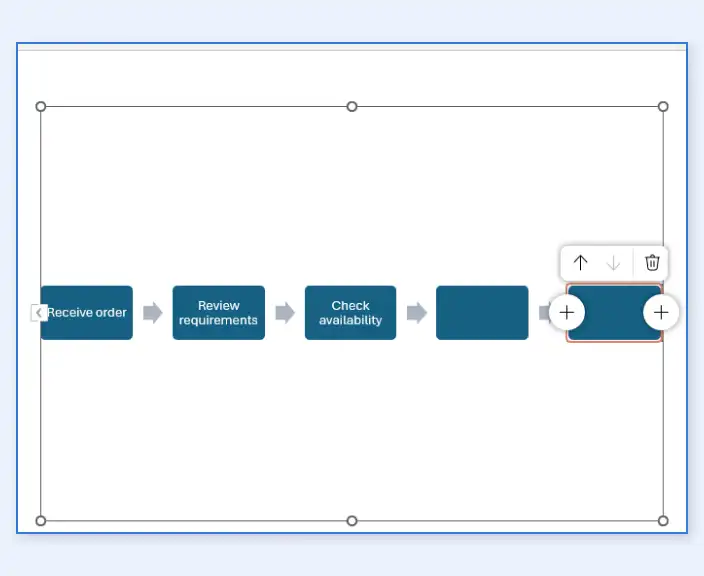
Step 3: Add or remove steps
Use the SmartArt controls to add or delete steps as needed. This is convenient early on, but reordering steps or inserting new ones in the middle of an existing flow can feel restrictive once the process starts to grow.
Step 4: Format for clarity
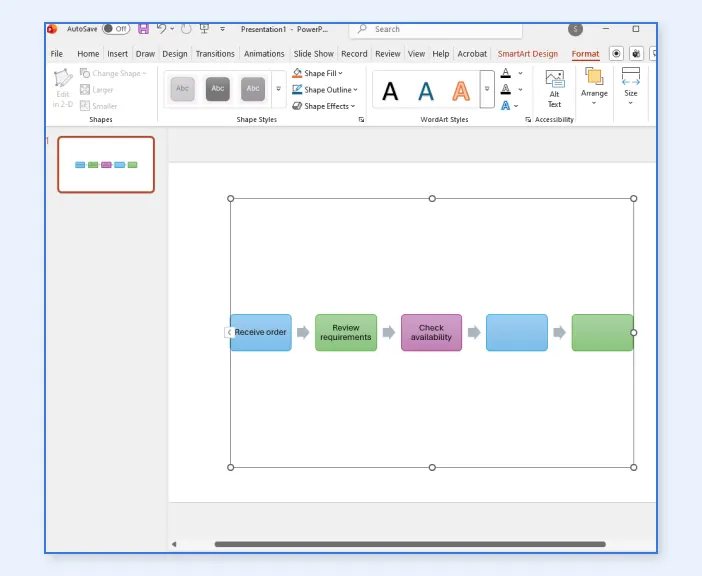
Apply colors, fonts, or styles to make the process easier to scan. While SmartArt handles basic styling well, more detailed customization like mixing shape types or emphasizing decision points is limited.
Step 5: Review and share the process map
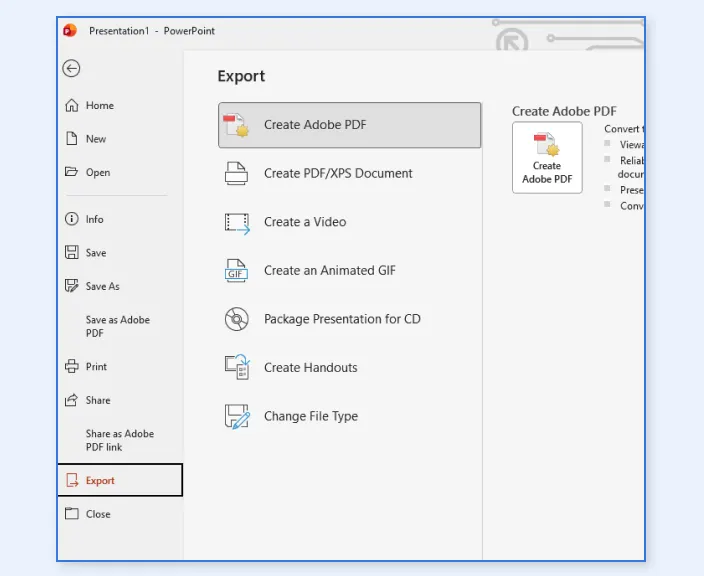
Walk through the process with the people who perform or depend on it. Confirm the sequence, decisions, owners, and handoffs, then collect feedback with comments before sharing or exporting the presentation. A file stored in OneDrive or SharePoint can be coauthored and reviewed with version history. For more control over a complex layout, PowerPoint also allows you to convert SmartArt into individual shapes, although the conversion cannot be reversed.
Limitations of Making a Process Map in PowerPoint
PowerPoint is familiar and effective for presenting a small process, but it was not designed to maintain detailed operational workflows. The following limitations become more noticeable as a Microsoft PowerPoint process map grows.
Manual layout for detailed maps: SmartArt automatically arranges simple sequences. Branching paths, exceptions, decision points, and custom connectors usually require Shapes and more manual alignment.
Slide boundaries: A large cross-functional process can become crowded on a single slide. Splitting it across slides improves readability but makes the complete flow harder to review in one view.
Limited process notation: PowerPoint provides SmartArt layouts and common flowchart shapes, but it does not offer dedicated BPMN 2.0 modeling or structured process properties.
Process context is document-based: Hyperlinks, notes, and comments can add supporting information, but ownership, systems, duration, status, and other process details are not structured around steps by default.
Maintenance requires manual care: PowerPoint can convert SmartArt into editable shapes, but it cannot convert those shapes back to SmartArt. Layout and connector changes must then be maintained manually.
Collaboration is slide-centered: PowerPoint supports real-time coauthoring, comments, and version history for presentations stored in supported OneDrive or SharePoint locations. However, the feedback remains attached to the presentation rather than a connected process model.
PowerPoint is a practical choice for a concise process visual used in a presentation. For cross-functional workflows and living process documentation, Creately’s process mapping software provides process-specific notation, connected context, and a flexible collaborative canvas.
Why Creately is Better for Making Process Maps
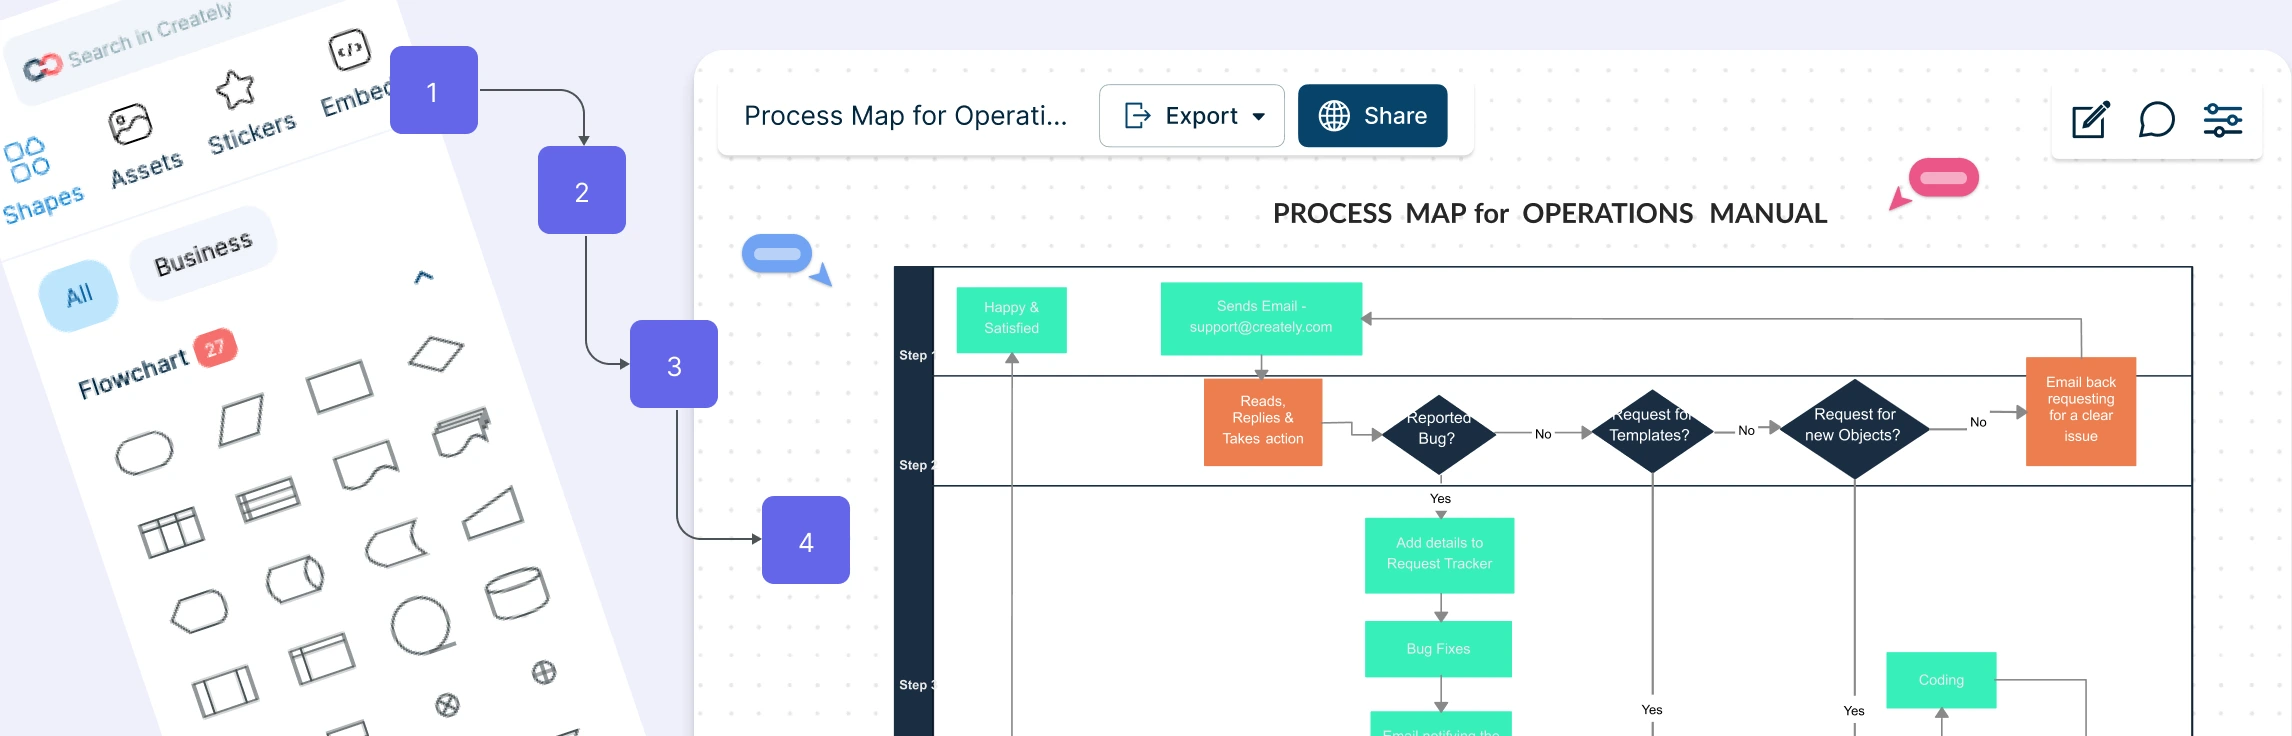
When a workflow needs to remain useful after a presentation ends, Creately’s process mapping software helps teams create, review, and maintain the process as connected operational documentation.
Designed for Process Mapping
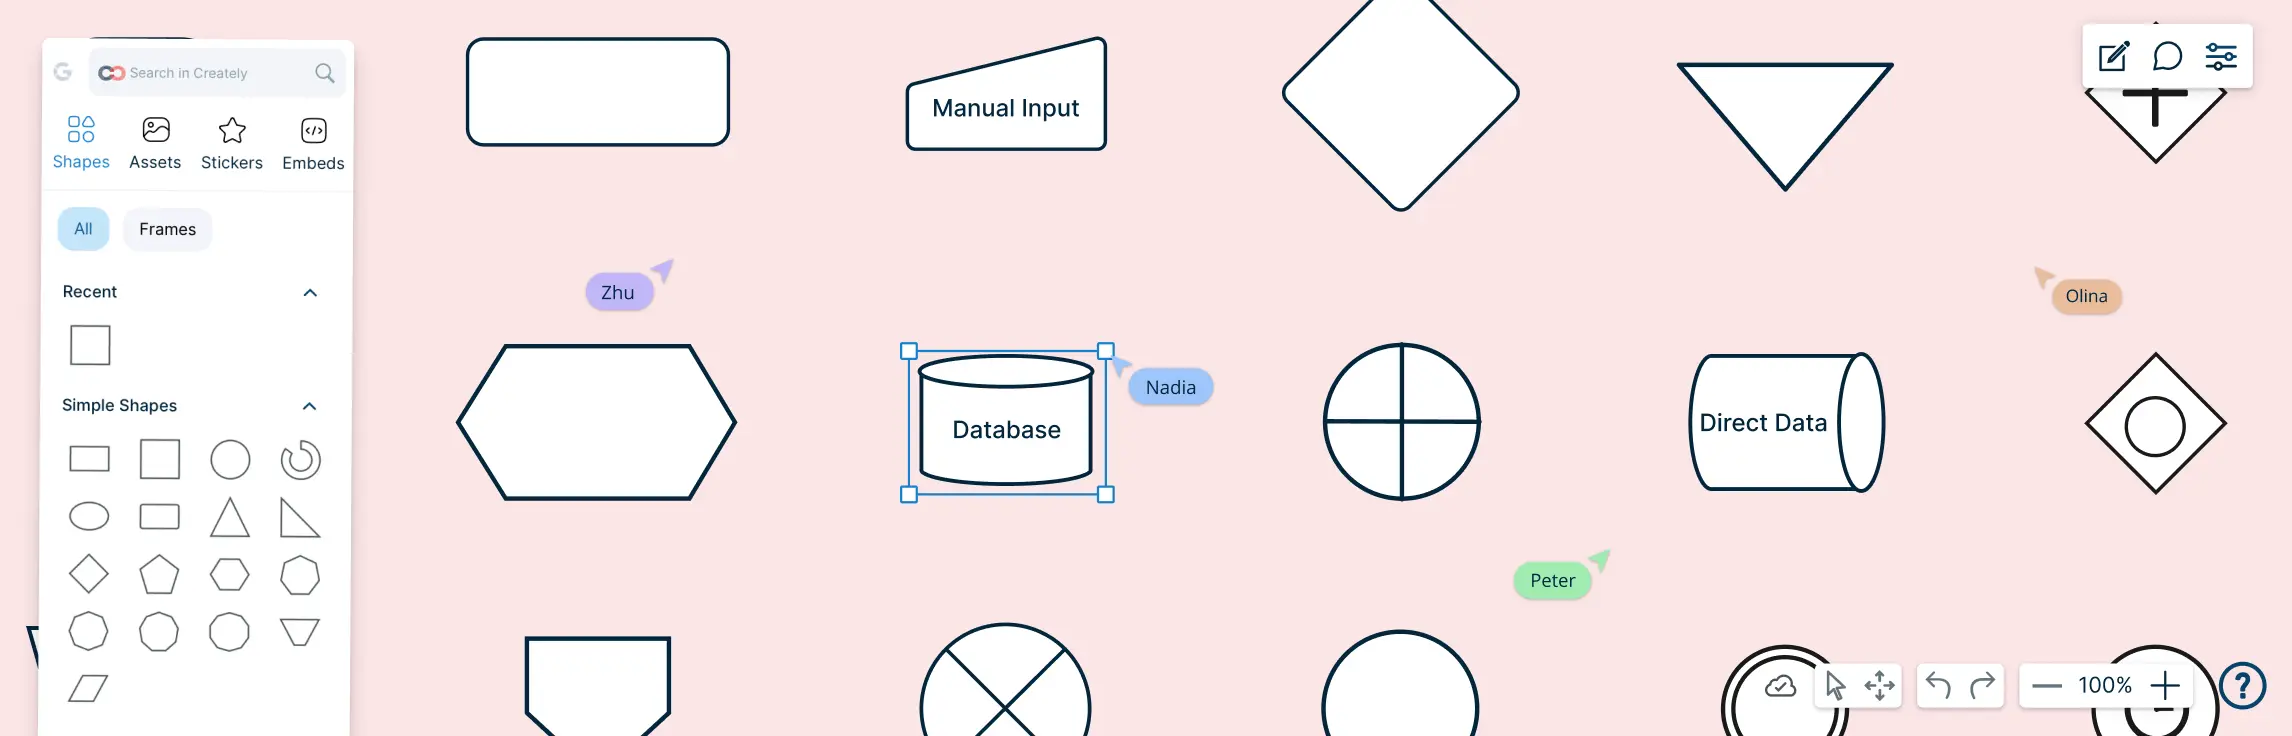
Use flowchart and BPMN 2.0 shape libraries to model sequences, decisions, exceptions, and cross-functional handoffs.
Work on a flexible visual canvas where connectors remain attached and layout tools help reorganize the flow as steps change.
Get Started Quickly with Free Templates
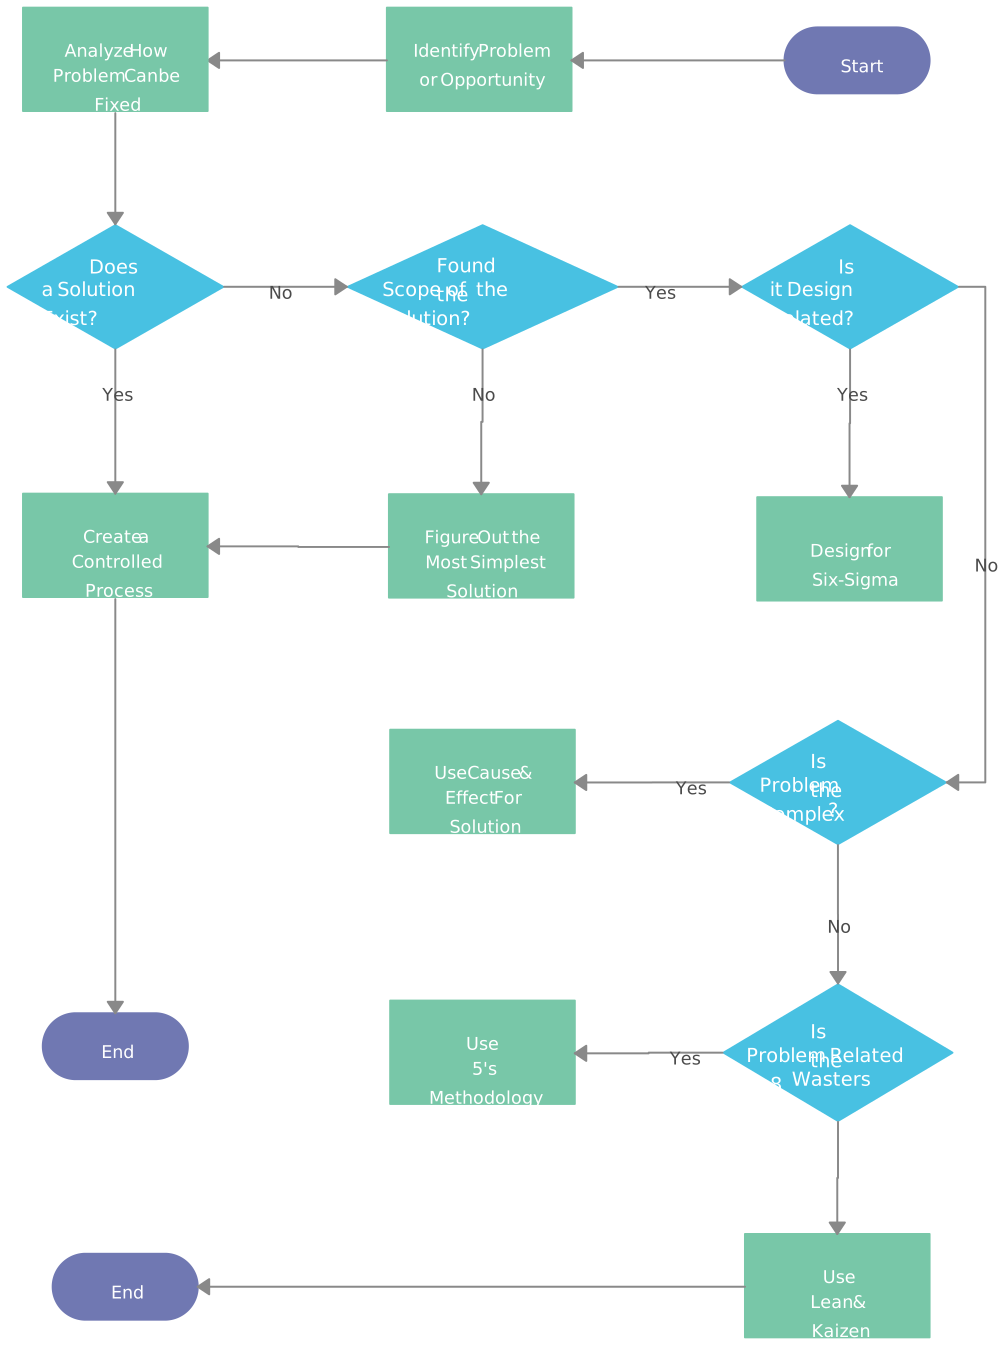
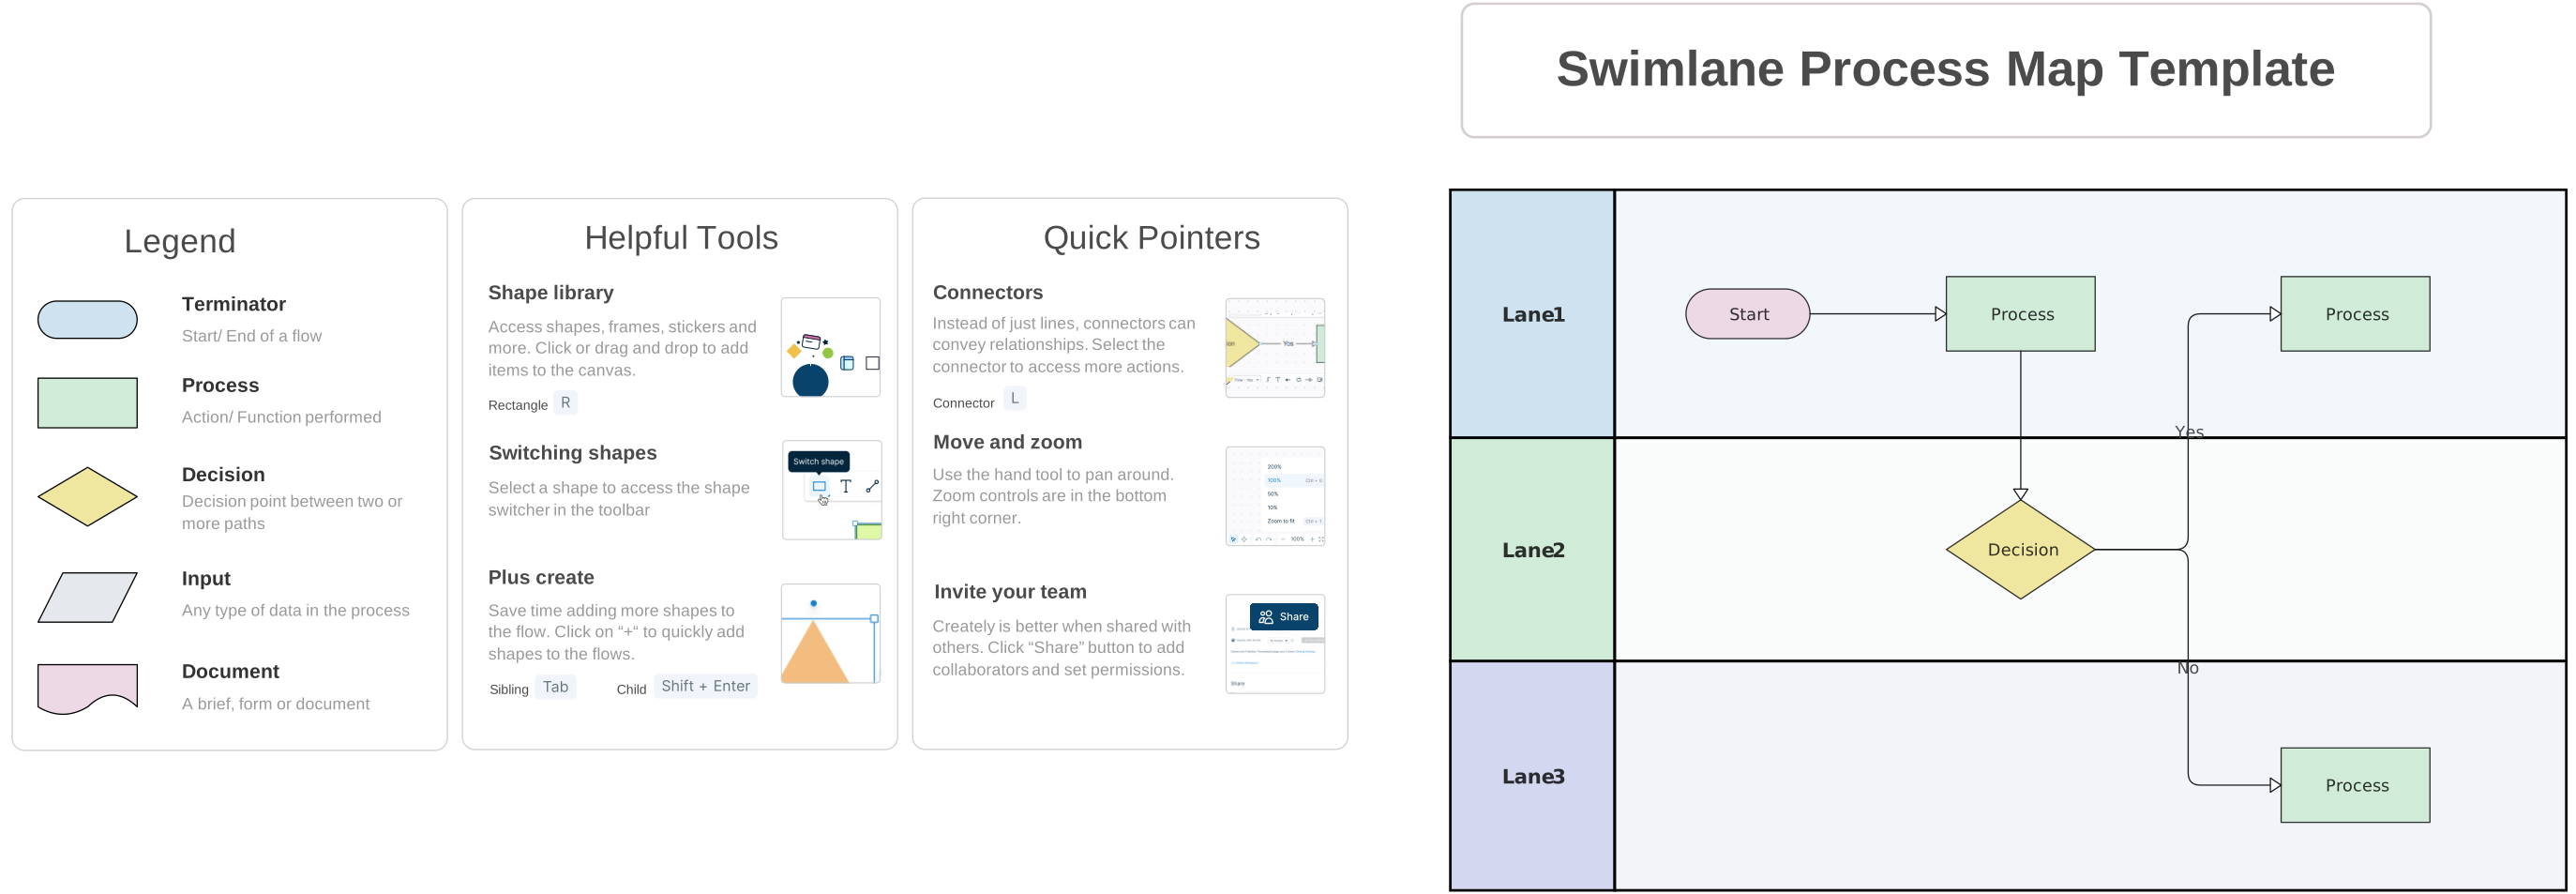
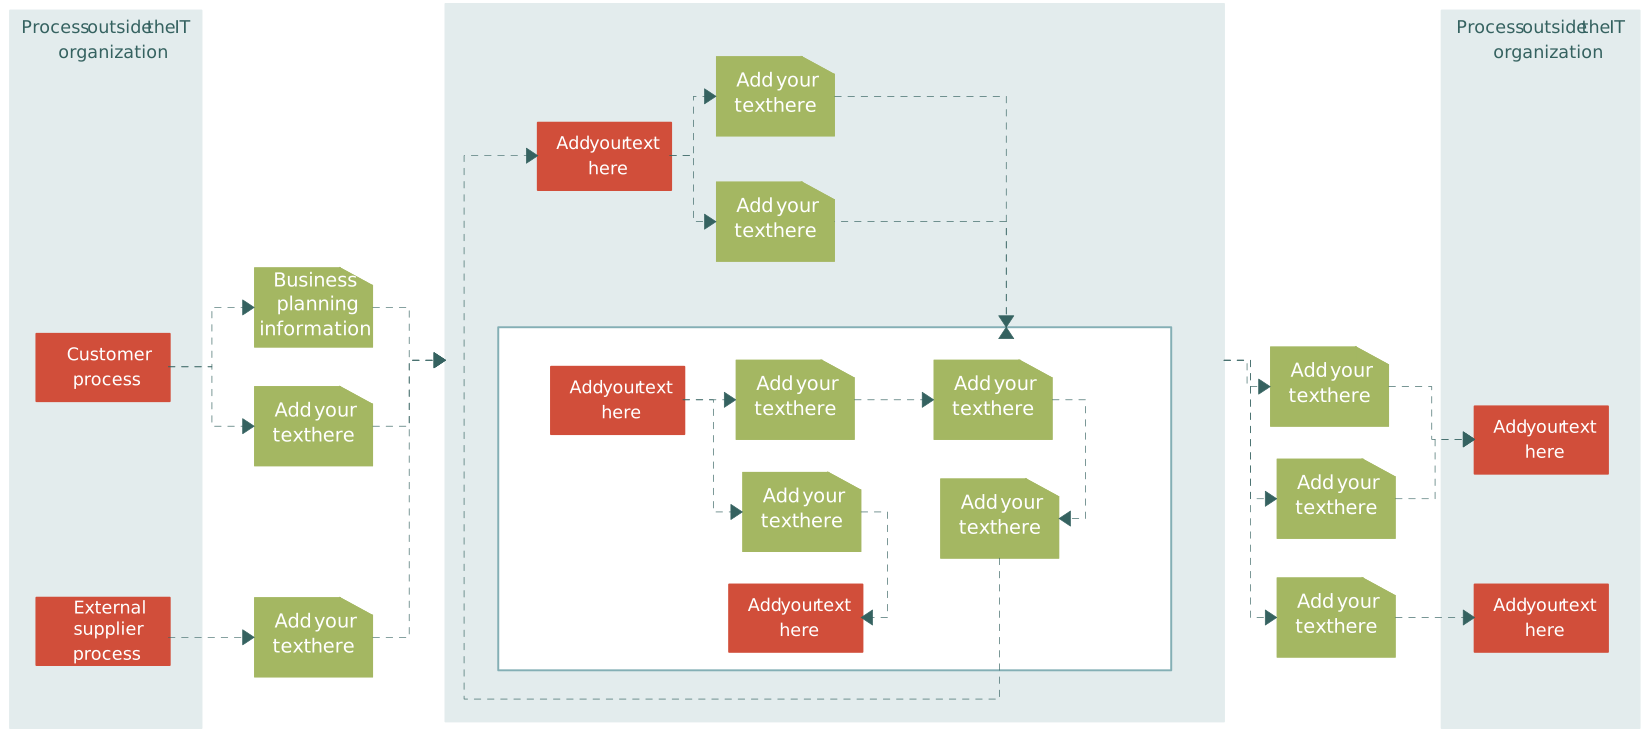
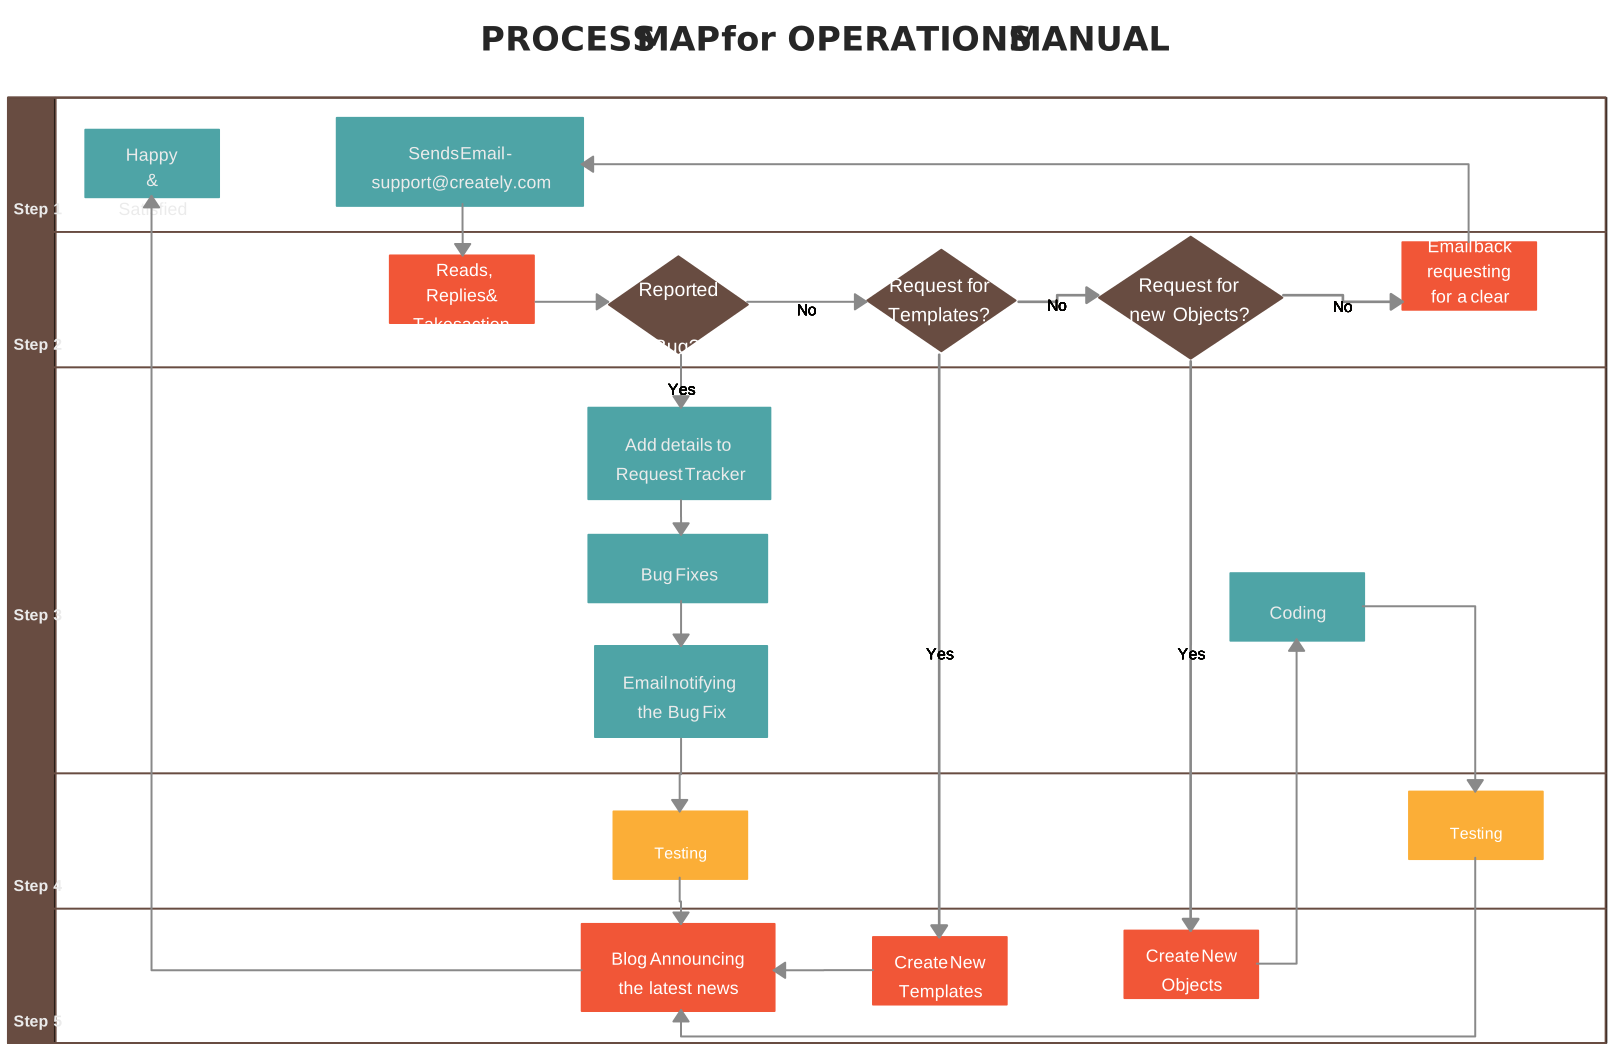
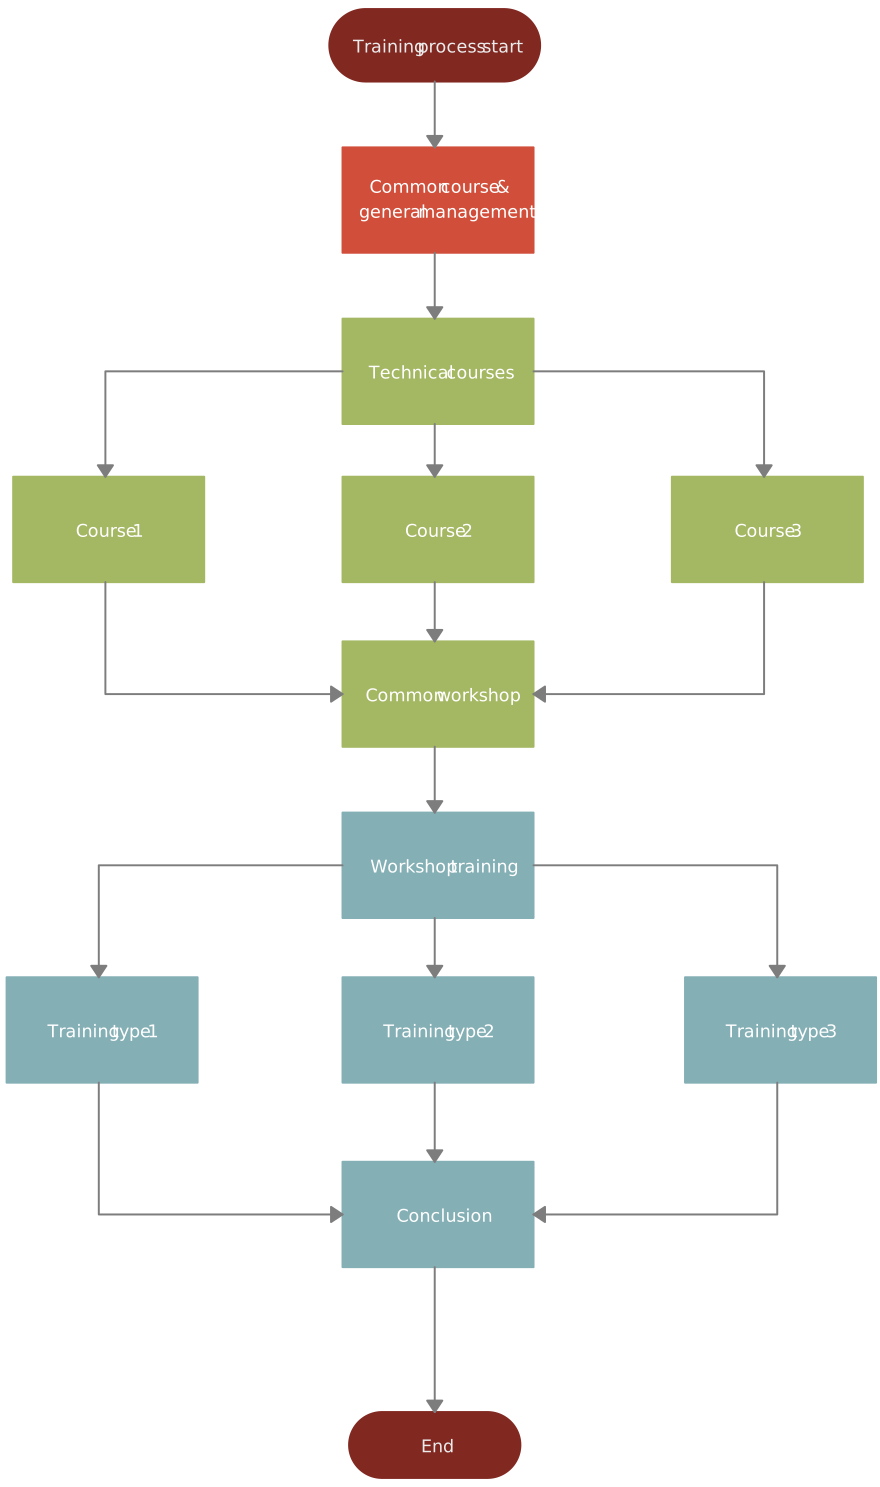
Start with editable templates for flowcharts, SIPOC diagrams, value stream maps, and swimlane process maps.
Adapt the structure, notation, roles, and styling to the process instead of rebuilding the diagram for every review.
Create Faster with AI and Automation
Describe a workflow in natural language to generate an editable first-draft flowchart containing steps, decisions, and connections.
Review the draft with process participants, correct the sequence, add missing handoffs, and apply the notation required for the final map.
Built for Real-World, Complex Workflows
Model decisions, parallel paths, exceptions, roles, and systems without forcing the complete process onto a single slide.
Connect overview maps to detailed subprocess diagrams so readers can move between different levels of process detail.
Real-Time Collaboration and Clarity
Edit together in real time, see collaborators on the canvas, and use contextual comments to discuss specific steps or handoffs.
Collect stakeholder feedback in context while accountable owners incorporate agreed updates and keep the workflow current.
Use presentation mode to walk stakeholders through the process without duplicating the diagram in presentation software.
Easy to Update and Maintain
Keep notes, links, and file attachments connected to relevant shapes, and use supported structured properties such as owner, status, duration, systems, tags, triggers, and SLAs where applicable.
Maintain the map as living process documentation so operational guidance and review context remain connected as the workflow changes.
Creately Vs PowerPoint Process Map Features Comparison
If you’re deciding between sticking with slides or switching to a purpose-built tool, comparing Creately vs PowerPoint side by side makes it easier to see which one truly supports process mapping at scale.
| Feature | PowerPoint | Creately |
| Process-mapping focus | General presentation tool with SmartArt Process layouts and flowchart shapes | Visual workspace with flowchart and BPMN 2.0 libraries |
| Speed of creation | SmartArt quickly arranges simple sequences; custom flows require manual work | Templates, attached connectors, layout tools, and editable AI-generated first drafts |
| AI-assisted diagram creation | No dedicated prompt-to-process-map feature | Generates an editable flowchart first draft from a natural-language description |
| Handling complex workflows | Shapes can model branches and exceptions, but slide space and manual layout become limiting | Supports decisions, parallel paths, cross-functional flows, and linked subprocess diagrams |
| Editing and updates | SmartArt rearranges simple layouts; converted shapes require manual maintenance | Attached connectors and layout tools help reorganize the process as it changes |
| Collaboration | Real-time coauthoring, comments, and version history in supported cloud setups | Real-time canvas editing, collaborator visibility, and contextual comments |
| Workspace and scalability | Slide-based layout; large processes may need to be divided across slides | Flexible canvas for end-to-end processes and connected levels of detail |
| Templates | SmartArt Process layouts and presentation templates | Editable process map, swimlane, SIPOC, BPMN, and value-stream templates |
| Connected documentation | Hyperlinks, notes, and comments are available but process properties are not structured by step | Notes, links, files, structured properties, and linked diagrams can remain connected to relevant shapes |
| Best use case | Concise process visuals designed for presentations | Collaborative process mapping and living process documentation |
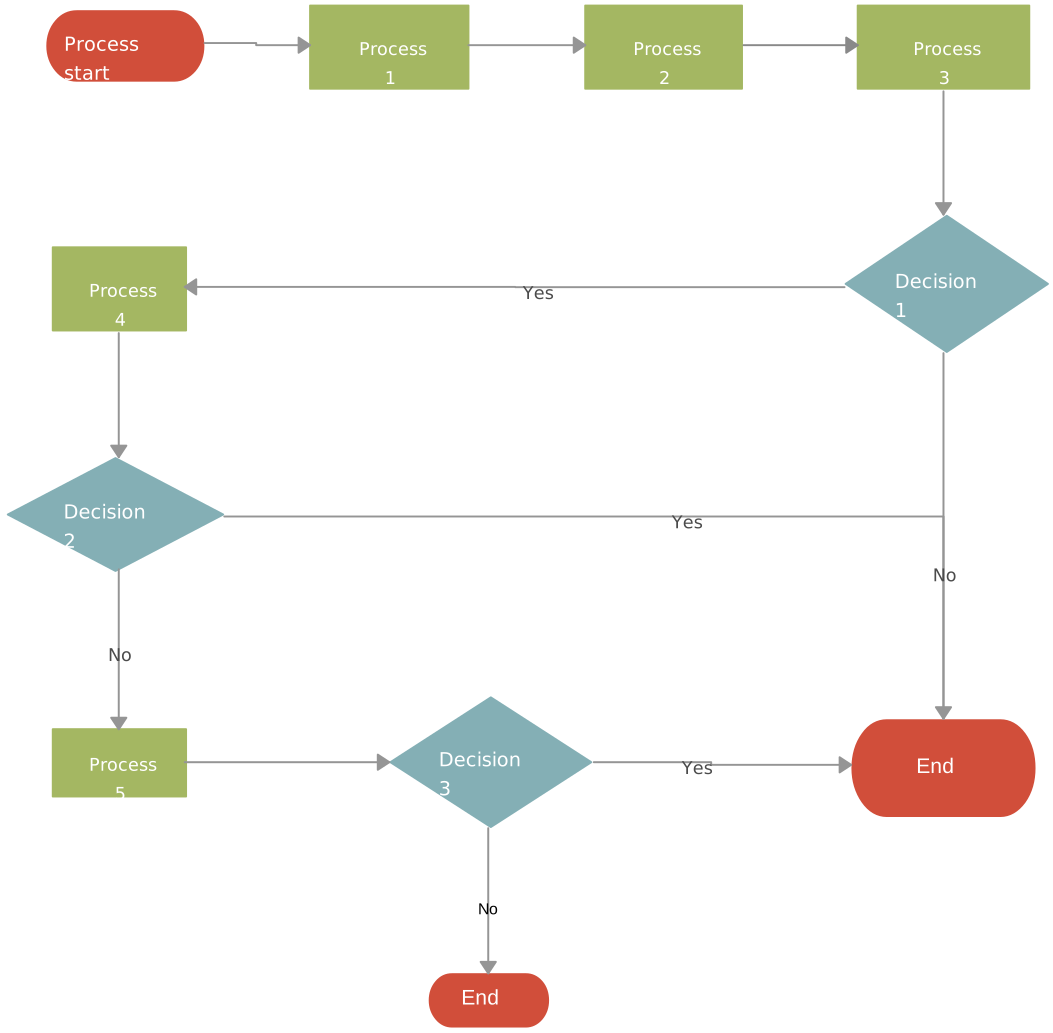
Free Process Map Templates to Get Started


Helpful Resources for Making Process Maps
Discover different types of Process Maps and how they can be used.
Learn about the symbols used and how they visualize the process flow.
Learn how process maps are used in business processes.