Logistics process mapping visually documents how goods, information, decisions, and responsibilities move through activities such as procurement, receiving, warehousing, fulfillment, transportation, delivery, and returns. It gives logistics teams a shared view for validating the current process, identifying weak handoffs and delays, and designing a measurable future state.
A map is a decision-support and documentation tool, not a live tracking or route-optimization system by itself. Reliable analysis still requires operational data from warehouse, transport, order, inventory, or traceability systems. This guide explains what to map, which diagram type to use, how to create current- and future-state views, and how to maintain the result as living process documentation.
What Is Logistics Process Mapping?
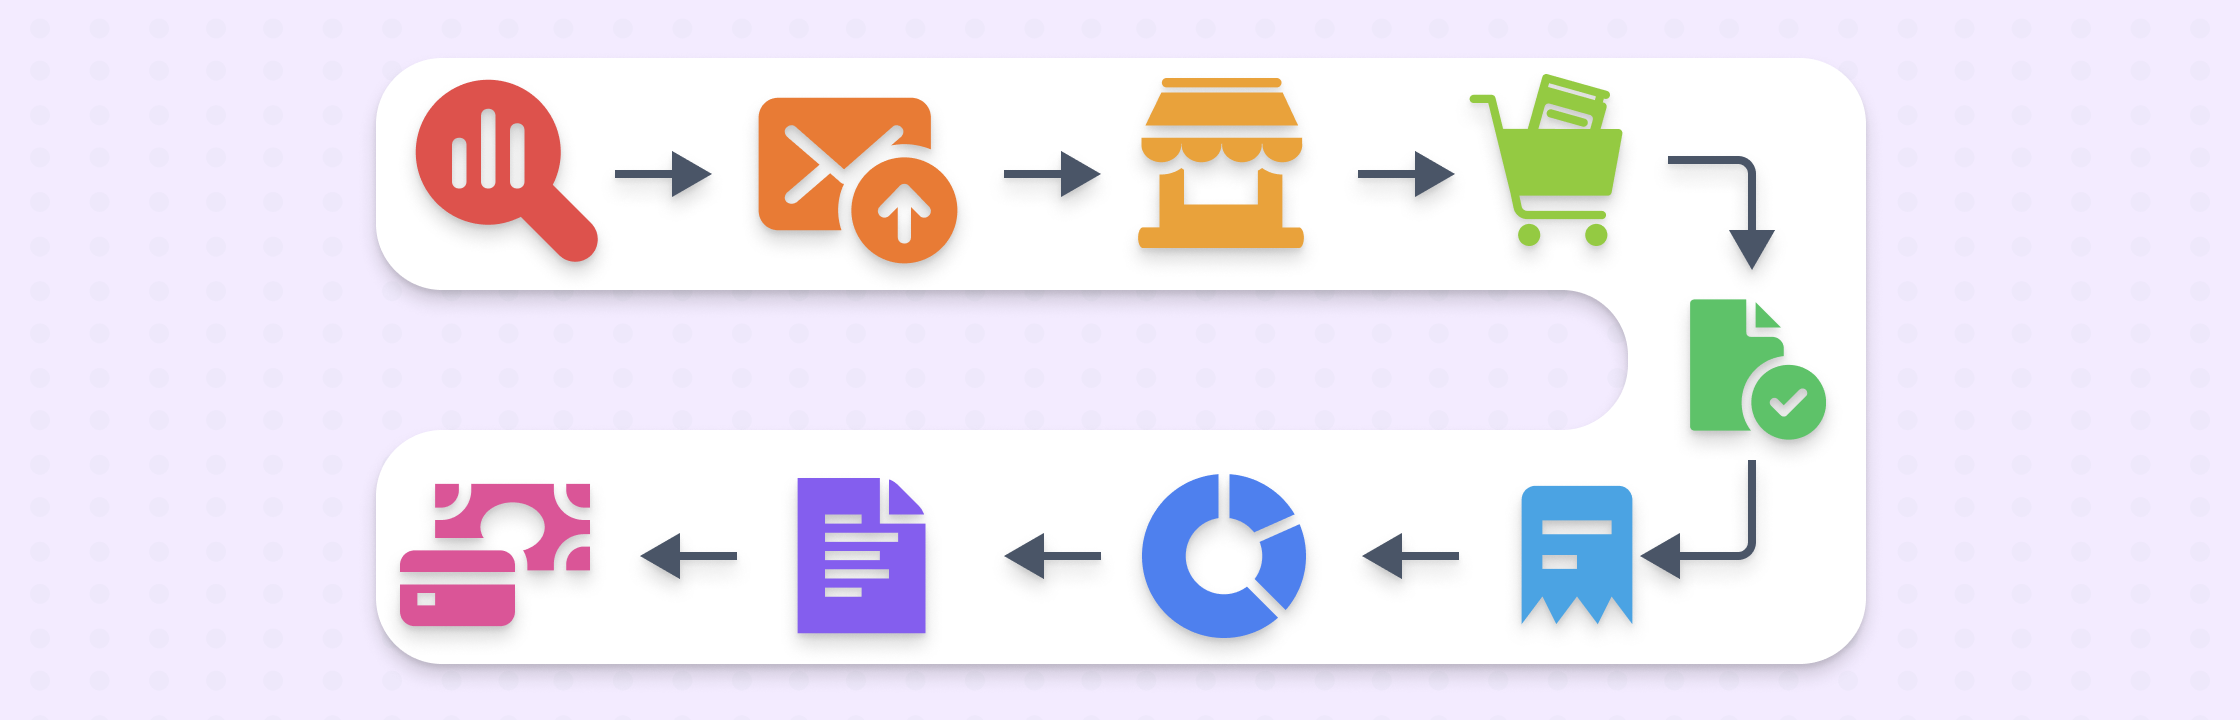
Logistics process mapping is the visual representation of a defined logistics workflow and its supporting information flow. Depending on scope, a map may cover one warehouse activity, an order-fulfillment process, a transportation handoff, or an end-to-end flow across several organizations.
An effective map defines the trigger and outcome, activities, decision points, accountable owner, participating roles, handoffs, exceptions, systems, documents, data, controls, and relevant measures. It should distinguish the documented process from actual event data: standards-based traceability, for example, depends on identifying traceable objects and recording events such as receiving, packing, shipping, and transporting in appropriate systems.

Logistics in the Modern Era
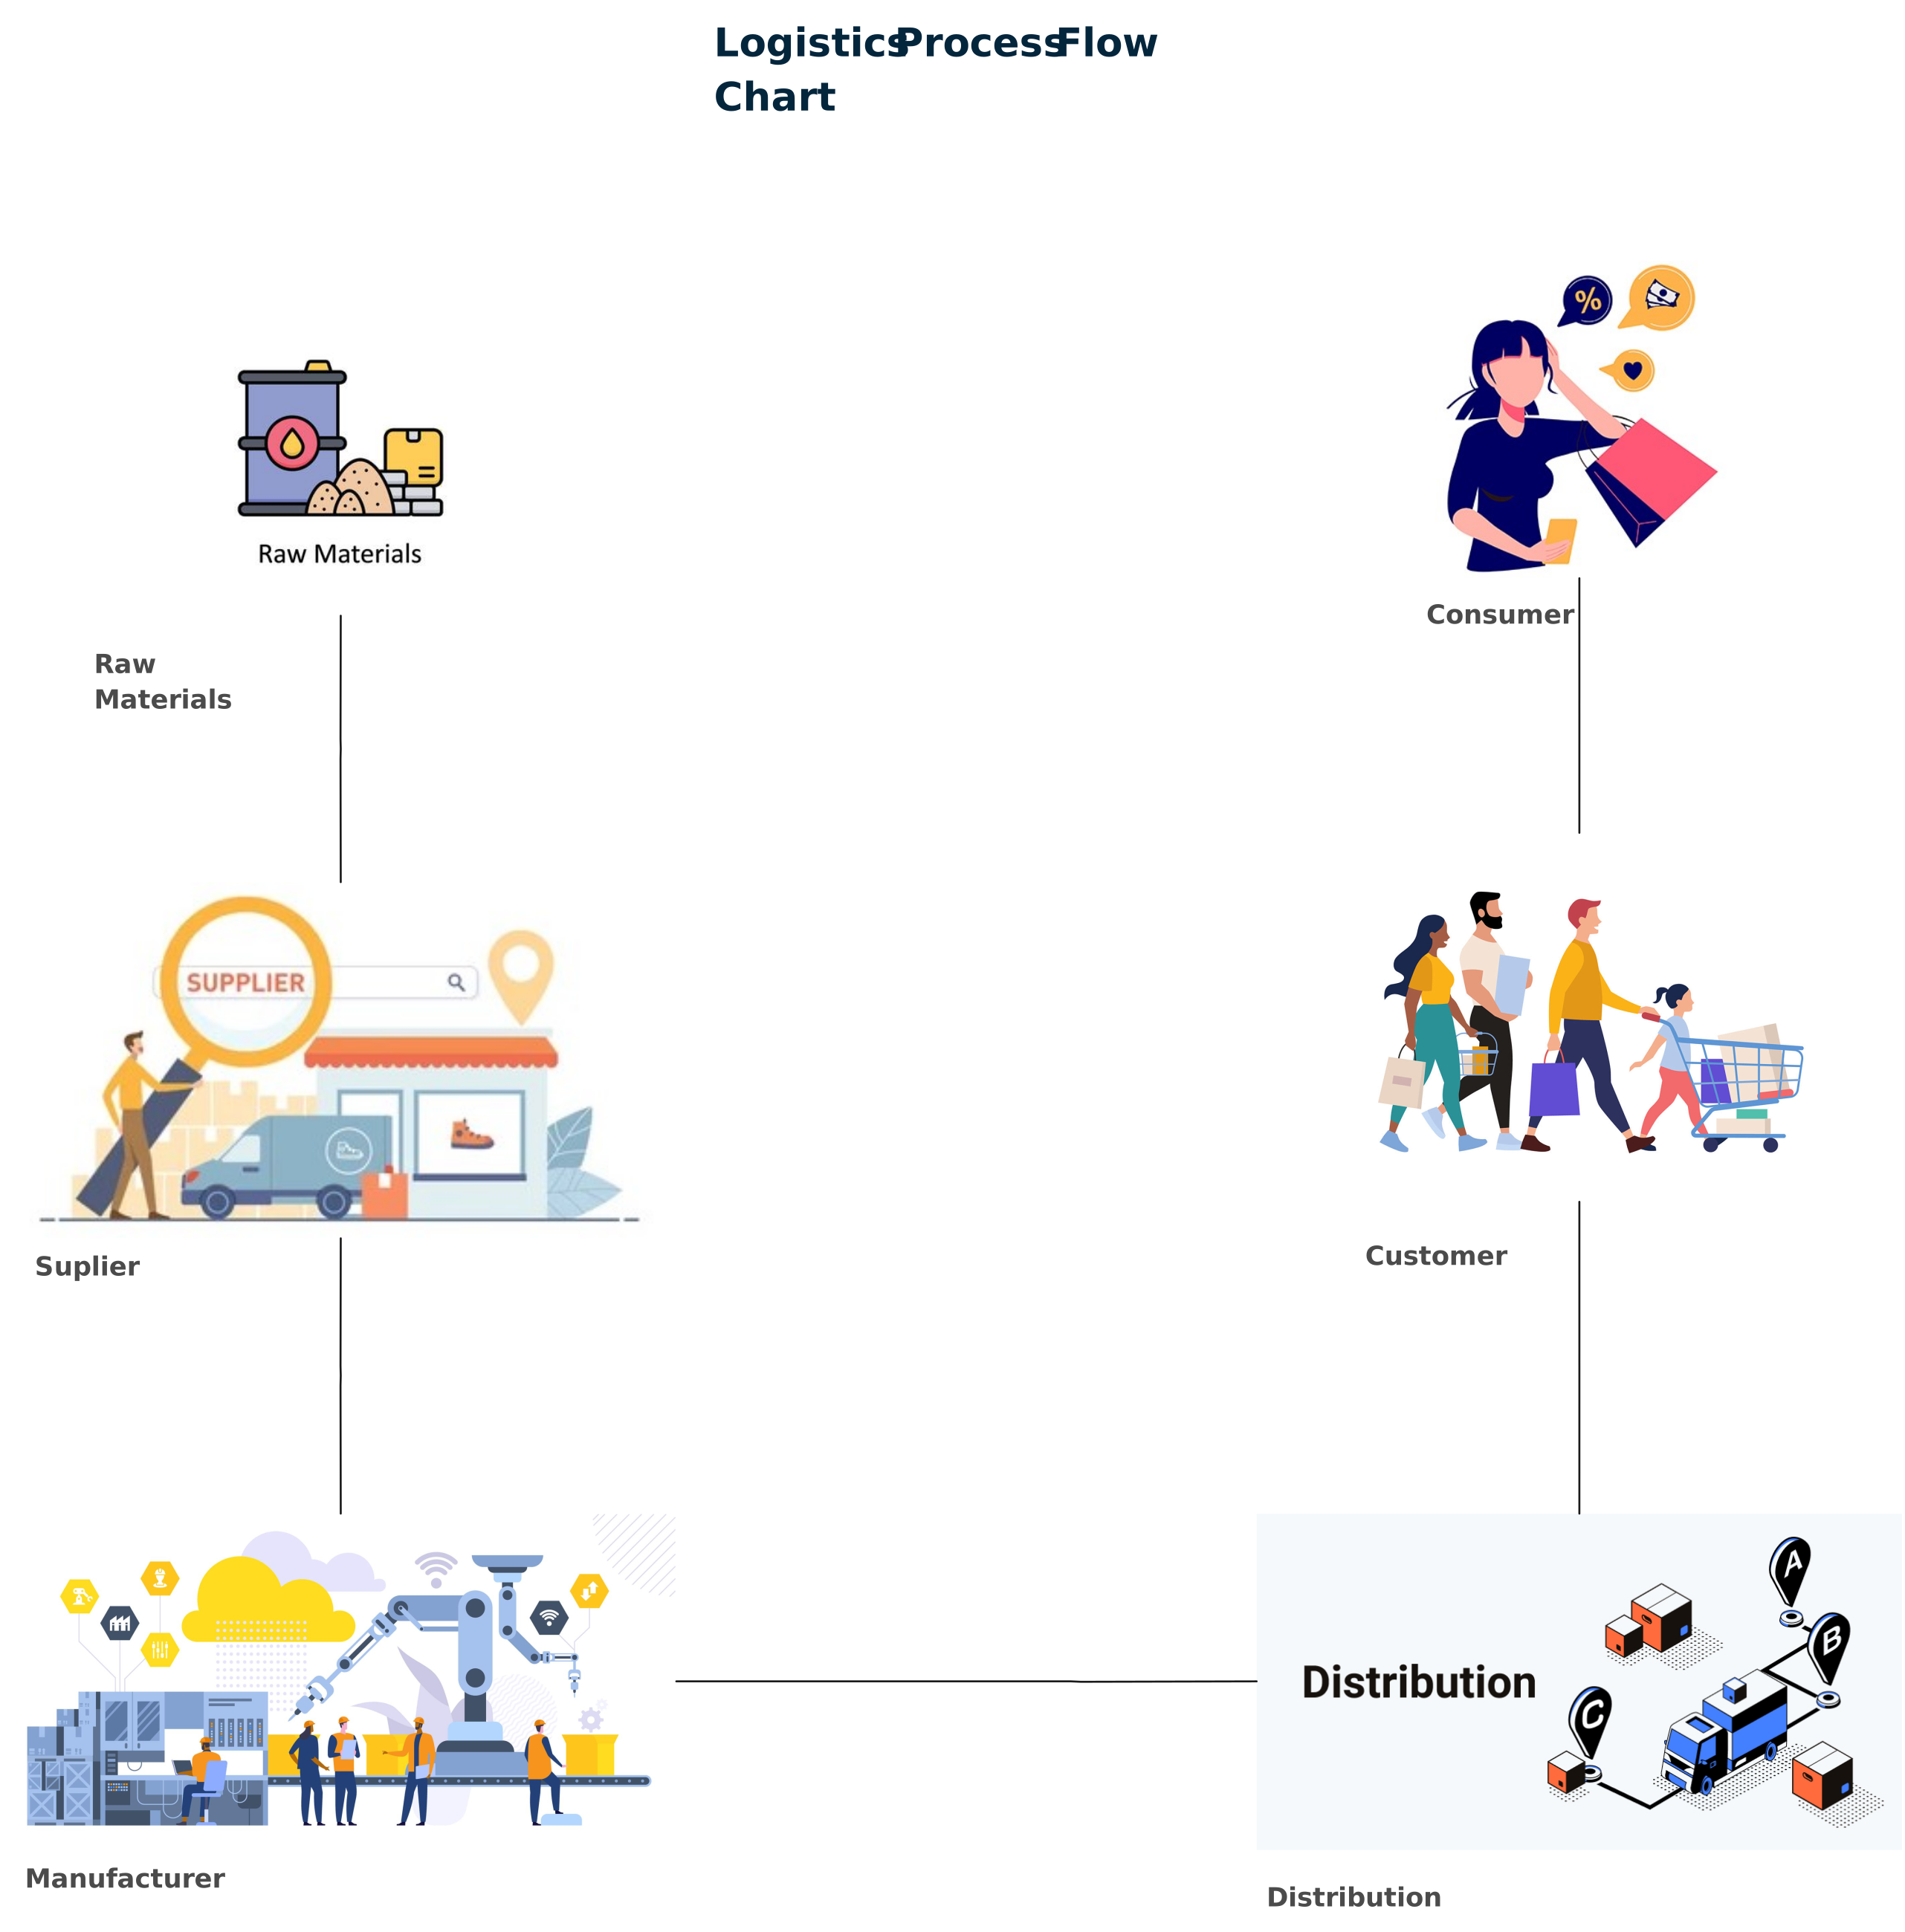
E-commerce expectations, global networks, regulation, labor constraints, and new technology can all change logistics operations. Process maps help teams evaluate those changes by showing where physical and information flows meet, which systems provide data, who owns each step, and what passes between suppliers, warehouses, carriers, and customers.
Mapping can expose candidate bottlenecks, duplicate checks, unclear responsibilities, and missing controls. Whether a proposed change reduces cost or improves service must be validated with baseline and post-change measures such as dwell time, pick-to-ship time, order accuracy, lead time, damage rate, or on-time delivery.
A shared visual reference also makes cross-functional reviews more concrete. Stakeholders can discuss a specific step or handoff, process owners can incorporate agreed changes, and training materials can reflect the implemented process. The map supports coordination; it does not guarantee accurate or timely delivery on its own.
The Logistics Mapping Spectrum
Choosing the right map depends on whether you are looking at a single warehouse “micro” view, a global “macro” network, or the specific “last-mile” physical path.
| Feature | Logistics Process Mapping | Supply Chain Mapping | Route Mapping |
|---|---|---|---|
| Scope | Internal/Micro: Focuses on specific operations within a facility or department. | Global/Macro: Focuses on the end-to-end network of entities and locations. | Physical/Tactical: Focuses on the specific path a vehicle takes between points. |
| Primary Goal | Efficiency & Bottleneck Identification. | Risk Management & Resilience. | Cost Reduction & Time Optimization. |
| Example Workflow | Receiving $\rightarrow$ Inspection $\rightarrow$ Put-away $\rightarrow$ Storage. | Raw Material Supplier $\rightarrow$ Manufacturer $\rightarrow$ Distributor $\rightarrow$ Retailer. | Depot A $\rightarrow$ Stop 1 $\rightarrow$ Stop 2 $\rightarrow$ Traffic Re-route $\rightarrow$ Final Delivery. |
| Key Stakeholders | Warehouse Managers, Floor Supervisors. | COOs, Procurement Officers, Global Partners. | Fleet Managers, Dispatchers, Drivers. |
5 Core Logistics Processes That Drive Supply Chain Efficiency
Logistics operations involve several interconnected processes that ensure goods and services flow smoothly from suppliers to customers. Understanding these key logistics processes is essential for businesses aiming to optimize their supply chain efficiency.
Here’s a quick look at the types of logistics maps:
| Process Type | Real-World Trigger (The “When”) | Mapping Objective | Core Components |
|---|---|---|---|
| Inbound (Procurement) | Onboarding new suppliers or managing raw material delays. | Visibility: Track goods from source to dock. | Supplier ID, PO creation, lead-time tracking. |
| Warehousing | Inventory inaccuracies or slow “put-away” times. | Efficiency: Optimize space and labor. | Inspection, racking, cycle counting, storage. |
| Fulfillment | Increasing order volume or high error rates. | Accuracy: Zero-defect order processing. | Order entry, picking, packing, validation. |
| Outbound (Transportation) | Rising fuel costs or carrier reliability issues. | Cost Control: Optimize freight and routes. | Carrier selection, freight audit, route planning. |
| Last-Mile (Delivery) | Poor customer feedback on delivery times. | Satisfaction: Ensure timely, transparent arrival. | GPS tracking, PoD (Proof of Delivery), reverse logistics. |
Now, let’s take a more detailed look at the five core logistics processes:
Stage 1. Inbound & Procurement (The Source)
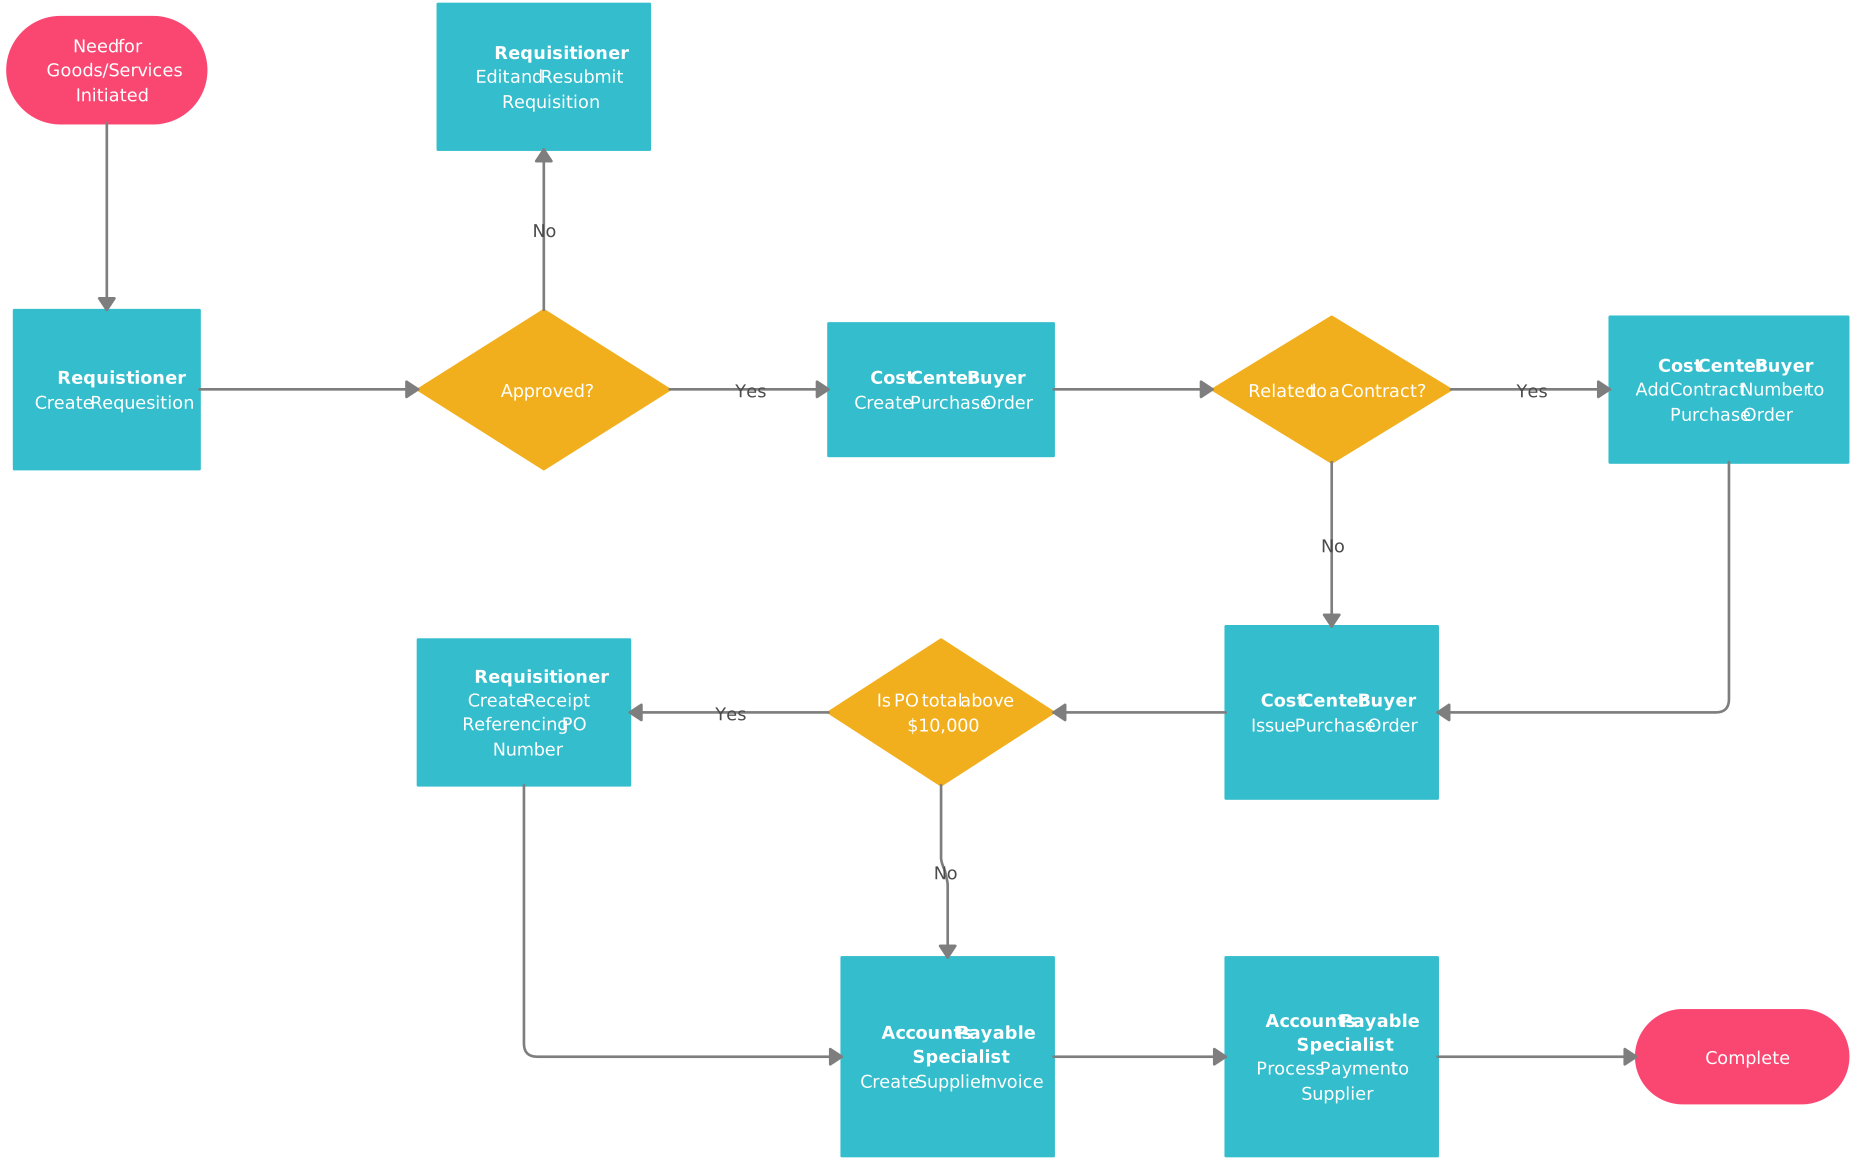
Procurement is the process of sourcing and acquiring goods and services from suppliers. This process lays the foundation for a smooth and cost-effective logistics operation. Every logistics process mapping effort should start with visualizing the procurement process.
- Supplier Identification and Evaluation: Finding the right suppliers is crucial for ensuring quality and timely delivery. It involves researching potential vendors, evaluating their reliability, and selecting those that align with the company’s goals.
- Negotiation and Contract Management: Once suppliers are selected, negotiating terms, prices, and delivery schedules is necessary to establish contracts that benefit both parties and reduce risk.
- Purchase Order Creation: Purchase orders are formal requests to suppliers for goods or services. This step ensures that the required items are ordered on time and that accurate documentation is in place.
- Supplier Relationship Management: Maintaining strong, long-term relationships with suppliers is essential for consistency in supply and addressing any issues that arise in the procurement process.
Stage 2: Warehousing & Inventory
Once goods hit the dock, the logistics map shifts from “macro” transport to “micro” facility movement. This stage is the heartbeat of your operation, where effective mapping ensures that space is utilized efficiently and inventory accuracy remains high. By visualizing the flow from receiving to dispatch, businesses can align stakeholders and eliminate the “spaghetti paths” that lead to wasted labor.
The Internal Movement & Storage Workflow
Effective warehousing process mapping is essential in logistics process mapping for logistics companies aiming to improve space utilization and enhance inventory accuracy. By clearly outlining each step in warehouse operations, from receiving goods to storage and eventual dispatch, businesses can identify inefficiencies and areas for improvement. This visual approach not only aids in defining organizational processes but also ensures that all stakeholders are aligned and aware of their responsibilities.
- Receiving and Inspection: When goods arrive at the warehouse, they must be inspected for quality and accuracy. This verification step ensures that the right products are received and that there are no discrepancies.
- Put-Away and Storage: After receiving, items are stored in designated locations within the warehouse. Effective storage management maximizes space and ensures easy access to goods when needed.
- Order Picking and Packing: This involves retrieving items from the shelves and preparing them for shipment. Efficient order picking and packing can reduce errors and speed up fulfillment times.
- Shipping and Order Fulfillment: Once orders are packed, they are shipped out to customers. Efficient shipping and fulfillment are crucial for meeting delivery deadlines and customer satisfaction.
Strategic Inventory Control
Effective inventory management ensures that businesses have the right amount of stock at the right time, minimizing both overstocking and stockouts. It is a crucial step in logistics process mapping and cannot be overlooked.
- Demand Forecasting: Predicting future demand helps businesses plan inventory levels more accurately, ensuring they can meet customer needs without holding excess stock.
- Order Planning and Replenishment: Using data from demand forecasts, businesses plan when to reorder items, ensuring stock levels are maintained without tying up unnecessary capital in inventory.
- Stock Tracking and Control: Inventory systems and appropriate identification or capture methods provide current stock data. The process map documents where records are created, checked, reconciled, and used for decisions.
- Inventory Optimization: Use demand, lead-time, service-level, and inventory data to evaluate stocking policies. The map helps show where those decisions occur and which roles and systems supply the inputs.


Stage 3: Fulfillment (The Internal Transition)
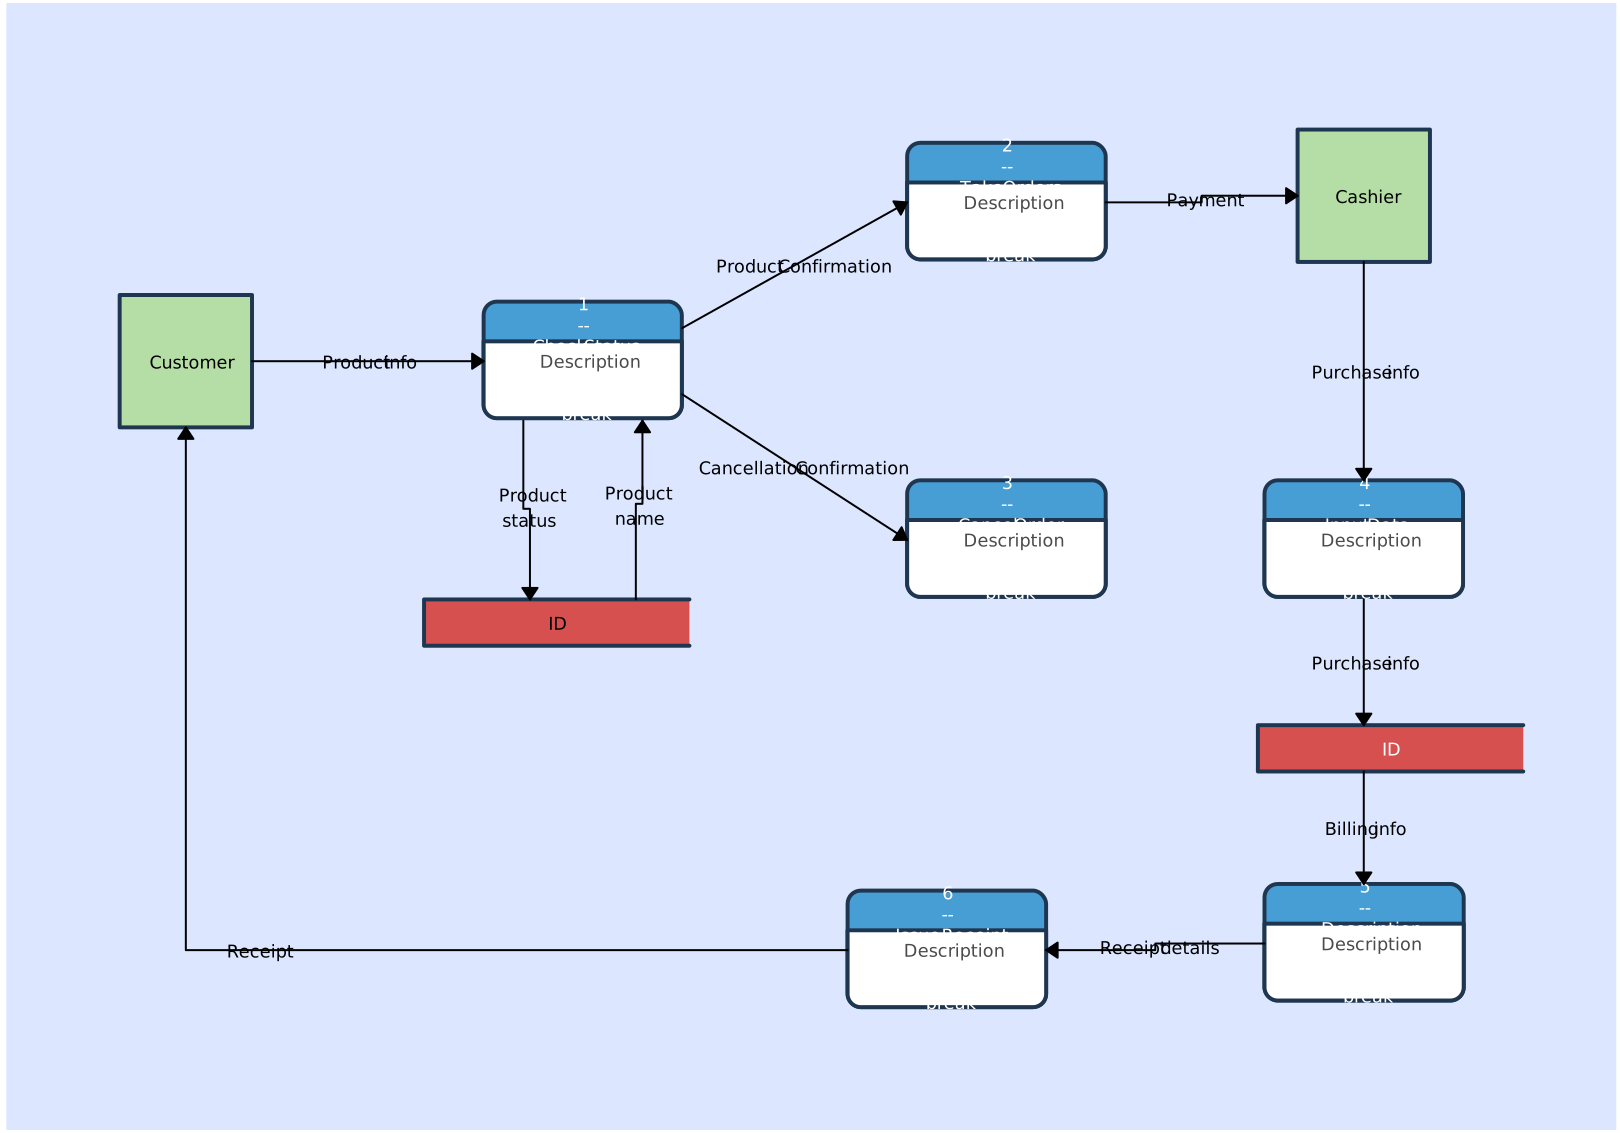
Order fulfillment is the process of delivering products to customers, from receiving the order to final delivery. It’s a critical part of the logistics chain that directly impacts customer satisfaction. Incorporating this in your logistics process mapping ensures that you address concerns related to the customers.
- Order Entry and Validation Orders are received and entered into the system. Validation checks ensure that the order details are correct before processing begins.
- Order Picking and Packing Once an order is validated, items are picked from the warehouse and packed for shipment. Proper packing ensures the products arrive in good condition and meet customer expectations.
- Shipping and Delivery Shipping involves selecting the best delivery method and ensuring timely arrival. Efficient delivery processes enhance customer satisfaction and minimize delays.
- Order Tracking and Customer Communication: Tracking systems can provide shipment status and event data. Map when updates are generated, which system is authoritative, and how exceptions are communicated to customers.
- Returns and Reverse Logistics Returns are an inevitable part of the order fulfillment process. Reverse logistics ensures the efficient handling of returns, restocking of goods, or processing refunds.
Stage 4: Outbound Transportation
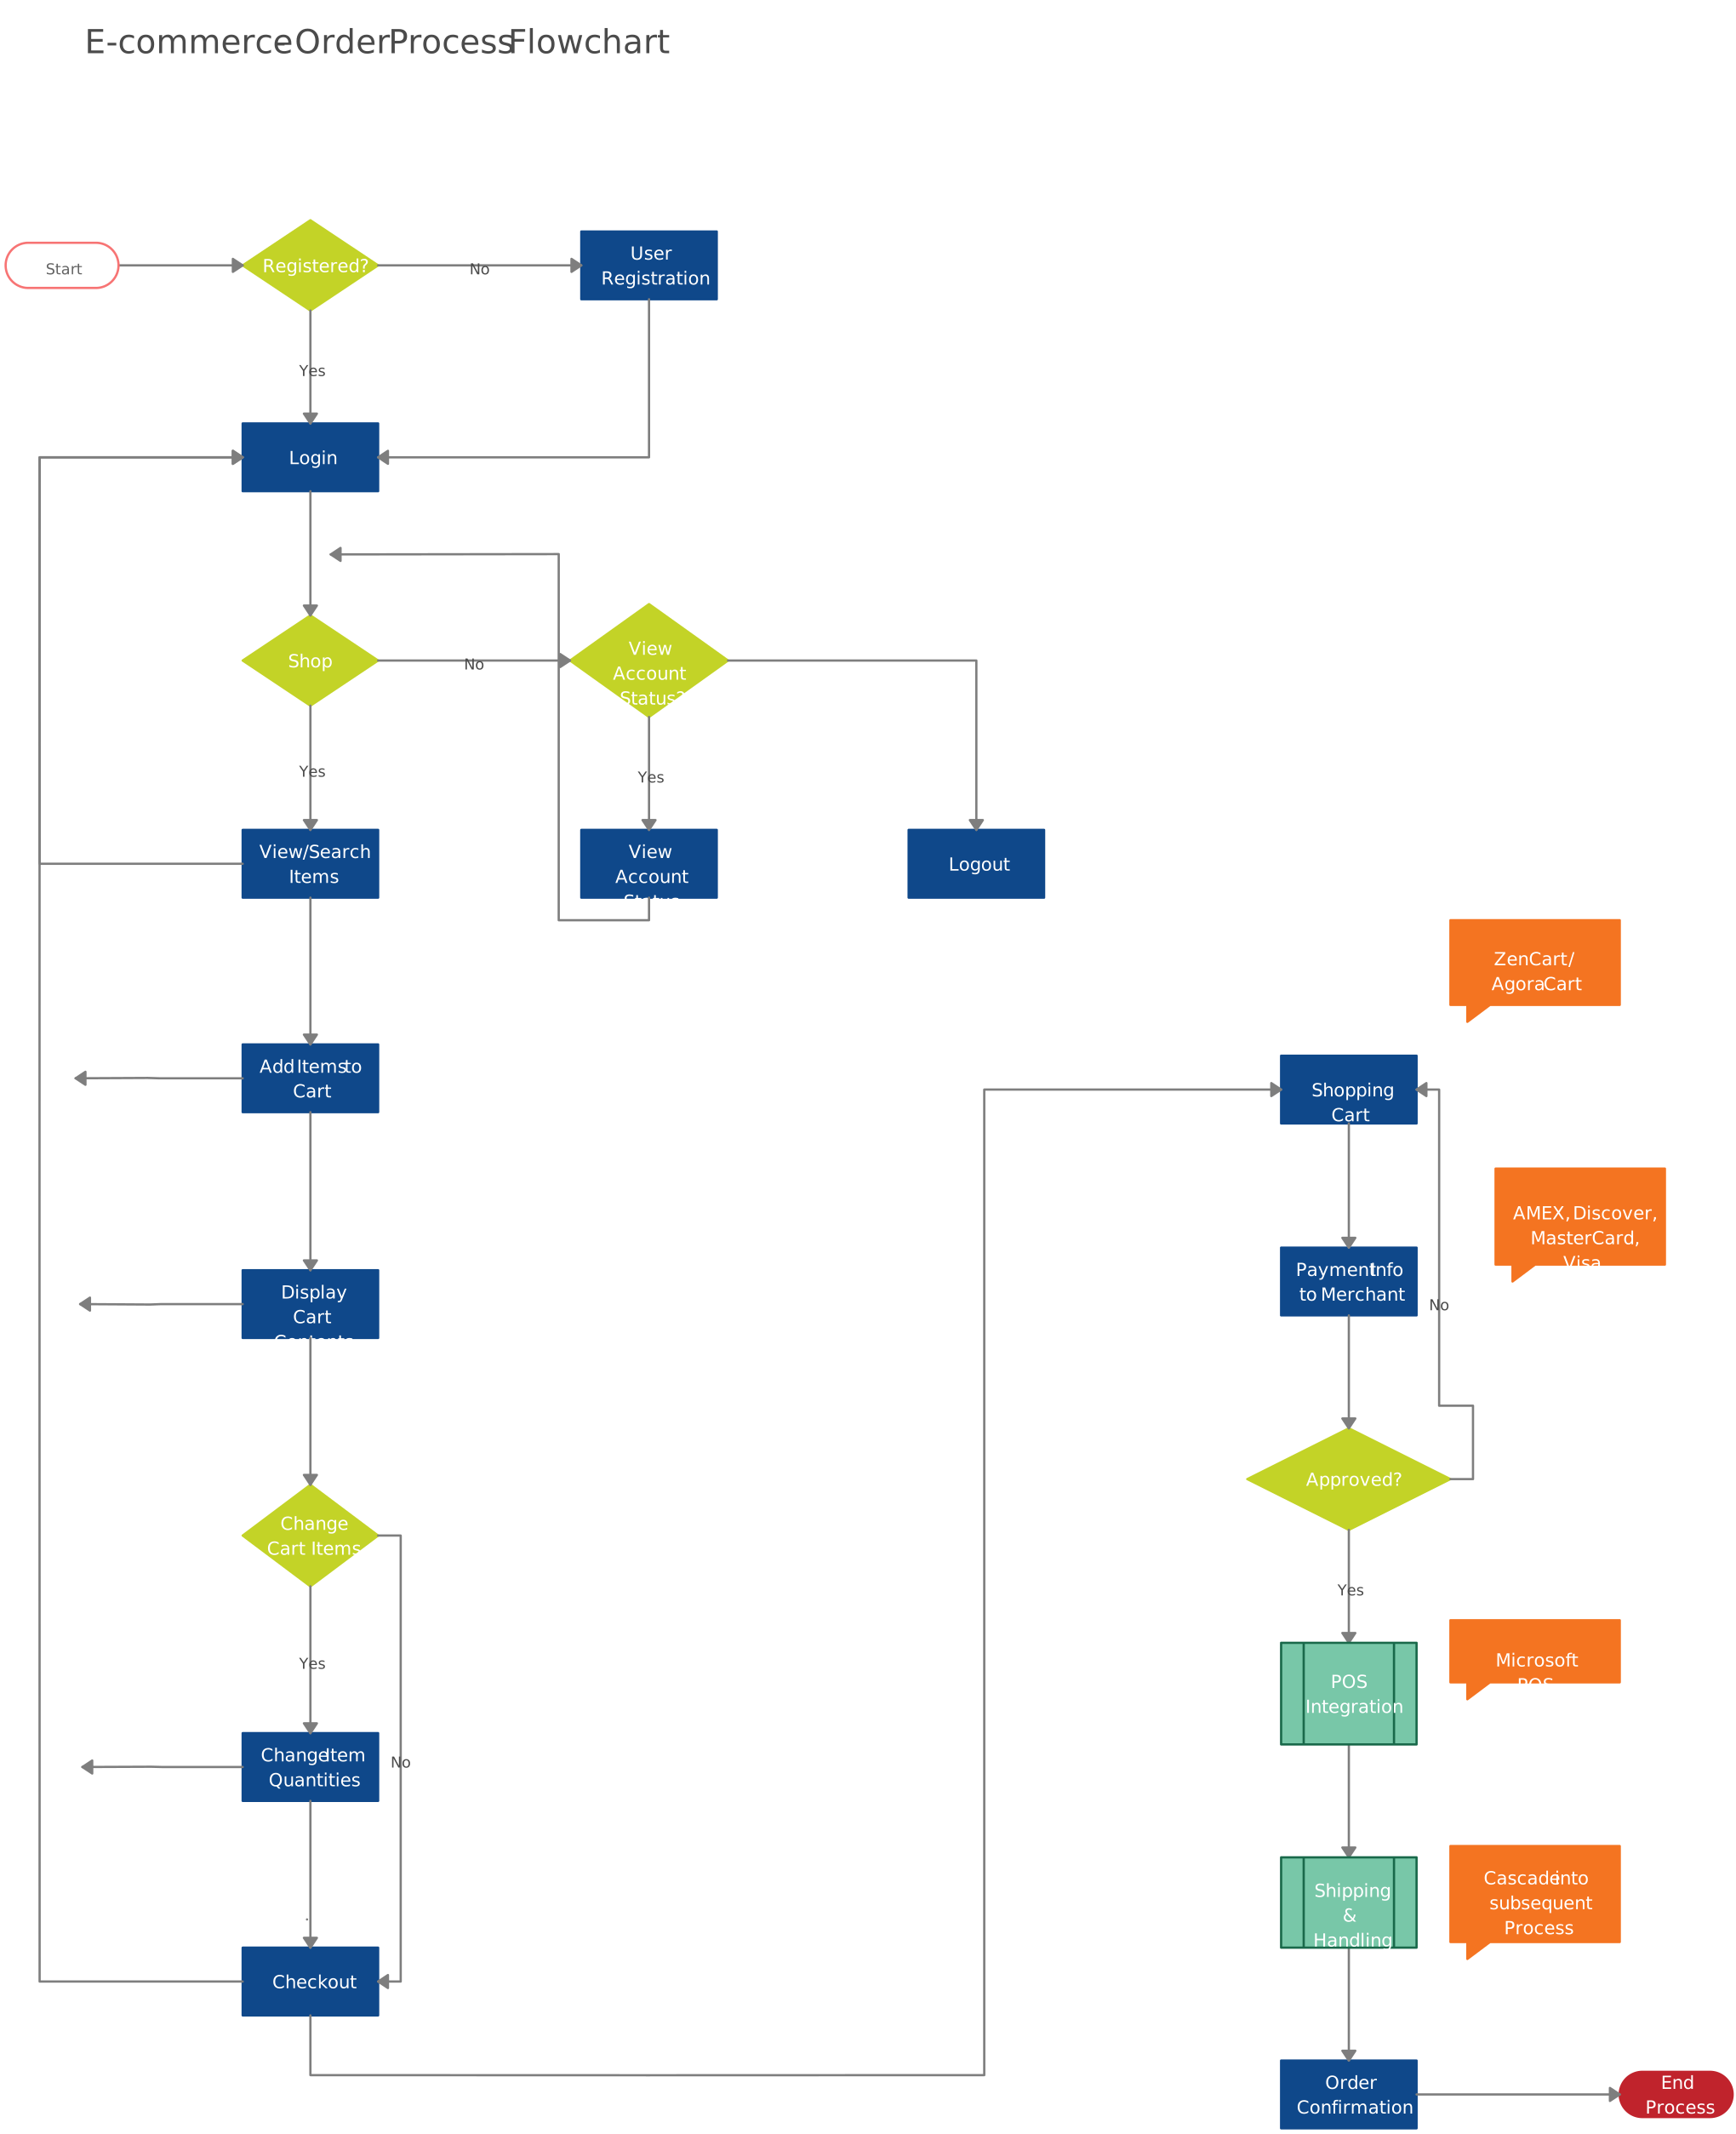
Transportation is the backbone of logistics, ensuring that goods move efficiently from one point to another. This process requires careful planning and management to meet deadlines and minimize costs. A well-defined logistics process mapping diagram offers a visual representation of each step involved in transporting goods, enabling logistics managers to pinpoint bottlenecks and identify opportunities for improvement.
- Freight Management and Optimization: Document how transport mode, consolidation, service level, capacity, cost, and risk are evaluated. Use shipment and carrier data to test whether proposed consolidation or procurement changes deliver the intended result.
- Carrier Selection and Management: Choosing the right carriers is key to ensuring reliable and efficient transportation. Managing carrier relationships helps negotiate competitive rates and secure consistent service.
- Customs Compliance and Documentation: For international shipments, ensuring compliance with customs regulations and proper documentation is crucial to avoid delays, fines, or confiscations.
- Shipment Tracking and Visibility: Transport and traceability systems can capture shipment locations, events, and milestones. A process map shows when that information is created, shared, reviewed, and escalated.
- Route Planning and Optimization: Route-planning systems evaluate constraints such as capacity, service windows, distance, cost, regulations, and risk. Map the planning and exception workflow, then validate route changes with actual fuel, cost, and transit-time data.
Stage 5: Last-Mile Delivery (The Final Touch)
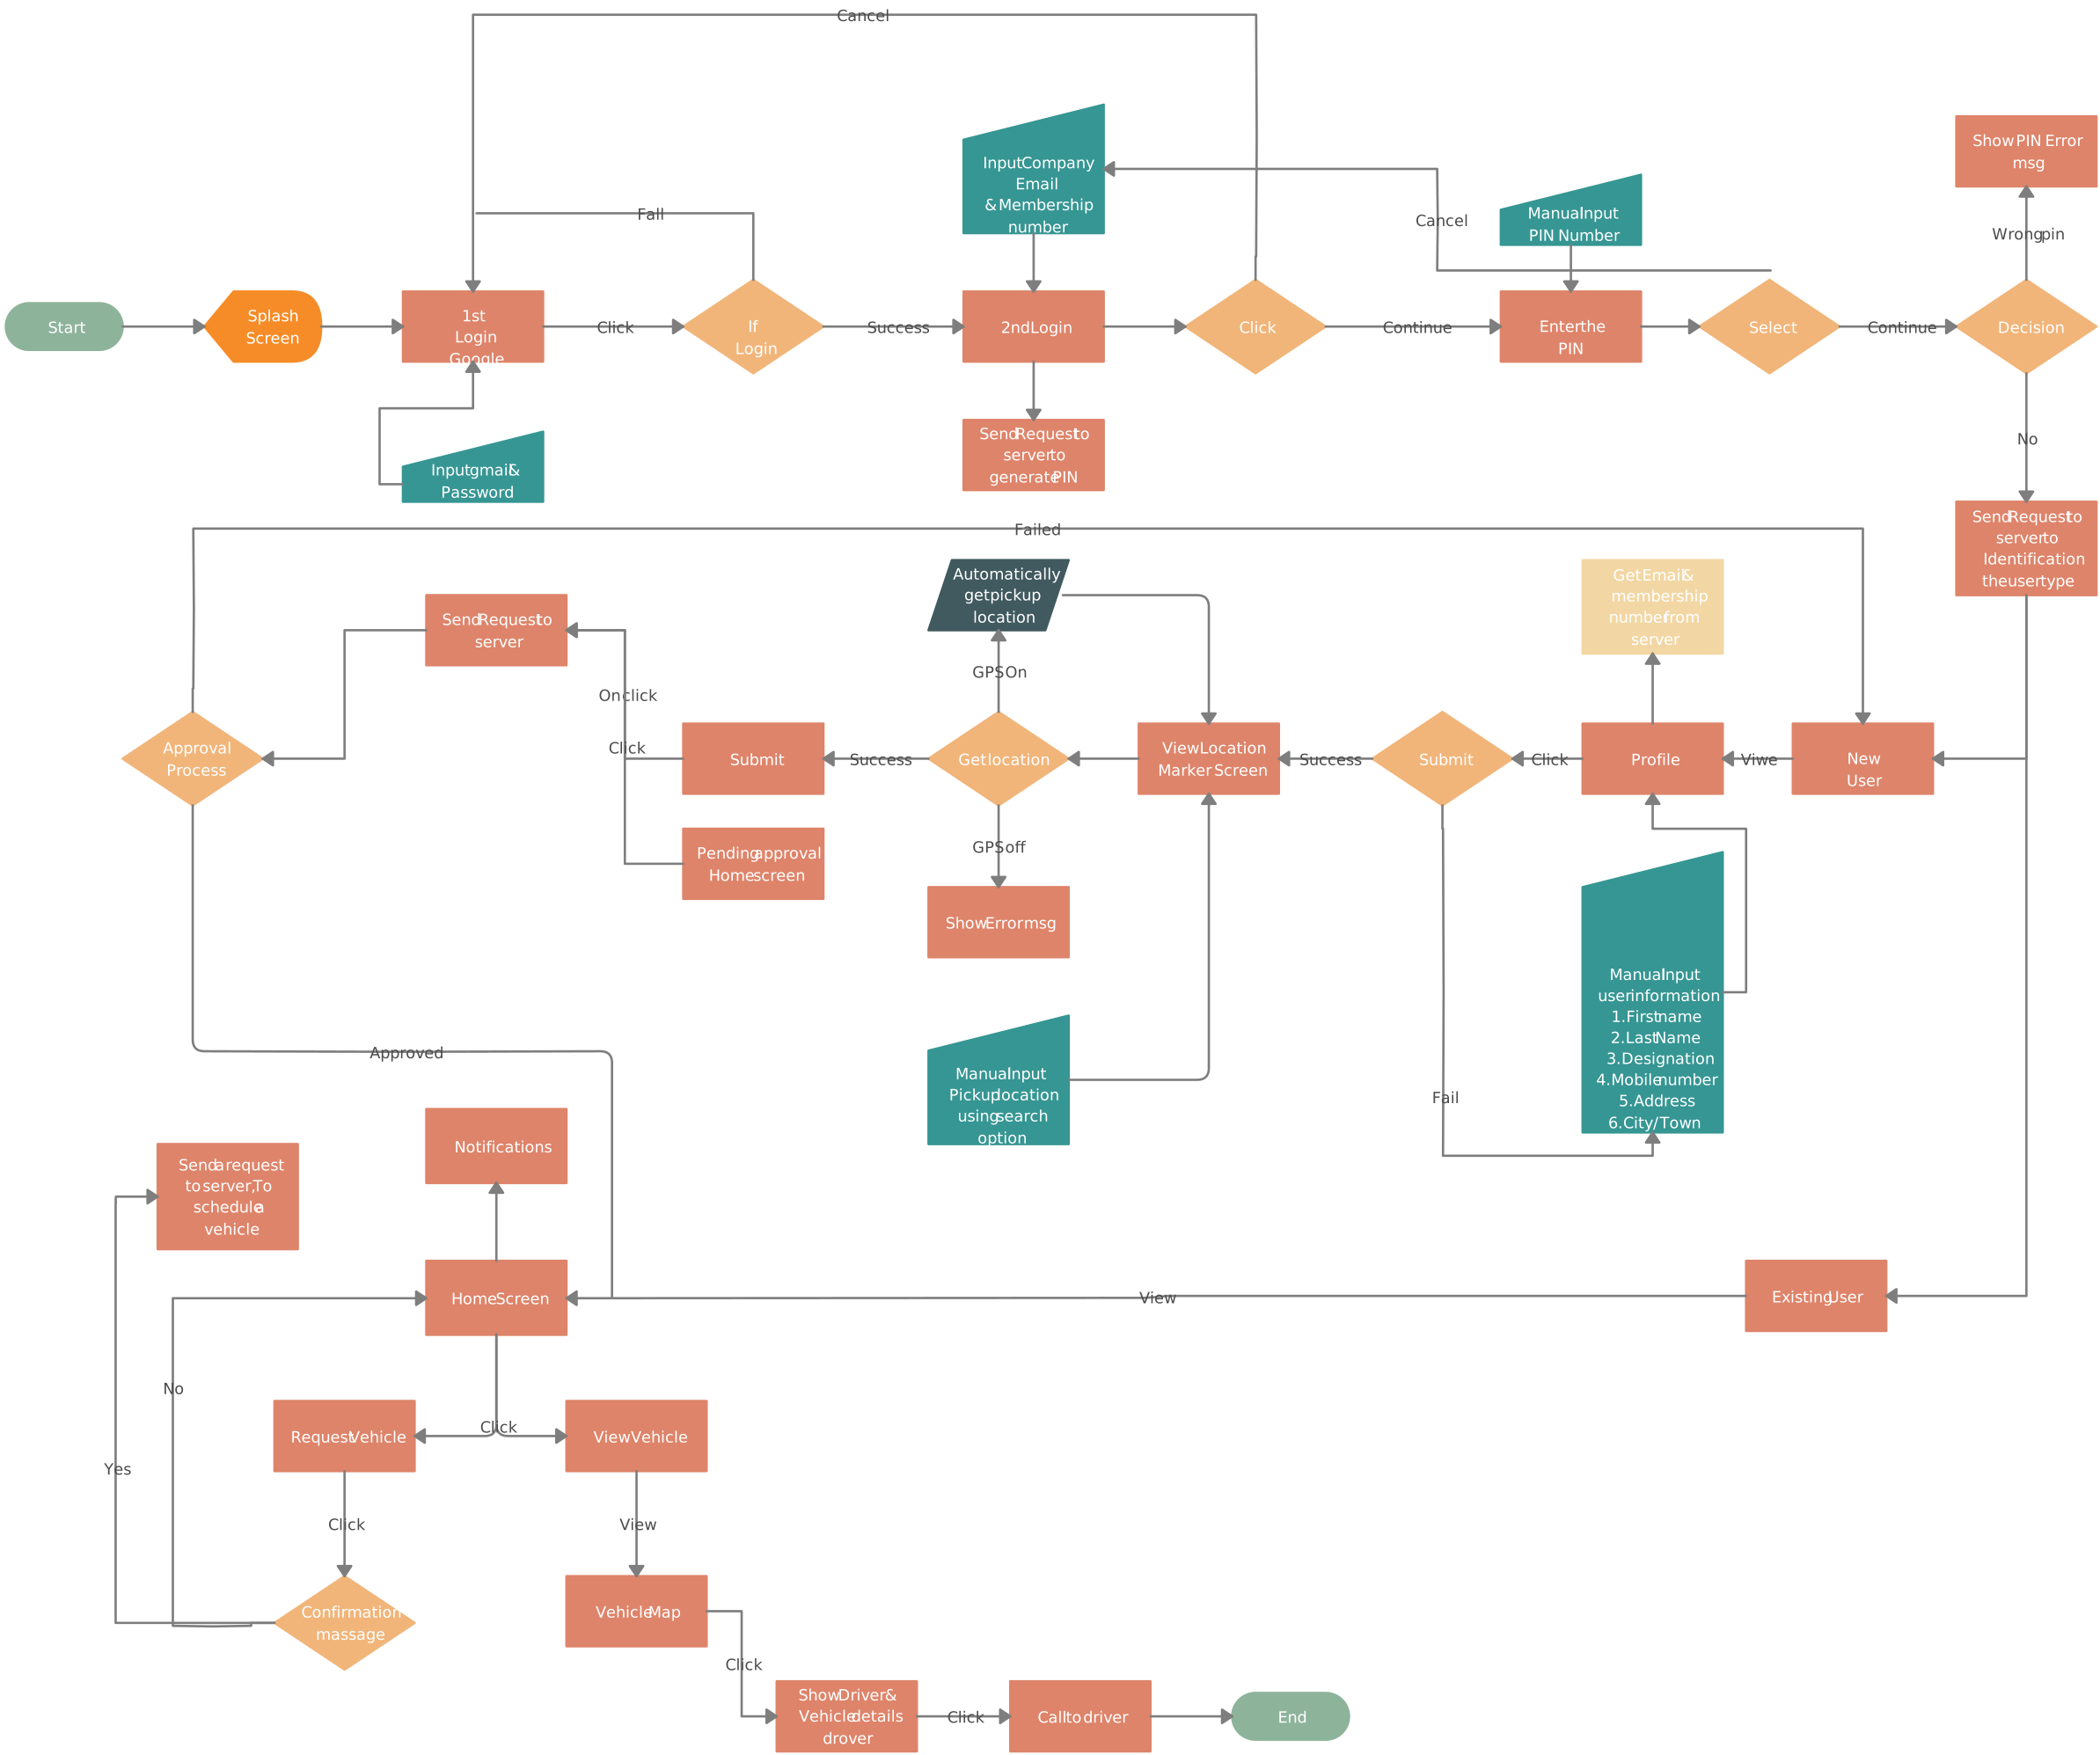
While outbound transportation gets the goods to the right region, last-mile delivery handles the high-stakes journey from the local hub to the customer’s doorstep. This is the most visible part of the logistics chain and directly impacts your brand’s reputation.
- Individual Stop Sequencing: Document how stops, delivery windows, capacity, traffic information, and exceptions feed the sequencing decision. Specialized routing tools—not the process map alone—calculate and update routes.
- Proof of Delivery (PoD): Document who records proof of delivery, which identifier links it to the shipment, where it is stored, and how discrepancies are handled. Applicable evidence and retention requirements depend on the organization, contract, and jurisdiction.
- Reverse Logistics & Returns: Last-mile mapping must also account for the “Return Loop.” Efficiently routing a driver to pick up a return while they are already in a neighborhood can save significant operational costs.
How to Create a Logistics Process Map
Creating a logistics process map provides a clear, visual overview of logistics operations, helping businesses to identify bottlenecks, streamline workflows, and enhance overall efficiency. Follow these steps to build a useful and effective logistics process map.
Step 1: Identify Your Operational ‘Trigger’ and Scope
Instead of a broad goal, start with a specific operational pain point. Are you mapping a micro-flow (e.g., dock-to-stock cycle time) or a macro-flow (e.g., end-to-end supply chain visibility)?
- Logistics Action: Define explicit start and end events that match the use case. A fulfillment map might begin when a validated order is released and end when delivery is confirmed or an exception is handed to the returns or claims process. Record the accountable owner and interfaces outside the selected scope.
Step 2: Collect Field Data and ‘Walking the Floor’
Logistics maps fail when they rely on how things should work rather than how they actually work.
- Logistics Action: Gather observed data from appropriate operational systems and samples, such as average dwell time, pick-to-ship cycle time, queue time, order accuracy, and exception rates. Record the time period and definition used for each measure.
- The “Gemba” Walk: Physically follow a package from the receiving bay to the shipping lane. Note the “Hidden Steps”—the manual workarounds or paper-based checks that aren’t in the official manual.
Step 3: Choose the Right Logistics Visualization
Not all diagrams are created equal. Select a format based on the “Layer” of logistics you are analyzing:
- Swimlane Diagrams: Best for Order Fulfillment, showing how an order moves between the Sales, Warehouse, and Carrier teams.
- Value Stream Maps (VSM): Best for Lean Logistics, identifying “waste” (non-value-added time) like inventory sitting idle in a staging area.
- Spaghetti Diagrams: Best for Warehouse Layouts, visualizing the actual physical path a picker walks to complete an order.
Step 4: Map the Current State (The Reality Check)
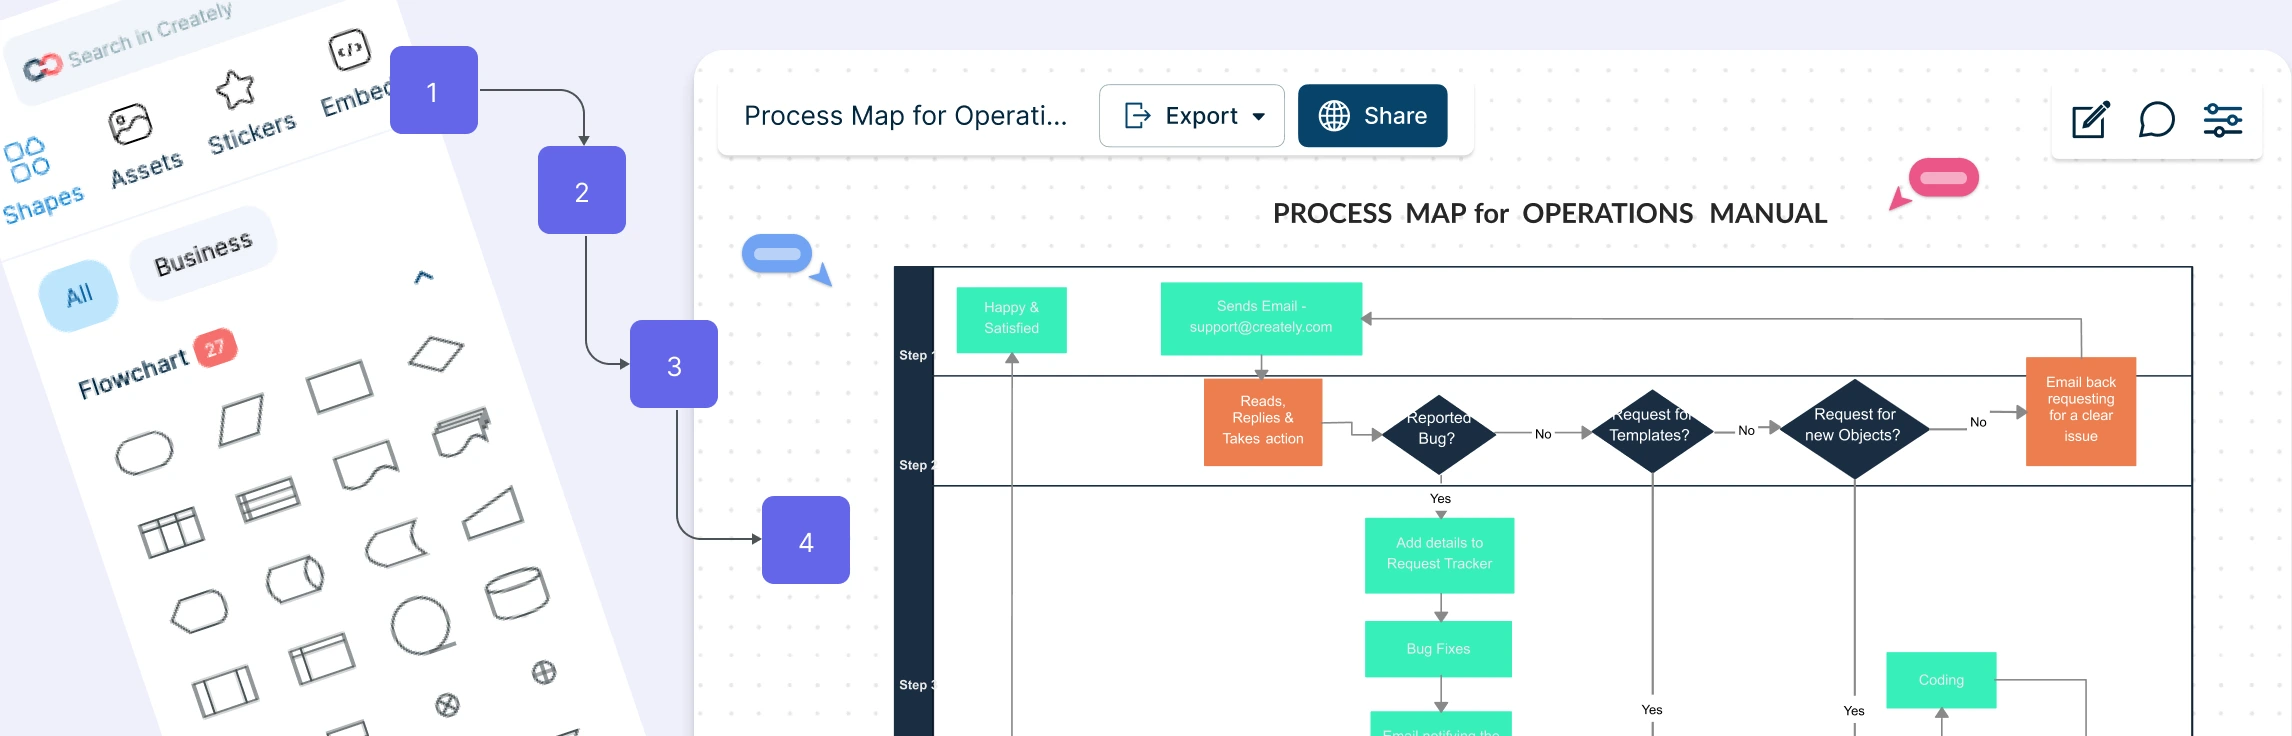
Using a tool like Creately, plot the current flow of goods, information, and documentation.
- Logistics Action: Use a consistent legend for waiting inventory, information flows, physical movement, decisions, and handoffs. If a formal notation or industry standard applies, follow it consistently and explain any local symbols.
- Identify Friction Points: Look for “Black Holes” where data visibility is lost, or “Bottlenecks” where physical goods pile up faster than they can be processed.
Step 5: Analyze, Simulate, and Optimize
Compare the current-state evidence with the target measures and identify the causes of delays, rework, risk, or unnecessary movement. A diagramming tool supports analysis and scenario discussion; quantitative simulation requires suitable simulation software, input distributions, assumptions, and validation.
- Logistics Action: Identify candidate changes, such as removing a duplicate check or adjusting an approval threshold. Assess safety, compliance, customer, labor, system, and downstream effects before implementation.
- Future State Mapping: Create a “to-be” map showing the proposed flow, owners, handoffs, controls, systems, and measures. Treat technologies such as automated picking, route optimization, and tracking as requirements to evaluate—not benefits the map delivers automatically.
After stakeholders review the proposal, assign accountability for implementation and measurement. Update the living process documentation when the operational change is implemented and validated, and retain necessary governance or change records.
How Creately Enhances Logistics Process Mapping
Creately supports logistics process mapping with flowcharts, swimlanes, BPMN 2.0 shapes, real-time collaboration, structured process properties, and connected documentation. It helps teams document and review logistics processes; it does not provide warehouse execution, inventory tracking, route optimization, quantitative simulation, or shipment visibility by itself.
Centralized Information and Resources with Notes
Teams can add notes, links, and files to relevant shapes so warehouse instructions, SOP guidance, requirements, and reference material remain close to the workflow they explain. Structured properties such as owner, status, duration, systems, trigger, SLA, and tags can add consistent process context. Operational values such as inventory, cost, or shipment status still need an authoritative source system and an appropriate update process.
This connected context reduces unnecessary searching without claiming that every external document or system is replaced. Accountable owners should maintain the information and confirm that sensitive or regulated data is handled according to organizational policy.
Linked Process Maps for Seamless Navigation
Linked diagrams can connect an end-to-end logistics overview with detailed procurement, warehousing, fulfillment, transportation, delivery, or returns subprocesses. This helps users move between levels of detail while retaining the broader process context.
Links do not imply automatic synchronization across separate diagrams. When one process changes, owners should assess affected maps and update the relevant living documentation through the established maintenance workflow.
Reduced Effort and Simplified Management
Real-time editing and contextual comments let warehouse, transport, procurement, customer-service, risk, and technology stakeholders discuss specific steps and handoffs. The accountable process owner can evaluate feedback, record the decision in the appropriate governance system, and incorporate agreed changes into the map after implementation.
Creately AI can generate an editable flowchart draft from a natural-language description. Subject-matter experts should validate the actual flow, exceptions, ownership, controls, and logistics data before using the diagram for operational decisions. Explore Creately’s process mapping software for collaborative process documentation and review.
Wrapping Up: Embracing Process Mapping in Logistics Management
Logistics process mapping gives teams a common language for understanding material and information flow. Begin with the actual current state, validate it with the people who perform the work, and use reliable operational data to prioritize improvements. A future-state map can guide change, but cost, service, safety, traceability, and compliance outcomes must be measured and governed through the relevant operational systems and controls.
Maintain the map as owned, living documentation. Use contextual feedback to review changes, keep supporting notes and references connected, and update the map when the real process changes. This creates a more trustworthy reference for operations, training, risk reviews, and continuous improvement.
Helpful Resources
Document logistics workflows, owners, handoffs, and supporting process context in a collaborative visual workspace.
Map material and information flow to examine delays, waste, and improvement opportunities.
Use flowcharts online to visualize workflows for collaborative brainstorming, problem-solving, and so much more.
Get started with our Swimlane Diagram Maker to streamline your processes and enhance collaboration.
FAQs on Logistics Process Mapping
How does logistics process mapping support effective decision-making?
What role does logistics process mapping play in inventory management?
How can logistics process mapping reduce operational costs?
How can Creately help with logistics process mapping?
Can logistics process mapping help with compliance and risk management?
***Resources: ***
- GS1 Global Traceability Standard
- Lean Enterprise Institute: Understanding the Fundamentals of Value-Stream Mapping
- OSHA: Warehousing—Hazards and Solutions
- Knoll, D., Reinhart, G. and Prüglmeier, M. (2019). Enabling value stream mapping for internal logistics using multidimensional process mining. Expert Systems with Applications, 124, pp.130–142. https://doi.org/10.1016/j.eswa.2019.01.026.
- Ramos Gutiérrez, B., Reina Quintero, A.M., Parody, L. and Gómez López, M.T. (2023). When business processes meet complex events in logistics: A systematic mapping study. Computers in Industry, 144, p.103788. https://doi.org/10.1016/j.compind.2022.103788.