How DMAIC Can Help with Social Media Marketing
Steps in DMAIC

DMAIC (Define, Measure, Analyze, Improve, Control) is a five-step problem-solving methodology used to identify bottlenecks and improve processes. This methodology is part of the Six-Sigma philosophy, which started back in the 1980s in the manufacturing industry. The methodology remains relevant… Read More

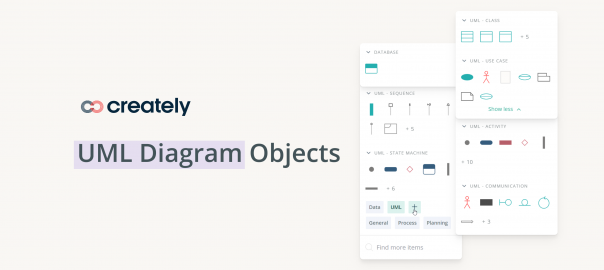
UML Diagram Objects and Their Usage
Unified modelling language diagram objects

Here is an overview of all the nine different kinds of Modeling diagram objects that are wrapped under the heading of the UML.

  • UML Class Diagrams
  • UML Use Case Diagrams
  • UML Object Diagrams
  • UML Sequence Diagrams
  • UML Collaboration Diagrams
  • UML Statechart Diagrams
  • UML Activity Diagrams
  • UML Component Diagrams
  • UML Deployment Diagrams

All these UML diagram objects are available in Creately and you can try out a demo or take a look at some sample UML Diagrams for more context.

System

A system in a UML Use Case Diagram is a rectangle spanning all the use cases in the system that defines the scope of your system. Anything within the box represents functionality that is in scope and anything outside is not. Note that the actors in the system are outside the system.

system example uml diagram objects

Simple Object

object diagram - uml diagram objects

The simple object from the UML Object Diagram is a rectangle that displays the object name. This object’s name is usually underlined.

Object

The object element from the UML Object Diagram is a rectangle divided into two parts. The top part contains the name of the object, while the second part contains the attributes of the object. Note: This element should not be mistaken with the Class element which is divided into three parts.

Object shape - uml diagram objects

Activation

Activation elements in the UML Sequence Diagram are boxes on the lifelines. These are also called the method-invocation boxes, and indicate that an object is responding to a message. It starts when the message is received and ends when the object is done handling the message.

activation example - uml diagram objects

Message Arrow

Message arrow - uml diagram objects

Message Arrow in the UML Collaboration Diagram shows the interaction between the commencing object and the destination object.

Initial State

The Initial State from the UML Statechart Diagram is the state of an object before any transitions. For objects, this could be the state when instantiated. The Initial State from the UML Activity Diagram marks the entry point and the initial Activity State. The notation for the Initial State is a small solid-filled circle. There can only be one Initial State on a diagram.

End State

End state from the UML Statechart Diagram marks the destruction of the object whose state we are modeling. The Activity End in a UML Activity Diagram shows the termination of the activity. The End notation is shown as a circle surrounding a small solid-filled circle.

Activity

Activity state in a UML Statechart Diagram and UML Activity Diagram marks an action by an object. The notation for this is a rounded rectangle.

activity example uml diagram objects

Junction

Junction - uml diagram objects

Junction state in a UML Statechart Diagram are vertices that are used to chain together multiple transitions. They are used to construct compound transition paths between states. A junction is represented by a small black circle.

Choice

Choice state in a UML Statechart Diagram evaluates the guards of the triggers of its outgoing transitions to select only one outgoing transition. The decision on which path to take maybe a function of the results of prior actions performed in the same run-to-completion step. A choice pseudostate is shown as a diamond-shaped symbol.

Fork / Join

Fork shape - uml diagram objects

A Fork notation in a UML Activity Diagram is a control node that splits a flow into multiple concurrent flows. This will have one incoming edge and multiple outgoing edges. A join node is a control node that synchronizes multiple flows. This will have multiple incoming edges and one outgoing edge.

Fork vertices in the UML Statechart Diagram serve to split an incoming transition into two or more transitions terminating on orthogonal target vertices. The segments outgoing from a fork vertex must not have guards or triggers. Join vertices serve to merge several transitions emanating from source vertices in different orthogonal regions. The transitions entering a join vertex cannot have guards or triggers.

You can easily create them online using our activity diagram tool.

Composite State

A composite state in a UML Statechart Diagram is a state that has substates (nested states).

Object

The Object notation in a UML Activity Diagram is an activity node that is used to define the object flow in an activity.

Flow End

flow end shape - uml diagram objects

The Flow End node in UML Activity Diagrams is a control final node that terminates a flow. It destroys all tokens that arrive at it but has no effect on other flows in the activity. This is a small circle with an X inside.

Signal Receipt

Signal Receipt notation also called the Accept event action in a UML Activity Diagram is an action that waits for a specific event to occur. This is drawn as a concave pentagon.

signal receipt uml diagram objects

Signal Sending

Signal Sending in UML Activity Diagram is an action that creates a signal instance from its inputs and transmits it to the target object, where it may cause the firing of a state machine transition or the execution of an activity.

signal sending example uml diagram objects

Activity Partition

activity partition uml diagram objects

Activity Partition in a UML Activity Diagram is either horizontal/vertical swimlane. The partitions are used to separate actions within an activity diagram.

Component

component shape uml diagram objects

A Component UML Component Diagram represents a modular part of a system. A Component element in a UML Deployment Diagram represents a distributable piece of implementation of a system.

Provided Interface

A Provided Interface of a component in a UML Component Diagram describes the services that the component offers to its environment. This is modeled using the lollipop notation.

Required Interface

A Required Interface of a component in a UML Component Diagram declares the services that the component expects from its environment. This is modeled using the socket notation.

required interface uml diagram objects

Provided Interface & Required Interface with Port

A Provided Interface with Port in a UML Component Diagram specifies a distinct interaction point between the component and its environment. Ports are depicted as small squares on the sides of components.

interface port - uml diagram objects

Node

A Node element in a UML Deployment Diagram is anything that performs work in the system. This can be either hardware like personal computers; or software like the operating system, database server, and so forth.

Device

A Device element in a UML Deployment Diagram is a type of node that represents a physical computational resource in a system, such as an application server.

device example - uml diagram objects

Deployment Specification

A Deployment Specification element in a UML Deployment Diagram is a configuration file, such as an XML document or a text file that defines how an artifact is deployed on a node.

deployment specification example uml diagram objects
The New Era of Creately
Creately's New Brand Identity

Today is a big day, we are launching a new app interface, new feature sets, a new logo, and in essence a whole new Creately. 

Our new identity signifies so much more than just a brand revamp, it’s a transformation aimed to usher in a new era of work.

For years Creately’s success was built on its ability to simplify work by providing a platform to think visually. We have taken these same core principles and built a tool that connects all aspects of work through data, integrations and visual tools, providing a central place where teams and organizations can get together and get things done.

Work today is done on docs, spreadsheets, and dreaded productivity apps. Too much time is spent pinging-ponging between different tools, finding information and coordinating efforts. This is time that could be spent thinking creatively about solutions, better understanding problems, and making decisions that have large positive impacts.
So, how do we build a space where we can be productive and not just busy, where data and decisions go hand-in-hand and where the true spirit of human creativity can be unlocked?
We do it by changing the rules, we do it by taking the playfulness of a canvas and adding the power of a database. We do it by breaking down the restrictive structures that force us to work in silos and give teams a space to be open, free, and collaborative. We do it by taking away the friction and frustration of modern work. We do it by being

The New Interface for Work

Why The Change? 

Creately was built on its visualization capabilities; millions of users have used it to brainstorm ideas, represent models, create flowcharts, and plan processes. But at its core, it was a diagramming and visualization tool and our previous logo embodied that. As our core purpose evolved, we needed a logo to represent this sea change in how we are approaching the modern work environment. Creately is now the world’s first work management platform that runs on a smart visual canvas.

The Core Principles 

To create a new brand language we established some core values to govern every facet of Creately.

  • Connected– To people, data, and apps. Creately brings it all together and provides a central platform for all your work.
  • Insight- Multiple ways to look at the same information. See things differently, gain big picture understanding and uncover your ‘A-ha!” moments
  • Simplicity– Represent complex problems in easy ways. Creately’s platform is powerful and robust and super simple to use. 
  • Flexibility-  Free-form and completely customizable. 

We began exploring ways to visually express Creately’s highest order benefit which is to connect the Dots Across Your Company.

Explorations:

It took months of work and 100s of iterations to find the best representation of our core values. And while we had many great options to choose from we selected what we felt was the most iconic representation of our brand story.

The new Creately logo has a simple form factor but is memorable and distinct. It uses the negative space to showcase the literal connection of data points, it invokes the feeling of collaboration and vision while retaining our brand name at its core. 

This visual evolution encapsulates the next phase of Creately. Our new capabilities are unlike anything available now and is a completely new way to think about how to organize and manage your work. 

We see it as an evolution of how people work with apps and systems. It’s flexible, visual, easy to change and cuts down grunt work between systems. A single portal for the details and the big picture that’s always in sync. 

We cannot wait to see what you’ll build with Creately. 


Visual Tools to Use While Conducting Experiments
Visual Tools to Conduct Experiments

Hunches and gut feelings can only take you so far. For any sustained success, data needs to be at the center of any decision-making process. The ability to change, adapt, and improve when new information is received is critical for product teams and businesses at large to stay competitive and have continued success. 

Implementing an effective way of conducting experiments gives you a way to make better decisions, learn quicker from mistakes and rely on results and facts,  not on personal biases. 

Conducting experiments can provide valuable insights for your company. But, devising the right experiment for the right task can be a challenge. In order to truly learn from your experiments, you need to spend time creating ones that will give you conclusive results. Focusing your efforts on a few distinct experiments that answer important questions will give you real, beneficial insights that can drive product improvements and help you achieve your long term goals.

The Test And Learn Philosophy 

It involves a different approach to how organizations see business challenges. It is a method that allows businesses to make strategic long-term decisions based on the results they gain in the short term. Simply put, it is a set of practices that allow a business to try out new ideas and concepts with a small subset of customers and use the learnings to develop a strategy. You can learn more about it here.

Setting up the Experiment 

The planning and implementation of successful experiments involve careful designing, prioritizing and analysis, here are some of the steps you should follow while planning for your experiment:

Ask Questions That Generate Ideas

Every experiment begins with a ‘why’. They can be basic questions that help you generate a hypothesis. Questions can be as broad as, “Why is my conversion rate only 10%? Why don’t I have more repeat customers?  What can’t I use to upsell my customers?”

The 5 Why Analysis Template can be applied to the above process for a deeper investigation.

Questions form a basis to ideate and come with a hypothesis. Each question could result in several hypotheses that could be tested through experimentation.

Create a Hypothesis

A hypothesis is a testable statement that can be proved or disproved. It involves looking at the information at hand and taking an educated guess or prediction about the relationship between two variables. Usually, hypotheses consist of ‘if-then’ statements. For example,

If we offer users a free trial then the conversion rate will go up.

If we reduce the number of steps during sign-up then we will get more registrations.

If we change the app interface then we will get more downloads. 

In each hypothesis there are 2 variables, variable 1 is an independent variable as it doesn’t depend on the other. Variable 2 is the dependent variable that will change if the independent variable changes.

Conducting The Experiment

You can conduct product experiments using the AB test method or the multivariate method. AB testing involves two variations of the same feature whereas a multivariate approach involves testing many versions of the same feature to find the best performing one. 

Communicate Your Results

After conducting experiments, you should produce tangible results, it is important to find an efficient way to communicate your findings clearly and find a way to decide on what your next steps should be. 

Remember, while conducting experiments, knowing what not to do is also making your product better.

4 Visual Tools to Conduct Experiments 

Assumption Grid

Every business model operates on assumptions but some assumptions have greater consequences on the business than others. This simple visual tool helps you identify what your riskiest assumptions are and helps develop a better understanding of the impact they will have on your business. 

The grid plots your assumptions on two axes, certainty and risk, you can then assess your high impact assumptions for which you have little information and low impact assumptions that may not be very consequential to your business. Visualizing your assumptions can empower you to make judgment calls, prioritize, mitigate risk, and overcome uncertainties. Through this grid, you can prioritize your experiments and decide which hypotheses need to be tested immediately based on how they will affect your business in the long term.

Assumption Grid Template for conducting experiments.
Assumption Grid Template (click to edit online)

Experiment Canvas

The purpose of the experiment canvas is to be able to design the right experiment at the right time. It provides you with a tool to clearly state a falsifiable hypothesis based on your riskiest assumption. Once you have identified your riskiest assumptions, you need to find a way to test and measure them in a quantifiable way. The experiment canvas lets you break down your assumptions into measurable, observable experiments.

Experiment Canvas for Conducting Experiments
Experiment Canvas Template (click to edit online)

Opportunity Canvas

An opportunity canvas helps you analyze your business in a more holistic manner. It provides context and is especially useful when planning the release of new features or product improvements. It helps you frame your problems or ideas better and provides a framework to decide which ideas you should move on to the experimental stage. Often, there are many new ideas we think we should implement, without fully understanding the impact it will have on the business or how users may respond to it. The opportunity canvas walks you through how customers will use your solution, potential setbacks, strategies, challenges, and metrics. It provides a good basis to determine which experiments are worth taking forward.

Opportunity Canvas for Visual Experiments
Opportunity Canvas Template (click to edit online)

Impact Effort Matrix

Time and resources are always limited, so prioritizing what improvements should be made to your product is always a challenge. The impact effort matrix helps you categorize ideas into 4 categories, quick wins-that require minimal effort and provide high returns don’t necessarily need to be tested as they don’t have a high resource requirement. You should test high effort activities in smaller samples before they are implemented. With this matrix, ideas that require a disproportionate amount of effort to execute, with minimal results should be disregarded. The impact effort matrix allows you to visualize all your potential experiments and decide the order in which they should be executed. You can also decide how much time and energy should be spent on each. 

Impact Effort Matrix for Conducting Experiments
Impact Effort Matrix (click to edit online)

Establishing a Culture of Experimentation 

The value of conducting experiments extends far beyond the results or learnings you gain after conducting them. Building a culture of experimentation in an organization breeds innovation; one where questions are constantly being asked and improvements are continually sought out. Setting up an environment where theories can be tested immediately and changes made accordingly, results in a more participatory culture where people can freely exchange ideas.

The Best Ideation Techniques for Remote Teams

Every organization needs a steady supply of fresh creative ideas to stay relevant and ahead of their competitors successfully. As necessary as it is, generating good new ideas isn’t as easy as getting everyone in the team into a room and spending 3 hours to come up with barely anything. 

A good ideation session is hard work. It needs a well-facilitated process, carefully-designed exercises, and proper tools (especially when a remote team is involved) to generate innovative, and viable ideas. 

We’ve listed x ideation techniques you can try to generate diverse ideas easily, even if your team is conducting the ideation session remotely. We’ve also included interactive online templates that you can open on your web browser and use to collaborate with the team right away during the meeting.

What is Ideation

Ideation is the process by which you generate new ideas or solutions, using techniques such as mind mapping, prototyping, brainwriting, reverse brainstorming, etc. Ideation is also the third step in the Design Thinking process, where ideas are generated, analyzed, and prioritized to inspire the innovation of new solutions.

The ideation process

  • Identify the need for ideating. Perhaps you are looking to solve an organizational problem, come up with new product or service ideas, expand your market reach, etc., and specifying that need will help you set a goal for the session and guide it more effectively. 
  • Select your team for the ideation session. To generate more diversified ideas, involve a variety of people with different experiences and backgrounds. 
  • Single out the best idea/s to implement. To do this, you need to have a set of defined criteria that the generated ideas will be evaluated against (this should be ready prior to the session). Along with the evaluation criteria, you should also determine the internal teams you will be handing over the prioritized ideas for further evaluation or implementation.  
  • Next comes the implementation of the prioritized ideas, which involves allocating resources, assigning responsibilities, mapping workflows, defining timelines, and tracking progress.

Remote team ideation

Even when the team is in one place, running a productive ideation session can be a challenging task. Doing the session online, when everyone is joining in from different locations, can lend itself to being even more complicated. However, you only need to do a few things to make a remote ideation session as productive and seamless as one done physically.  

  • Choose your tech tools wisely and keep them to a minimum. In order to do so, you need to identify your meeting needs. Ideally, you will need 
  • Communicate expectations clearly early on to avoid wasting time during the meeting. Clarify the goal of the meeting and any rules and guidelines the participants should adhere to during the ideation exercises that will be carried out.  
  • In order to make the most of the actual meeting time, you can encourage participants to do their research and analysis prior to the session. This will allow you to utilize more time discussing and collaborating on developing the ideas further during the session. 
  • Follow usual meeting etiquette to run the session smoothly. 
  • Start with a virtual icebreaker to get the team warmed up for the session.

Ideation Techniques 

Ideation techniques are many, therefore when choosing one, match it to the type of idea you are trying to generate. You may also need to consider the experience in ideation your team holds and their creative productivity when selecting the best ideation technique as well. Here are some to choose from:

SCAMPER

The SCAMPER method is an easy and straightforward way to generate new ideas. It lets you innovate on an existing product, service, or process by looking at it from 7 different angles. 

  • Substitute –  what can you substitute (i.e. material used, people involved, process steps, etc.) in your product/ service to make an improvement? 
  • Combine –  What ideas, resources, steps in the process, can you combine to generate a more efficient output?
  • Adapt – What process, component, or feature should you adjust to generate a better result?
  • Modify – What elements can you modify (add more or less of it) to achieve the result you desire? 
  • Put to another use –  What other purposes can the product/ service be used for? Who else can use it?
  • Eliminate – What element in your product or service can you remove or reduce? 
  • Reverse/ Rearrange – What process, component, or feature can you rearrange or reverse?  

How it works

Step 1 – Share the following SCAMPER template with the team prior to the session. Based on your requirements, you can make necessary edits to it in terms of color, alignment, etc.

SCAMPER Template for Ideation Techniques
SCAMPER Template (Click on the template to edit it online)

Step 2 – Identify the existing product or idea that you want to improve upon. 

Step 3 – Take the identified product or idea through the 7 thinking techniques in SCAMPER as listed above. There is no sequence or order, you can start with any of the 7 areas. You can get the participants to add ideas to all 7 categories during rounds or assign one category to a person or group.

Brainwriting 

Brainwriting is a brainstorming technique that gets the participants to write down their ideas on a piece of paper instead of speaking them out. After a few minutes, they share the piece of paper with another participant who then will work on elaborating the first person’s idea. It’s a great technique in terms of getting shy and introverted team members to share their ideas freely. 

How it works 

Step 1 – Create your brainwriting template or modify the one below before sharing it with the participants. Assign each participant a color.

Step 2 – Have a time limit for each brainwriting round and the number of rounds for the session. It’s also important to clarify how each participant should switch columns (i.e. counterclockwise or randomly as decided by the moderator) as they improve upon the ideas of other participants.

Step 3 – Introduce and explain the problem thoroughly and begin the first round. To avoid confusion, you can number or name each column on the brainwriting canvas, so as it passes around, everyone knows what column they should write on next. When the time is up, switch columns. 

Step 4 – In the second round, the participants should work on adding to, modifying, or improving the idea written by the previous owner.

Step 5 – Repeat the process until you complete the set number of rounds. At the end of the session, you can discuss and analyze the ideas and prioritize them.

Round Robin 

Round robin is another group brainstorming technique that is based on an iterative process where participants build off on previous contributions. While it can be conducted in both written and vocal variations, for a remote ideation session, the written variation suits better. It’s similar to brainwriting. 

How it works

Step 1 – Create your Round Robin template and share it with the team prior to the session or at the beginning of it. Either you can have a single How Might We question for the session for all participants or multiple How Might We questions for each participant if you need to solve several problems simultaneously.

Step 2 – Allow everyone time to write down a possible solution to the problem identified or to the How Might We question.

Step 3 – The next person in line should review this solution and write down reasons why (risks and roadblocks) this particular solution will fail. 

Step 4 – The next person should then identify possible solutions to eliminate these risks and implement the idea successfully. At the end of the exercise, the bottom row should contain a solid, well-articulated idea that can be presented. 

Step 5 – Once the session is complete, everyone can take a vote to decide the most favored idea. 

To adapt this exercise to an online environment, you can assign each participant a specific spot to start from by assigning them a number or color. While the facilitator can guide the participants through the steps, as a best practice encourage the participants to always move on to the column on their right.

Round Robin Template Ideation Techniques
Round Robin Template (Click on the template to edit it online)

Mind Mapping

Mind mapping helps you to give structure to the ideas in your head and develop them into full-fledged solutions. In a remote ideation session, you can get the participants to work on a single mind map or individual mind maps on the same canvas.

How it works

Step 1 –  Write down the problem statement in the middle of the mind map

Step 2 – Write down possible solutions/ related ideas on branches connected to the center. As you build off on each of these sub-ideas, you can add more and more branches. On an online canvas, to identify the contributions made by each participant you can assign them colors (for each sub-branch they are working on or their own mind map on the canvas).

Step 3 – Once the mind map/s is complete, you can analyze the ideas and prioritize the more viable ones.

Mind Map Template
Mind Map Template (Click on the template to edit it online)

Reverse Brainstorming 

Reverse brainstorming is commonly used in problem-solving. Instead of working on how to solve a problem, reverse brainstorming gets the participants to identify ways to actually cause the problem.  This allows you to generate even more creative ideas. It also helps with identifying problems that may occur in the future.

How it works

Step 1 – Create your reverse brainstorming template and walk the team through how to use it.

Reverse Brainstorming Template
Reverse Brainstorming Template (Click on the template to edit it online)

Step 2 – Clearly define the problem at hand and write it down on the template. 

Step 3 – Reverse the problem by focusing on ways you can cause it or make it even worse. Add the ideas you generate to the board.

Step 4 – Brainstorm solutions for the reverse-problem causes you have identified. Accept all ideas contributed by the participants without rejecting them, at this stage.

Step 5 – Go over the list of generated solutions and identify how you can use them to eliminate the original problem. 

Step 6 – You can discuss and prioritize these solutions as you consider which ones to implement first.

Six Thinking Hats 

Six thinking hats is an ideation technique used to provide direction to decision-making and group thinking. It explores six thinking styles represented by six different colors. It allows the team to look at an idea from different perspectives and gain an in-depth understanding of the idea’s potential. 

White – data, facts and figures

Red – feelings, intuitions, emotions, and hunches  

Black – judgment, legality, morality

Yellow – optimism, benefits 

Green – new ideas, opportunities

Blue –  conclusions, action plans, next steps

How it works 

Step 1 – Prepare a worksheet that includes descriptions of the six hats and share it with the group. The facilitator should decide an order in which the group should use the hats.

Six Thinking Hats Template Ideation Techniques
Six Thinking Hats Template (Click on the template to edit it online)

Step 2 – Set a time limit for each hat based on the relevant thinking style. For example, the green hat thinking style may take longer than the red one.

Step 3 –  You can go through each stage as a team wearing the same hat at the same time and contributing ideas as you go around. Or you can do it in rounds where each participant can wear an individual hat at a time as they add ideas under each column.

More Ideation Techniques

Listed below are resources for more ideation techniques and templates that you can use to generate ideas remotely. 

Conclusion 

Ideation helps you discover unexpected solutions and even sometimes shed light on the obvious ones you might have missed, and push you to think beyond them. With the right tools, techniques, and the team, ideating the correct feasible solutions will become easier. We hope these techniques will help you conduct productive ideation sessions with your remote team. 

Got more ideation techniques that you would love to use with your team? Share with us in the comments section below.