Hunches and gut feelings can only take you so far. For any sustained success, data needs to be at the center of any decision-making process. The ability to change, adapt, and improve when new information is received is critical for product teams and businesses at large to stay competitive and have continued success.
Implementing an effective way of conducting experiments gives you a way to make better decisions, learn quicker from mistakes and rely on results and facts, not on personal biases.
Conducting experiments can provide valuable insights for your company. But, devising the right experiment for the right task can be a challenge. In order to truly learn from your experiments, you need to spend time creating ones that will give you conclusive results. Focusing your efforts on a few distinct experiments that answer important questions will give you real, beneficial insights that can drive product improvements and help you achieve your long term goals.
The Test And Learn Philosophy
It involves a different approach to how organizations see business challenges. It is a method that allows businesses to make strategic long-term decisions based on the results they gain in the short term. Simply put, it is a set of practices that allow a business to try out new ideas and concepts with a small subset of customers and use the learnings to develop a strategy. You can learn more about it here.
Setting up the Experiment
The planning and implementation of successful experiments involve careful designing, prioritizing and analysis, here are some of the steps you should follow while planning for your experiment:
Ask Questions That Generate Ideas
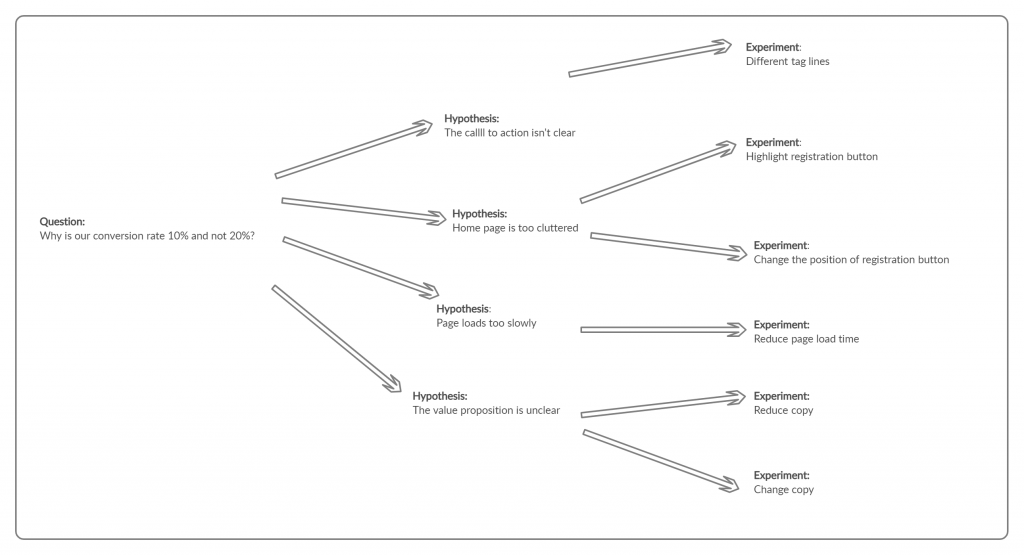
Every experiment begins with a ‘why’. They can be basic questions that help you generate a hypothesis. Questions can be as broad as, “Why is my conversion rate only 10%? Why don’t I have more repeat customers? What can’t I use to upsell my customers?”
The 5 Why Analysis Template can be applied to the above process for a deeper investigation.
Questions form a basis to ideate and come with a hypothesis. Each question could result in several hypotheses that could be tested through experimentation.
Create a Hypothesis
A hypothesis is a testable statement that can be proved or disproved. It involves looking at the information at hand and taking an educated guess or prediction about the relationship between two variables. Usually, hypotheses consist of ‘if-then’ statements. For example,
If we offer users a free trial then the conversion rate will go up.
If we reduce the number of steps during sign-up then we will get more registrations.
If we change the app interface then we will get more downloads.
In each hypothesis there are 2 variables, variable 1 is an independent variable as it doesn’t depend on the other. Variable 2 is the dependent variable that will change if the independent variable changes.
Conducting The Experiment
You can conduct product experiments using the AB test method or the multivariate method. AB testing involves two variations of the same feature whereas a multivariate approach involves testing many versions of the same feature to find the best performing one.
Communicate Your Results
After conducting experiments, you should produce tangible results, it is important to find an efficient way to communicate your findings clearly and find a way to decide on what your next steps should be.
Remember, while conducting experiments, knowing what not to do is also making your product better.
4 Visual Tools to Conduct Experiments
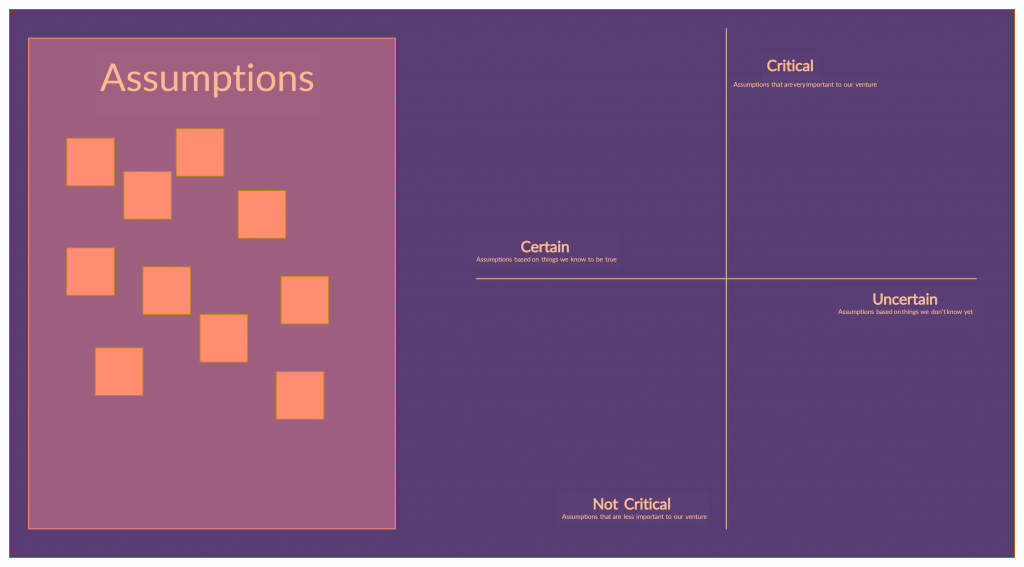
Assumption Grid
Every business model operates on assumptions but some assumptions have greater consequences on the business than others. This simple visual tool helps you identify what your riskiest assumptions are and helps develop a better understanding of the impact they will have on your business.
The grid plots your assumptions on two axes, certainty and risk, you can then assess your high impact assumptions for which you have little information and low impact assumptions that may not be very consequential to your business. Visualizing your assumptions can empower you to make judgment calls, prioritize, mitigate risk, and overcome uncertainties. Through this grid, you can prioritize your experiments and decide which hypotheses need to be tested immediately based on how they will affect your business in the long term.
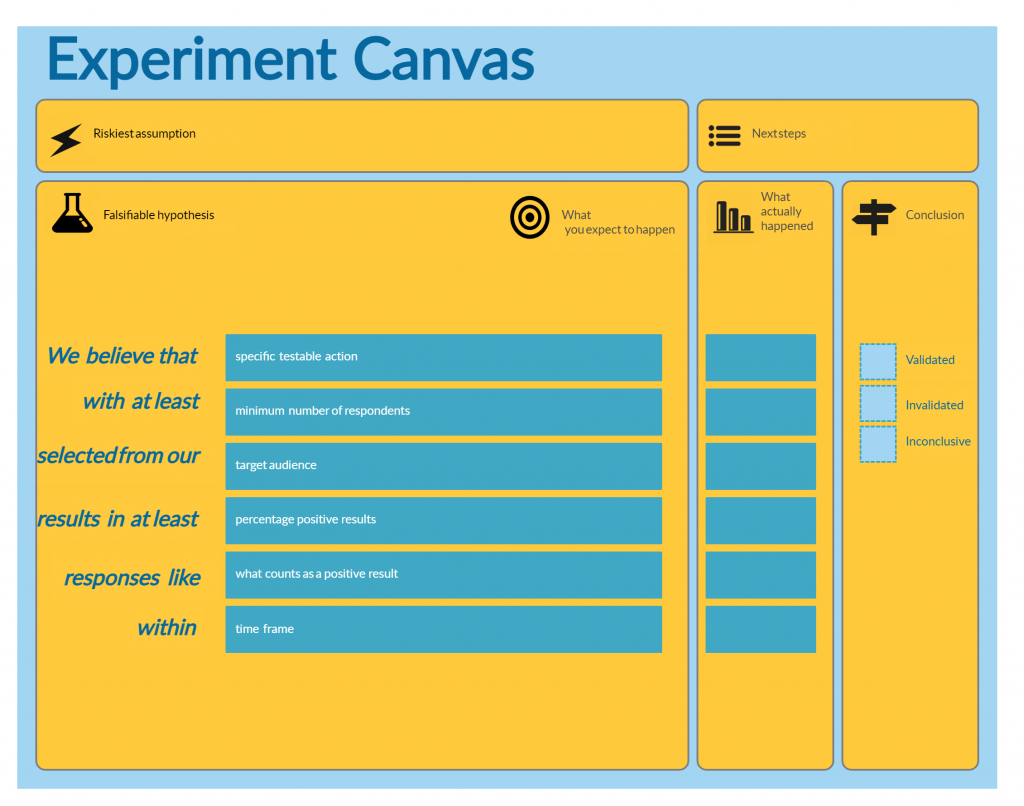
Experiment Canvas
The purpose of the experiment canvas is to be able to design the right experiment at the right time. It provides you with a tool to clearly state a falsifiable hypothesis based on your riskiest assumption. Once you have identified your riskiest assumptions, you need to find a way to test and measure them in a quantifiable way. The experiment canvas lets you break down your assumptions into measurable, observable experiments.
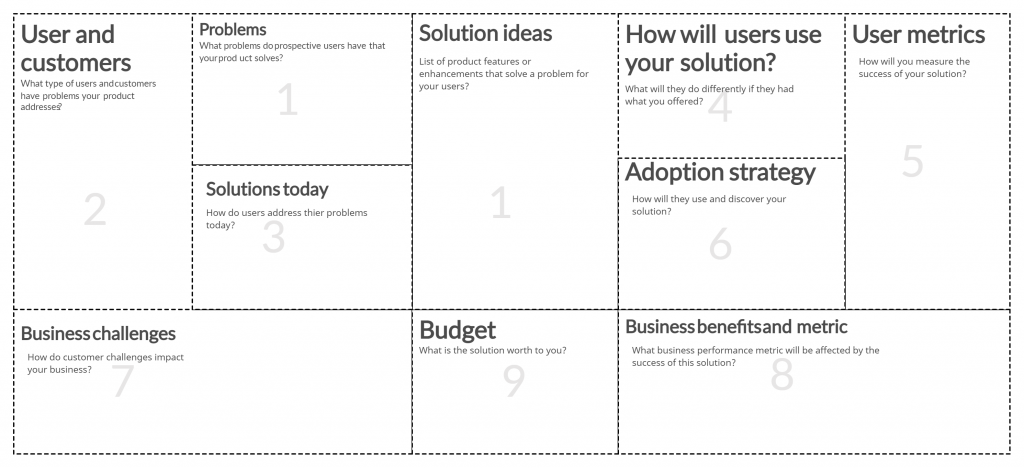
Opportunity Canvas
An opportunity canvas helps you analyze your business in a more holistic manner. It provides context and is especially useful when planning the release of new features or product improvements. It helps you frame your problems or ideas better and provides a framework to decide which ideas you should move on to the experimental stage. Often, there are many new ideas we think we should implement, without fully understanding the impact it will have on the business or how users may respond to it. The opportunity canvas walks you through how customers will use your solution, potential setbacks, strategies, challenges, and metrics. It provides a good basis to determine which experiments are worth taking forward.
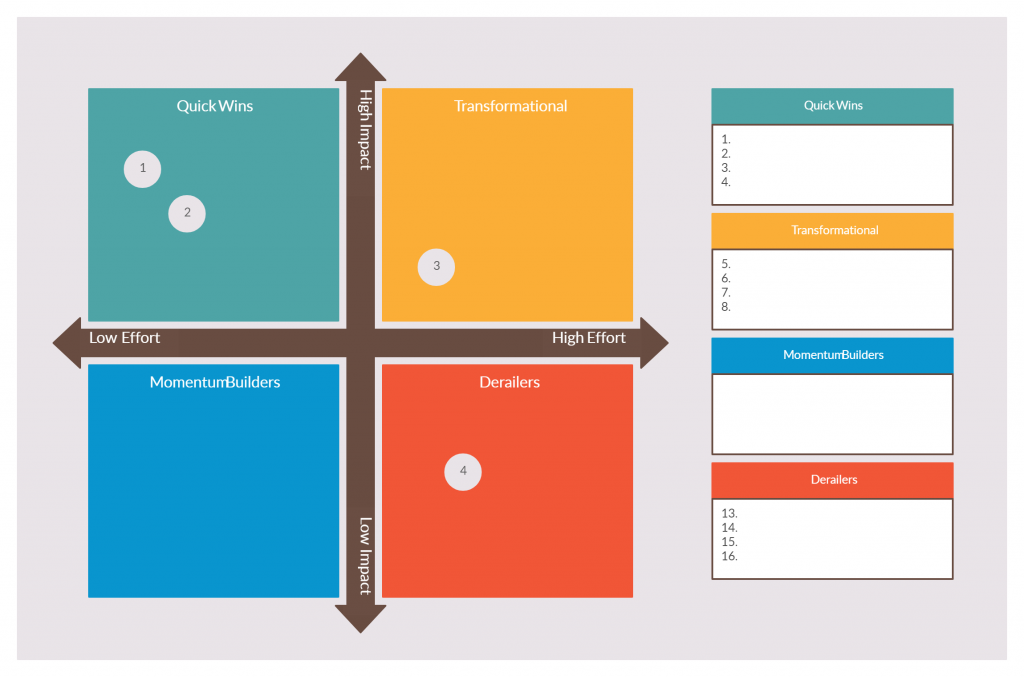
Impact Effort Matrix
Time and resources are always limited, so prioritizing what improvements should be made to your product is always a challenge. The impact effort matrix helps you categorize ideas into 4 categories, quick wins-that require minimal effort and provide high returns don’t necessarily need to be tested as they don’t have a high resource requirement. You should test high effort activities in smaller samples before they are implemented. With this matrix, ideas that require a disproportionate amount of effort to execute, with minimal results should be disregarded. The impact effort matrix allows you to visualize all your potential experiments and decide the order in which they should be executed. You can also decide how much time and energy should be spent on each.
Establishing a Culture of Experimentation
The value of conducting experiments extends far beyond the results or learnings you gain after conducting them. Building a culture of experimentation in an organization breeds innovation; one where questions are constantly being asked and improvements are continually sought out. Setting up an environment where theories can be tested immediately and changes made accordingly, results in a more participatory culture where people can freely exchange ideas.