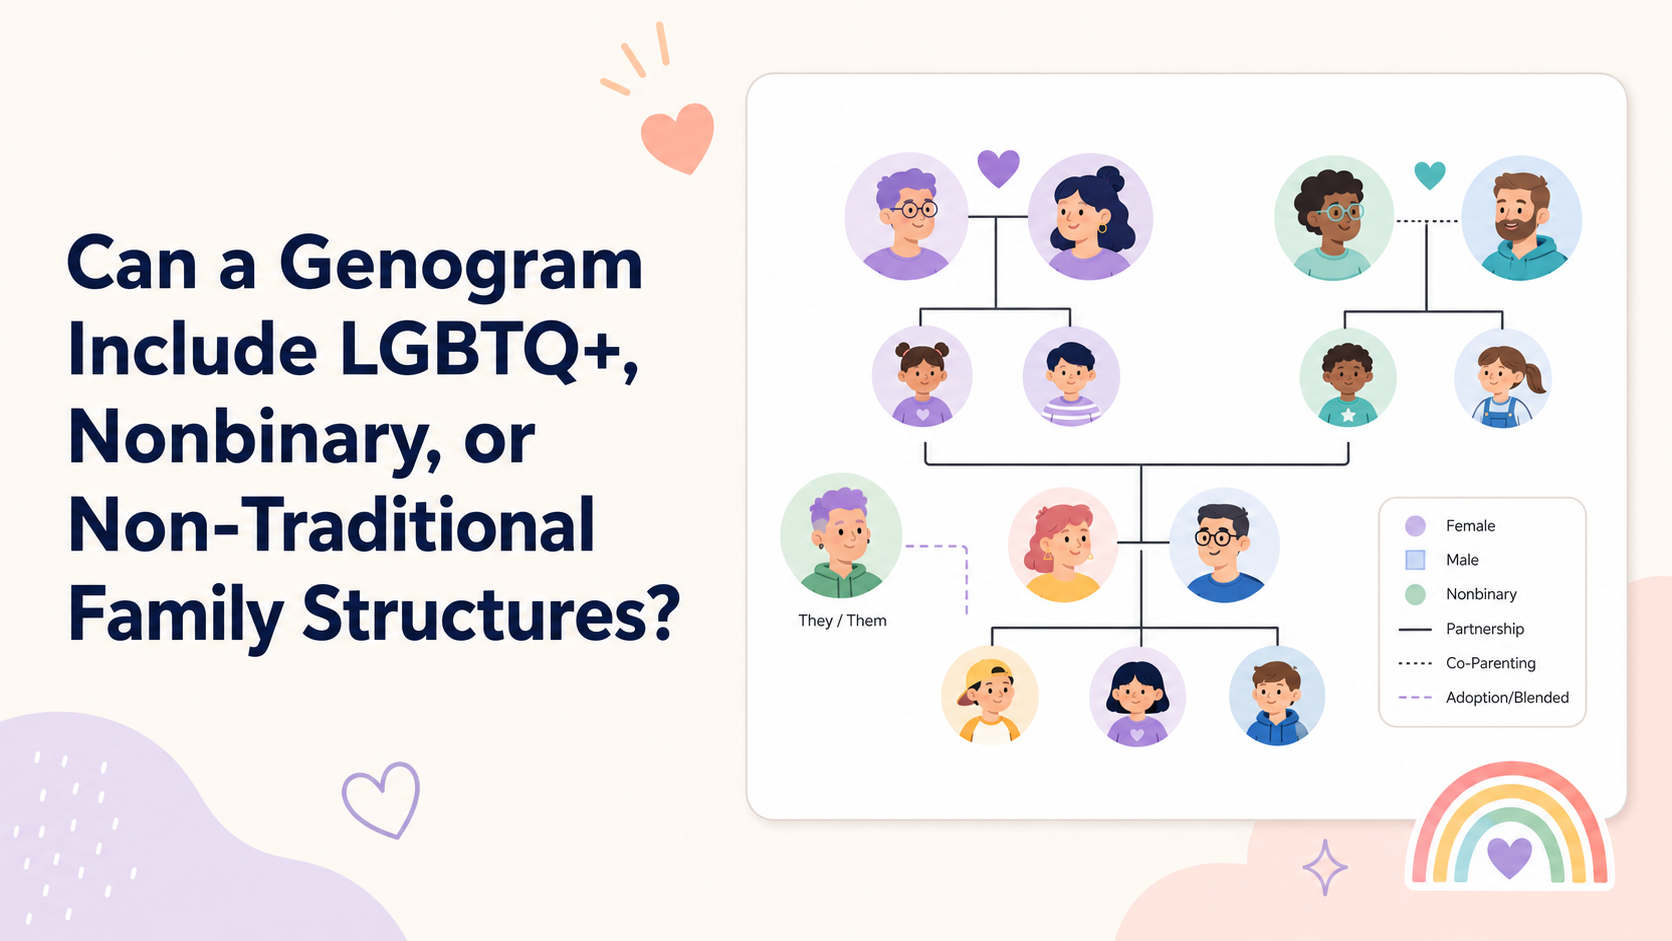
How to Create a Modern, Flexible Wiki for Your Company

As a company grows, it accumulates a wealth of knowledge, from what your company vision is to best practices to follow, that helps direct and form its path for growth. And preserving such knowledge is nothing but critical to its progress. 

However, without a proper system to capture them, these valuable stores of information may get scattered across the organization or lost. This is where you can use a company wiki. It helps collect all the information into a centralized repository, thus providing an easily accessible resource for everyone. In this post, we will discuss how to build a company wiki step by step. 

What Is a Company Wiki 

A company Wiki (also known as an internal Wiki or corporate Wiki) is an online database used to centralize information about the company and its processes, employees, projects, clients, etc. Companies often consider it as a single source of truth for capturing, organizing, and sharing company knowledge internally. A company wiki allows every team member to access, create or edit content.

A wiki can include information such as, 

  • Important company processes
  • Company culture, values, and policies
  • Company roadmap
  • HR and administrative documents 
  • Project documentation
Company Employee Handbook Template - How to build a company wiki
Company Employee Handbook Template (Click on the template to edit it online)

Benefits of an Internal Wiki

Wikis make everyone’s job easier. For new employees, it’s the quickest way to find all the information they might need. And more established employees can refer to it to understand how the rest of the company operates better, and further improve how they work.

  • Internal wikis provide a centralized point for all internal documents, be it employee training material, SOPs, whitepapers, emails, or webinar content, making it easier to find information.
  • They help avoid knowledge loss and streamline storing, retrieving, and sharing knowledge.
  • They enhance team collaboration by providing a common space for teams to work together on mapping out company processes and information. 

Knowledge Base vs. Wiki 

A company wiki is not the same as an internal knowledge base. Knowledge bases are authoritative resources with a dedicated team of content producers and managers.

On the other hand, wikis are a collaborative tool. Not only can any employee access, create, or edit the company wiki at any time, but teams can also collaborate on content population. And the changes are typically designed to be instantly displayed after an edit.

How to Build a Company Wiki 

Your company wiki is a place for capturing, organizing, and managing organizational knowledge. It’s important that you have a streamlined process in place to ensure that you structure company-wide information productively. Here we have listed down the steps on how to build a company wiki effectively. 

Decide the Reason for Creating a Wiki 

Whether it’s to document company processes and procedures, onboard new employees or create a team playbook, have the goal of your wiki defined prior to actually building it. This will help,

  • Identify the type of information that you need to include
  • Define the target audience you need to consider (i.e. new employees or existing employees or both) 
  • Accumulate the existing documents, resources, reports, and material that you may need to integrate into the new wiki. 
  • Identify the key contributors such as senior managers or team leads with specialized knowledge of the subject matter.

Choose a Wiki software

The next important step is to find the software that suits your needs. Since you have already narrowed down your goal, you now have a specific idea about the capabilities you are looking for in the software. 

Here are a few important capabilities every wiki software should possess; 

  • Unified workspaces to centralize your documents 
  • Features to easily edit and search content
  • Real-time multi-user collaboration features such as in-line commenting, discussion threads, @mention tagging, live mouse tracking, smart notifications, offline sync, etc. 
  • A rich text editor with the ability to create or add visual content such as diagrams, charts, images, etc.
  • Folders to organize documents within
  • Integrations to other tools in your workflow such as Slack, GitHub, MS teams, Google Suite apps, etc. 
  • Ability to facilitate communication (meeting minutes/ weekly updates), learning (onboarding instructions/ handbooks), and project management (project plans/ progress reports) 
  • Document download options including PDF, SVG, and PNG exports

A few popular company wiki software that you can consider include Google Drive, Confluence, and Microsoft SharePoint.

Creately to Build Your Company Wiki

Creately, a work management software that runs on a smart visual canvas, used by teams to brainstorm, plan, manage projects, and capture knowledge, also serves as a modern wiki software solution. 

It offers all these features mentioned above and more, including workspace version history, customizable tables, built-in agile project management tools such as Kanban boards to create workflows, ready-made templates for Wiki structures, project documents, and 100+ use cases spanning across industries. Moreover, Creately also offers integrations for Google Drive and Confluence as well.  

Create an Initial Wiki structure 

Create a basic structure depicting the document or information hierarchy of the wiki. This will provide you with a bird’s eye view of or a preview of what the wiki will look like, and you can keep it as a reference during content curation and creation. 


Wiki Page Structure

Wiki Page Structure (Click on the template to edit it online)

Populate it with Content

With the basic structure at hand, start writing content for each section or title. This is where you need to bring in content from other platforms to centralize everything in one place. 

In Creatley, you can add them as link resources, copy and paste content from other sources directly on Creately shapes, or even migrate them directly from third-party apps including data in CVS files, GitHub issues, Spreadsheets, and Google Sheets.  

A few of the best practices you can follow to create engaging content are as follows;

  • Insert visuals such as images, diagrams, charts, videos, etc. as much as possible to break blocks of text. For example, you can use a process map to depict process steps. 
  • Add internal links to make navigation easier and make information easier to find. 
  • Include bulleted or numbered lists, checklist items, shorter paragraphs, etc. to make content more scannable. 

Keep Your Wiki Updated

Company information or processes won’t remain the same. As they evolve, so should your wiki. 

As employees rely on your company wiki to obtain timely information, it’s important to regularly consult with the key contributors and make necessary changes to reflect the current state of things. 

You can also identify areas for improvement by monitoring your team. Observe whether they are finding the information helpful, or if they are confused and keep asking questions which you can then answer better by updating the content. 

In Creately, the full version history is automatically tracked for all workspaces. So every change you make to your wiki is recorded separately. You can name versions in history to keep track of key points in the evolution of the wiki and branch out from an earlier version if needed at any time.

Best Practices to Build a Company Wiki Effectively on Creately

A wiki for your company knowledge might sound like a good place to facilitate collaboration between your team members, however, it comes with disadvantages that cannot be disregarded including limited search functions, inconsistent content, edit permissions, etc. 

Following we have listed down some best practices that you can follow to overcome these challenges when you build a company wiki on Creately. 

Make Your Company Wiki More Flexible 

One of the biggest complaints a wiki has is its inflexibility. With multiple documents across pages and folders, it can become quite difficult to effectively organize content in a wiki. However, with a proper hierarchical workspace or folder structure, you can easily overcome this. 

In Creately, what you usually store in multiple pages and folders in a traditional wiki software can be placed within a single workplace using simple visual structures that logically make sense. 

For example, you can create an org chart for employee information or a process map to contain process documentation. Each shape can hold a magnitude of information varying from pages of content, attachments, links, images, data fields for role assignment, tasks, estimates, and more that can be added via Shape Data. This way you can easily centralize information contained in multiple pages in a single visual structure. Plus, with Creately’s infinite canvas, you can also place any number of these visual structures in the same place. 

You can also connect shapes across workspaces and folders with shape links and create navigational flows and link information. Click on the linked shape to automatically zoom in on the connected shape in the same workspace or open the workspace the connected shape is in. 

Ensure a Proper Navigation Structure 

A  major downside of maintaining a company wiki is that it can be a hassle to locate information from among the multiple documents that you continuously add to it. However, with a proper navigation menu or search capabilities, this can be eliminated. 

Creately’s smart search capability will fetch you any information you are looking for in a workspace or folder in seconds; simply do a Cntr+F (or “Command+F” on a Mac) search for the keyword to find the information you are looking for instantly. Once you select it from the search results, it will take you to the exact spot it is contained in on the workspace. 

Or you can create a navigation menu with the help of the Navigation panel where you can list down links to the items on the workspace and use it to find the information easily. 

Keep Content Consistent 

With multiple team members from different departments contributing to wiki documents, there can be inconsistencies, which may also result in knowledge gaps. 

To prevent this from happening, ensure that there are templates or a standard format that anyone can refer to when they write content. 

Limit the Number of Editors 

Wikis allow the contribution of multiple authors. However, it might not always be ideal for a company wiki, especially since employees rely on it to gather reliable information about organizational processes and knowledge. 

Thus, it will serve you well to authorize only a limited number of editors – especially subject experts – to write, edit and publish content to your Wiki. 

With Creately you can define roles for writing and accessibility. It provides different access levels and roles to streamline how you manage sharing and permissions. While you can assign some team members as owners and editors to a workspace, you can add the rest of the employees whom you only wish to share the information with as commenters or viewers. 

This way you can also control who you share information with and separate private and public information. 

A New Way to Wiki 

A wiki, although containing layers and layers of documents, doesn’t have to be too complicated to create or manage. With the right software providing the right tools, you needn’t fret as much.

Try Creately to build your company wiki today. Simplify the process with smart visual tools and advanced real-time collaboration. 

Got more tips on how to build a company wiki? Do share your thoughts and suggestions with us in the comments section below. 

The Complete Guide to Business Impact Analysis with Templates

The business impact analysis is one of the most important components of the business continuity management planning process. During the analysis, you identify how potential disruptions would impact your key business functions and the overall performance of your organization.

In this post, we will cover everything you need to know about business impact analysis along with useful templates that you can use to get a head start on the planning process. 

What is a Business Impact Analysis

As the name implies, the BIA process identifies the exposure and impact of specific threats or disruptions to your business functions and to your organization.

Consequences of such a disruption can include financial loss, reputational loss, and loss of competitive position in addition to potential loss of staff, loss of data, and even loss of access to buildings. 

The business impact analysis consists of evaluating the critical business functions of the organization, analyzing the potential disruptive impact on them, and gathering information needed to develop recovery strategies via which the resources required to recover and resume them in the case of a disaster will be determined.

A business impact analysis usually consists of the following steps that are to be led by the BCP (Business Continuity Plan) manager;

  • Establishing business impact criteria using the BIA questionnaire  
  • Prioritizing the importance of each business unit against the established criteria 
  • Consolidating the findings and rankings 
  • Presenting the final results to the executive management to confirm critical classifications and priority listings 

Elements of a Business Impact Analysis

A successful BIA should produce the following deliverables.

  • Detailed report of information on,
    • Prioritized critical business functions 
    • Classification of criticality 
    • Tolerable limits 
    • Restoration priority 
  • Impact analysis (both quantitative and qualitative) of unavailable business functions and the problems and damages caused by their unavailability. 
  • Minimum resources that are needed to recover the prioritized critical business functions.

When to Conduct a BIA

The BIA can be used when you need to, 

  • Evaluate the impact of disruption on a business function or process within the organization. 
  • Determine and understand the extent to which key functional and operational dependencies exist within the organization.
  • Establish the priorities and the sequence in which the disrupted key business functions and IT systems should be restored.

The Importance and Benefits of a Business Impact Analysis 

A BIA is a self-evaluation process that can lead to the following advantages. 

  • Provides necessary information for both decision-making and for incorporation into the business continuity plan.  
  • Helps identify the key business processes that are critical to the survival of the organization, and directs effort and resources toward what matters. 
  • Assesses the effects of disruption to key business operations or processes within the organization. 
  • Helps the entire organization get involved in business continuity planning, while allowing each head of a business unit to evaluate operations and assign a value to downtime. 
  • Identifies the equipment and resources needed to run critical business functions and ensures their availability. 
  • Assesses the impact it would have on revenue, investor support, customer service, competitive advantage, and market share in case a critical business function cannot be performed. 
  • Helps identify the vital resources that are needed to maintain normal key operating conditions in a cost-effective manner. 

BIA vs Risk Assessment

Whereas the risk assessment seeks to identify the threats that will affect the business and minimize the likelihood of disasters happening, the business impact analysis seeks to establish the optimum balance between recovery timescale and cost, which helps to justify the expenses on risk countermeasures and on recovery capability. 

Although risk assessment and business impact analysis are treated as separate activities, for all practical purposes they are both parts of the overall risk management techniques of an organization. 

Risk Assessment Template
Risk Assessment Template (Click on the template to edit it online)

BIA vs. Disaster Recovery Planning

The BIA is one of the vital steps in disaster recovery planning. The BIA is used to evaluate and gather information about the precise effects of the disaster on the organization. The BIA, which identifies critical business functions and the impact of disruption on them, provides the necessary insight to define disaster recovery strategies in response to disasters.

Disaster recovery plan template
Disaster Recovery Plan Template (Click on the template to edit it online)

BIA vs. Business Continuity Planning

Business Impact Analysis and risk analysis are areas of business continuity management. While the business continuity plans are based on information, the risk analysis and BIA provide that information and lay the foundation for all related plans. 

Business Continuity Plan
Business Continuity Plan (Click on the template to edit it online)

How to Conduct a BIA

Here we have listed down the steps you need to follow to conduct an effective BIA. 

Plan your BIA process

A business impact analysis is a project in itself. And like any regular project, it needs planning. With a proper plan establishing the scope of the analysis, goals and objectives, project team, timeline, budget, and the stakeholders involved, you will be able to see it through to the end without unexpected hurdles.  

Project-Plan-Template for a business impact analysis
Project Plan Template (Click on the template to edit it online)

Gather information

In order to conduct an effective BIA, you should have a first-hand idea of and information on, 

  • How the key business processes work
  • Inputs and outputs of the process
  • Resources and tools required
  • Duration of the process
  • End-users of the process
  • Potential disruptions to the process
  • Financial, operational, and legal impacts of such threats

You can gather this information by,

  • Talking to or interviewing process owners and stakeholders 
  • Creating and sharing a business impact analysis questionnaire to gather information on business functions, support systems, and IT systems

Verify and Analyze Information 

Validate and verify the accuracy of the information gathered through the questionnaires with business process owners and business unit coordinators. 

As you analyze information, identify the business functions that are vital to keeping your business moving forward. List down these processes along with the necessary resources such as employees, raw materials, equipment, etc. that are needed to keep them operating and establish a timeline and budget for their recovery. 

This way when one of the processes gets disrupted, you will know which one to reinstate first and easily determine which resources are absolutely essential.  

Document and Present Findings

During this phase of the analysis, you need to prepare the executive summary and the BIA report. The objective of the business impact analysis report is to provide the necessary insight the senior management needs to develop data-backed recovery strategies. 

While the report should include recovery priorities supported by data graphs, charts, and other visual aids, present the findings, recommendations, and subsequent steps to the senior management in both written and oral reports. 

The BIA must be re-visited and updated as the business changes due to organizational and technological changes. 

BIA Templates

Blank Business Impact Analysis

Blank Business Impact Analysis
Blank Business Impact Analysis (Click on the template to edit it online)

Business Impact Analysis Report Template

Business Impact Analysis Report Template
Business Impact Analysis Report Template (Click on the template to edit it online)

How Can Creately Help When Conducting a BIA

Visual tools to communicate and collaborate better

You can create anything from simple flowcharts to complex work breakdown structures with Crately’s standard shape libraries for over 50 types of diagrams. Whether you are simply mapping a process, creating visual aids for your BIA report, or putting together a dashboard for a presentation, you can easily do it on Creately.  

Centralize all your information

Bring in all information about your business processes, stakeholders, and teams onto the canvas with integrated notes and database capabilities. Creately has full-on documents for every single shape on the workspace, letting you store a multitude of information whether it’s a step in a process map or a cell in a stakeholder registry. Create a single source of truth for your teams during your BIA project.  

Coordinate all your work in a single place  

Creately’s built-in agile project management tools, including project views (i.e Kanban boards, timelines, Gantt charts, etc.), role assignment, progress tracking, and integrations, allows teams to streamline running their projects right inside the app. 

Real-time collaboration    

Keep your team engaged and collaborate like you are in the same room despite where you are. Real-time mouse tracking, synced previews, comments and discussion threads, advanced sharing and permissions, and version history to keep track of changes.  

Got More Tips on Doing a Business Impact Analysis?

Conducting a business impact analysis can be time-consuming and require considerable effort, but the outcome can be instructive and valuable. At the end of it, you will have gained valuable insight into your organization and its functions that is necessary to move it forward. 

We hope this guide will help you conduct a successful BIA. 

Got any more tips to share? Let us know in the comments section below. 

Key Project Documents Every Project Manager Needs
Key Project Documents Project Documentation

Proper process documentation template is an integral part of project management. Documenting essential project processes and information help set up a project in an efficient and easy-to-understand manner, and ultimately ensure its success.

In this post, we will look at why project documentation is important and go over the essential and other useful project documents that are created throughout the life cycle of a project. All templates provided are customizable; click on them to start editing.  Use the menu below to navigate easily.

Project Initiation 

Project Planning

Project Execution & Closure

What Is Project Documentation?

Project documentation entails creating and maintaining project management documents throughout the different phases of the project life cycle. These project documents allow the project manager to adequately manage, control and deliver the project. 

Importance of Project Documentation

Documenting important details of the project thus helps you and the team verify that the ideas being implemented actually make sense. Project documentation simplifies clarifying project expectations and goals, breaking down the deliverables into manageable tasks, managing resources, and keeping all stakeholders on the same page.  

In addition, it also helps with,  

  • Retaining knowledge collected over the course of past projects, which allows to streamline onboarding new employees or new project team members.
  • Increasing clarity and transparency of the team workflows allowing for better cross-functional team alignment.

Top 10 Essential Project Documents 

Following are the essential project management documents that should be created during each phase of the project lifecycle. 

Project Plan 

The project management plan – or project plan – is a comprehensive document that outlines how the project is executed, monitored, and controlled. It may include baselines, subsidiary management plans, and other planning documents. It highlights vital project information such as deadlines, assignments, and key milestones and is usually represented in the form of a Gantt chart

Project-Plan-Template Project Documentation
Project Plan Template (Click on the template to edit it online)

Project Charter 

The project charter is a short document that explains what a project entails. It describes what the project goals are, who is involved and their responsibilities, and the stakeholders, and defines the authority of the project manager.  It is created in line with the business case for the project as described by the project sponsor.

IT-Project-Charter Project Documentation
IT Project Charter (Click on the template to edit it online)

Business Requirements Document

The business requirement document explains the business solution for a project based on business or customer needs and requirements. It describes the purpose of the project, the business solution it provides, features and functionalities, as well as the project timeline. It synthesizes input from stakeholders and analysis of the current business situation to provide a technology-neutral description of what the product should do.

Business-Requirements-Document
Business Requirements Document (Click on the template to edit it online)

Project Budget

The project budget is the total estimated cost of  a project. It includes a detailed estimate of all costs, such as labor costs, material procurement costs and operating costs, that are likely to be incurred during the completion of project tasks over each phase of a project. It helps with establishing expenditure expectations and with getting project approval from stakeholders, ensuring funds are ready at the right time, and measuring performance.

Cost-Breakdown-Structure
Cost Breakdown Structure (Click on the template to edit it online)

Project Schedule

A project schedule is your project’s timeline, it consists of all the sequenced tasks, activities, and milestones that need to be completed in a certain timeframe. Creating a project schedule is a way of communicating all the tasks that are needed to be performed, while clarifying what resources are needed, and under what time frame.

Project-Schedule Project documentation
Project Schedule (Click on the template to edit it online)

Risk Register

The risk register, which is also referred to as a risk log, is a document that contains information about identified risks such as the nature of the risk, the level of risk, who is responsible for it, and the preventative measures, and corrective action in place. It serves as a brainstorming framework to establish risks and as a database of possible and potential risks and mitigation measures for them.

Risk-Register-Template
Risk Register Template (Click on the template to edit it online)

Project Scope Statement

A project scope statement describes the work that needs to be done to deliver the project outputs on time and within the budget. The project scope statement template outlines what is being delivered (within scope), what is not being delivered (out of scope), assumptions to clarify the deliverables, and high-level requirements. 

Project Scope Statement Project Documentation
Project Scope Statement (Click on the template to edit it online)

Project Communications Plan

A project communication plan is a guideline of what, when, and how key project information will be shared at key intervals with invested stakeholders. It includes what kind of information will be distributed, to whom, and how often they will be updated.

Project Status Report

The project status report is a document that outlines the project’s overall progress against the projected project plan. It helps keep all project stakeholders informed about the high-level information such as milestones, work accomplished, risks, and roadblocks.

Project-Status-Report
Project Status Report (Click on the template to edit it online)

Project Closure 

The project closure report is a  document that formalizes the closure of the project. While it helps determine whether or not a project was successful, it provides confirmation that the criteria for customer acceptance have been met and requests sign-off from the Project Sponsor to close the project.

Project-Closure-Template
Project Closure Template (Click on the template to edit it online)

Other Useful Project Management Documents 

While the documents we’ve listed above are essential to ensure project success, there are multiple other project documents that will further contribute to accelerating its successful completion.

Statement of Work 

A statement of work is a document that describes the requirements of a project. It serves as an agreement between a client and an agency or service provider and defines the entire scope of work involved for a vendor, project deliverables, costs, and timeline.

Statement-of-Work-Template
Statement of Work Template (Click on the template to edit it online)

Project Proposal 

The project proposal is a document that lists down all aspects of a project including its background, vision, goals, tasks, requirements, owners, associated risks, etc. Its purpose is to provide a summary of the project details and rally support for the project idea from stakeholders.

Project-Proposal- Template (Project Documentation)
Project Proposal Template (Click on the template to edit it online)

Team Charter 

A team charter basically explains how a team plans to get its work done. It focuses on why the team exists, the objectives the team is designed to accomplish, and how it is going to achieve them. The purpose of the team charter is to get everyone on the same page and keep them focused.

Team-Charter-Template
Team Charter Template (Click on the template to edit it online)

Work Breakdown Structure

The work breakdown structure is a diagram that helps break down large projects into smaller and more manageable parts which contain the project deliverables that it will complete. It divides project deliverables into sub-deliverables and work packages which define the work, duration, and costs for the tasks that need to be carried out.

Work-Breakdown-Structure
Work Breakdown Structure (Click on the template to edit it online)

Stakeholder Register 

The stakeholder register is a document that details information about the stakeholders of a project. This contains their names, contact details, the role they play in the project, their power over making project decisions, and their needs, concerns, and expectations. It serves as the basis for team formation, assigning roles and responsibilities, defining success criteria, and planning stakeholder communication.

Stakeholder-Register
Stakeholder Register (Click on the template to edit it online)

Project Organizational Chart 

A project organizational chart is a visual representation of the team members and the roles they play in a given project. It illustrates the hierarchy and the reporting relationships between the team members. They help with allocating resources, clarifying responsibilities, and setting expectations regarding the effort required from each individual.

Project Organizational Chart
Project Organizational Chart (Click on the template to edit it online)

Lessons Learned

A lesson learned report can be used to document all the key challenges, risks, uncertainties, and blockers you have come across during a project along with the timely solutions you have implemented. Lesson learned reports are designed to guide you as you work toward achieving the desired outcomes, so it helps you and others who will work on a similar project in the future to avoid the hardships and easily achieve the expected outcome.

Lessons Learned Report
Lessons Learned Report (Click on the template to edit it online)

How Creately Can Help Streamline Project Documentation 

Creately – a work management software that runs on a visual canvas – can help you streamline creating, organizing, managing, and sharing the project management documents that are important to the success of your project. 

Creately is a simple tool with simple yet advanced features that even a non-technical user can easily learn. It has intuitive navigation with drag and drop functionality which makes organizing content effortless. Plus it integrates with tools you use every day such as Google Suite apps, Confluence, Jira, Slack, MS Teams, etc. making it easy to keep your project assets in sync. 

Easy-to-Use Visual Tools to Get Started

Creately offers multiple shape libraries, pre-made templates, and powerful diagramming capabilities to visualize and organize your project-related data in easy-to-understand visual structures such as Timelines, Kanban boards, WBS diagrams, Flowcharts, etc. 

With the database capabilities which can be accessed via the Shape Data panel, you can store unlimited data and information within a single shape in a structure and easily create wikis and project knowledge bases. For example, you can expand your Work Breakdown Structure that outlines project deliverables with additional data fields to capture information on due dates, owners, cost, etc., or provide a detailed overview for each deliverable with notes.    

A Single Source of Truth 

Creately’s unified workspaces operate on an infinite canvas, letting you place multiple documents side by side in a single location. While you can attach and embed resources, documents, images, and links with in-app previews, you can also import external data in Google Sheets, Excel, or CSV files into Creately and organize them as meaningful visuals, keeping all project-related assets centralized in the same workspace.  

Note: Easily search and locate any information across workspaces and folders with universal text search option. 

Advanced Collaboration and Sharing Capabilities

Creately offers a collaborative and secure online platform to simplify creating, updating, and sharing your project documents with stakeholders. Collaboration features such as true multi-user collaboration with concurrent editing, real-time cursor tracking, offline syncing, contextual comments and discussion threads, and in-app audio and video calls help streamline cross-functional project team workflows, whether the teams are co-located, remote, or hybrid. 

Creately folders and workspaces come with multiple access and role levels (Owner, Editor, Commentor, and Viewer) allowing you to manage how you share your project documents with internal and external stakeholders. 

Note: Set workspace status through workspace preferences and mark it Draft, In Progress, In Review, Approved, Final or Archived to indicate its review status. 

Streamline Project Documentation With Creately

Documenting all aspects of a project will help the success of your project in many ways. Whether it’s to clarify the terms of an agreement to clients or suppliers, to fulfill legal requirements, to keep your team aligned, or to keep track of project updates, maintaining proper project documentation for key processes and information is the key.

Project documentation may seem tedious, but with the right tool and techniques, you can not only simplify the process of documentation but also ensure that the final output is effective. Try Creately today to simplify and improve your project documentation process. 

UML Diagram Objects and Their Usage
Unified modelling language diagram objects

Here is an overview of all the nine different kinds of Modeling diagram objects that are wrapped under the heading of the UML.

  • UML Class Diagrams
  • UML Use Case Diagrams
  • UML Object Diagrams
  • UML Sequence Diagrams
  • UML Collaboration Diagrams
  • UML Statechart Diagrams
  • UML Activity Diagrams
  • UML Component Diagrams
  • UML Deployment Diagrams

All these UML diagram objects are available in Creately and you can try out a demo or take a look at some sample UML Diagrams for more context.

System

A system in a UML Use Case Diagram is a rectangle spanning all the use cases in the system that defines the scope of your system. Anything within the box represents functionality that is in scope and anything outside is not. Note that the actors in the system are outside the system.

system example uml diagram objects

Simple Object

object diagram - uml diagram objects

The simple object from the UML Object Diagram is a rectangle that displays the object name. This object’s name is usually underlined.

Object

The object element from the UML Object Diagram is a rectangle divided into two parts. The top part contains the name of the object, while the second part contains the attributes of the object. Note: This element should not be mistaken with the Class element which is divided into three parts.

Object shape - uml diagram objects

Activation

Activation elements in the UML Sequence Diagram are boxes on the lifelines. These are also called the method-invocation boxes, and indicate that an object is responding to a message. It starts when the message is received and ends when the object is done handling the message.

activation example - uml diagram objects

Message Arrow

Message arrow - uml diagram objects

Message Arrow in the UML Collaboration Diagram shows the interaction between the commencing object and the destination object.

Initial State

The Initial State from the UML Statechart Diagram is the state of an object before any transitions. For objects, this could be the state when instantiated. The Initial State from the UML Activity Diagram marks the entry point and the initial Activity State. The notation for the Initial State is a small solid-filled circle. There can only be one Initial State on a diagram.

End State

End state from the UML Statechart Diagram marks the destruction of the object whose state we are modeling. The Activity End in a UML Activity Diagram shows the termination of the activity. The End notation is shown as a circle surrounding a small solid-filled circle.

Activity

Activity state in a UML Statechart Diagram and UML Activity Diagram marks an action by an object. The notation for this is a rounded rectangle.

activity example uml diagram objects

Junction

Junction - uml diagram objects

Junction state in a UML Statechart Diagram are vertices that are used to chain together multiple transitions. They are used to construct compound transition paths between states. A junction is represented by a small black circle.

Choice

Choice state in a UML Statechart Diagram evaluates the guards of the triggers of its outgoing transitions to select only one outgoing transition. The decision on which path to take maybe a function of the results of prior actions performed in the same run-to-completion step. A choice pseudostate is shown as a diamond-shaped symbol.

Fork / Join

Fork shape - uml diagram objects

A Fork notation in a UML Activity Diagram is a control node that splits a flow into multiple concurrent flows. This will have one incoming edge and multiple outgoing edges. A join node is a control node that synchronizes multiple flows. This will have multiple incoming edges and one outgoing edge.

Fork vertices in the UML Statechart Diagram serve to split an incoming transition into two or more transitions terminating on orthogonal target vertices. The segments outgoing from a fork vertex must not have guards or triggers. Join vertices serve to merge several transitions emanating from source vertices in different orthogonal regions. The transitions entering a join vertex cannot have guards or triggers.

You can easily create them online using our activity diagram tool.

Composite State

A composite state in a UML Statechart Diagram is a state that has substates (nested states).

Object

The Object notation in a UML Activity Diagram is an activity node that is used to define the object flow in an activity.

Flow End

flow end shape - uml diagram objects

The Flow End node in UML Activity Diagrams is a control final node that terminates a flow. It destroys all tokens that arrive at it but has no effect on other flows in the activity. This is a small circle with an X inside.

Signal Receipt

Signal Receipt notation also called the Accept event action in a UML Activity Diagram is an action that waits for a specific event to occur. This is drawn as a concave pentagon.

signal receipt uml diagram objects

Signal Sending

Signal Sending in UML Activity Diagram is an action that creates a signal instance from its inputs and transmits it to the target object, where it may cause the firing of a state machine transition or the execution of an activity.

signal sending example uml diagram objects

Activity Partition

activity partition uml diagram objects

Activity Partition in a UML Activity Diagram is either horizontal/vertical swimlane. The partitions are used to separate actions within an activity diagram.

Component

component shape uml diagram objects

A Component UML Component Diagram represents a modular part of a system. A Component element in a UML Deployment Diagram represents a distributable piece of implementation of a system.

Provided Interface

A Provided Interface of a component in a UML Component Diagram describes the services that the component offers to its environment. This is modeled using the lollipop notation.

Required Interface

A Required Interface of a component in a UML Component Diagram declares the services that the component expects from its environment. This is modeled using the socket notation.

required interface uml diagram objects

Provided Interface & Required Interface with Port

A Provided Interface with Port in a UML Component Diagram specifies a distinct interaction point between the component and its environment. Ports are depicted as small squares on the sides of components.

interface port - uml diagram objects

Node

A Node element in a UML Deployment Diagram is anything that performs work in the system. This can be either hardware like personal computers; or software like the operating system, database server, and so forth.

Device

A Device element in a UML Deployment Diagram is a type of node that represents a physical computational resource in a system, such as an application server.

device example - uml diagram objects

Deployment Specification

A Deployment Specification element in a UML Deployment Diagram is a configuration file, such as an XML document or a text file that defines how an artifact is deployed on a node.

deployment specification example uml diagram objects
Introducing Creately – The New Interface for Work

Work today is done on multiple disconnected tools that can only execute bits and pieces of a project, leaving teams to go back and forth to retrieve data for decision-making to move work forward. 

When each team works with its own tools and siloed processes, achieving company-wide alignment is not easy. True cross-team coordination requires a more end-to-end solution.

Enters Creately

For over a decade, Creately has been a leader in the industry as a diagramming and visual collaboration platform, successfully reshaping how teams think and work together. 

And, today we are excited to announce the launch of a whole new Creately, aimed at addressing the multitude of challenges created by distributed teams, siloed processes, disjointed tools, and scattered information. 

The Easier Way to Work Smarter

Creately can now connect and centralize items from multiple apps, docs, and people in a single space. So you can brainstorm an idea using the brainstorming software, map out a process with process mapping software and then go on to add the in-depth details of that process and build the system to execute the process right inside Creately.

Everything is visual so it’s easier to understand, and being on a canvas, you can move, arrange, group, and structure the information any way you want.

Most importantly, all the visuals are data-linked, meaning that having a copy of the content in a completely different workspace will still be always synced with the central DB. 

With advanced capabilities such as Database relations, Formulas, and smart rules Creately is actually a clever no-code platform that allows you to build and model any solution to your team’s challenges.

A free-form visual canvas

One thing that sets Creately apart from the rest of the work management tools out there is its free-form visual canvas – an infinite space for you to go from ideation to execution and beyond in a single workspace. 

It finally lets you break free from the predefined table-based interface and put all your work, assets, and resources in one place, side by side, and move them around without constraints as you brainstorm, plan, manage projects, and capture knowledge.

Data-connected 

Creately combines the simplicity of a whiteboard with the power of a database, redefining how you manage data, make decisions, and see things together. 

In Creately, data exists as custom properties of items that can take any shape or form given the context – on the canvas as opposed to rows and columns in a spreadsheet. 

For example, an employee shape on an org chart can contain all the data from their roles and responsibilities to performance review notes.our org chart software You can do this by using Any type of data that you bring to the Creately canvas from any source thus can be morphed into any form you want it to be.

Visual tools everyone just ‘gets’

At its core, Creately is still very much visual. 

With its easy drag and drop interface and 10,000+ specialized shapes, Creately can help you create fitting visuals for multiple use cases across industries, whether it’s a Kanban board for agile project management or an Org chart for your HR planning. 

These visuals are meant to be more. As you connect your data to them and extend them by adding custom statuses, notes, and attaching links, you are actually building a database.  

And just like that, that org chart becomes a system for employee data management manage by HR Software, and that Kanban board is now how you manage tasks across teams.

Custom databases 

Not only can you build actual apps inside Creately just by using a few shapes, but you can also visualize your app data sets in multiple contexts or views suitable for different work styles. 

For this purpose, Creately has added a new library of intelligent frames which include a Kanban board, 2×2 grid, timeline, and X-Y chart along with cards to go on them. Whatever is placed on a frame, automatically adapts itself to match the context. 

A sticky note placed on a Kanban board becomes a task card, and a task card on a grid converts itself into a pin. Although context changes, all changes made on the card are reflected across all the places it is used. Now, isn’t that neat?     

Custom workflows 

Creately’s built-in code-free workflow designing capabilities make it easier to optimize any task, project, or process in just a few clicks. 

  • Multiple views to manage your tasks; Kanban board online, timelines, grids, lists, Gantt chart maker, and more.
  • Keep track of all your to-dos, comments, & checklist items assigned to you with My Tasks. 
  • Add sub-tasks and checklists in tasks and organize larger projects into manageable workflows with task properties.
  • Set estimated times and due dates for tasks and allocate resources based on availability and skillsets.
  • Assign tasks to complete items in context. Link tasks to or from other project management tools seamlessly.
  • Use color-coded tags and prioritization grids to keep track of which tasks to prioritize and which to de-emphasize.
  • Tailored templates for your projects and tasks so you can build the workflow and process you need with the tools at your fingertips.

A fresh take on the team Wiki

Creately will become your new single source of truth. Its powerful documentation capabilities combined with its infinite canvas and multi-user collaboration make it the perfect knowledge management tool for teams.

On Creately, your Wikis are structured visually. A single shape on the canvas – whether it is a step in a process or a node in a mind map – can be a doc itself. With Shape Data, you can add notes, files, links, images, and more to each element in a visual, building more context into each step. 

Add anything, from multimedia files to screenshots to doc links with in-app previews onto your Creately canvas, right next to your work, to centralize all information needed to run your projects smoothly.  

Take your whiteboarding to the next level

Creately’s canvas doubles as an interactive whiteboard that offers teams – especially distributed and hybrid ones – a collaborative space to brainstorm and plan visually around their work. 

Paired with intelligent diagramming, it becomes the perfect solution for bridging the gap between ideation and getting work done.

Draw anything using our freehand drawing tool, and use shapes and connectors to turn your ideas directly into actionable projects, upload images, and embed almost anything, including external content to provide more context as you plan your way around.

Integrate & extend your other apps

Creately is built as an all-in-one work management tool to boost productivity and reduce the frustration and inefficiency caused by using multiple apps. 

We get that toggling between multiple apps all day may not be the most productive way to spend it, so we came up with the perfect solution that allows every type of team to customize their workflow and bring all their work in one place. 

Starting with the GitHub two-way integration, Creately has begun to build a hub of integrations that connect the tools you use every day to Creately, so you can bring data from them, visualize them with 2-way sync on the canvas, and add more fields extending that data. 

This will ultimately help you streamline your workflows in one place. You can finally stop wasting an enormous amount of time jumping back and forth between different tools for each and everything that you do – because you can do everything you need to get your work done, on Creately. 

A New Era of Work 

Building a flexible platform that teams love is at the core of everything we do. With the new Creately, you can reduce work about work, align cross-functional teams, save time, and keep work flowing in the right direction.

All of these new capabilities are foundational to what Creately enables you to do. It’s unlike anything available now and for most of you, it will be a completely new way to think about how to organize and manage your work. 

At Creately, our mission is to make the world more productive, and that starts with you! Please check out these new capabilities, and as always, let us know what you think so we can continue to make them even better.

How to Set up a Pipeline for Better Project Portfolio Management

Selecting the right projects from the beginning is an important step in effective project portfolio management, and a project pipeline helps project managers do this easily by helping them ensure the success of each individual project from the planning stage itself.  

A project pipeline includes a series of projects that need to be planned, launched, monitored, and assessed upon completion. In this post, you will learn how to set up your project pipeline and manage it effectively for better results. 

What Is a Project Pipeline? 

Project pipeline management refers to the standardized method project managers use to track multiple projects – from ideation to launch – while making sure that they have proper timeline, sufficient resources allocated, and workflows properly mapped out. 

The project pipeline helps make sure that, 

  • The project goals help further advance company goals and values.
  • Critical actions are accurately communicated to the teams and stakeholders ensuring that they are on target.
  • Precautions are taken in a timely manner to avoid failures. 

How to Effectively Manage a Project Pipeline 

A well-managed project pipeline provides useful insights into the timelines, progress, and statuses of multiple projects. It can also reveal the potential roadblocks and the risks that may hinder the progress of the initiative. Here are some of the best practices you can use for effective project pipeline management. 

Use an Effective Project Management Tool 

By using a proper project management software, a lot of the processes from ideation to launch in project planning can be streamlined. With capabilities for task management, project visualization, collaboration, and reporting, project management tools decrease confusing workflows and let you optimize the entire project management process from start to end.    

Streamlining Project Pipeline Management with Creately

Creately is a visual platform with advanced tools for knowledge management, project execution, and seamless visual collaboration. 

From task management and project planning to resource allocation and project portfolio management, Creately helps you remove friction in cross-functional collaboration and streamline your workflows, allowing you to get your projects completed seamlessly. 

Creately provides, 

  • Multiple pre-made frameworks and templates to plan, track, and manage your project activities, resources, and workflows.
  • Easy-to-use interface with simple drag and drop tools to quickly manage your project roadmaps, work plans, kanban boards, or action plans.   
  • Frames for Kanban boards, timelines, grids, and more to visually arrange your data and create a view for your own working style on the canvas.  
  • Infinite canvas to create one-page project plans centralizing all information and assets for easier decision-making. 
  • Brainstorming tools like mind maps or post-it note walls to ideate, analyze, and plan around project initiatives. 
  • Multiple app integrations to help you import and export project data across teams on different platforms.  
  • Built-in tools to create dynamic and interactive presentations, reports, and dashboards for stakeholders. 
  • True multi-user collaboration with concurrent editing, in-app video conferencing, live mouse tracking, and comments to keep everyone in sync. 

On Creately, you can create a project pipeline using, 

  • A kanban board where projects can be categorized based on their place in the workflow
Kanban Board Project Pipeline Management
Kanban Board Project Pipeline (Click on the template to edit it online)
  • A timeline or Gantt chart where the projects can be displayed chronologically
Project Timeline for Project Pipeline Management
Project Timeline Template (Click on the template to edit it online)
  • A project board where all key project details are listed in a single place
Project Board for Project Pipeline Management
Project Board (Click on the template to edit it online)
  • A list where the projects are categorized by parameters such as dates, clients, deadlines, etc.

Present Your Project Pipeline Visually 

The most effective way to present the high-level information of the projects in your pipeline is, visually. High-level visuals such as roadmaps, timelines, kanban boards, bar charts, and sequential diagrams help you create an easily comprehensible graphical story on how the projects are being managed, tracked, and executed. 

A project pipeline can be set up similar to a Scrum board, with the projects divided up into categories such as to-do, in progress, done, etc.  This eventually can serve as your project dashboard for keeping track of project progress. 

Project Pipeline Template
Project Pipeline Template (Click on the template to edit it online)

Tip: Use Creately notes feature or the data panel to capture additional project details such as tasks, statuses, deadlines, duration, resource allocation, and even risk analysis in a centralized location.  

Thoroughly Assess Your Resource Pool 

Making sure that you have enough resources to complete the project tasks in time, is an important step that needs to be taken prior to the initiation of any project. Making any commitments without assessing the capacity and competency of your workforce may eventually derail your project execution efforts.  

Therefore, assess your resource pool by getting an overview of the organization’s available resource capacity, skillset, and charge-out rates required to reach each project milestone.

Employee Skill Matrix
Employee Skill Matrix (Click on the template to edit it online)

Based on this assessment of resource availability and capacity, the management can then take the necessary resourcing measures (hiring new employees or providing the needed training to existing ones) to guarantee the success of the project. This step will also lend itself to evaluating whether the project is profitable by estimating the resourcing costs. 

Make Accurate Estimations 

The accuracy of the estimations of project parameters has a direct impact on the success of any project. If there’s a mismatch between your estimation of project resources and the actual resources necessary to complete the critical tasks, it will obstruct the timely completion of project milestones. 

During the planning stage itself, therefore, the project managers must produce an accurate estimated project plan to ensure the timely delivery of the outcomes for no extra cost. In addition to the resourcing measures, project managers also must carefully estimate the project budget, potential risks, goals, as well as overall revenue.

Once these factors are estimated, the managers can make a decision based on parameters such as whether the project meets the organization’s strategic goals or the revenue it generates will meet the organization’s expectations.  

Create a Portfolio Roadmap 

The portfolio roadmap visually depicts the project portfolio or the currently active projects against a timeline. Combined with relevant key project metadata, it can be a powerful tool to communicate what’s in the portfolio and the progression of projects. 

In addition to showing the start and end date of the projects in the pipeline, you can illustrate other key metadata such as milestones, strategic goals, etc. on the roadmap and further enhance the information that needs to be communicated to the stakeholders.

Roadmap-Template
Roadmap Template for Project Portfolio (Click on the template to edit it online)

The 3 Stages of Project Pipeline Management

In project pipeline management, a three-step process is used to ensure that a sufficient number of projects are generated, discussed, and assessed in order to maintain a healthy project portfolio while making sure that the organization’s strategic objectives are met.  

Step 1: Ideation

In this phase, new project ideas are generated. This step entails collecting ideas from the team, creating a sufficient number of project proposals to support the continuation of higher quality projects, and sustaining an environment where employees feel motivated to share their ideas for new initiatives openly.  

Tip: Maintain a backlog to store the ideas collected thus after they’ve been prioritized based on the availability of resources and other relevant factors, so they can be referred to and implemented later. Using Creately’s built-in brainstorming tools such as real-time collaboration, mind maps, and post-it notes walls you can easily work together with your team on collecting, organizing, storing, and developing ideas generated during the brainstorming sessions.

Brainwriting Template
Brainwriting (Click on the template to edit it online)

Step 2: Work Intake 

The work intake process includes creating project proposals for the project ideas that have been prioritized and getting them approved by the upper management decision-makers. The proposal should provide an outline of the scope of the project, the expected outcome, and the timeline. 

This step helps ensure that the project proposals are created in a consistent manner using common tools and processes. Skipping this step may result in confusion, time delays, and a decline in the quality of the final outcome.

Tip: Once approved, you can easily attach the project proposal with in-app previews of the documents to the project in the pipeline in Creately. Also add links to external resources, screenshots, and images to provide more context to each project via the notes feature.   

Step 3: Phase-Gates 

This step is critical to project pipeline management as it’s where the portfolio management team reviews and separates the great projects from those that are poorly planned, based on preselected strategic criteria. This step prevents projects that are bound to fail from entering the pipeline while filtering out the important strategic initiatives that are truly beneficial to the organization. 

The selected projects are then moved to the backlog of projects waiting to be initiated. Afterward, you need to create detailed project plans for these projects by breaking them down into individual tasks, assigning task owners, and setting timelines. 

It’s Time to Make Your Own Project Pipeline

A project management pipeline is essentially a project tracker. While it offers you a quick way to monitor your team’s progress, it makes the team’s workflows a lot smoother and clearer. Furthermore, by centralizing multiple project data in one place, you can get a quick overview of team performance and the company’s trajectory as well.

Now that you have learned how to create a project pipeline and manage it properly, try Creately to build your project pipeline today. Start for free!