Whether it’s a multinational corporation or startup, risks cannot be avoided. It’s a part of any new or routine endeavor.
The best way to reduce the negative impact risks may have on your business is to incorporate risk management techniques into your business structure.
In this post, we will discuss visual risk management techniques that you can use during each stage of your risk management strategy.
What is Risk Management?
Risk management is a process in which risks are identified and controlled proactively. It allows businesses to improve their chances of success by minimizing threats and maximizing opportunities.
Risk management is essential to a business as it helps prevent financial losses and increase revenue. Other benefits of risk management include,
- Help to identify projects that might be headed toward trouble and apply solutions
- Help to prepare for unexpected threats beforehand
- Help to provide enough data to make better decisions regarding projects/ events
- Help to improve communication between stakeholders and project teams
- Help teams stay more focused on the key outcomes
Key stages of a risk management process are identifying risks, analyzing risks and planning to mitigate risks. These are detailed below along with risk management techniques you can use.
Identify Risks
The risk management process begins with identifying risks in advance once you have set the goal. Identifying risks should be done early in a project and shouldn’t be done in the middle of or during a project, as it may be too late.
Identifying risks can be done in 2 ways
- By identifying root causes and the impact they may have
- By identifying the essential functions the company must perform to reach a goal and identifying how they can fail
The following visual risk management methods can be used to identify risks beforehand.
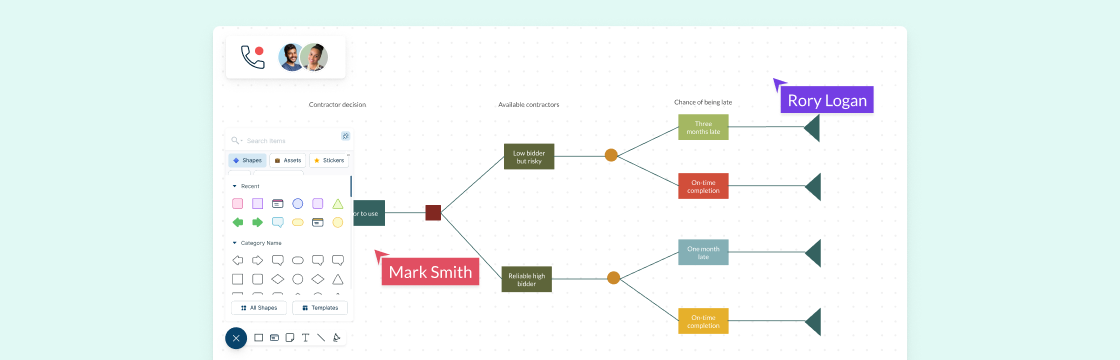
1. Decision Tree Diagram
Decision trees are used to make decisions when you are faced with multiple options. It allows you to assess the values of outcomes and possibilities of achieving them. This, in turn, helps make a better decision.
How to use it
Step 1: Identify decisions and create a decision tree diagram based on decisions, costs, and rewards of uncertain options available to you.
Step 2: Figure out the probability of a risk occurring and assign it
Step 3: In this step you have to identify the monetary value of the risk, or in other words how much it would cost you if the risk is to occur
Step 4: Calculate the Expected Monetary Value (EMV) of each decision path by multiplying probability and impact
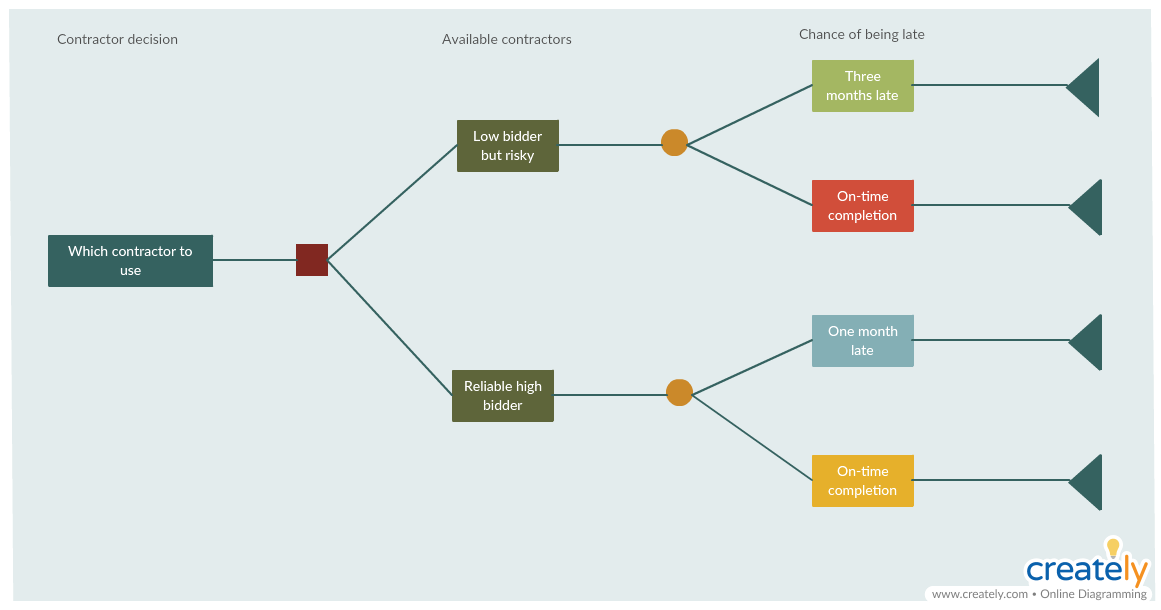
Decision Tree Analysis Template (Click on the template to edit it online)
2. Influence Diagram
An influence diagram is used to represent the summary of information of a decision tree. It shows variables that are known and unknown when making a decision and the relationships that exist among them.
Rectangles indicate decisions, ovals represent uncertainties and values or the required outputs are indicated by diamonds. The influence each variable have on the other is represented by arrows.
How to use it
Step 1: Identify the decisions to be made to reach your objective
Step 2: Consider the risks and performance factors that may have an influence on achieving your objective.
Step 3: Recognize secondary factors that affect uncertainty associated with the performance factors.
Step 4: Identify second-order risk factors that can influence secondary factors.
Step 5: Continue to figure out what factors influence uncertainty until all key risks are identified.
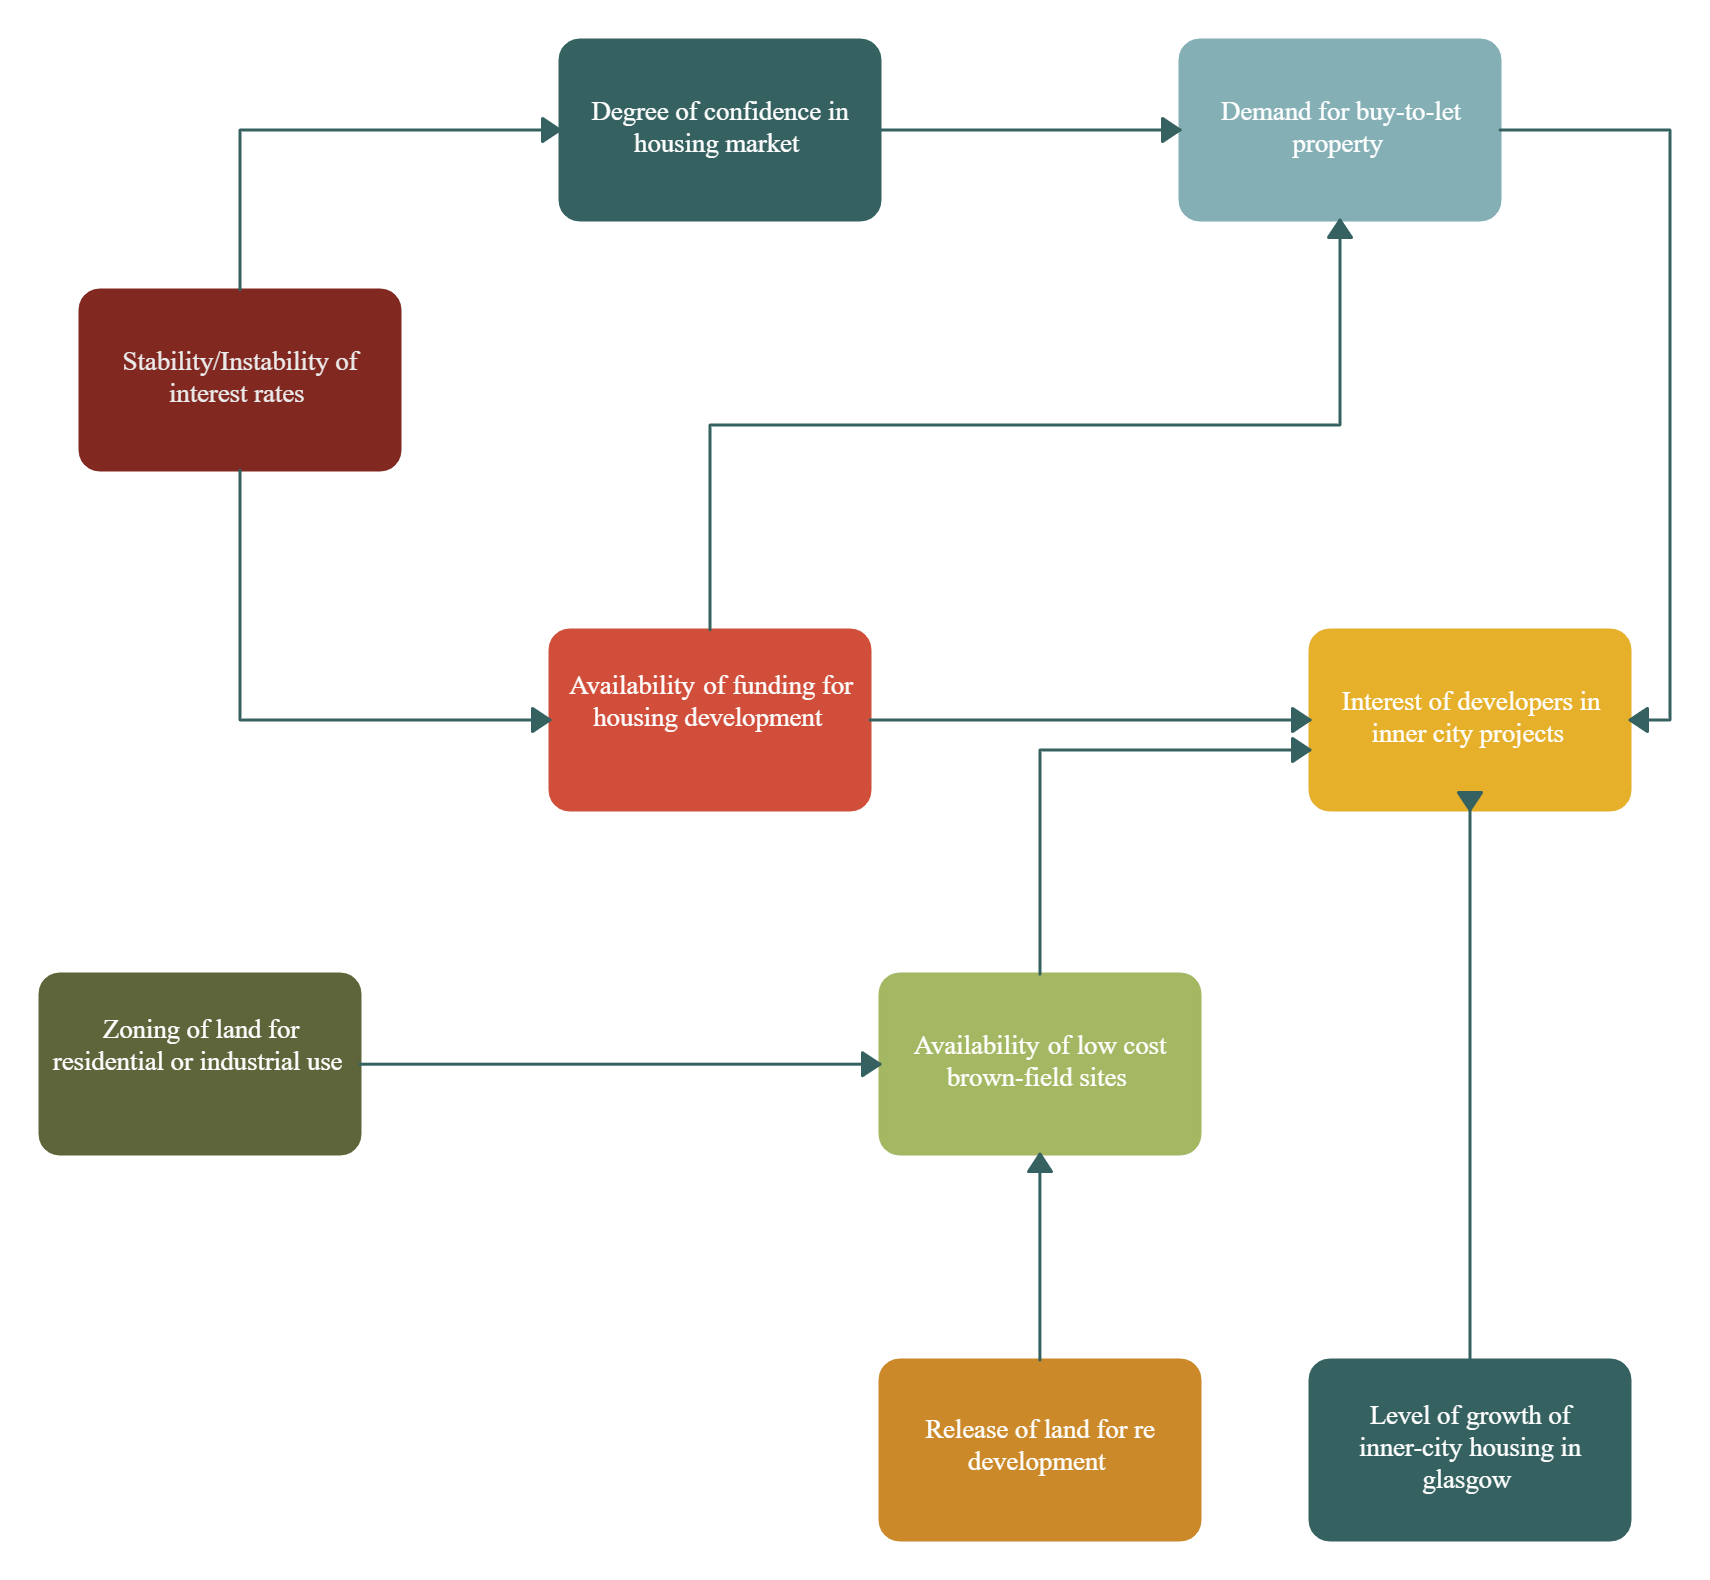
Click on the template to edit it online
3. SWOT analysis
Whether you are planning a new project or developing a new process, a SWOT analysis can help you get insight into any risks that may occur. It helps you identify the Strengths, Weaknesses, Threats and Opportunities associated with the event.
How to use it
To learn how to use a SWOT analysis refer to our article SWOT Analysis: What, Why and How to Use Them Effectively.
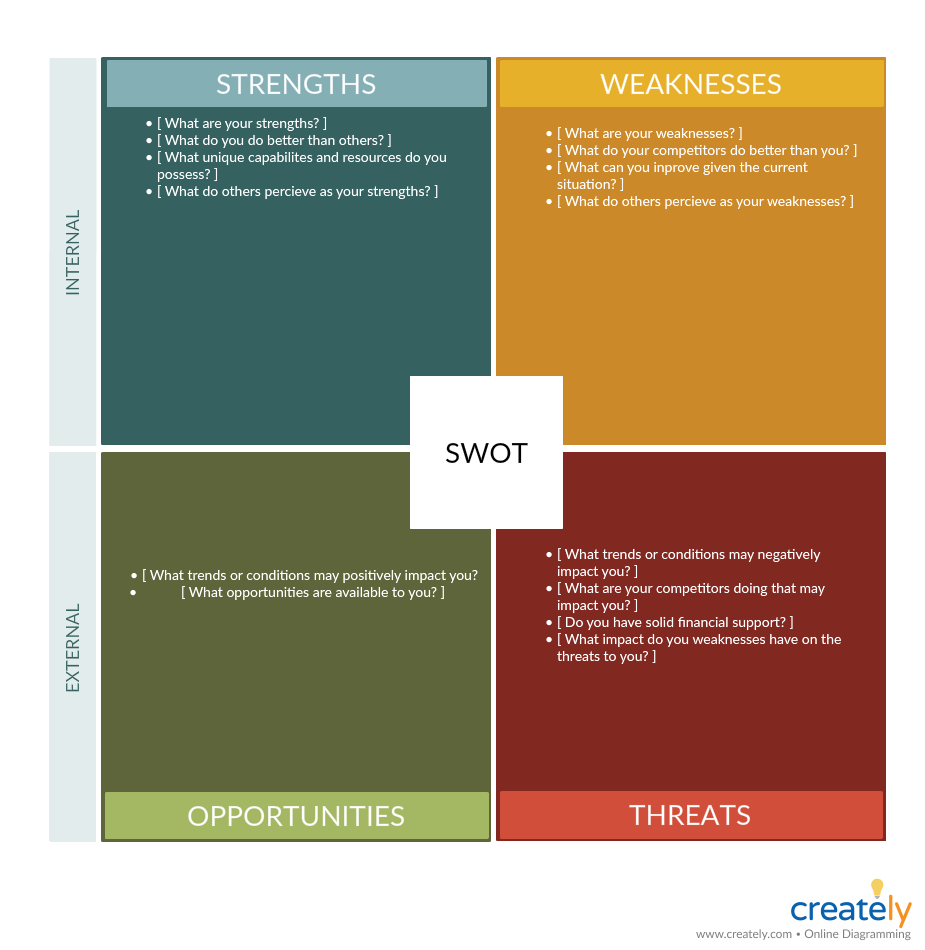
Click on the template to edit it online
4. Fishbone Diagram
Also known as the Ishikawa diagram and the cause and effect diagram, the fishbone diagram is used to break apart a problem and identify the root causes behind it. It works backward as it helps identify the causes of a certain effect.
How to use it
Our Ultimate Guide to Fishbone Diagrams covers how to use a fishbone diagram in depth.
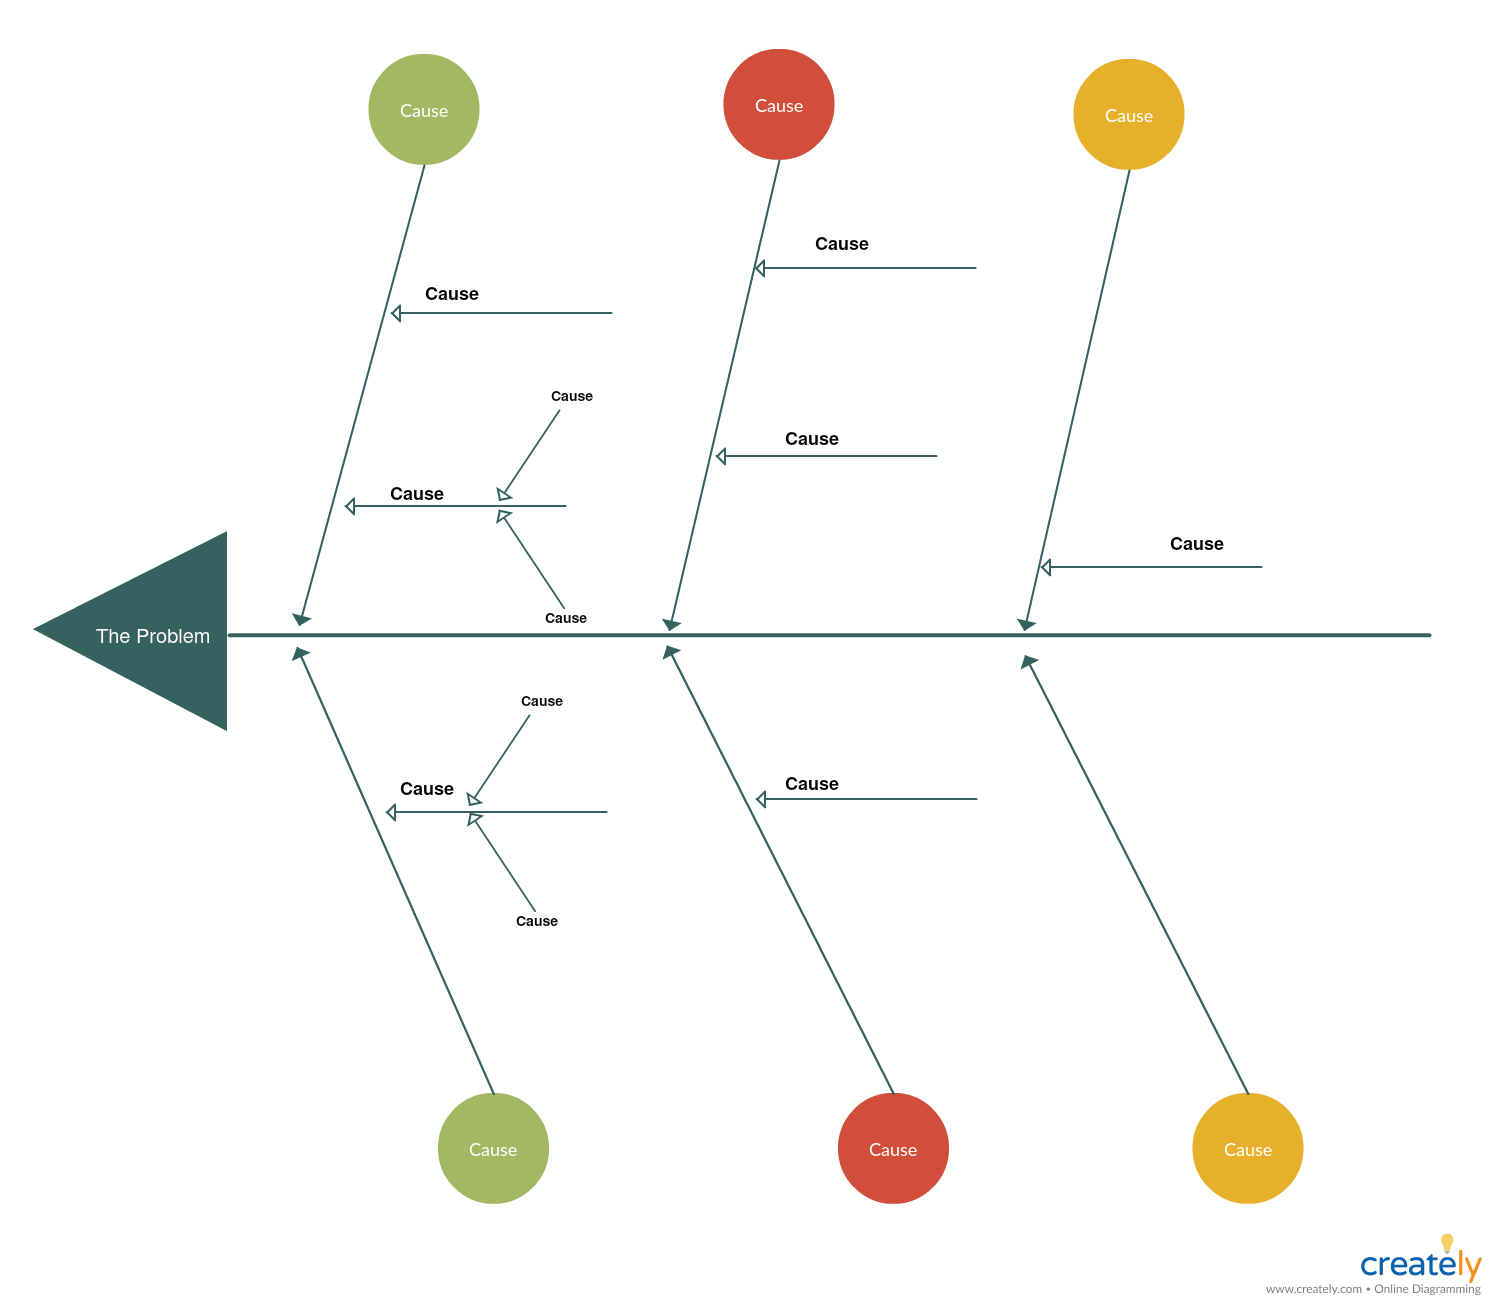
Fishbone Diagram Template (Click on the template to edit it online)
5. Process Maps
Process maps help visualize the major steps and relationships between them in a process. By having the people who actually perform it outline the process using a process map, you can check for its accuracy. This also helps identify bottlenecks and blockers in advance.
How to use it
Step 1: Identify the team you need to map – whether its a new process or a process being redesigned
Step 2: Bring together everyone who is involved in performing/ developing the process and brainstorm all information related to the process, such as inputs, outputs etc.
Step 3: Take the steps you identified and put them in a sequential order
Step 4: Draw a map that shows the current state of the process
Step 5: Identify the bottlenecks and flaws in your process
Check out The Easy Guide to Process Mapping to learn about what process maps are, process map symbols, types of process maps, etc.
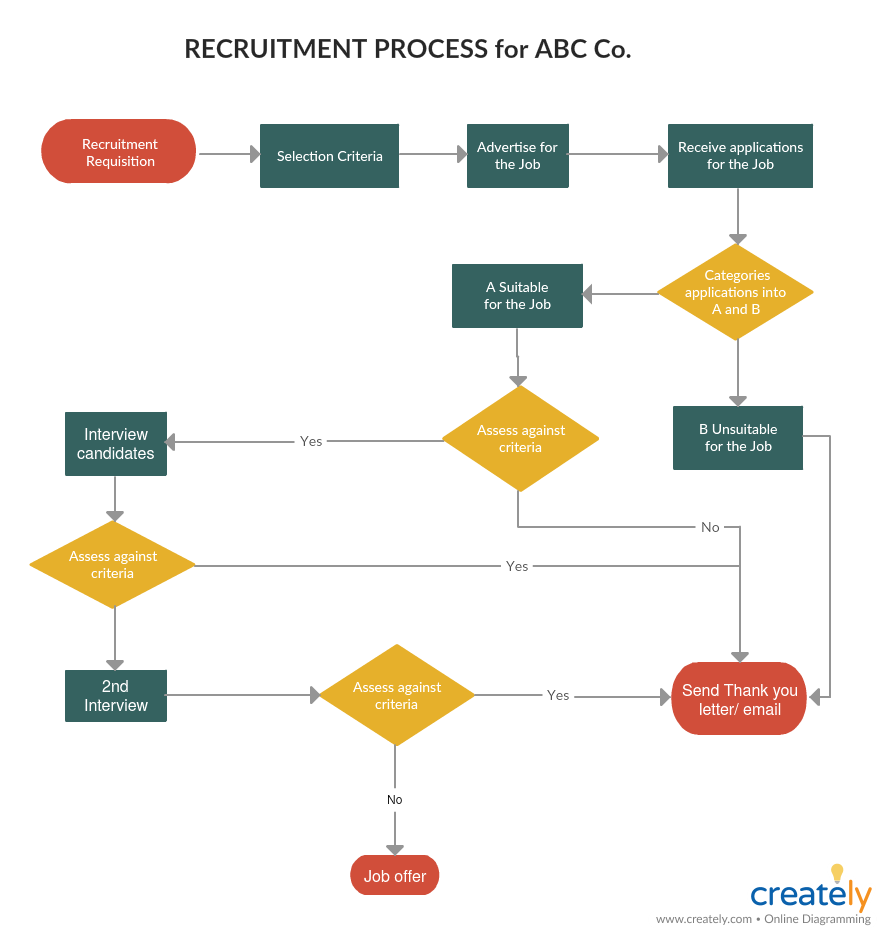
Process Map for Risk Management (Click on the template to edit online)
Analyze the Identified Risk
Once you have identified the risks, the next step is to assess the risks to see what kind of an impact they have on your business and current projects. By correctly analyzing the risks, you will be able to prioritize as to which risk has the highest impact on your business.
Analyzing risks can be done in two ways
- Qualitative risk analysis – here the risks are analyzed based on the likelihood of them occurring and the impact they may have on projects, business etc.
- Quantitative risk analysis – quantifies the possible outcomes and evaluate the probability of achieving objects
Following are a few risk management methods you can use to help during the analysis phase of the risk management process.
1. Risk Probability and Impact Matrix
This is a tool that can be used to do a qualitative risk assessment. It helps to evaluate the relative impact (high or low) of a risk and the probability of its occurrence (high or low).
How to use it
According to the risk probability and impact matrix, there are two dimensions to risks
- Probability- The probability of a risk occurring can range from 0% to below 100%, therefore it is an event that may occur.
- Impact – A risk always has a negative impact
In the risk probability and impact matrix, you can rate potential risks based on these two dimensions. Based on where the risk is placed on the matrix, you can prioritize it as
- Low impact – low probability
- Low impact – high probability
- High impact – low probability
- High impact – high probability
While the risks on the bottom left corner can often be disregarded, the risks placed on the top right corner should be given top priority.
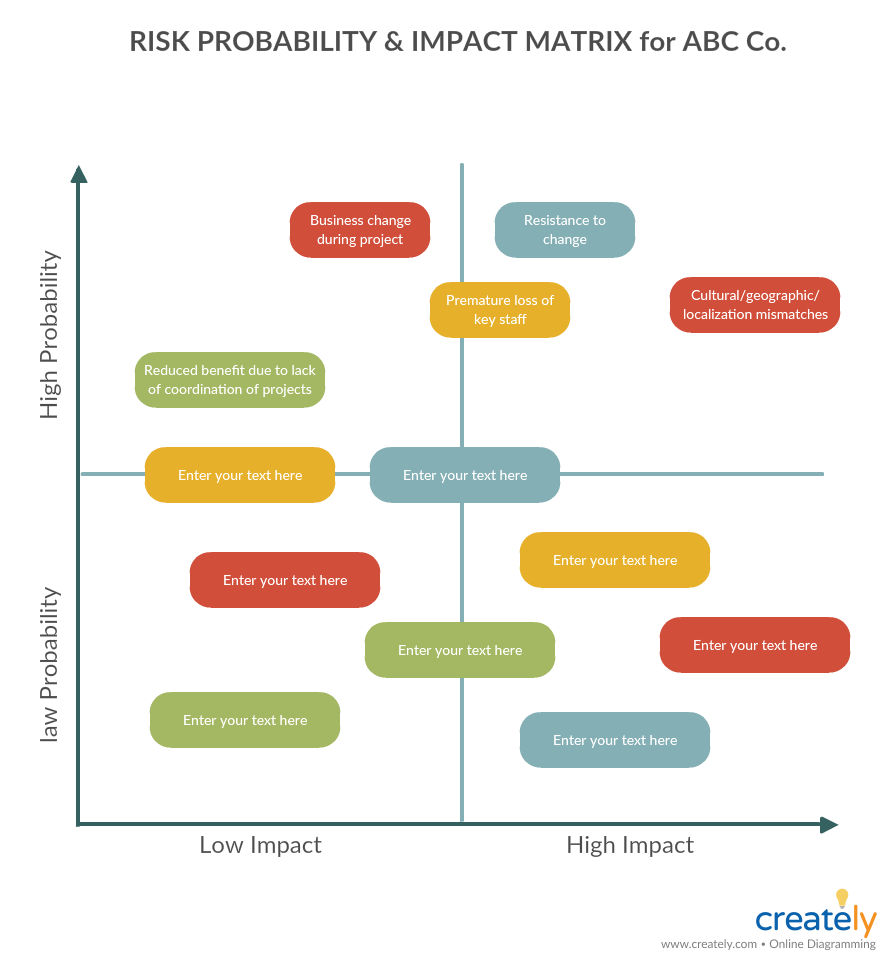
Risk Probability and Impact Matrix (Click on the template to edit it online)
2. Pareto Chart
Pareto diagrams are a great way to identify which problems should be prioritized based on the cumulative effect it has on a system. While the length of the bars represents the frequency or cost (time or money), the bars are arranged with the longest bars to the right and shortest bars to the right. This way it depicts which situation is the most significant.
How to use it
Step 1: Identify the categories you want to use to group the items, and the measurements (i.e. frequency, cost, time etc.)
Step 2: Decide the period of time (an hour, week or day etc.) you want the Pareto chart to cover
Step 3: Collect the data along with the category and subtotal the measurements for each category
Step 4: Determine the right scale for the measurements and mark the scale on the left side of the chart
Step 5: Label bars for each category, placing the tallest at the far left
Step 6: Calculate the percentage for each category
Step 7: Calculate and draw cumulative sums
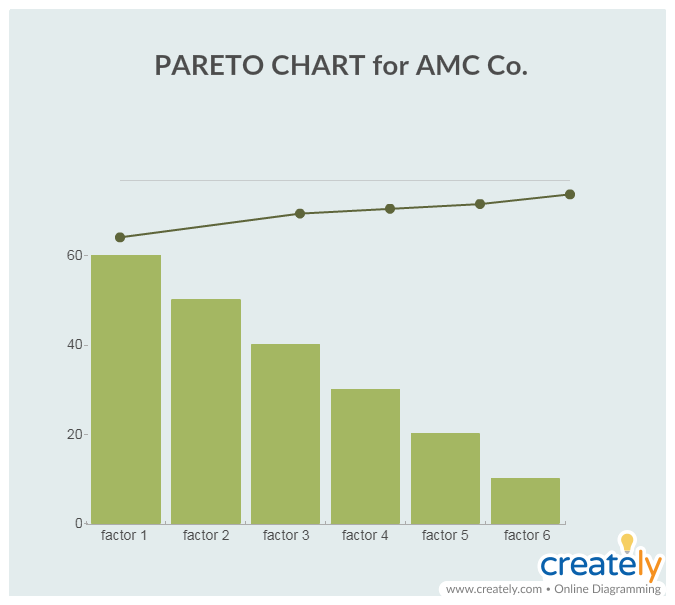
Pareto Chart for Risk Management (Click on the template to edit online)
3. Fault Tree Analysis
The fault tree analysis helps to identify the probabilities of various outcomes from given faults and failures. The fault tree analysis helps to identify the likelihood of an event occurring by visualizing a certain event at a top and the conditions causing that event.
How to use it
Step 1: Identify the fault/ failure that should be analyzed
Step 2: List down the immediate or direct causes of the fault. Thoroughly examine each step until the root causes are analyzed
Step 3: Once you apply the data to the fault tree, use it to do the evaluation
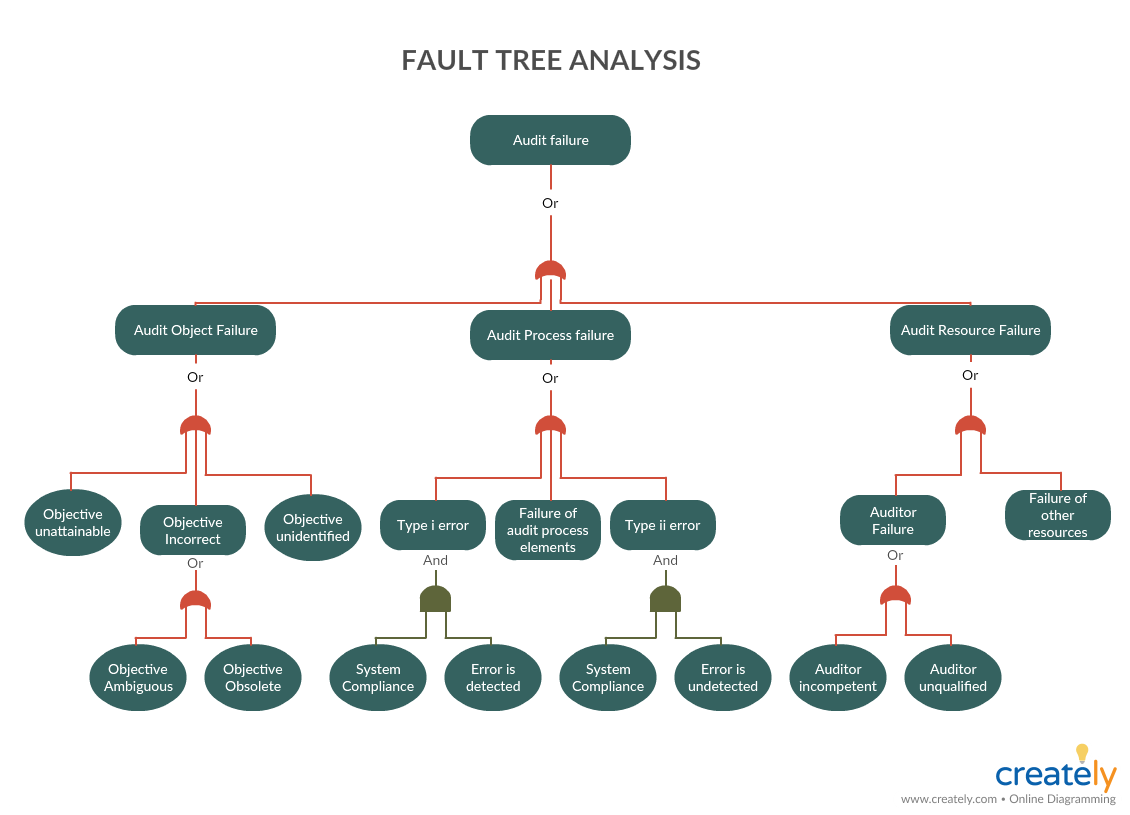
Fault Tree Analysis Diagram (Click on the template to edit it online)
Planning to Avoid Future Risks
In the planning phase of the risk management cycle, you need to pay attention to mitigating risks by finding solutions and controlling them. Starting from the risks that have the most severe impact on your projects or organization, find out how to minimize their effect.
1. Futures wheel diagram
Futures wheel is a tool that you can use to identify direct and indirect results of a certain trend, event or decision.
How to use it
Step 1: Identify the change. This could be a problem or a potential risk.
Step 2: Brainstorm possible consequences of the trend.
Step 3: Brainstorm the secondary or “second-order” consequences related to the “first-order” consequences you identified earlier. You can continue to expand the diagram by adding several layers.
Step 4: Once the futures wheel is complete you can get an overview of the direct and indirect consequences of the change you want to implement.
Step 5: Take the negative consequences and identify possible actions you can take to control them.
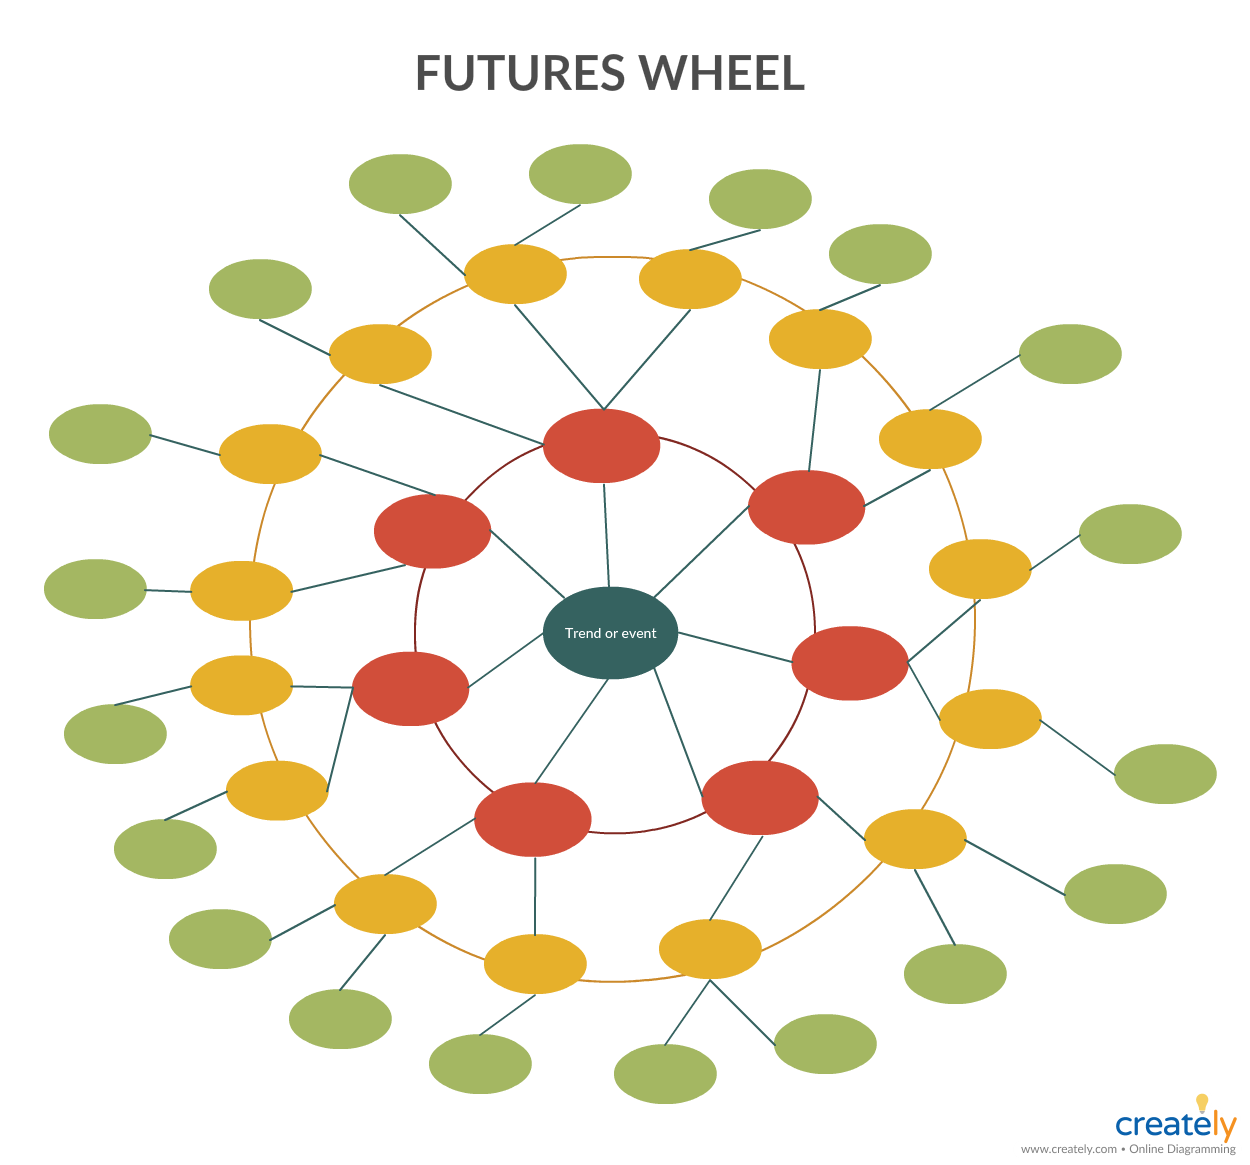
Futures Wheel Template (Click on the template to edit it online)
2. Process Decision Program Chart
The process decision program chart (PDPC) help you look into what might go wrong in a plan that is under development. You can use the chart to alter your plan in order to prevent the problem from occurring and to prepare a contingency plan to mitigate the risk.
How to use it
Step 1: Create a tree diagram of the plan, listing the objectives, main activities and the tasks that should be completed under each activity.
Step 2: Take the tasks on the third level and brainstorm what could go wrong
Step 3: If the consequences of the problems identified earlier are insignificant leave them out. Add the significant problems related to each task on the tree diagram as a fourth level.
Step 4: Come up with countermeasures for each problem, and add them as a fifth level to the diagram
Step 5: Consider how practical each countermeasure is in terms of time, resources, cost etc. You can use an X to mark the impractical solution and an O to mark those that are practical.
Refer to this article on PDPC to learn more about the tool.
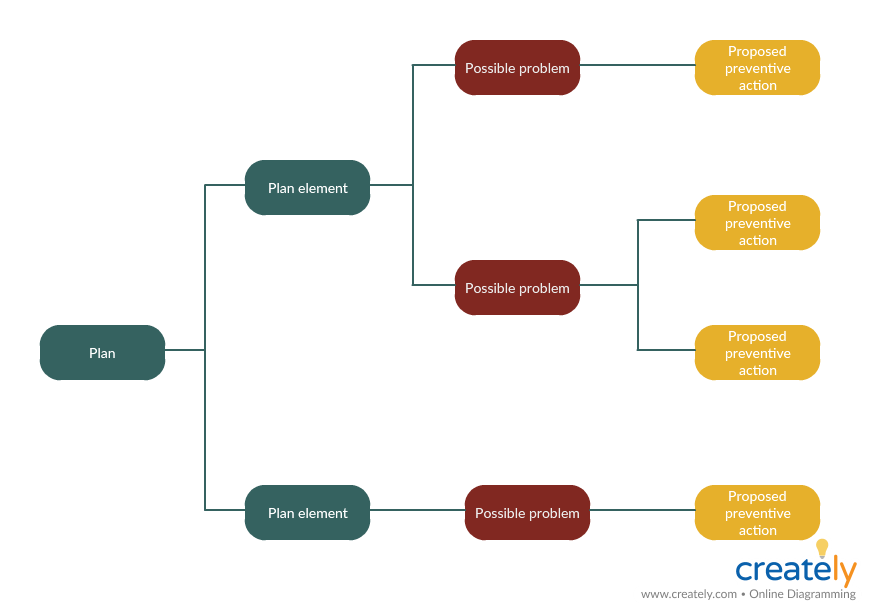
Process Decision Program Chart – PDPC (Click on the template to edit it online)
3. Risk-Reward Analysis
Risk reward analysis is a tool you can use to evaluate the risk and reward profile of different options.
How to use it
Step 1: List down the options and possible risks related to them
Step 2: Plot the risks and rewards on the risk-reward analysis chart
Step 3: While some options may have a positive risk-reward profile, take time to see whether you should spend time on mitigating risks of other options as well.
Step 4: Compare each option against one another to identify the best option for you
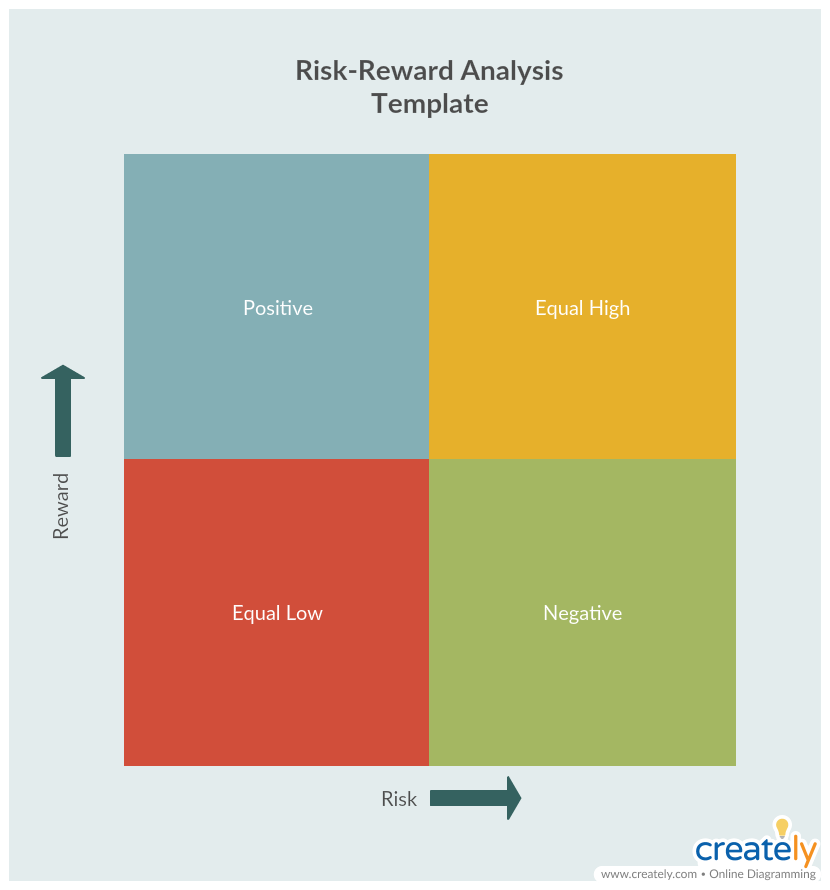
Risk – Reward Analysis Template (Click on the template to edit online)
Add to the List of Visual Risk Management Techniques
The risk management techniques we’ve discusses above will help you identify, analyze and control risks that may occur during your projects or the development of new business processes.
Do you know of any other visual techniques that can be used to manage risks? Let us know in the comment section below.


This work is quite resourceful especially for specialists in project management. The diagrams are quite impressive