Strategy frameworks are numerous. There is one for any scenario and there’s a chance that selecting one may actually overwhelm someone new to the field.
That’s why we have rounded up the most commonly used strategy frameworks from among them to help you select the one that best suits your purpose.
What is a Strategy Framework
Strategy frameworks are tools that help structure business thinking and guide businesses as they grow and accomplish their missions. They can also be used to analyze business issues and develop strategies. And strategy consultants often use them to communicate their solutions to their clients.
Top Strategy Frameworks for Businesses
When it comes to selecting a strategy framework, you need to consider what type of organization yours is, what you are trying to achieve, and your strengths and weaknesses.
Below we have listed 7 strategic frameworks for businesses, and you can decide which ones to use based on the explanations provided.
Porter’s Five Forces
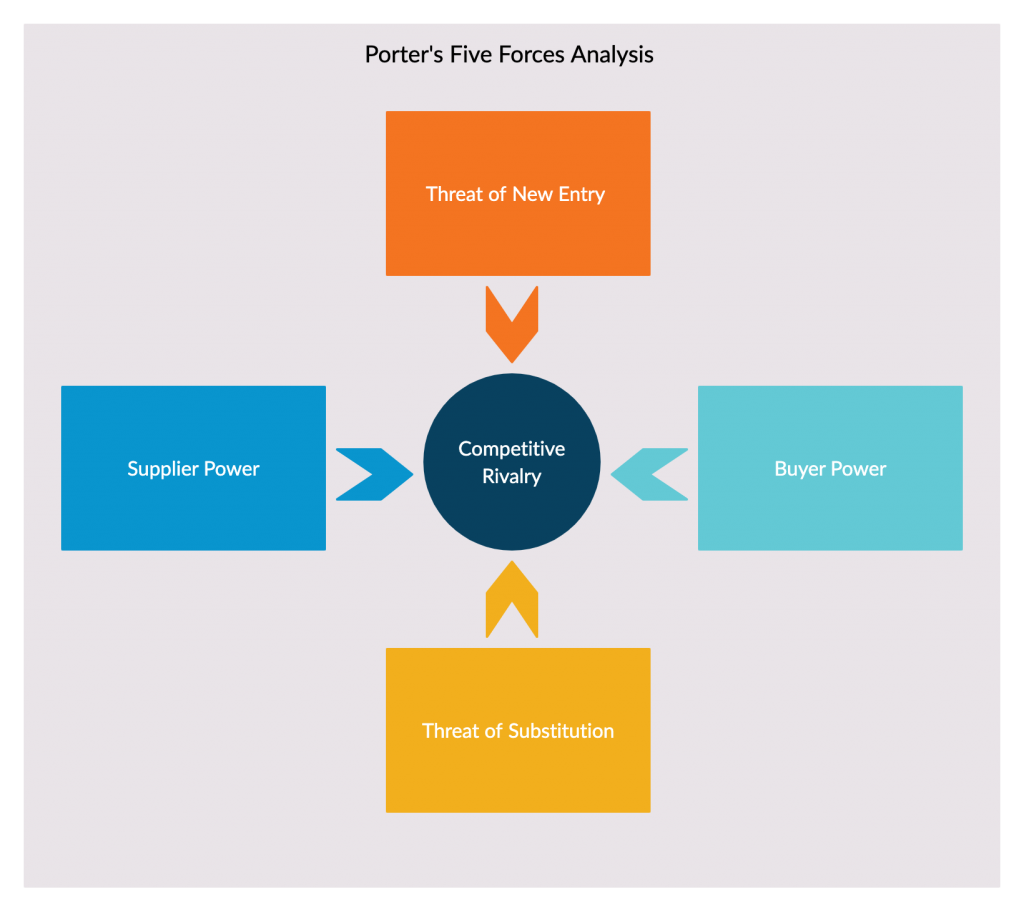
Porter’s five forces is a framework that helps an organization understand the intensity of competition in an industry, and its attractiveness and profitability level.
Porter’s 5 forces are
- Competitive rivalry
- Threat of substitute products
- Bargaining power of buyers
- Threat of new entrants
- Bargaining power of suppliers
When to use it
- To identify and understand the forces in your industry that can affect your profitability
- To understand the competitiveness in your industry
- To assess your marketplace viability and strengths and weaknesses in your position
How to use it
Step 1: Start by gathering information on the five forces. The aspects you need to focus on are highlighted in the template below.
Competitive rivalry
Focusing on these aspects below you can determine how competitive and profitable the industry is.
- How many competitors do you have?
- who they are? Are they direct competitors?
- What are their strengths and weaknesses?
- What’s the quality of their products and services when compared to yours?
Supplier power
Determine the power suppliers have to increase their prices or provide low-quality material which in turn will affect your product or service. Focus on
- How many potential suppliers are in the market?
- How scarce are the material they provide?
- How expensive would it be to switch from one supplier to the other?
- Can you find substitute material? How costly are they?
Buyer power
How much power do your customers have over you? They have the ability to drive prices low and demand higher-quality products. Here you should focus on
- How many buyers are there?
- What’s the size of their orders?
- How powerful are they? Are they powerful enough to dictate terms to you?
- How much would it cost them to switch from you to another product?
Threat of new entrants
Determine how easy it is to enter and establish a business in the industry you are competing in. If an industry is profitable and only has few barriers to enter, new companies can easily establish themselves posing a threat to you. Focus on
- How easy it is for a new business to get established in your industry?
- How much would it cost?
- What are the rules and regulations? Legal barriers?
- Is it easy to get access to suppliers and distributors?
Threat of substitute products
Determine how easily your customers can find a substitute product. If there are substitutes that are cheaper and can be easily purchased, that may weaken your stance.
- How many substitutes are in the market?
- What’s their quality and price?
- How easily can your customers find them?
- What would it cost them to switch to a substitute?
Step 2: Once you have collected all the information, you can use Porter’s five forces template to display them. This will make it easier to analyze and communicate them to the various stakeholders.
Step 3: Based on your analysis and conclusions, develop efficient strategies.
BCG Matrix
The BCG “Boston Consultant Group” matrix is a portfolio management framework that helps businesses decide which products or services to invest in and not according to market growth and market share.
Market growth – how well the product is growing when compared to other products?
Market share – what is the size of the market the product has captured compare to the competition?
It’s also known as the growth-share matrix and contains four quadrants that represent different categories of the company’s offerings. The y-axis represents the rate of market growth and the x-axis represents the market share.
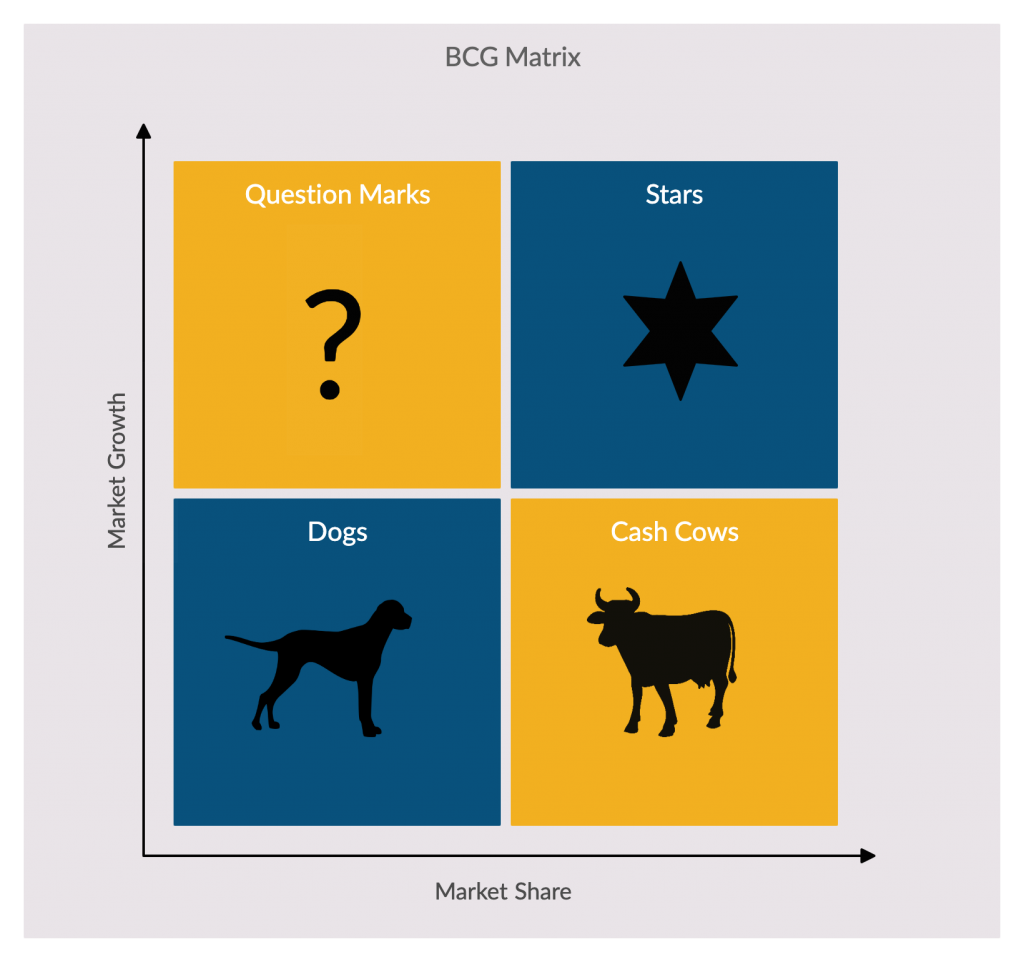
- Star (high share and high growth): Products that belong to this category have a rapid growth rate and a dominant market share. They generate a lot of cash as well as require a lot of investment to ensure that they maintain their position. If they can maintain their high position, they will eventually become ‘cash cows’.
- Cash cow (high share and low growth): These are the products that are most profitable to a business. They don’t cost much for the business to maintain and generate a significant amount of income. The cash gained from them should be invested in the Star products to help them grow further.
- Dogs (low share low growth): Products that have a low market share and operates in a slowly growing market. Since they generally generate low or negative returns and drain resources, investing in them is not worth it.
- Question marks (high growth, low share): The future of the products that belong to this category is uncertain; as they have a low market share in a fast-growing market. It has the potential to become a Star by gaining market share, but it also has the potential to become Dogs by failing to gain market share. It’s important to keep a close eye on these.
When to use it
- To identify growth opportunities by deciding where to invest in and withdraw from depending on the portfolio of products
- To gain insight into which products business should keep, sell or invest more in
- To get a current snapshot of how the current products are performing in the market
Learn how to use this tool in more detail with our resource on the BCG Matrix.
GE-McKinsey Nine-Box Matrix
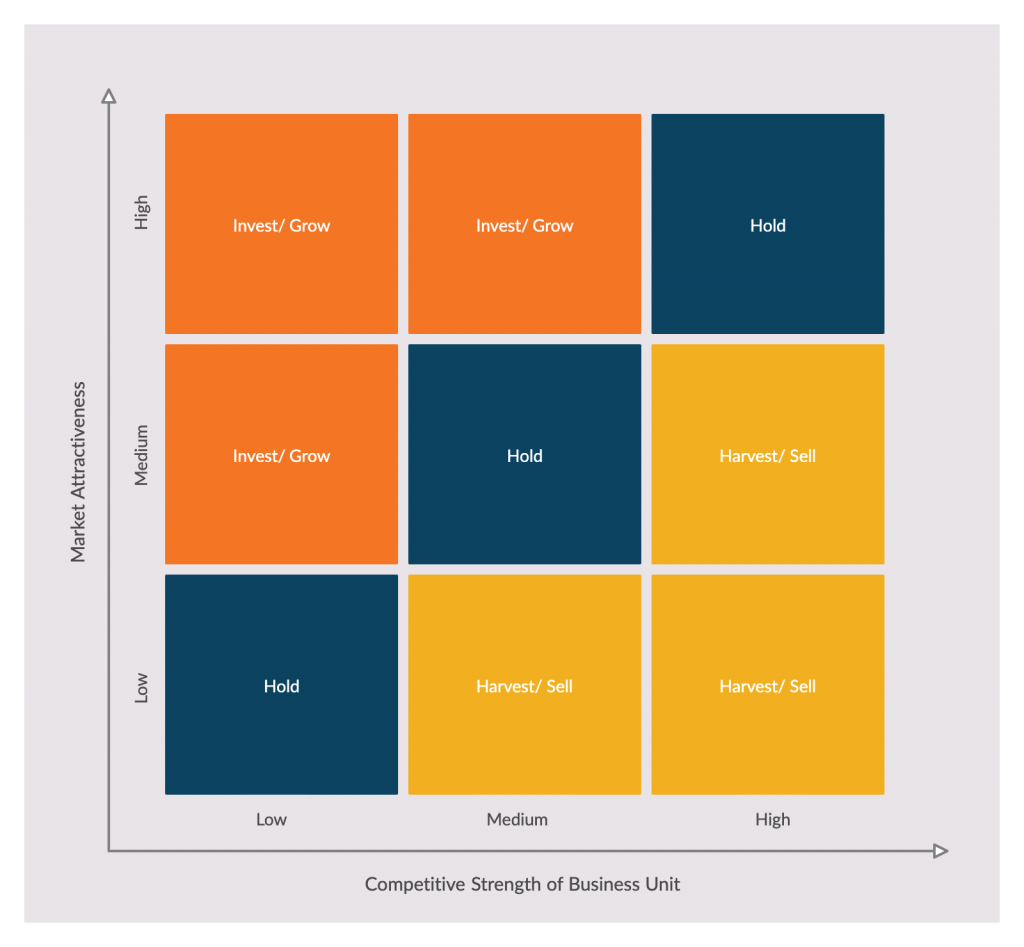
This strategy tool helps business portfolio planning. Multi-business corporations use it to evaluate their individual business units and prioritize investments among them systematically.
In the matrix, the y-axis represents the market/ industry attractiveness, and the x-axis shows the strength of the business unit. The scale is high, medium and low. It generates nine industry attractiveness measures and twelve business strengths measures.
When to use it
- To plan and evaluate the business portfolio
- To prioritize and strategize business investments
- To identify the key areas of the business portfolio that needs to be improved
How to use it
Step 1: Identify the factors that contribute to the market attractiveness of your different business units. Some of them are market size, pricing trends, competition levels, market profitability and so on.
- Once the factors have been identified assign them weights to help decide their importance to the determination of market attractiveness. The weights could range from not important (0.01) to very important (1.0).
- The factors should now be rated for each business unit. The values can be either between 1-5 or 1-10.
- Multiply the weight of each factor by its rating to calculate the final scores. The final score will be used to evaluate the industry attractiveness.
Step 2: Next evaluate the competitive strength of each business unit. This follows a similar path to step 1. First, determine the factors that contribute to competitive strength. Assign each factor a weight based on their importance in helping the company gain a competitive advantage. Then rate each factor for the different business units, before calculating the final scores.
Step 3: Plot the information you have gathered on the GE-McKinsey matrix. When plotting the business unit in the matrix, use circles and the size of the circle can be used to show the revenue the unit generates.
Step 4: Analyze the information. Based on the position of each of the business unit on the matrix, there are three actions the company can take;
- Invest/ Grow: Units that belong to this category have a high potential of generating massive returns. They have higher growth potential, therefore they should be allowed a large amount of investment.
- Selectivity/ Earnings: The company can invest in these units if there are any investments left after what is spent on the Grow category. The future of these business units is uncertain. However, if the unit is important and there’s a bigger market, it might be worth it to spend on them.
- Harvest/ Divest: The units that belong to this category are in an unattractive industry and has no competitive advantage. Investing in them may not be profitable to the company, therefore they should be divested and liquidated. However, if they show a strategic advantage, the company can spend surplus cash on them.
Step 5: Based on the analysis, determine the future directions of the business units and determine how to prioritize the company investments among the units.
Ansoff Matrix
Businesses use the Ansoff matrix to analyze and plan strategies for growth and understand associated risks. According to the matrix, there are two approaches to building a growth strategy;
- By varying what is sold (product growth)
- By varying who it is sold to (market growth)
Accordingly, the matrix delivers four strategic options that have different levels of risks;
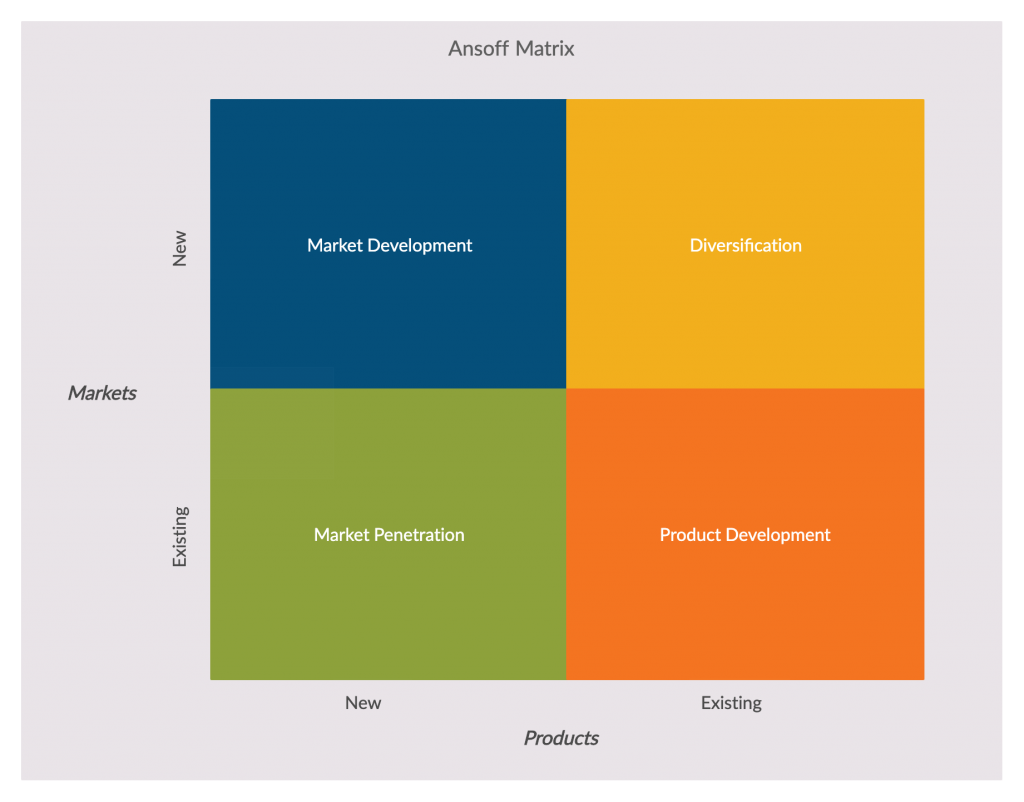
- Market penetration: This strategic option focuses on selling existing products to the company’s existing market. It’s the one with the lowest risk as the company already knows its customers and has channels already established to reach them. Here the company can decrease prices and offer discounts to attract customers.
- Product development: This is where the company develops new products for its existing market. To make it work the company has to rely on extensive research and provide innovative solutions to meet the needs of the customers.
- Market development: Here the company can market its existing products to a new market. A new market may entail new geographies, different customer segments, new channels, needs, etc. It’s riskier than the other two strategies as it deals with a new market.
- Diversification: Here the company develops new products for a new market. This is the riskiest strategy of all four, however, the risk can be mitigated through related diversification (a new product that is related to the existing product) and unrelated diversification (a new product that is not related to the existing product).
When to use it
- To identify profitable growth strategies
- To identify risks involved in growth strategies
- To communicate company strategies to stakeholders
To learn about this tool and how to use it in more detail, refer to our resource on the Ansoff matrix.
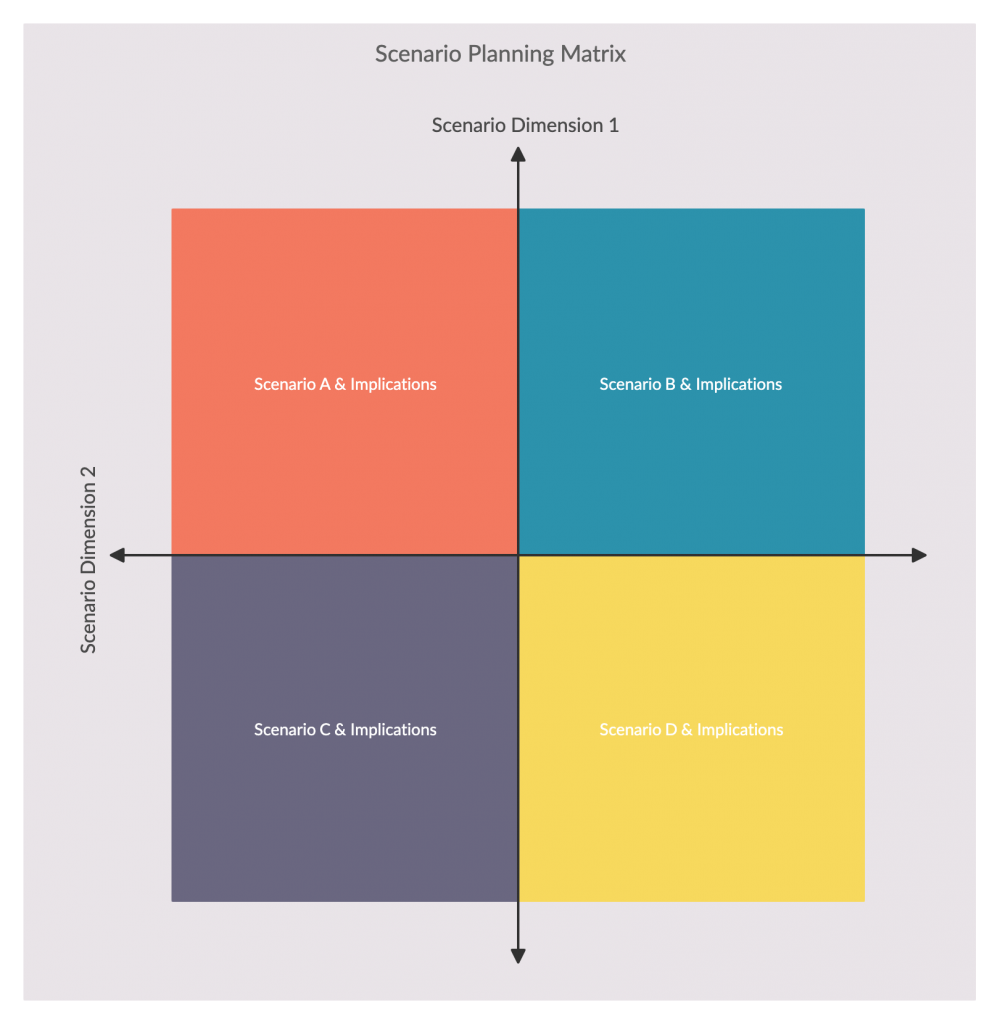
Scenario Planning
Scenario planning involves creating and brainstorming around possible future scenarios and understand how they would affect the objectives of the company.
It helps companies develop effective strategies and adapt them where necessary, by considering the impact and discussing the responses.
When to use it
- To determine the future direction of the company
- To stay prepared for alternative futures and reduce risks
- To identify future threats and opportunities
- To foster strategic thinking and learning
- To create options for decision-making
Learn about scenario planning in more detail with this resource.
Value Chain Analysis
This strategy tool helps organizations analyze their internal firm activities. It helps identify which activities are most valuable to the company and which ones can be improved for competitive advantage.
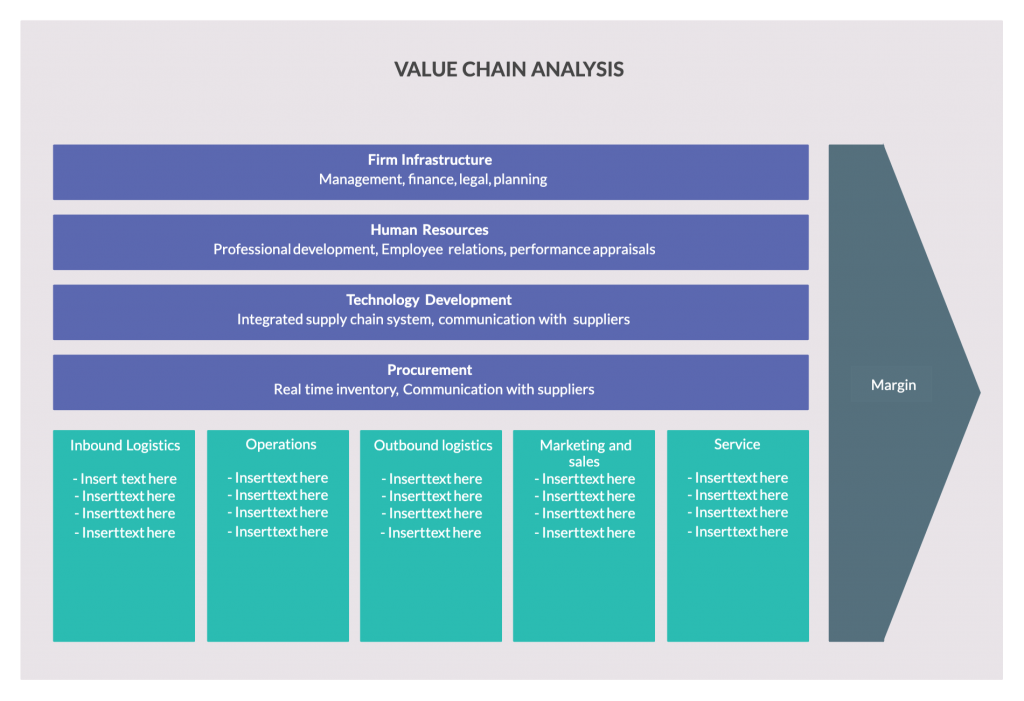
When to use it
- To identify competitive advantages on both cost and differentiation
- To understand the activities needed to deliver the value proposition
- To compare your business with that of your competitor to understand strengths and weaknesses
Additional resources: Value Chain Analysis
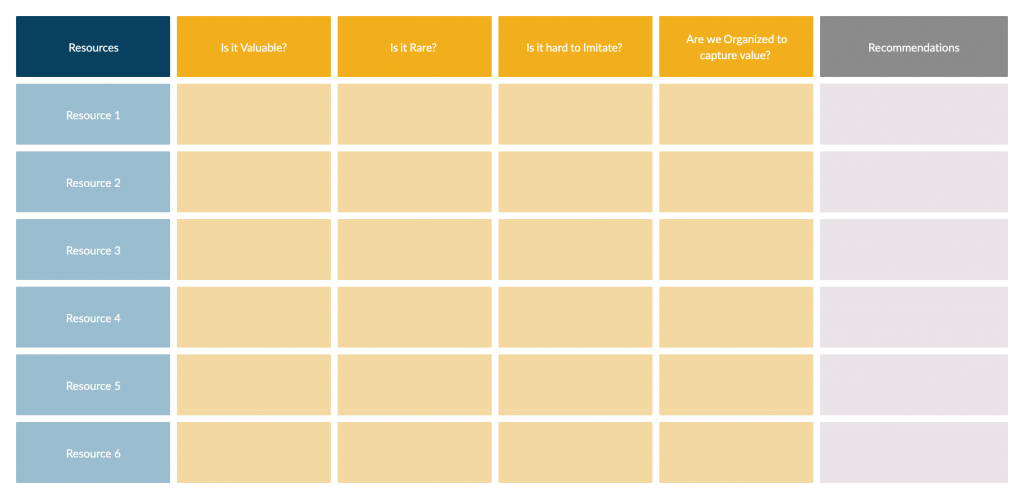
VRIO Analysis
VRIO analysis is used to analyze the internal resources of a company. It identifies attributes that a company’s resources must have in order to provide a competitive advantage. The analysis involves asking four questions with regard to the resources;
Valuable: If a resource can help find opportunities or defend against threats it can be considered valuable. Moreover, a valuable resource should help increase customer value.
Rare: If a resource can only be acquired by one or a few companies, it is considered rare. A resource that is valuable and rare will provide a significant competitive advantage.
Costly to imitate: If other organizations that don’t have the resource can’t imitate it, buy it or find a substitute for it at a reasonable price, that resource is considered costly to imitate.
Organized to capture value: The organization should have processes, policies, and systems in place to capture the value created by valuable, rare and costly to imitate resources.
Learn how to do a VRIO analysis here.
More Useful Resources on Strategy Frameworks
Here we have shared a list of resources and blog posts that discuss various other strategy frameworks.
The Easy Guide to Performing an Effective Situation Analysis
The Easy Guide to Making a Business Plan for Presentations
SWOT Analysis: What, Why and How to Use Them Effectively
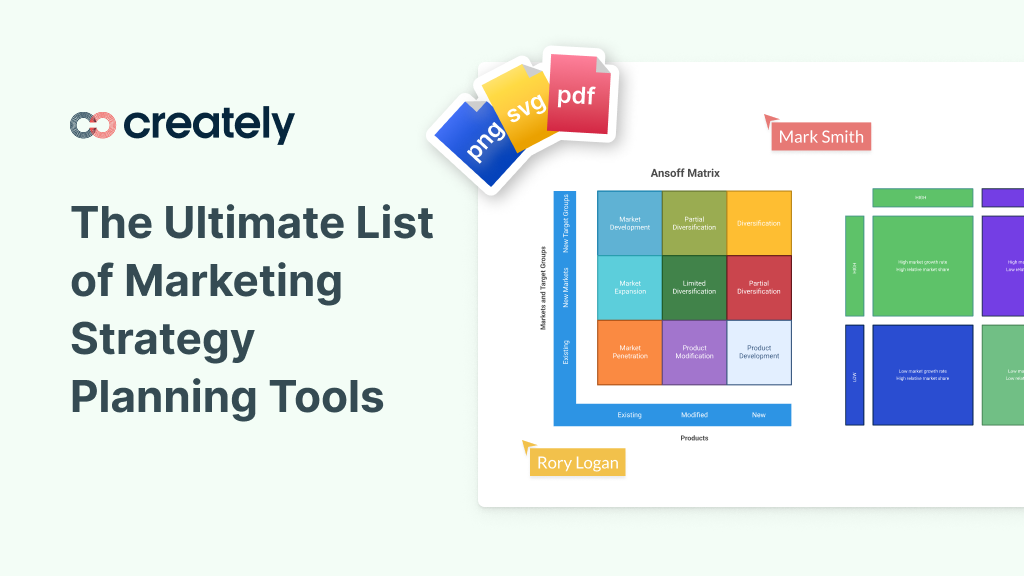
The Ultimate List of Marketing Strategy Planning Tools
5 Gap Analysis Tools to Identify and Close the Gaps in Your Business
The Easy Guide to the Strategic Planning Process
Don’t forget to leave your feedback in the comments section below.