If you don’t have a clear marketing strategy or is planning to change your strategy, the list of strategic planning tools below will help you narrow in on the most important decisions in a coherent manner so that your resulting plan is high-impact, well defined and realistic.
Defining your marketing strategy has multiple stages. We’ve grouped some of the most useful marketing strategy tools for each focus area for easy reference.
List of Marketing Strategy Planning Tools
1. Define Company Mission and Objectives
2. Analyze Current Position
d. Perceptual Map / Positioning Maps
e. BCG Matrix
3. Define marketing strategies
a. Segment Attractiveness and Resource Strength Framework by Hooley
d. Customer / Strategy / Resource Matrix by Hooley
e. Keller’s Brand Equity Pyramid
4. Implement and Control Marketing Execution
Objectives: Business Model Canvas
The business model canvas is a one-page document that lets you work through the fundamentals of your business ideas in a single snapshot. Populating this upfront will outline all relevant aspects that one will need to consider when defining a marketing strategy. Click on the following template to edit it online.
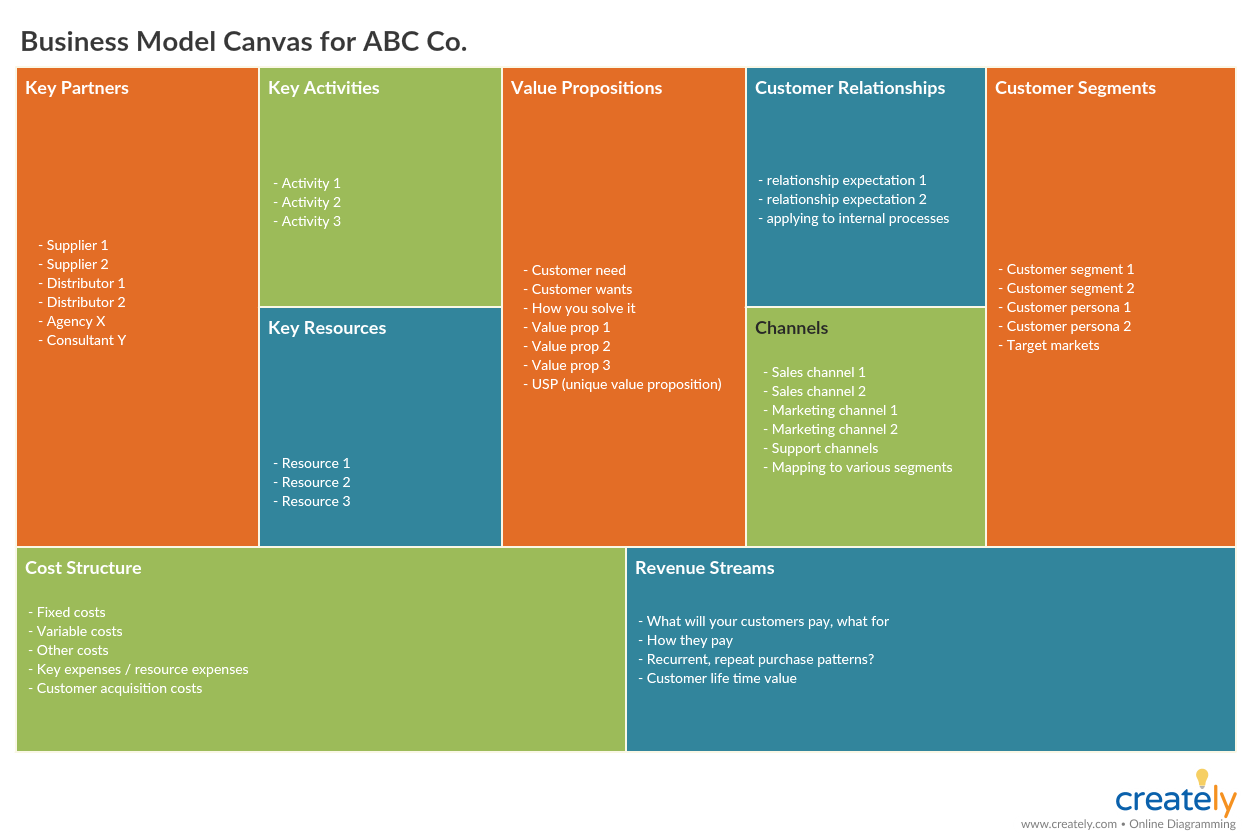
Business Model Canvas (Click the image to edit online)
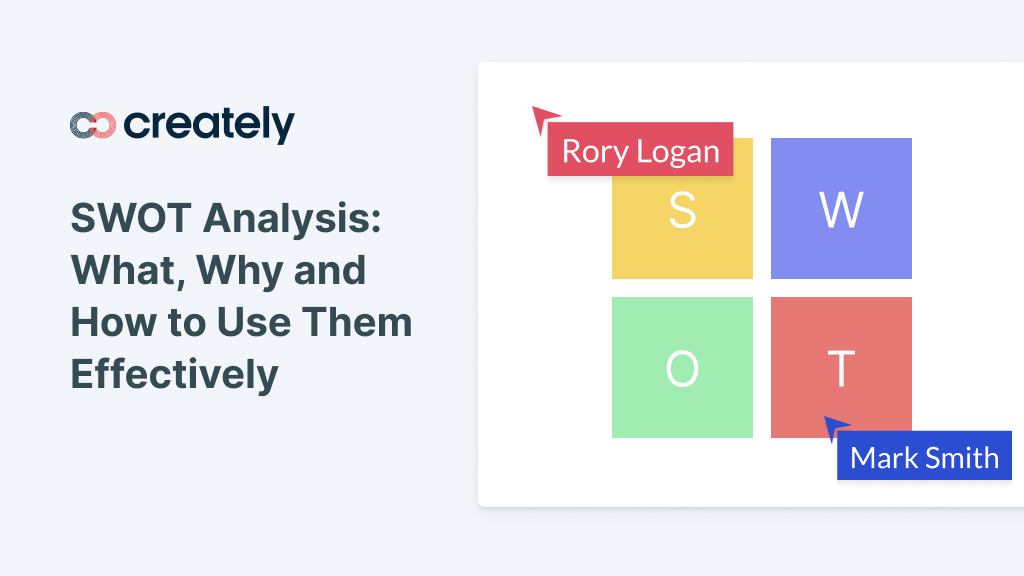
Analyze: SWOT Analysis
SWOT can help you analyze your business from a strategic perspective. It will help you identify how to capitalize on your opportunities using your strengths and how to avoid the threats and eliminate weaknesses.
What is it
SWOT is an effective business planning tool used in businesses to form strategies. It helps analyze internal factors (Strengths & Weaknesses) that affect and external factors (Opportunities & Threats) that may have an effect on an organization.
How to use it
Check out this SWOT analysis tutorial to learn how to use it in strategic marketing planning
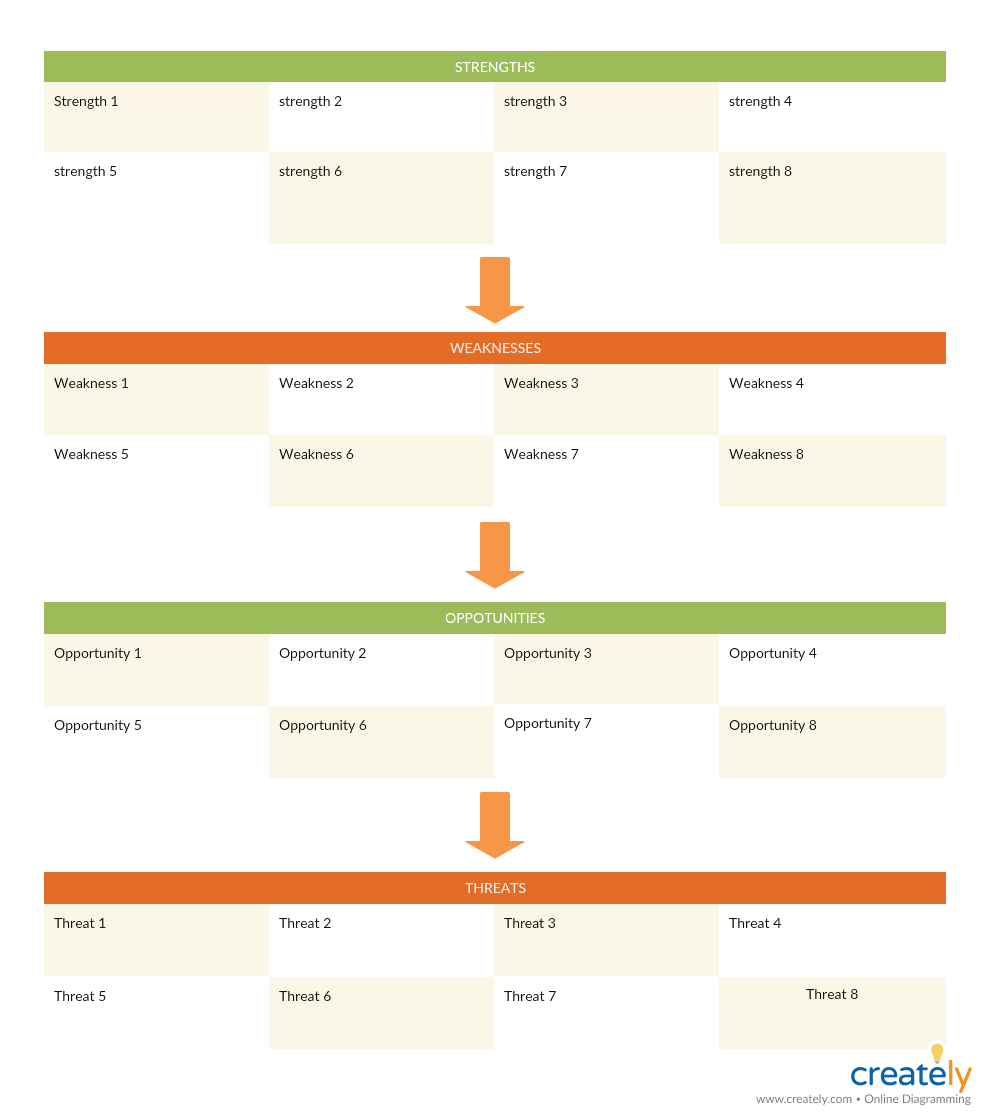
SWOT Analysis Template (Click on image to edit online)
Analyze: Porter’s Five Forces Analysis
Porter’s five forces analysis has proven a useful strategic planning tool in both business and market-based planning, especially when it comes to understanding the level of competitive intensity within the industry.
What is it
The Porter’s five forces analysis assesses levels of profitability, opportunity, and risk based on 5 key factors in an industry.
- Suppliers
- Buyers
- Entry/Exit Barriers
- Substitutes
- Rivalry
Its uses
- To analyze the attractiveness and profitability of an industry sector
- To observe the strength of a market position
How to use it
This model helps identify the competitive forces that exist within an industry. In turn, these forces help determine the attractiveness and the profitability of the industry.
Supplier power
This force looks at the power the supplier holds over businesses.
- Look into how many suppliers there are in the market
- How many suppliers do you have?
- Do your suppliers hold the power?
- What is the cost to you and them if you decide to switch suppliers?
- Are there a lot of suppliers who control the prices?
Buyer power
This force looks at the power the buyer holds over your business.
- How many buyers are there?
- How many buyers do you have?
- How price-sensitive are your buyers?
- What information do you have on them?
The threat of new entrants
This force examines how easy or difficult it is for new competitors to enter the market.
- How easy is it to start a business in your market?
- What are the rules and regulations you need to follow?
- How much money would a new startup have to spend?
- Are there any barriers that would give you greater power?
The threat of substitute products/ services
This force looks at how easy it is for a customer to switch from one business’s product to that of a competitor.
- How many substitutes to your product are out there?
- How easy it is for your buyer to switch to another product?
- Is there a cost to your buyer for switching?
Competitive rivalry
This force studies the intensity of the competition in the current marketplace.
- What is the competition level in market sector?
- Who are your main competitors?
- Roughly how many competitors do you have?
- What is your competitive strategy?
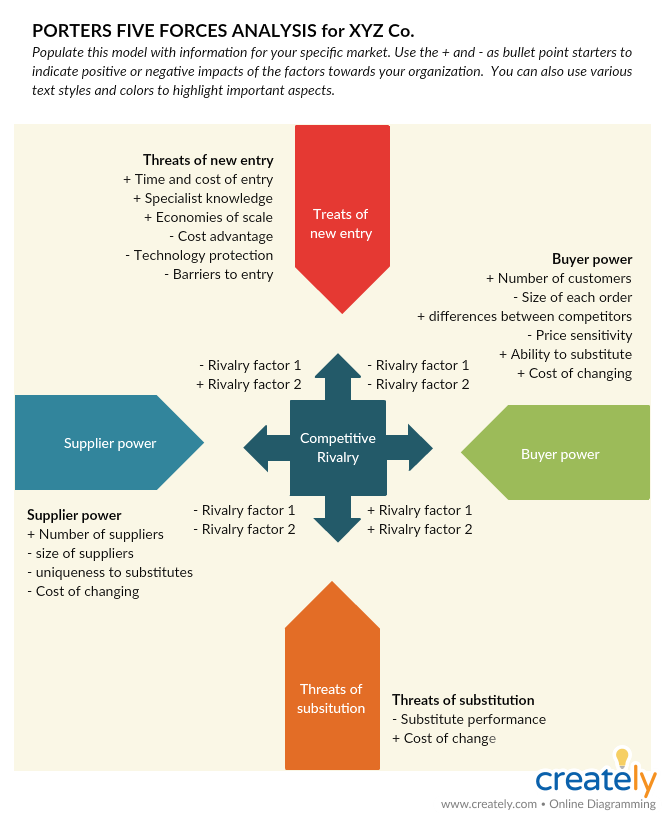
Porter’s Five Forces Analysis Template (Click on the image to edit online)
Analyze: Customer Journey Map
Customer journey mapping is a great way to visualize the user experience that helps when creating future marketing strategies.
What is it
A customer journey map is basically a story of the customer experience. It maps the steps the customer takes when engaging with a company. The more touch points the interaction has the more complicated the map may become.
Its uses
- To identify the key interactions the customer has with a company
- To understand the user’s feelings, motivations and expectations
- To create an overview of the customer experience
- To identify opportunities to enhance the customer experience
How to use it
Step 1: Get to know the user
If you already have created user personas, great! If you don’t, then get started! In order to map the journey of your user, you need to know who the person is first.
Step 2: Gather data
Whether yours is a brick and mortar store or an online shop, there are ways to identify the touchpoints your customers would go through before buying your product or service. Using the correct tools, collect all the necessary data.
Step 3: Map it out
There is no single right way to do a customer journey map. Your company can find something that works for you, even if it is a flowchart or a flow map like the one below.
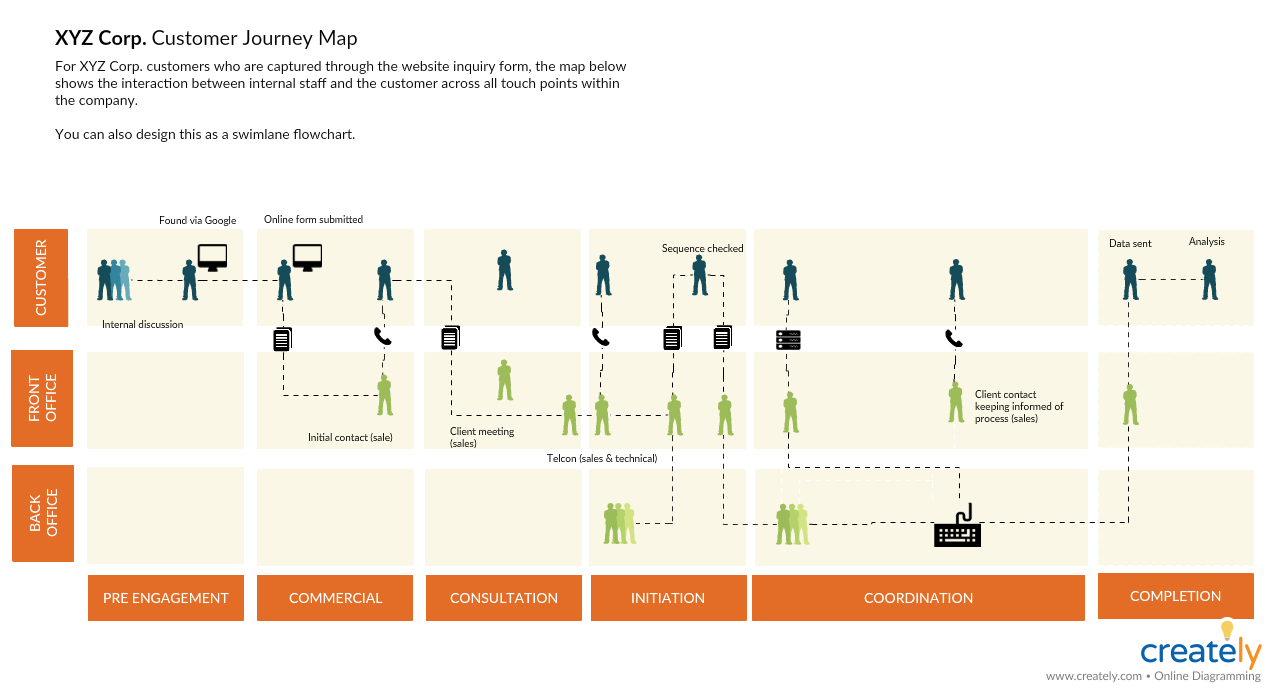
Customer Journey Map Template (Click on the image to edit online)
Analyze: Perceptual Map/ Positioning Map
Marketers use perceptual maps to compare products and determine their positioning in the market based on how customers perceive them. During the product development process, a perceptual map can be used to identify new products.
What is it
A perceptual map is a marketing planning tool that shows how the average target market consumer understands and perceives the positioning of competing products in a marketplace. Picking the right dimensions to measure positions in the market is important. It is recommended that you draw multiple positioning maps for the same market to understand it fully.
Its uses
- To understand what customers think of your product
- To identify how customers perceive your competitor’s products
- To assist with building competitive strategy, brand strategy and communication strategy
- Identify where a company can position a new brand
- Identifying market opportunities
How is it used
Step 1: Determine what you want to learn from it
Before you create a perceptual map, it helps to have decided what you want to learn from it eventually. Do you want to know where you stand against your competitors in the market? Or do you want to identify new opportunities for growth?
Step 2: Gather necessary data
To create a conceptual map you need data and data variables to display on the map. You can get this from a reliable source such as consumer reports, or from a research or survey that you’ve done yourself.
Step 3: Draw the map
Next is to display the data you’ve gathered on the map. There are multiple types of perceptual maps. You can edit the following perceptual map template online and enter your data by simply clicking on it.
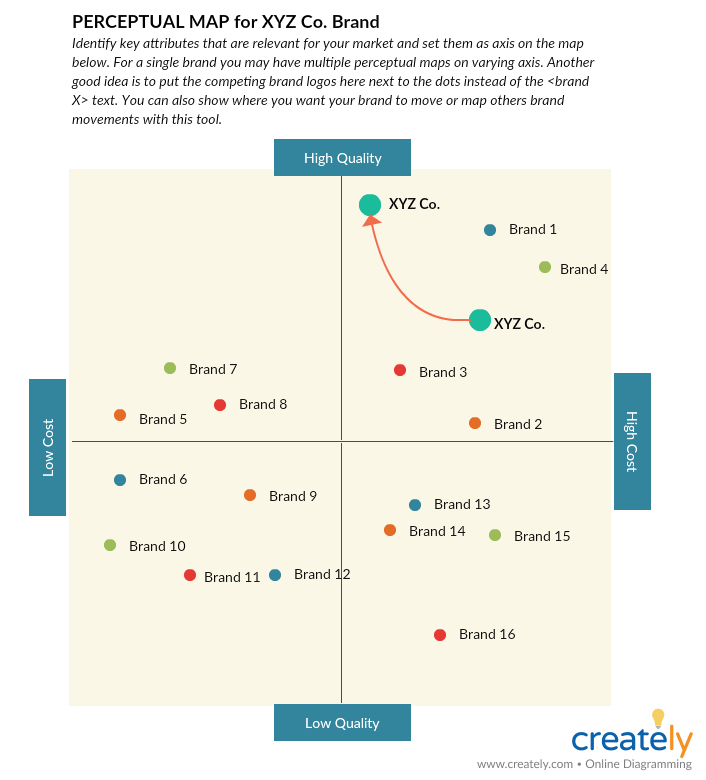
Perceptual Map Template (Click on the image to edit online)
Analyze: BCG Matrix
The Boston Consulting group’s product portfolio matrix is designed to help with long-term strategic planning. It is usually an essential section of a strategic plan or a marketing plan.
What is it
The BCG matrix is a framework for analyzing products according to growth and market share. It helps companies gain insight into what products they should capitalize on to grow their market-share opportunities.
Its uses
- To identify means by which companies can maximize their corporate performance
- To improve the desired distribution of resources
- To evaluate product lines to identify which are more profitable
How to use it
Step 1: Collect necessary data
Collect data on your market share and the growth rate of your products. You need to compare yourself with your direct and largest competitor when examining the market growth.
Step 2: Show data on the BCG matrix
While the horizontal line shows the market share, the vertical line represents the growth rate. Place each of your products on the designated box based on where they rank in market share and growth.
Dogs: represent products of a business that has a low growth rate and low market share
Question Marks: represent businesses that have a small market share in a fast-growing market
Stars: represent businesses that have a high market share and growth rates
Cash cows: represent businesses that have high market shares but which are not expected to grow fast
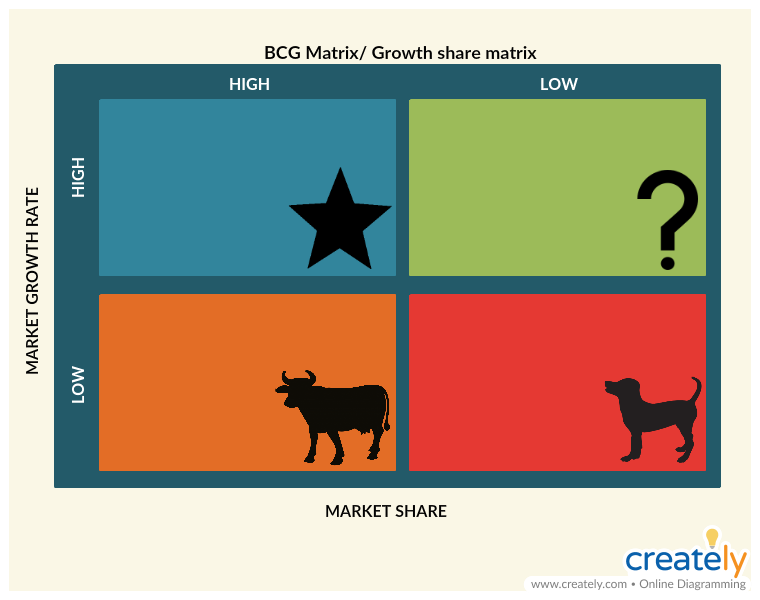
BCG Matrix (Click on the image to edit online)
Analyze: Marketing Segmentation Chart
Marketing segmentation plays a major role in target marketing. Opposed to mass marketing, target marketing allows marketers to deliver personalized solutions to specific needs of customers.
What is it
Marketing segmentation is the process of breaking down a wide market into smaller homogeneous groups of people based on similar characteristics, wants and needs.
Its uses
- To personalize marketing campaigns
- To identify the different needs of customers
- To create better solutions that suit the needs of different users
How to use it
Step 1: Define the market
It’s important to clearly define the market of interest first. Identify the market’s geographic boundaries as well.
Step 2: Create market segments
This is where you identify the different types of consumers that are in this market. You can separate them based on their purchasing behavior, age group etc.

Market Segmentation Chart Template (Click on image to edit online)
Strategy: Segment Attractiveness and Resource Strength Framework by Hooley
This framework is designed to assess the attractiveness of a market segment before deciding which market to target.
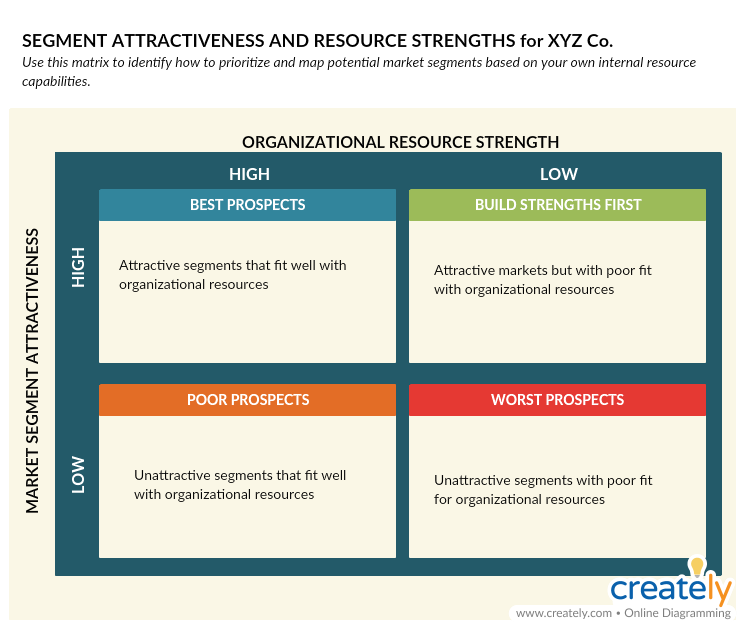
Segment Attractiveness and Resource Strength Framework (Click on image to edit online)
Strategy: Keller’s Brand Equity Model
Keller’s brand equity model helps marketers build a brand and manage a brand that customers will strongly feel about and support.
What is it
The brand equity model is also known as the CBBE (Customer-Based Brand Equity) model. It shows how to understand the customer and how to build strategies accordingly. According to it, in order to build a solid brand, you must first shape how your customer feels about your product.
Its uses
- To identify which strategies to implement
- To give the right experience to the customers to retain and sustain them
How to use it
In order to build a strong brand equity, you need to follow four steps,
Step 1: Build brand awareness
The first step is to get your target market to notice your brand – really become aware of it. While you need to stand out from your competitors, you need to know who your customer is in order to really get their attention.
Step 2: Identify what your brand means
Here ‘performance’ means how well your product meets the needs of your customers, while ‘imagery’ means how well your brand meets the needs of your customers on a social and psychological level. Determining these will help you create your brand personality.
Step 3: Identify your customer’s response to your brand
Your customers may judge your brand according to its quality, credibility, consideration and superiority. And they may respond to it based on 6 positive brand feelings (warmth, fun, excitement, security, social approval, and self-respect).
Identify how you can improve your brand based on the 4 categories of judgments and come up with strategies to enhance the 6 brand feelings of your customers.
Step 4: Improve the connection your customer has with your brand
In order to increase the bond your customer has with your brand, you can run loyalty programs, promotions, give away gifts etc. The goal is to get your customers to be involved with your product even when they are not purchasing it or actively consuming it.
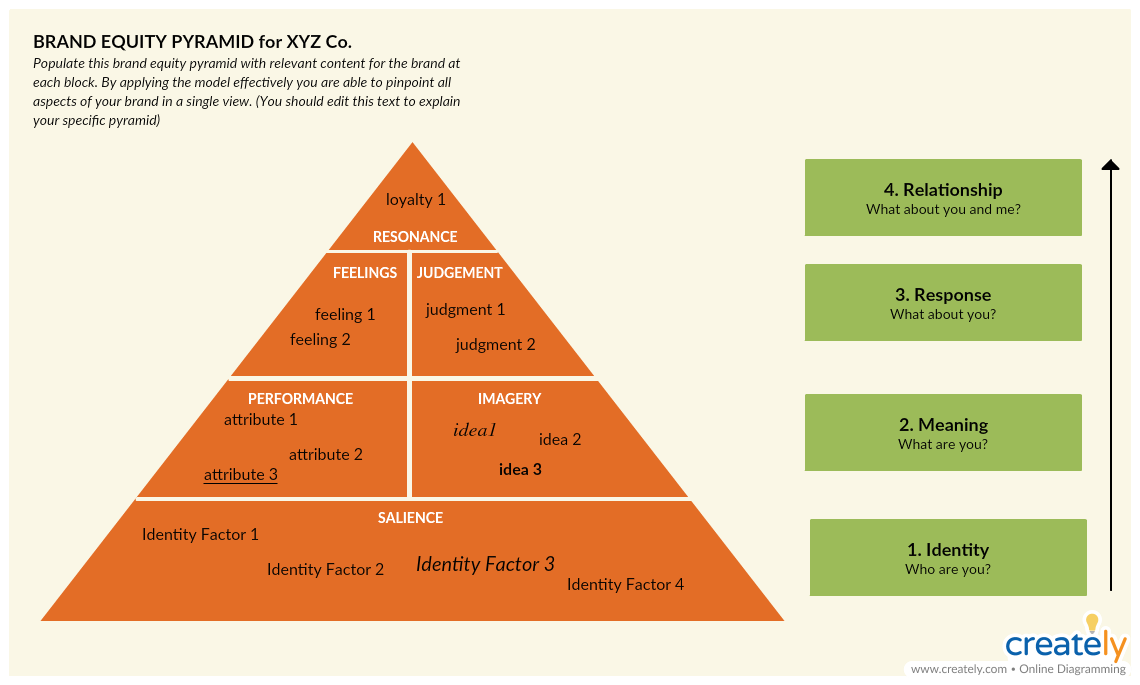
Brand Equity Model Template (Click on the image to edit online)
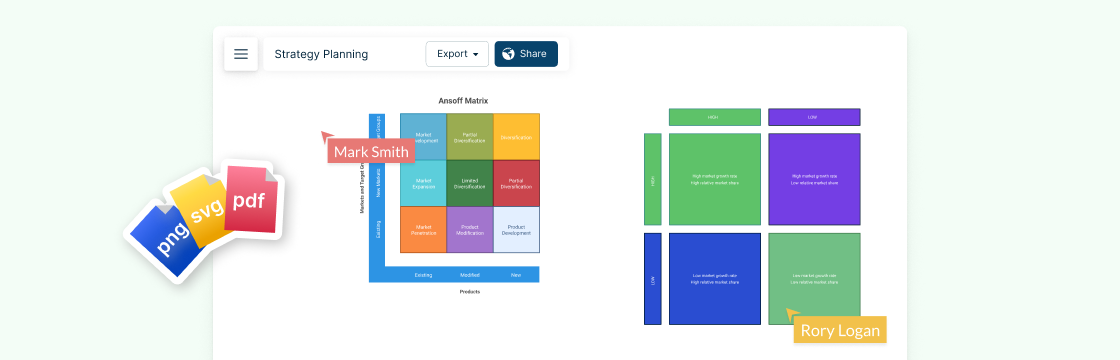
Strategy: Ansoff Matrix
The Ansoff matrix is an essential strategic marketing planning tool. It can be applied to identify possible growth strategies for your company.
What is it
Ansoff matrix is a marketing planning tool that helps businesses when developing their product and market growth strategy. The Matrix has 4 different growth strategies; Market Penetration, Market Development, Product Development, Diversification.
Its uses
- To identify opportunities to grow revenue for a business
- To evaluate opportunities for companies to increase sales
- To determine a company’s product and market growth
How to use it
As the diagram shows the matrix gives marketers four possible scenarios/ strategies for marketing efforts and future products. Depending on the stage of your business, you may be executing one or more of these four strategies.
Market penetration
This is where the firm aims to grow with existing products in its current market
- How to sell more of your existing products to your current customers?
- How can you defend your market share?
- How can you grow your market?
Market development
Here the firm aims to grow by selling its existing products to new markets.
- How can you expand into new markets?
- Is it through new market sectors?
- Is it through new geographical areas?
Product development
The firm develops new products targeted to its existing market.
- How can you grow your product portfolio?
- What new products can we build?
- Can we modify our existing products?
Diversification
Here the firm aims to transform itself into a new business by developing new products for new markets.
- Do you have enough resources to target a new market?
- What sort of market would you target? Is it something you are familiar with or completely new to you?
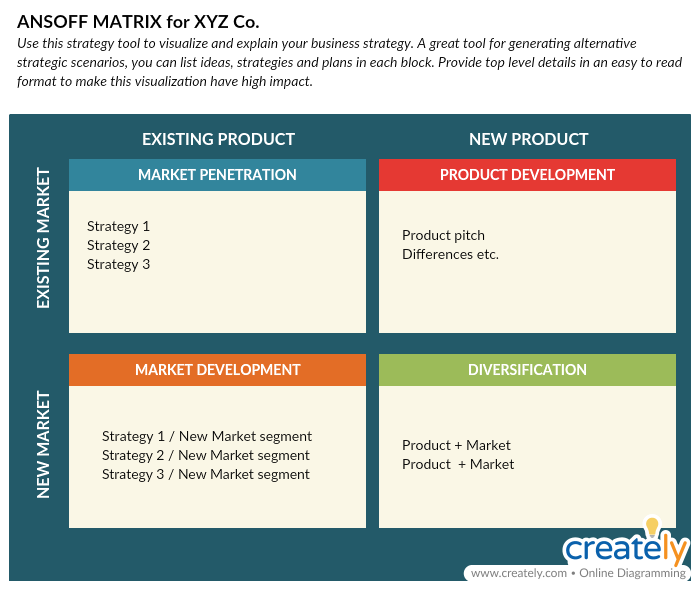
Ansoff Matrix Template (Click on the image to edit online)
Strategies; Brand Identity Prism
Kapferer brand identity prism shows how to build a strong brand story and give the brand a recognizable identity based on six important facets of brand identity.
What is it
According to Jean-Noel Kapferer’s Brand Identity Prism, a brand’s success is driven by a company-wide utilization of the following elements; physique, personality, culture, relationship, self-image, and reflection.
Its uses
- To evaluate the strengths and weaknesses of a brand
- To identify areas in branding that need improvement
- To come up with effective branding/ marketing strategies
- To eliminate marketing techniques that may not align with your brand image
How to use it
A company that can maintain a combination of all the six traits will be able to build a stronger brand personality.
- Physique – physical characteristics and iconography of a brand
- Personality – a brand’s tone, design assets and its copywriting
- Culture – the value system and the principles
- Relationship – the relationship between the brand and its customer
- Self-image – the ideal self of the customer or how the customer perceives herself/ himself
- Reflection – the stereotypical user of the brand
Using the template below, you can see how your brand meets each of these traits.
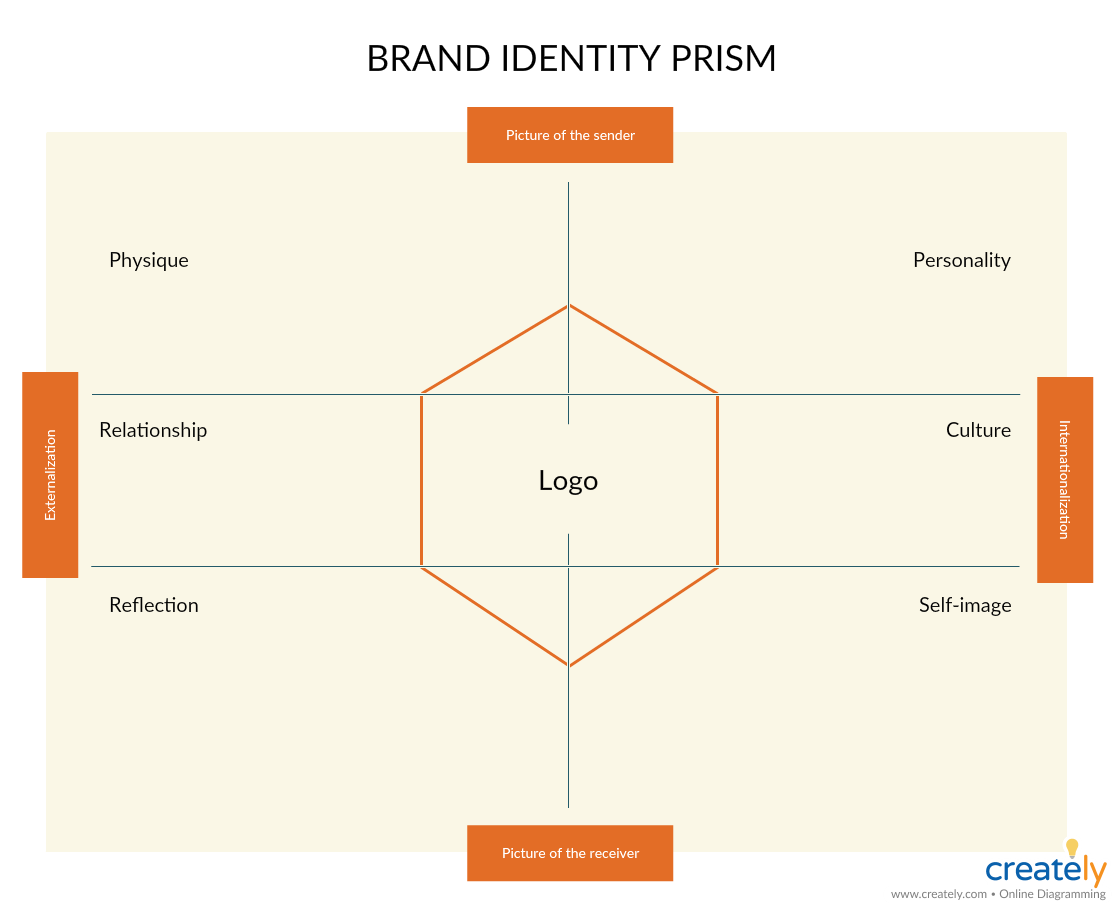
Brand Identity Prism Template (Click on the template to edit online)
Strategy: Customer/ Strategy/ Resource Matrix by Hooley
You may have different strategic positioning options, and this simple structure helps you visualize multiple options from the perspective of how you target customer segments, needs and wants with various strategies underpinned by the relevant resources.
Mapping multiple strategic options will help you compare and contrast strategic choices so you can drive towards the most viable option.
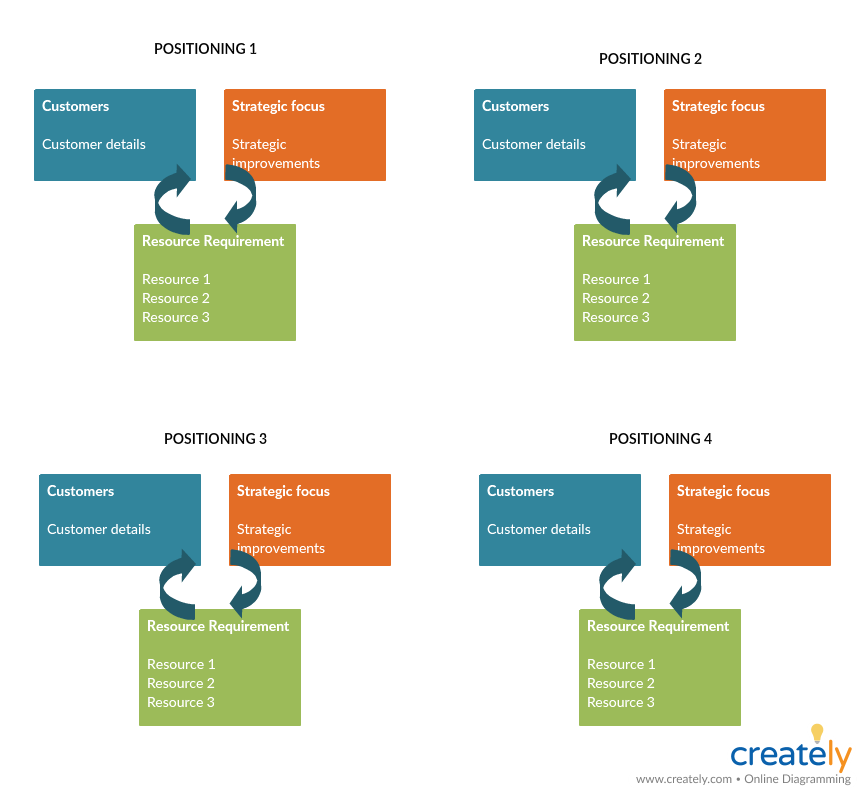
Business Model to Support Competitive Positioning (Click on the image to edit online)
Control: Marketing Data Dashboard
Marketing data dashboards are handy reporting tools when it comes to discussing and analyzing progress you’ve made over time in your marketing campaigns.
What is it
A marketing data dashboard is a visual summary of marketing KPIs (key performance indicators) and metrics. It displays analytical data in a simplified version that is easy to read and understand.
Its uses
- To quickly assess key metrics
- To track metrics and act on data to improve performance
- To anticipate results on campaigns
- To help facilitate strategic decisions and suggest campaign adjustments
How to use it
Step 1: Select the metrics you want to display
Not all the data from all the campaigns can be added to one dashboard. You may maintain separate dashboards for different campaigns, and as such select the different types of metrics or KPIs you want to highlight to your stakeholders or team.
Step 2: Select the type of charts/ graphs
Whether it is the number of visitors to your site or the rate of conversion, you need to select the correct visual tool to represent the data.
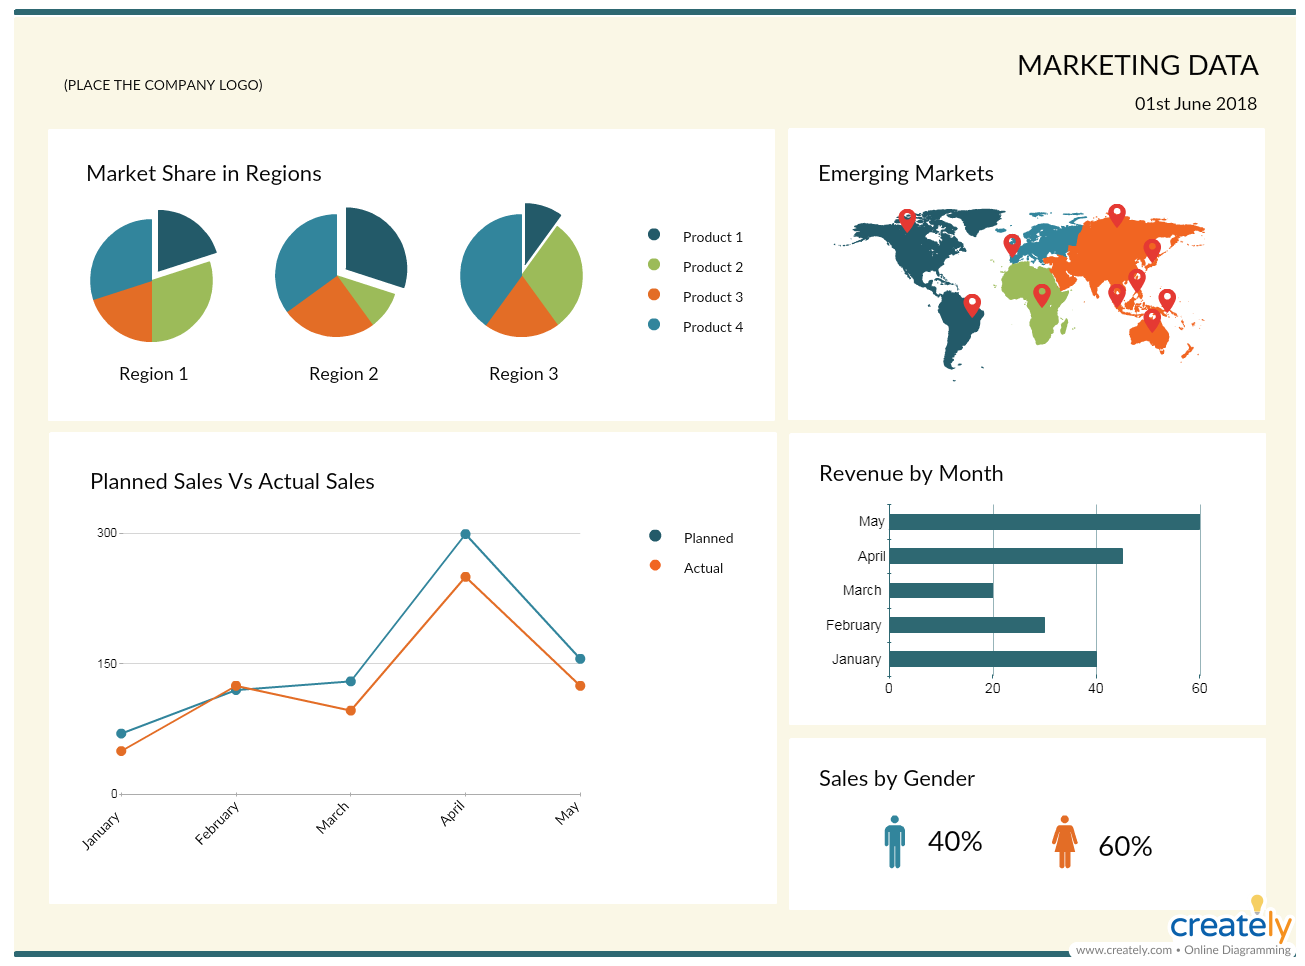
Marketing Data Dashboard Template (Click on the image to edit online)
Control: Balanced Scorecard
The balanced scorecard is a handy tool strategic marketing managers can use to control and monitor key performance indicators.
What is it?
A balanced scorecard is a business framework or a management system that is used to track and manage a company’s strategy. BCs are widely used in businesses, governemnets and nonprofits.
Its uses
- To communicate what a company is trying to accomplish
- To determine which projects, products or services to prioritize
- To track and measure their progress towards their goals
- To align the daily work everyone does and the business activities with the company strategy and vision
How to use it
Step 1: Identify the vision of your company
The scorecard starts with the center where the vision of the company is elaborated.
Step 2: Add perspectives
A balanced scorecard contains 4 perspectives (Financial Perspective, Learning and Growth Perspective, Business Process Perspective and Customer Perspective) and they are placed in a ring around the center.
Step 3: Add objectives and measures
Under each perspective write down the relevant objectives, measures, targets, and initiatives.
Step 4: Show that everything’s connected
Show that each perspective is interconnected and plays a vital role in a company’s vision by linking them with arrows.
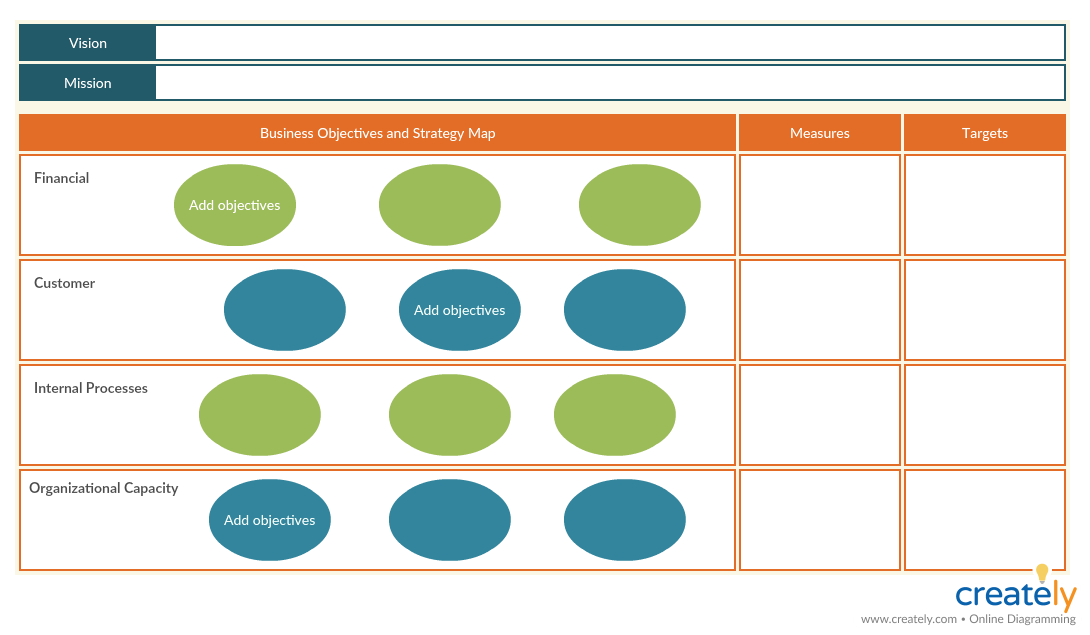
Balance Scorecard Template (Click on the image to edit online)
Add to the List of Marketing Strategy Tools
Want to expand our list of marketing strategy tools? Feel free to mention those tools that you usually use (and we haven’t already covered here) in the comment section below.
Struggling with your marketing plan? We’ve got you covered. Our comprehensive guide to creating a marketing plan touches on various useful tools that you can use to accelerate your marketing planning efforts.


I really liked your presentation of this topic. I am putting together an online course course that covers advanced topics that are peripheral to marketing strategy but want the student to have exposure to these ideas if they haven’t in the past. I have put one slide of five of your tools and request permission to use the five graphics. I put the link to your website on the first slide and kept your graphics with the prominent “Creately” brand. It seems like a win-win. I use a few graphics and my students (potential Creately clients) get exposed to your website, read about the details of these five tools, and have my assurance of your quality content.
Can you send me formal permission to use the five graphics?
Scott
K. Scott Swan, Ph.D.
Head of Marketing & Innovation Area
David L. Peebles Prof. of Business, Chair
2015-2016 Hall Chair, Fulbright-Austria WU
Raymond A. Mason School of Business
William & Mary
P.O. Box 8795
Williamsburg, VA 23187
(757) 221-2860 work
(757) 221-2958 fax
(757) 532-4964 cell