Business Diagram Software
Visualize Business Data and Unlock Insights In Minutes
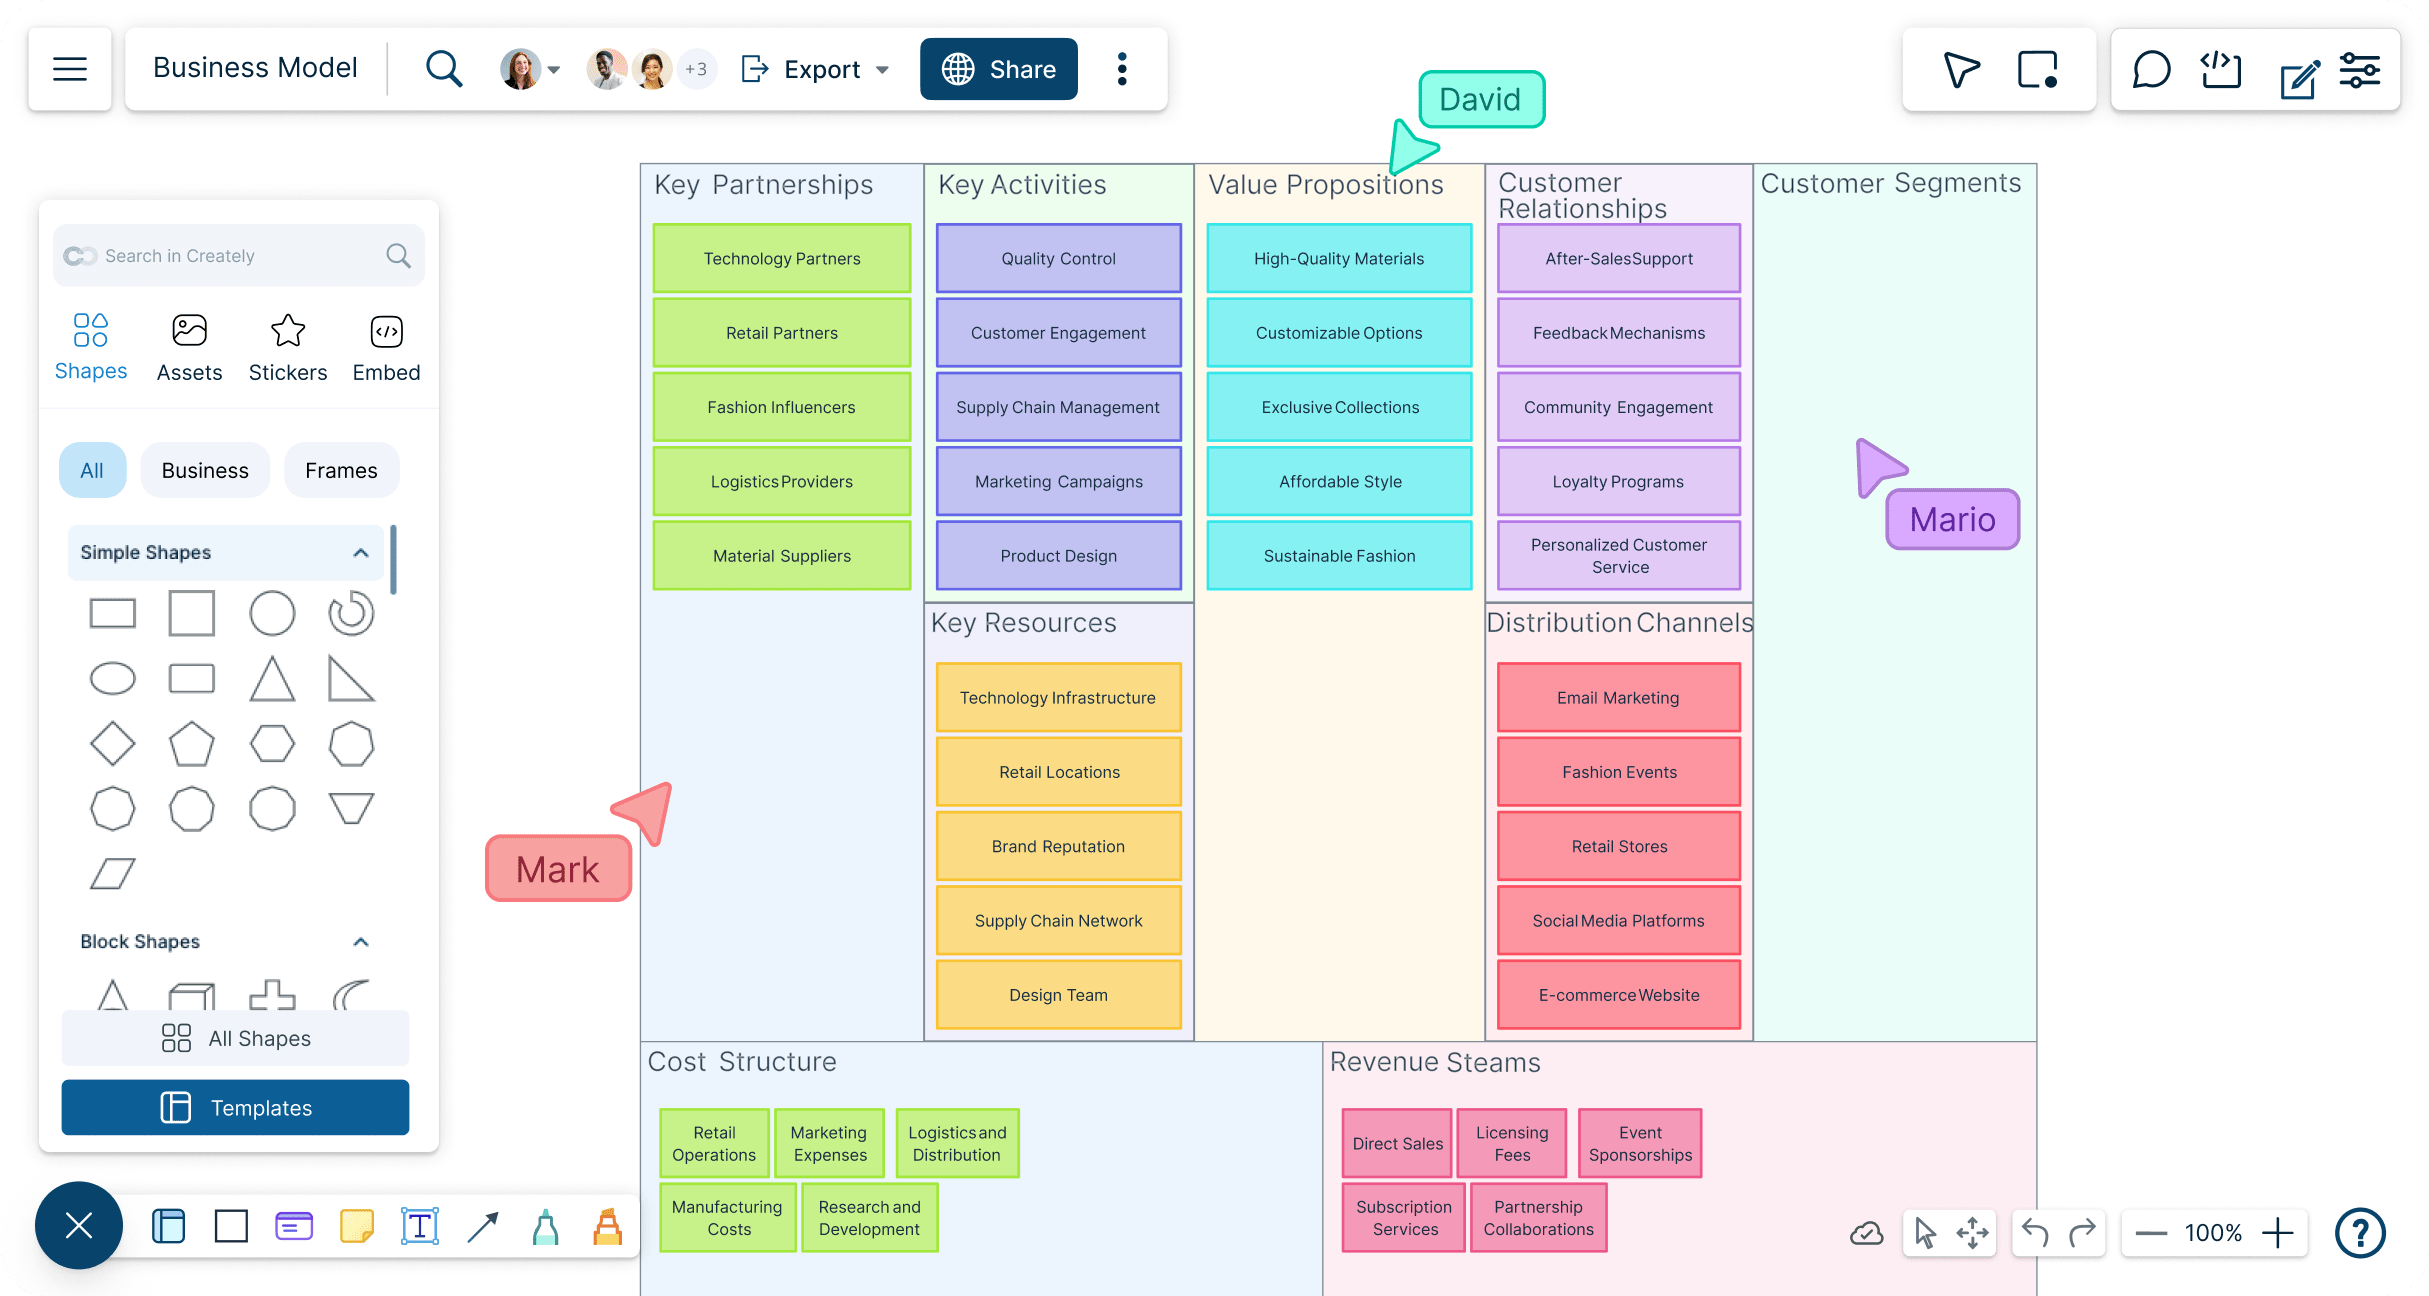
Bring together business data, processes, and information on a single free online business diagram software. Use easy and efficient diagramming to analyze, discover breakthrough insights, and make informed strategic decisions with your team.
Intuitive business diagramming tools to visualize ideas, processes, and solutions faster
Real-time collaboration to connect teams across the globe
Seamlessly integrate workflows across your organization with business mapping software


 Diagramming Visual Collaboration Org Chart


Discover Insights Faster with Business Diagramming Tools

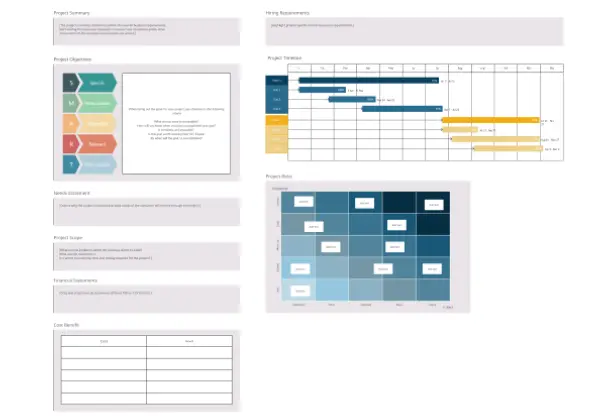
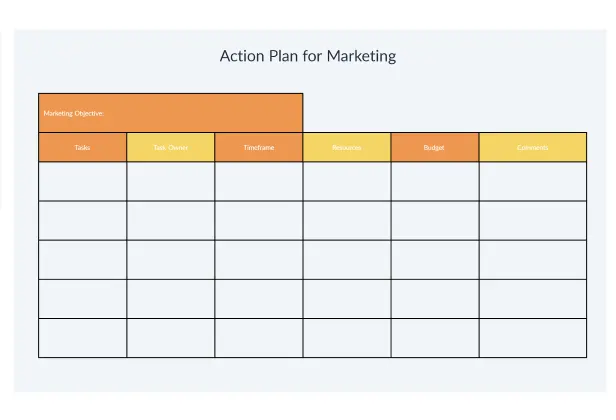
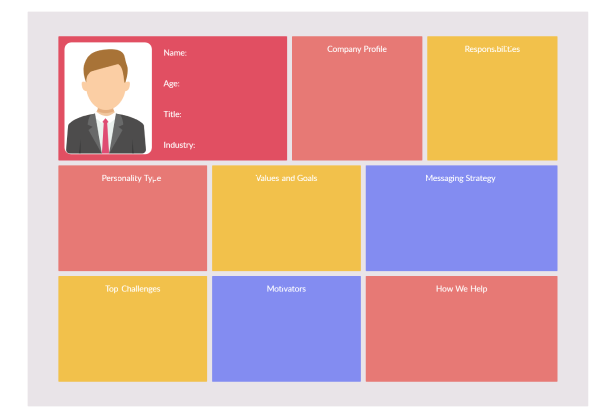
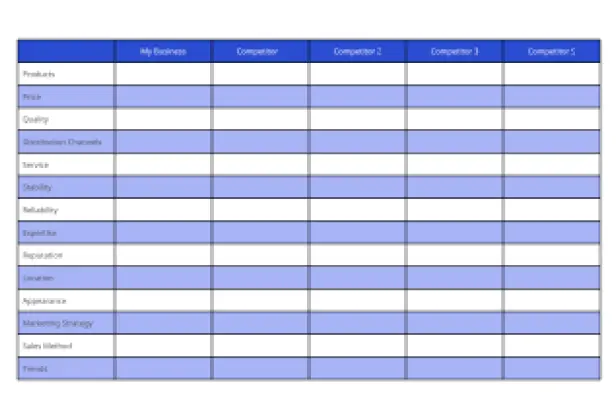
Plan, strategize, and ideate faster with free templates for 100s of business use cases.
Run structured brainstorming sessions with an interactive online whiteboard.
Migrate business intelligence data from any sources to visualize for quick analysis.
Freehand drawing to assist with visualizing strategies and freehand note-taking.

Easily Visualize Your Business Concepts With Powerful Business Mapping Software
Make simple to complex business diagrams instantly with easy drag-drop tools.
Customize your business diagrams instantly with quick custom styling options.
Create flowcharts, org charts, VSMs, SWOTs, & more with professional shape libraries.
Better arrange business data by diagramming business processes efficiently

Create interactive presentations, reports, & dashboards for strategies and plans.
Add more context to your business plans with imported images, screenshots, and more.
Centralize all business information in a single location with integrated notes.
Export your business diagrams as PDFs, PNGs, or SVGs to share or publish.

Connect All Teams Across the Board with Business Diagram Software
Facilitate team business discussions and decision-making on a shared canvas.
Integrated commenting to share feedback and for async collaboration.
Keep track of each iteration of your workspace with full version history.
Stay updated on the changes other stakeholders make with smart notifications.
What is a Business Diagram?

How to Create a Business Diagram Using Creately's Business Diagram Software
Open a Business Diagram Template
Launch Creately and select a ready-made business diagram template from the template library. You can also open a blank workspace and use Creately’s business diagram maker tools with shape libraries to create your own custom diagrams from scratch.
Add and Organize Content
Use sticky notes, the notes panel, or post-it walls on the canvas to capture ideas and business elements discussed during your analysis and brainstorming sessions.
Customize Your Business Diagram
Modify the business diagram template using the gathered information, then edit and customize it to match organizational requirements and brand guidelines. Apply configurable themes, connectors, and shapes to refine your diagram.
Collaborate in Real Time
Take advantage of Creately’s collaboration features like real-time mouse cursors, synced previews, and comments. Team members can review and suggest improvements while version history lets you track and revert changes.
Share the Business Diagram
Review the diagram with your team, make updates based on feedback, and finalize it. Share securely with stakeholders by exporting in multiple formats or embedding the diagram in any site, intranet, or app.
Create a Business DiagramEffortlessly Visualize Business Strategies with Free Customizable Business Diagram Templates
FAQs about Creately's Business Diagram Tool
What are Creately’s business diagram software pricing plans?
- Free Plan — $0/month for basic business diagram creation and collaboration
- Starter & Team Plans — $8/month or $5/month billed annually
- Business Plan — $149/month or $89/month billed annually
Annual billing helps you save more while unlocking advanced collaboration, workspace management, and enhanced business diagram features. You can compare all available plans and features on the Creately Pricing Page.
How can you create business diagrams faster?
Are there templates for different business diagram use cases?
Can teams collaborate on business diagrams?
Can I add notes, data, and files?
Can I share, present, or export business diagrams?