The goal of every organization is to reach its peak performance level efficiently. If you have the necessary tools and techniques to identify performance issues, isolate the root causes, improve processes and provide the right employee performance interventions, this could be done in a cost-effective manner.
That’s what we are targeting in this post by trying to introduce you to several visual techniques that can be used to improve organizational performance.
Problem Solving Tools
Solving problems in a corporate environment takes more time than in any other situation. From finding the problem to implementing the solution and monitoring the outcome, you may need a systematic approach. The following visual techniques will help you simplify this winding process.
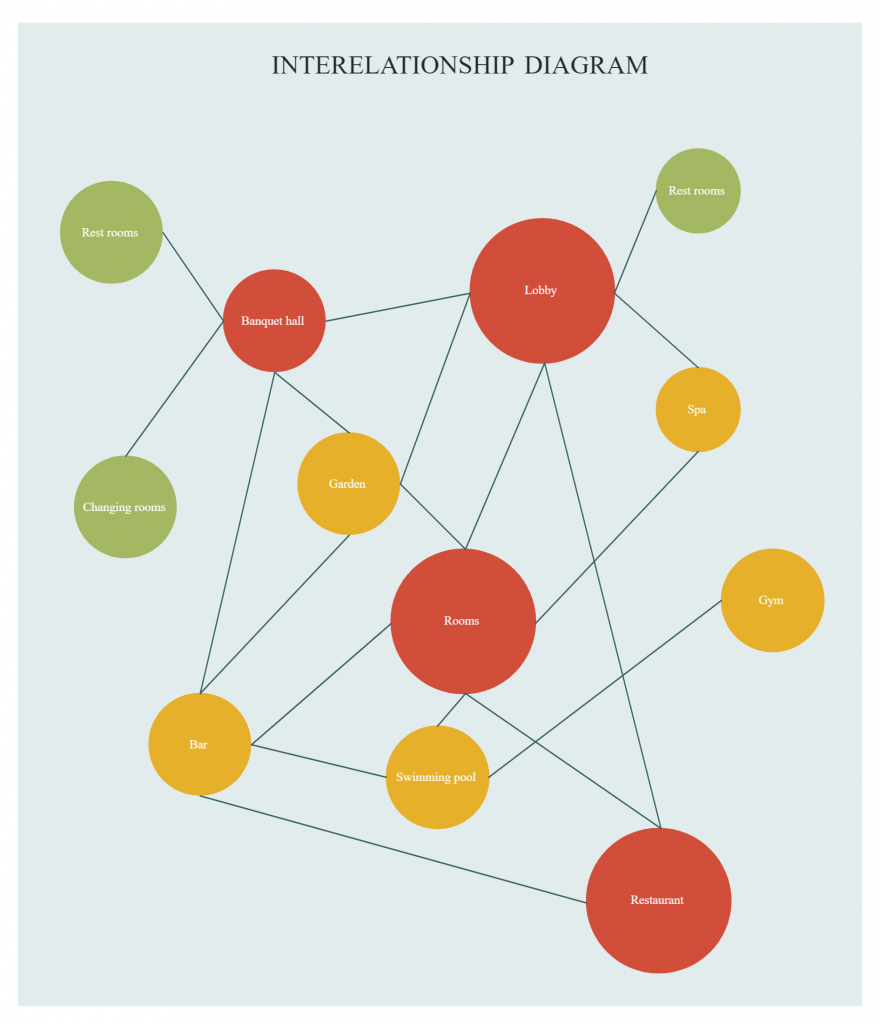
Interrelationship Diagrams
What is it
An interrelationship diagram visualizes the cause-and-effect relationships that exist within a set of issues. If you are trying to figure out the causal relationship behind a problem, this tool could help you out.
How to do it
Step 1: First step is to identify the problem that is slowing the progress of your organization, processes etc. The problem should come at the top of the diagram; to highlight it you can show it in a different color or in a larger size.
Step 2: Brainstorm the reasons that you think might be causing the problem you identified earlier.
Step 3: Analyze the causes your identified and figure out the cause and effect relationship among them. Link causes and effects with arrows. If the influence the cause has on the effect is stronger, highlight it by making the arrow darker. And if the relationship is weaker, you can depict it with a dotted line.
Step 4: Next is to analyze what are the root causes. If a particular cause has multiple arrows pointing out from it, then you can consider it to be a key reason for your problem. And if there is an item that has many arrows pointing to it, then it is a key outcome. Once you know these details, it’ll be much easier for you to come up with a solution.
Root Cause Analysis
What is it
Root cause analysis is another tool that is used to identify the root cause of a problem. It helps you get to the bottom of an issue and find permanent solutions.
How to do it
There are a number of tools available to perform a root cause analysis and they are
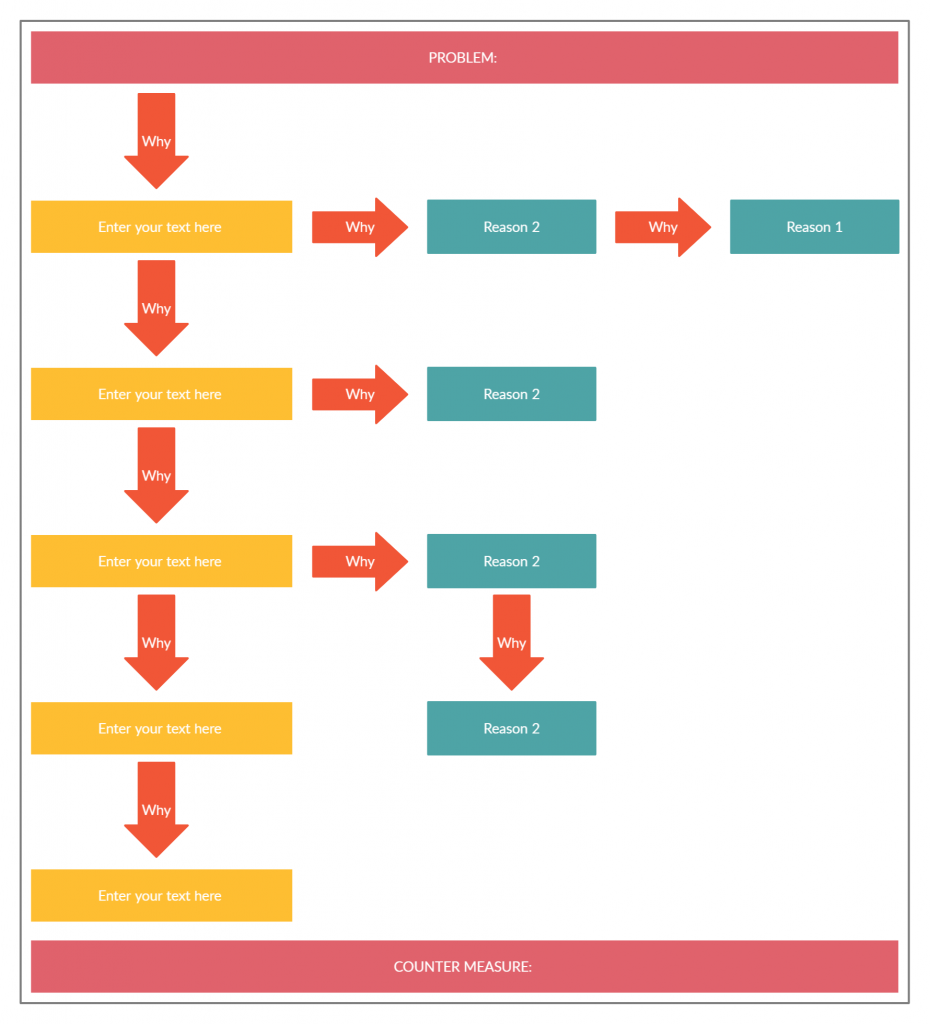
5 Whys
5 whys analysis is fairly easy to do. Once you define your problem, ask your team why it is occurring. Get them to give reasons. Ask why four more times as you dig deep and analyze the cause. You can use a 5 whys diagram template like the one below to record the information for quick reference.
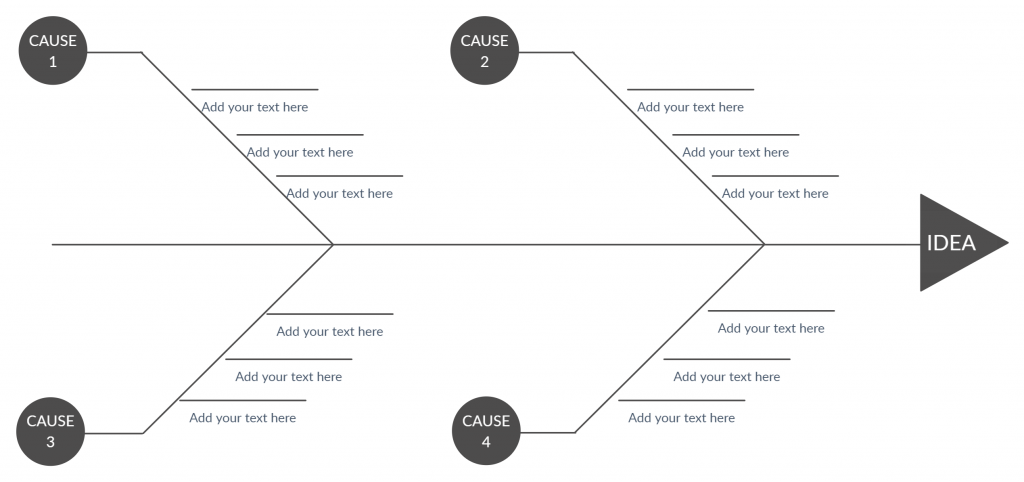
Fishbone diagram (Ishikawa diagram/ causes and effect diagram)
Refer to our Ultimate Guide to Fishbone Diagrams to learn everything you need to know about the diagram type. Once you are ready, you can use a fishbone diagram template like the one below to carry out your root cause analysis.
Affinity Diagrams
What is it
An affinity diagram is a brainstorming technique used to organize a large number of information/ data by grouping similar or related ideas under one theme. And it’s a great way to explore a problem collaboratively with a team.
How to do it
Step 1: Define the problem you need to find a solution to. If you have a clear problem statement (i.e. how can we speed up our projects), it would be easier for your team to suggest ideas.
Step 2: Get your team to think and come up with ideas to solve the problem. They can present their own ideas or talk to each other and present ideas as a group.
Step 3: Categorize or group your ideas for easy analysis. You can use an interrelationship diagram, fishbone diagram or the 5 whys analysis to further find the root causes for the problem you are analyzing here.
Process Improvement Tools
When it comes to cost reductions, service enhancements, increased productivity, and quality improvements, process improvement is the key. The following visual tools we are about to look at will help you assist with your process improvement projects.
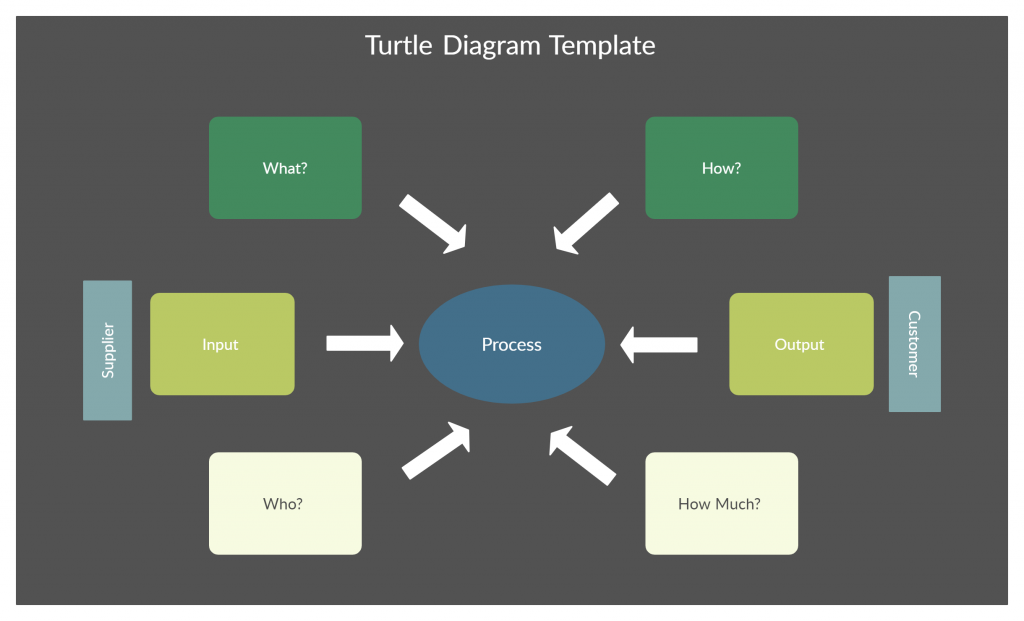
Turtle Diagrams
What is it
Turtle diagrams is a quality tool that visualizes the elements of a process such as who is involved, inputs, outputs, resources etc. It helps to understand the process from both a managerial and workforce perspective.
How to do it
Here’s how to fill in each box of the turtle diagram
Inputs – Here you should mention all the inputs or resources such as documents, information, material that you will need to carry out the process.
Outputs – What are the end result of your process? This might include the final product, documents, and records.
Who is involved – In this section, you have to mention the process owners, and the human resources necessary to complete the process.
With what – Here you need to list down the non-human resources needed to carry out the process
Process/ How is it done – This is where you add references to documents that tell people how to carry out each step
Measures – Mention the performance indicators that will help you determine whether the process is a success or a failure
For a comprehensive list of process improvement techniques that covers Lean and Six Sigma tools, refer to our Easy Guide to Process Improvement Methodologies.
Strategic Planning Tools
Strategic planning is your best bet at a competitive advantage and better organizational performance. The following strategic planning tools take a visual approach, and they help to form and implement strategies effectively.
Scenario Planning
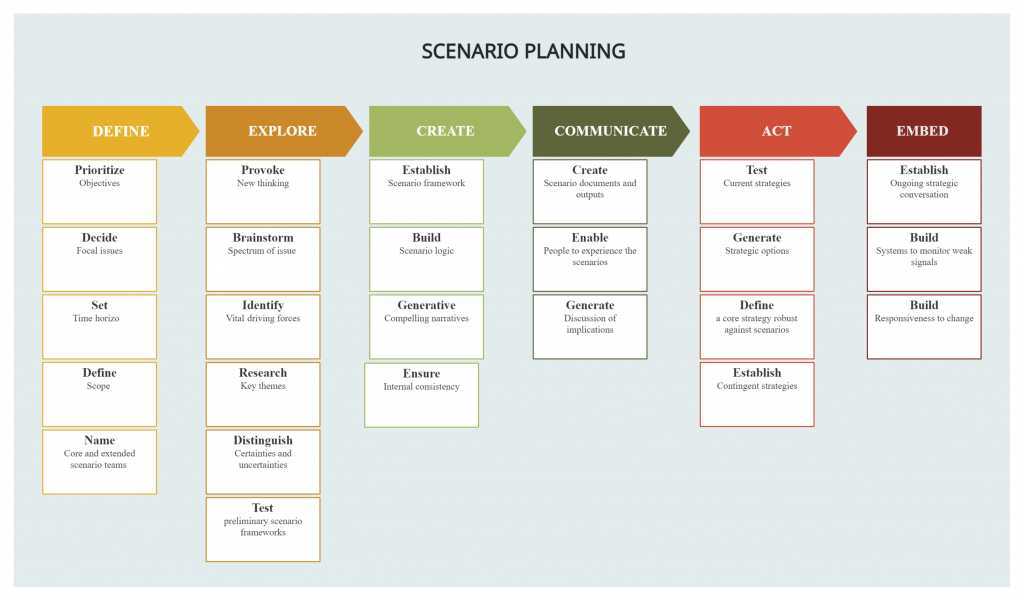
What is it
Scenario planning is a tool that you can use to make assumptions about the future and how your organizational environment will change accordingly. Basically, with scenario planning, you can picture different realities your business can be facing in the future. This will help you come up with responses to successfully face each alternative reality.
How to do it
For a detailed guide on how to carry out a scenario planning exercise, refer to this article.
Step 1: Identify the driving forces of your business such as the shifts in the economy, technology etc. Be mindful of the internal changes that may have an impact on your company as well. Take into consideration all drivers, including those that you think might affect the growth of your company, and list them down.
Step 2: What uncertainties have the severest impact on your company? Pick two uncertainties that you think will have the most serious impact on your company.
Step 3: Form a matrix with the 2 uncertainties as the axis and the business drivers. With the matrix, you can come up with four plausible scenarios that will help you in making decisions regarding your business’s future.
Step 4: Finally, you and your team can discuss how you should respond to each of these scenarios.
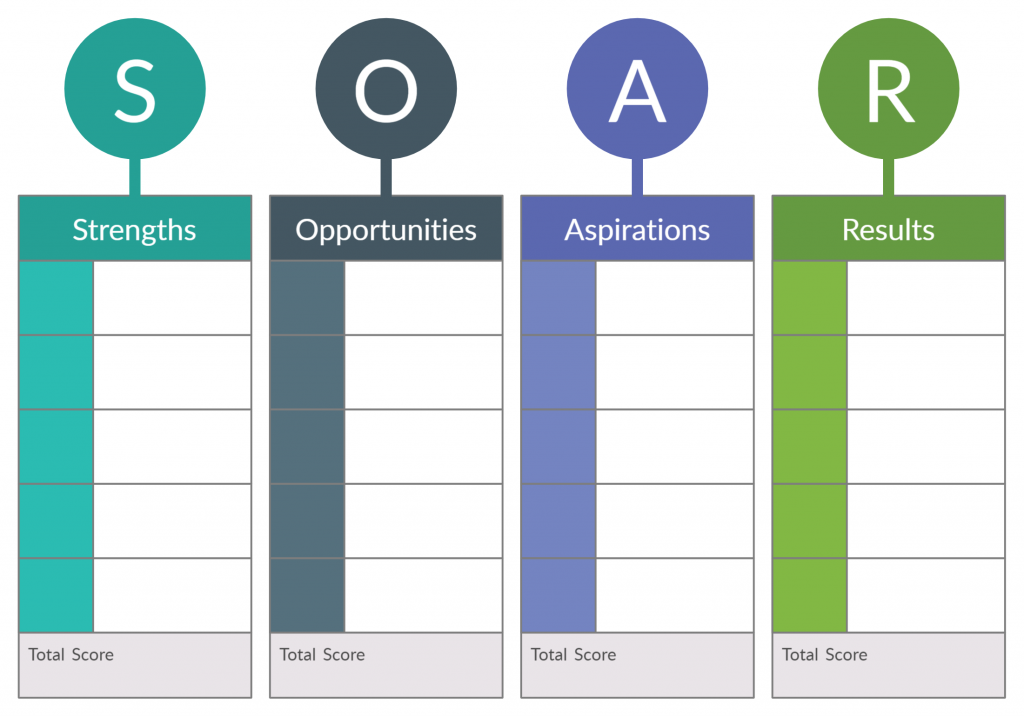
SOAR Analysis
What is it
SOAR stands for Strengths, Opportunities, Aspirations, and Results. It’s a strategic planning framework that helps an organization focus on what they are doing well, what should be improved and what stakeholders are most interested in.
How to do it
Step 1: When you are picking your team for the brainstorming session, make sure they come from different departments and have different skills and experience, so you’ll be able to consider a range of perspectives.
Step 2: Create a questionnaire or a guide to refer to when questioning the participants during the session.
Step 3: Together with the team try to figure out the positive conditions that contributed to the success of your company in the past. Identify aspirations and desired results for a successful future.
Step 4: Identify areas of opportunity and write goal statements for each. Also, determine measures that will help track the organization’s success.
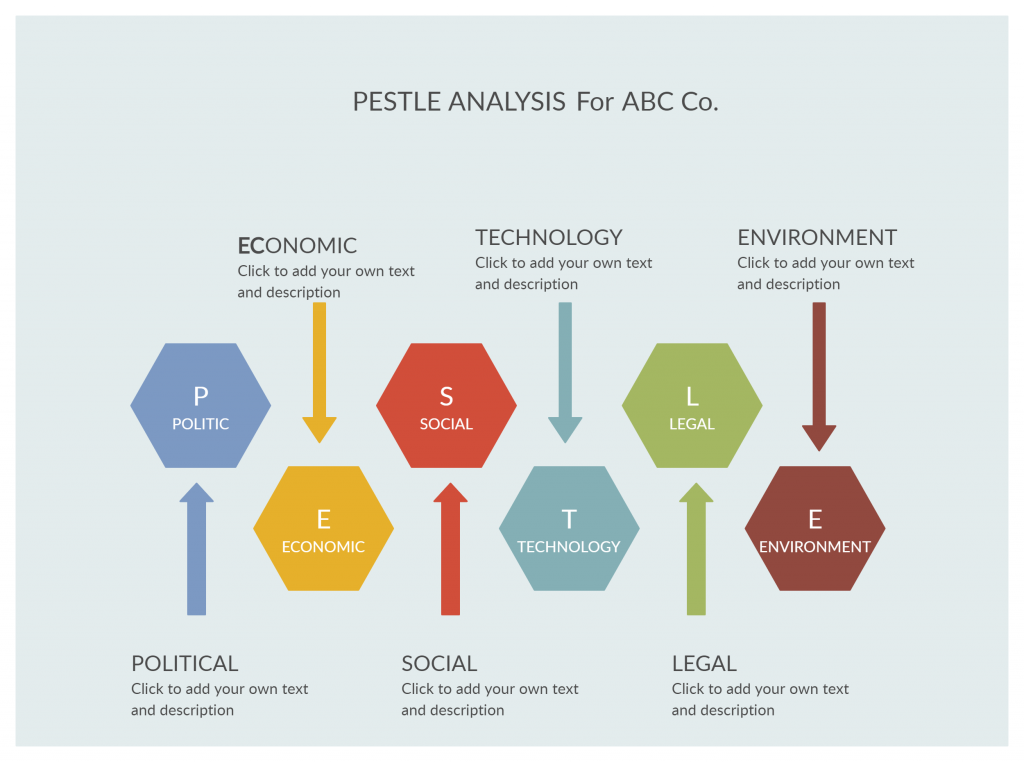
PESTLE Analysis
What is it
PESTLE analysis helps identify and analyze the key external factors or the macro forces that affect an organization. During a PESTLE analysis, you should examine and identify changes in each of the following areas.
Political Factors
The impact of the government or the government policies has on your company or industry.
Economic Factors
How do the economy and its performance may impact your organization or your industry? Details you may need to look into include employment rates, raw material costs, interest rates etc.
Social Factors
Examining social factors help you understand the needs and wants of your customers better. For example, attitude changes, cultural changes, educational levels etc.
Technological Factors
How would the technological advancement impact the growth of your company and the industry?
Legal Factors
You need to be aware of the legal territories you operate in. And keep an eye out for any change in legislation and how it would impact your business operations.
Environmental Factors
In this section, you need to list down how the changes in the environment like the climate change, pollution, etc. would affect the growth of your company.
For more marketing strategic planning tools, refer to our Ultimate List of Marketing Strategy Planning Tools.
Employee Performance Improvement Tools
An organization can go forward only if it’s backed by a strong team of employees who perform well. Here are some tools you can use to develop your team and mentor and coach your employees to help them improve their productivity and performance.
9-Box Model
What is it
9-box model is a great tool for succession planning and development. The idea behind the matrix is that by figuring out how all employees fit into the grid, the company can understand where each employee belong and how they should be positioned during the organizational changes that will occur in the future.
The X-axis of the grid tracks the current overall performance and the Y-axis illustrates the potential of the employees.
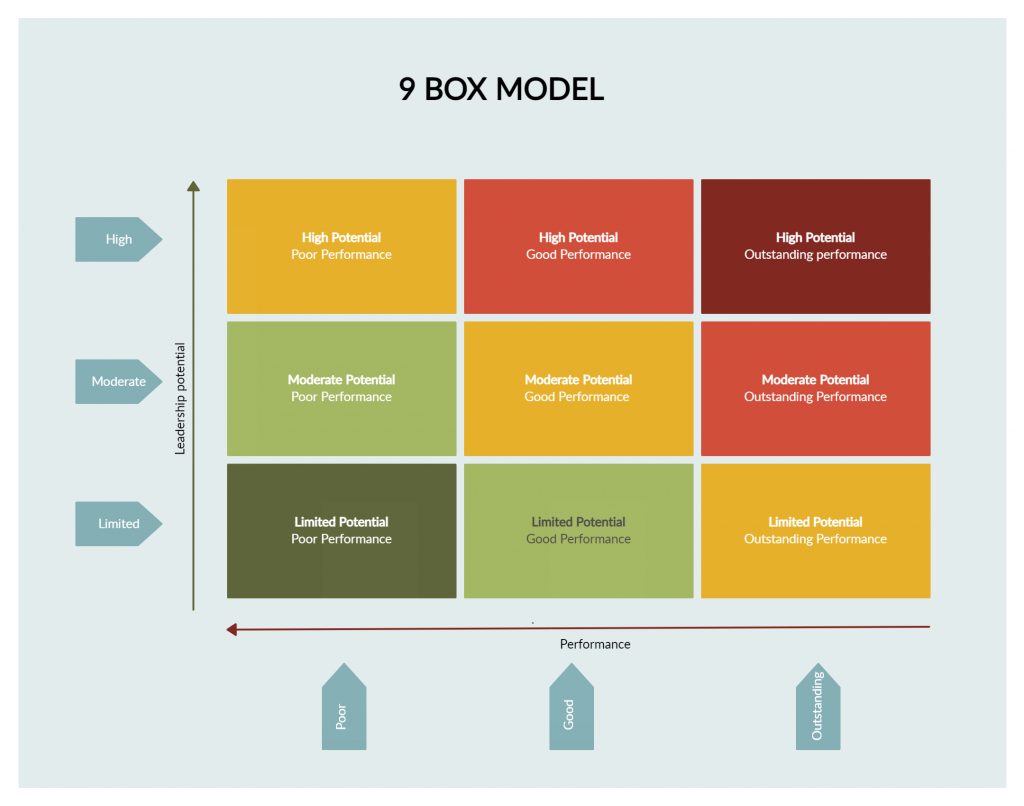
How to use it
Step 1: Start with setting the criteria and standard for each box. If you have these clarified, its easier to categorize each employee
Step 2: Place each employee in his/her respective box. To help you out with the exercise, have your employee profiles with you.
Step 3: Get together and plan the progression of your employee at regular intervals. It will help you see how they have developed and what actions you need to take to further grow your team.
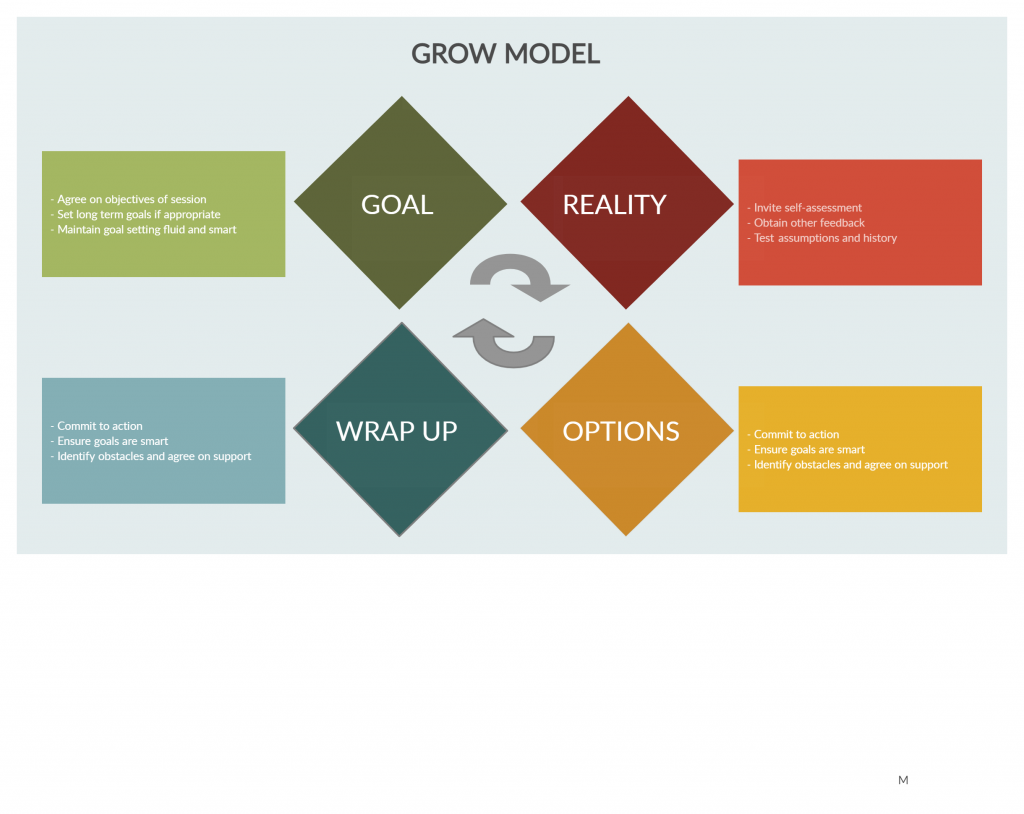
GROW Model
What is it
GROW model is a helpful tool to structure your employee coaching or mentoring sessions. It helps a person clarify what he wants to achieve and how he will achieve it.
How to use it
Step 1: (Goal) First step is to define the goal you want to achieve at the end of the coaching session. Goals here could be targets, performance outcomes etc. When setting goals, it is important to adhere to the SMART criteria.
Step 2: (Reality) The next step is to analyze and get an idea about the current state the trainee is in. The coach can help his client do a self-evaluation with a personal SWOT analysis, and identify his strengths, weaknesses as well as threats and opportunities. At the end of this step, the obstacles should be listed.
Step 3: (Options) What are the solutions available to overcome the obstacles you’ve identified earlier? Brainstorm all possibilities with the trainee.
Step 4: (Will) In this step, one of the solutions is selected and a plan of actions is outlined. The responsibility of the coach from now on is to motivate his client to follow through the plan until the goal is accomplished.
What Techniques Do You Use to Improve Organizational Performance
In this guide, we’ve taken a different approach – a visual one – to improve organizational performance and we hope it helps you increase your organization’s effectiveness and employees’ productivity.
Don’t forget to share it with your colleagues and let us know your thoughts on the guide in the comment section below.