Remember the days when teaching was about the teacher explaining the topic and students taking down notes?
Things have drastically changed over the years, especially with the influence of technology.
Students are more tech- savvy and have a shorter attention span now. What can engage them is something that they can quickly process and comprehend.
This is where visual tools come into play. Human beings not only comprehend visuals 60,000x faster than text, but visuals have a far more significant impact on their long-term memory than other communication methods.
Let’s take a look at eight visual teaching strategies that you can use to boost your student’s engagement in the classroom and help them learn faster.
Explain Relationships with Concept Maps
Are your students having a hard time connecting the dots between the different components in a concept?
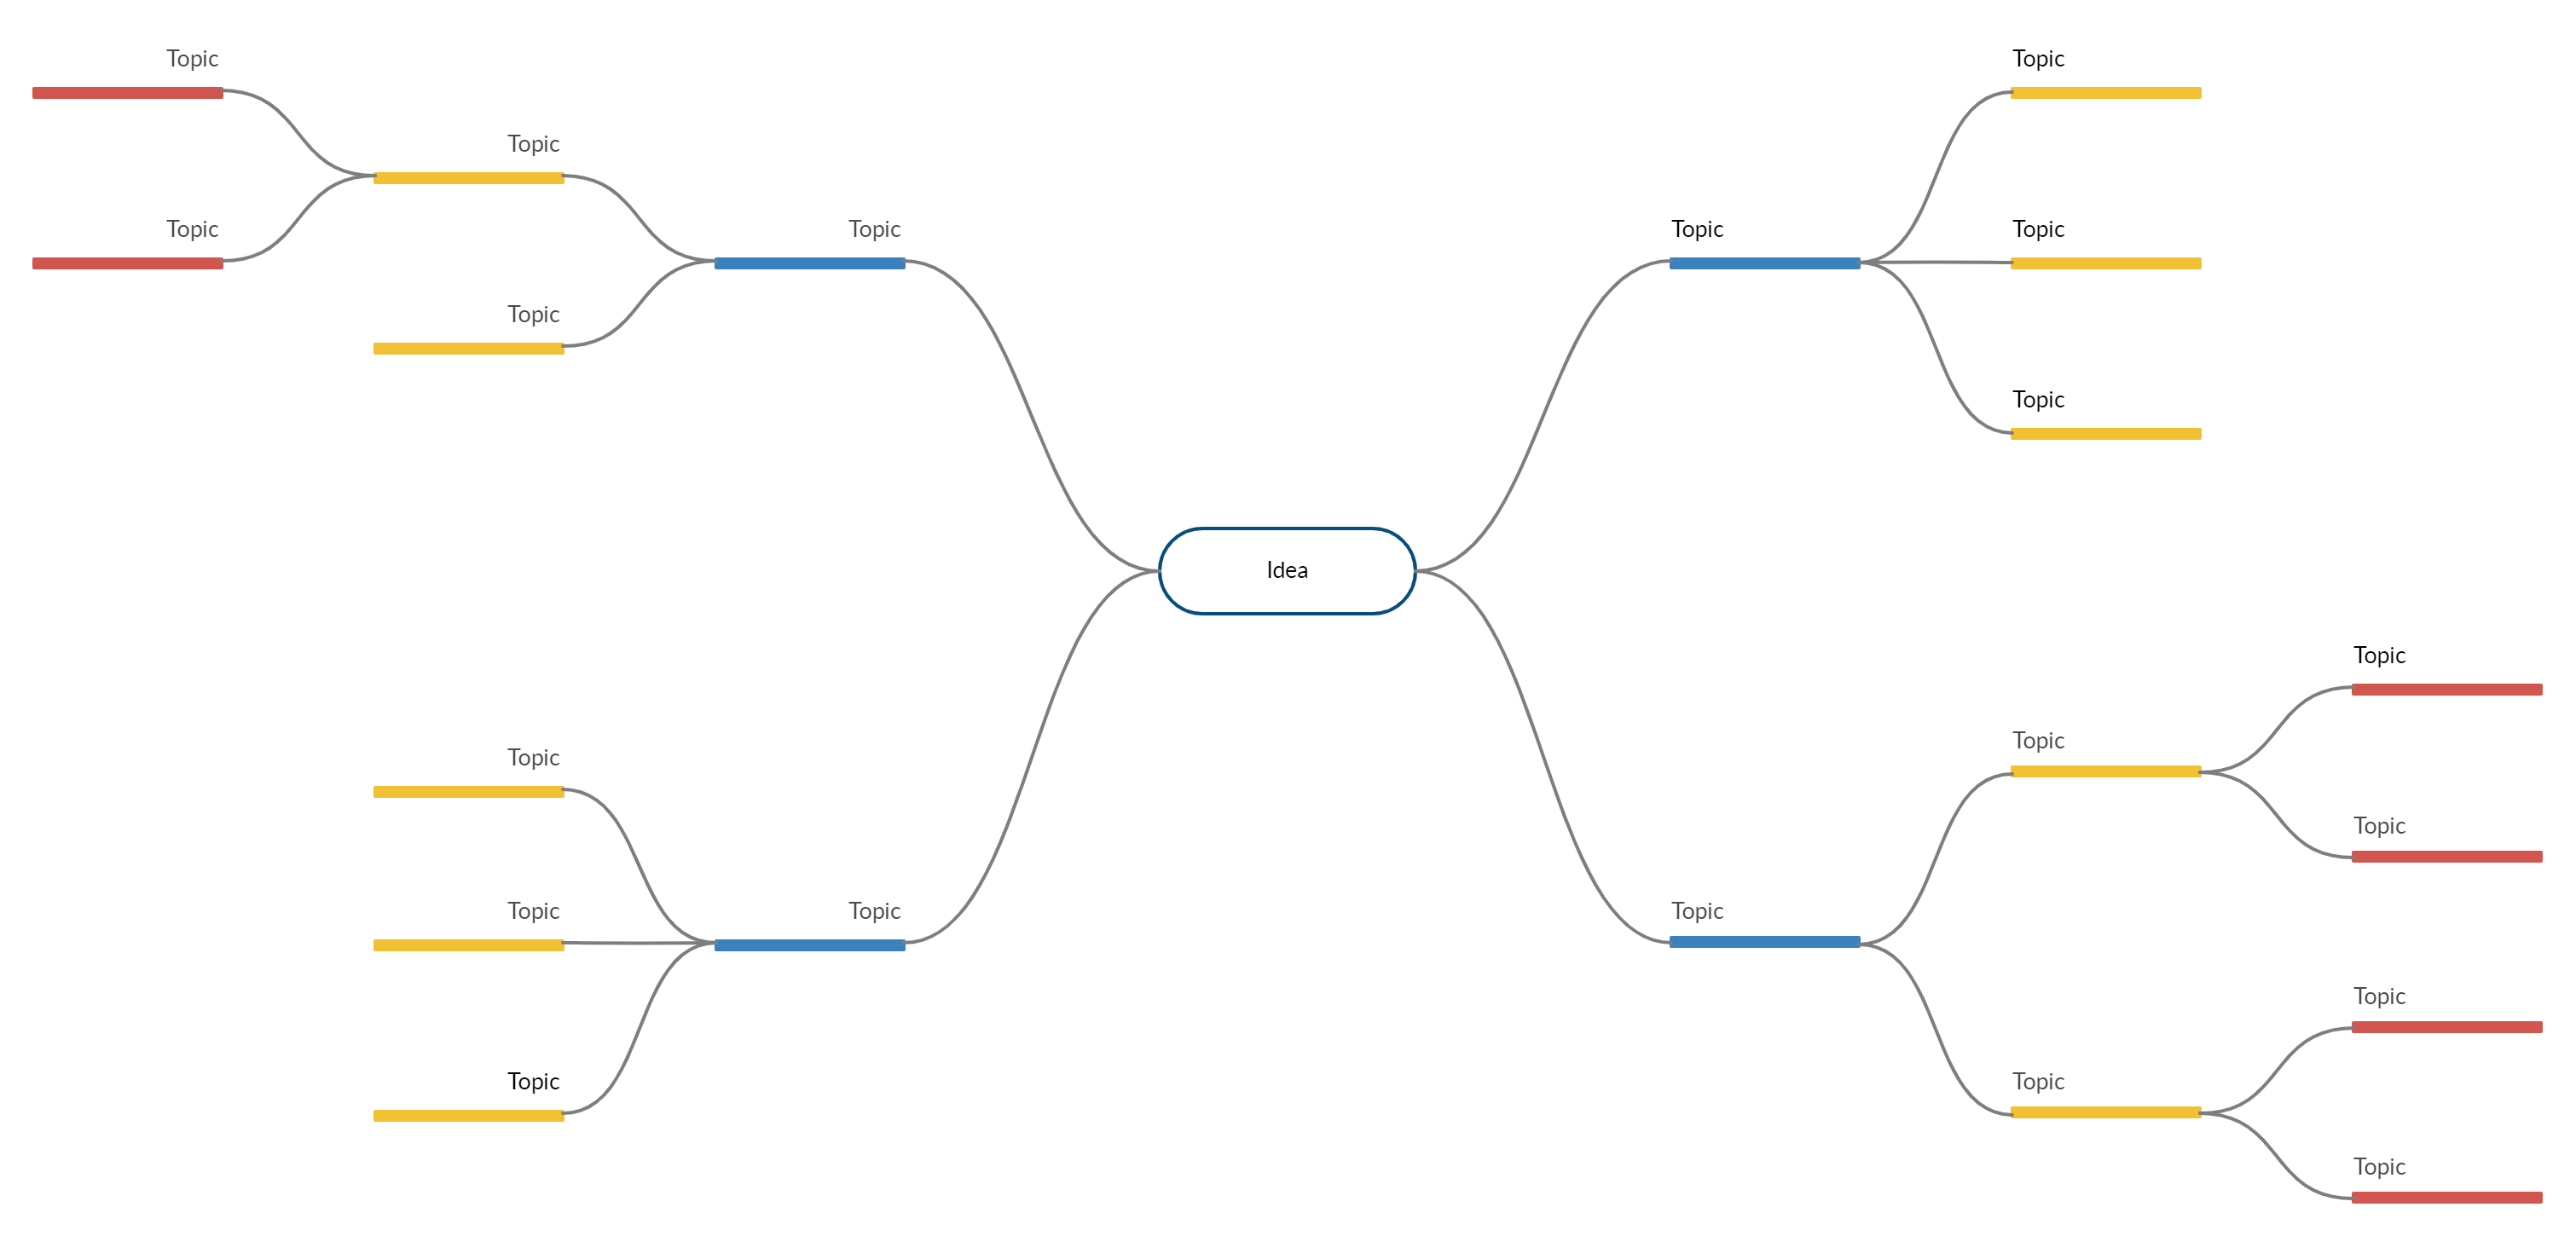
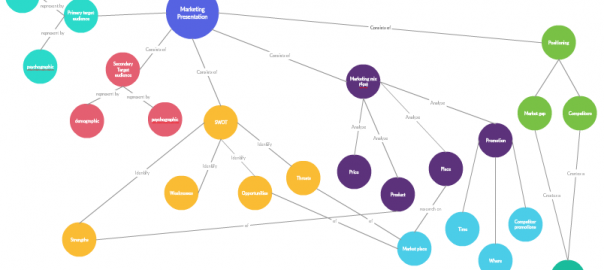
Made of nodes that represent ideas and connectors that represent relationships, concept maps make use of dual coding. This means students effectively learn the material through both text labels and the visual structure of the map.
Incorporating a concept map to teach or study help students link new knowledge to what they already know.
Following are 2 effective ways you can make use of a concept map in the classroom.
- Create one large-scale concept map of the lesson and a series of more specific maps analyzing the subtopics under it. These can be shared with your students as handouts that they can refer to later while studying.
- Carry out fun exercises with students using concept maps, where you can get students to fill in the blank nodes or labels on the map, or choose from a list of information provided by you.
Creately Tip: Make use of real-time collaboration within the Creately app to get the participation of your students when drawing concept maps online. You can suggest changes and guide them as they work on the map.
Enhance the Student’s Memory with Mind Maps
Enhancing memory and stimulating creativity of students are two of the biggest challenges teachers face.
Now, there are a number of techniques used in the classrooms to facilitate these purposes, but visualization still stands out as one of the most effective methods.
And mind maps – popularly known as an effective study technique – do the trick better and faster.
Mind maps combine everything that is needed to boost creative power and memory, together.
For example, using images instead of text on your mind map can help students recall that piece of information faster. Likewise, taking apart a topic via a mind map using keywords instead of long phrases and color coding, help remember information better.
Mind maps can be used in a number of useful ways in the classroom to improve teaching and learning.
Provide a clear overview of the topic at hand
Before the beginning of the lesson or after, hand your students a mind map based on the topic. This can be further developed by students during the lesson or when they refer to it later.
Creately Tip: Create live mind maps or knowledge banks where you can include links to additional resources right within your mind map. This could come in handy for students when doing their research on the topic.
Brainstorm and generate discussion
Mind maps can provide the structure for a productive brainstorming session. Put down the topic under discussion in the middle of your map and ask your students to identify ideas related to it. Generating active discussion among your students like this can help them memorize what you teach more effectively.
Map Processes with Flowcharts
Flowcharts help map out the steps of a process clearly, be it to explain to your students how to properly write an essay or to describe how the Earth was created.
Any complex scientific or technical process can be demystified with the help of flowcharts; since flowcharts let you illustrate each process step, students won’t have a hard time figuring out how it works.
Unfamiliar with the use of flowcharts? This ultimate flowchart tutorial explains everything you need to know about flowcharts.
Flowcharts can be used in your classroom in a number of effective ways;
- You can get your students to draw flowcharts online based on what you have taught them. This will get them to think again about the lesson and refer to the notes they took down. Simplifying what was taught in their own terms will help them internalize information better.
- Or you can create handouts containing flowcharts breaking down the lesson. Students can take these home, and refer to them later when they are studying.
Creately Tip: Use flowchart worksheets to test the knowledge of students. We’ve got a whole library of free flowchart templates that you can use for this. Simply choose one and modify it to fit your own needs.
Tell Stories with Storyboards
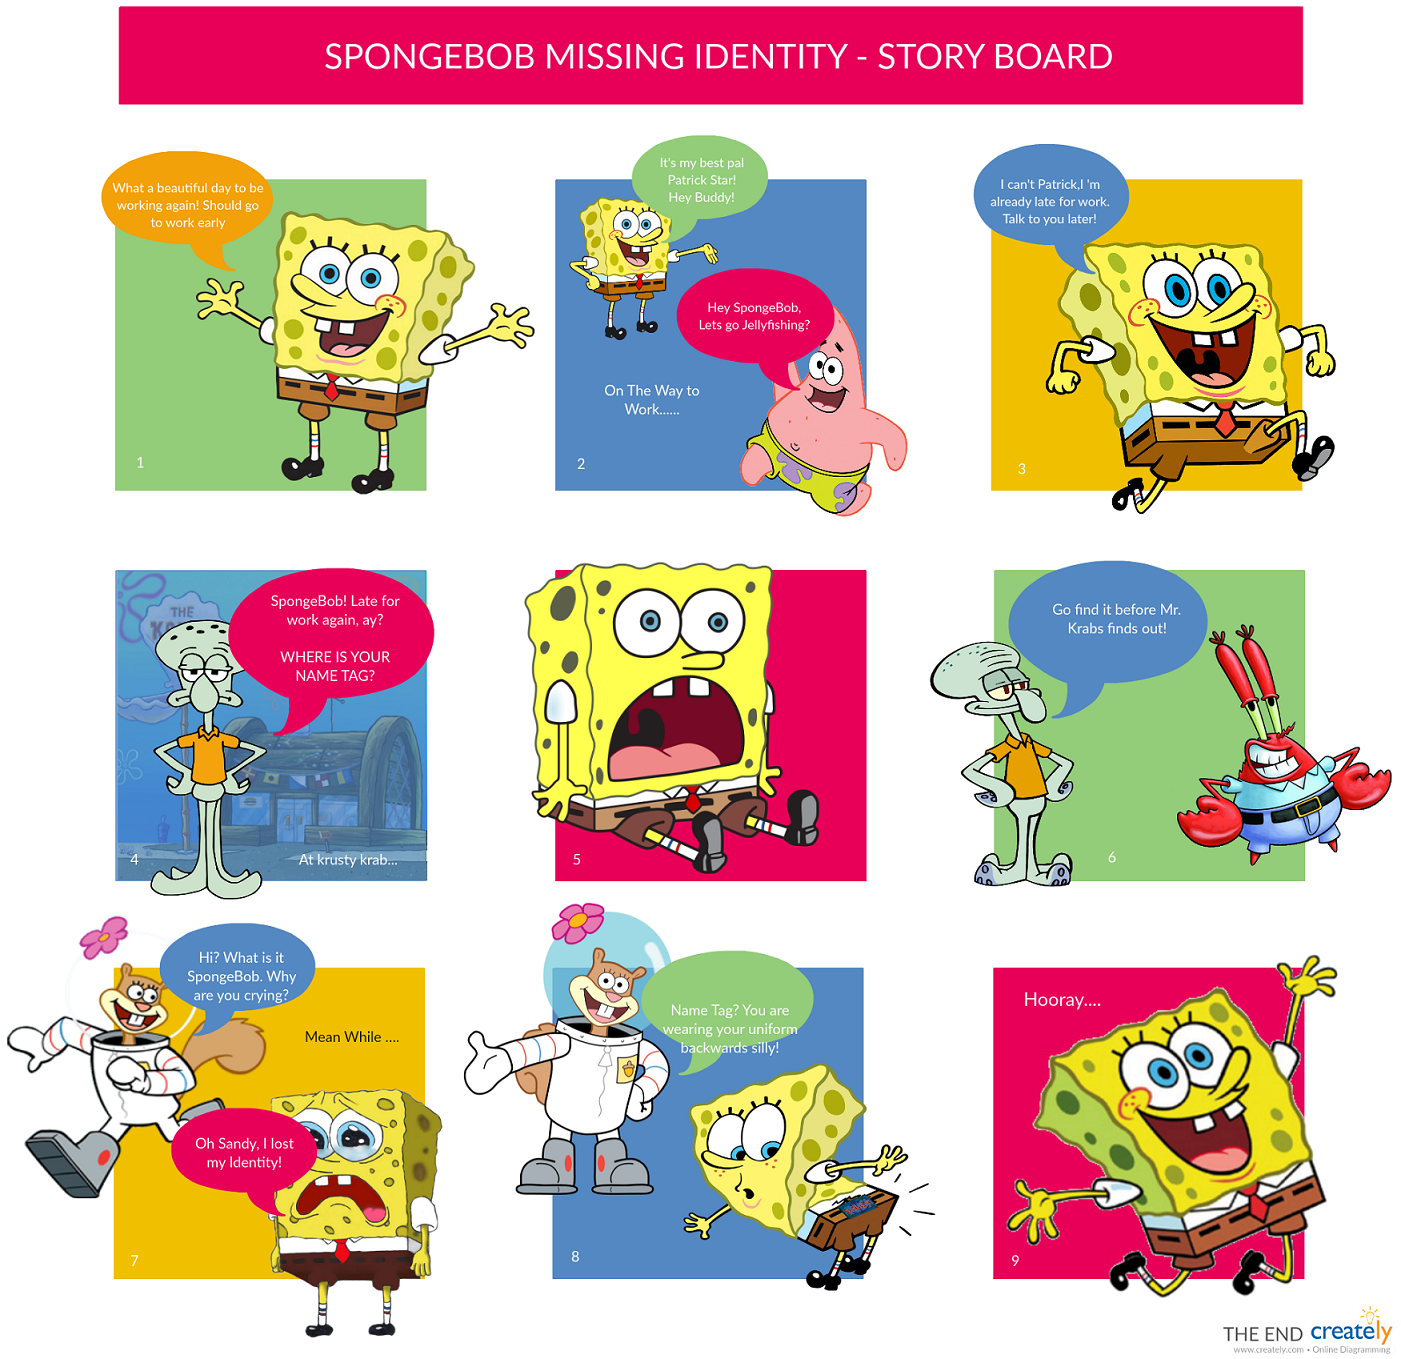
Whether to summarize the lesson of the day or to simplify complex information and present them in an easily-digestible way, storyboard creator is your ideal teaching technique.
These consists of illustrations and pictures with notes that briefly explains what’s visually highlighted, much like the comics students love so much these days.
Creately Tip: Use ready-made visually stunning storyboard templates that you can use in your classroom to make things a lot more engaging for your students. Import any additional graphics directly from Google or your computer to Creately to make your storyboard even more comprehensible to your students.
Solve Problems with Fishbone Diagrams
In the classroom, fishbone diagrams – a root cause analysis tool – can be used to develop children’s problem-solving skills.
Fishbone diagrams help identify the main causes of an event, whether it is to figure out why something went wrong, or why something generated such an outcome.
Encourage students to use fishbone diagrams to brainstorm around a particular problem and identify root causes. During the lesson, you can refer to these fishbone diagrams to further drill down the factors that are causing the problem.
Switch Long Notes with Infographics
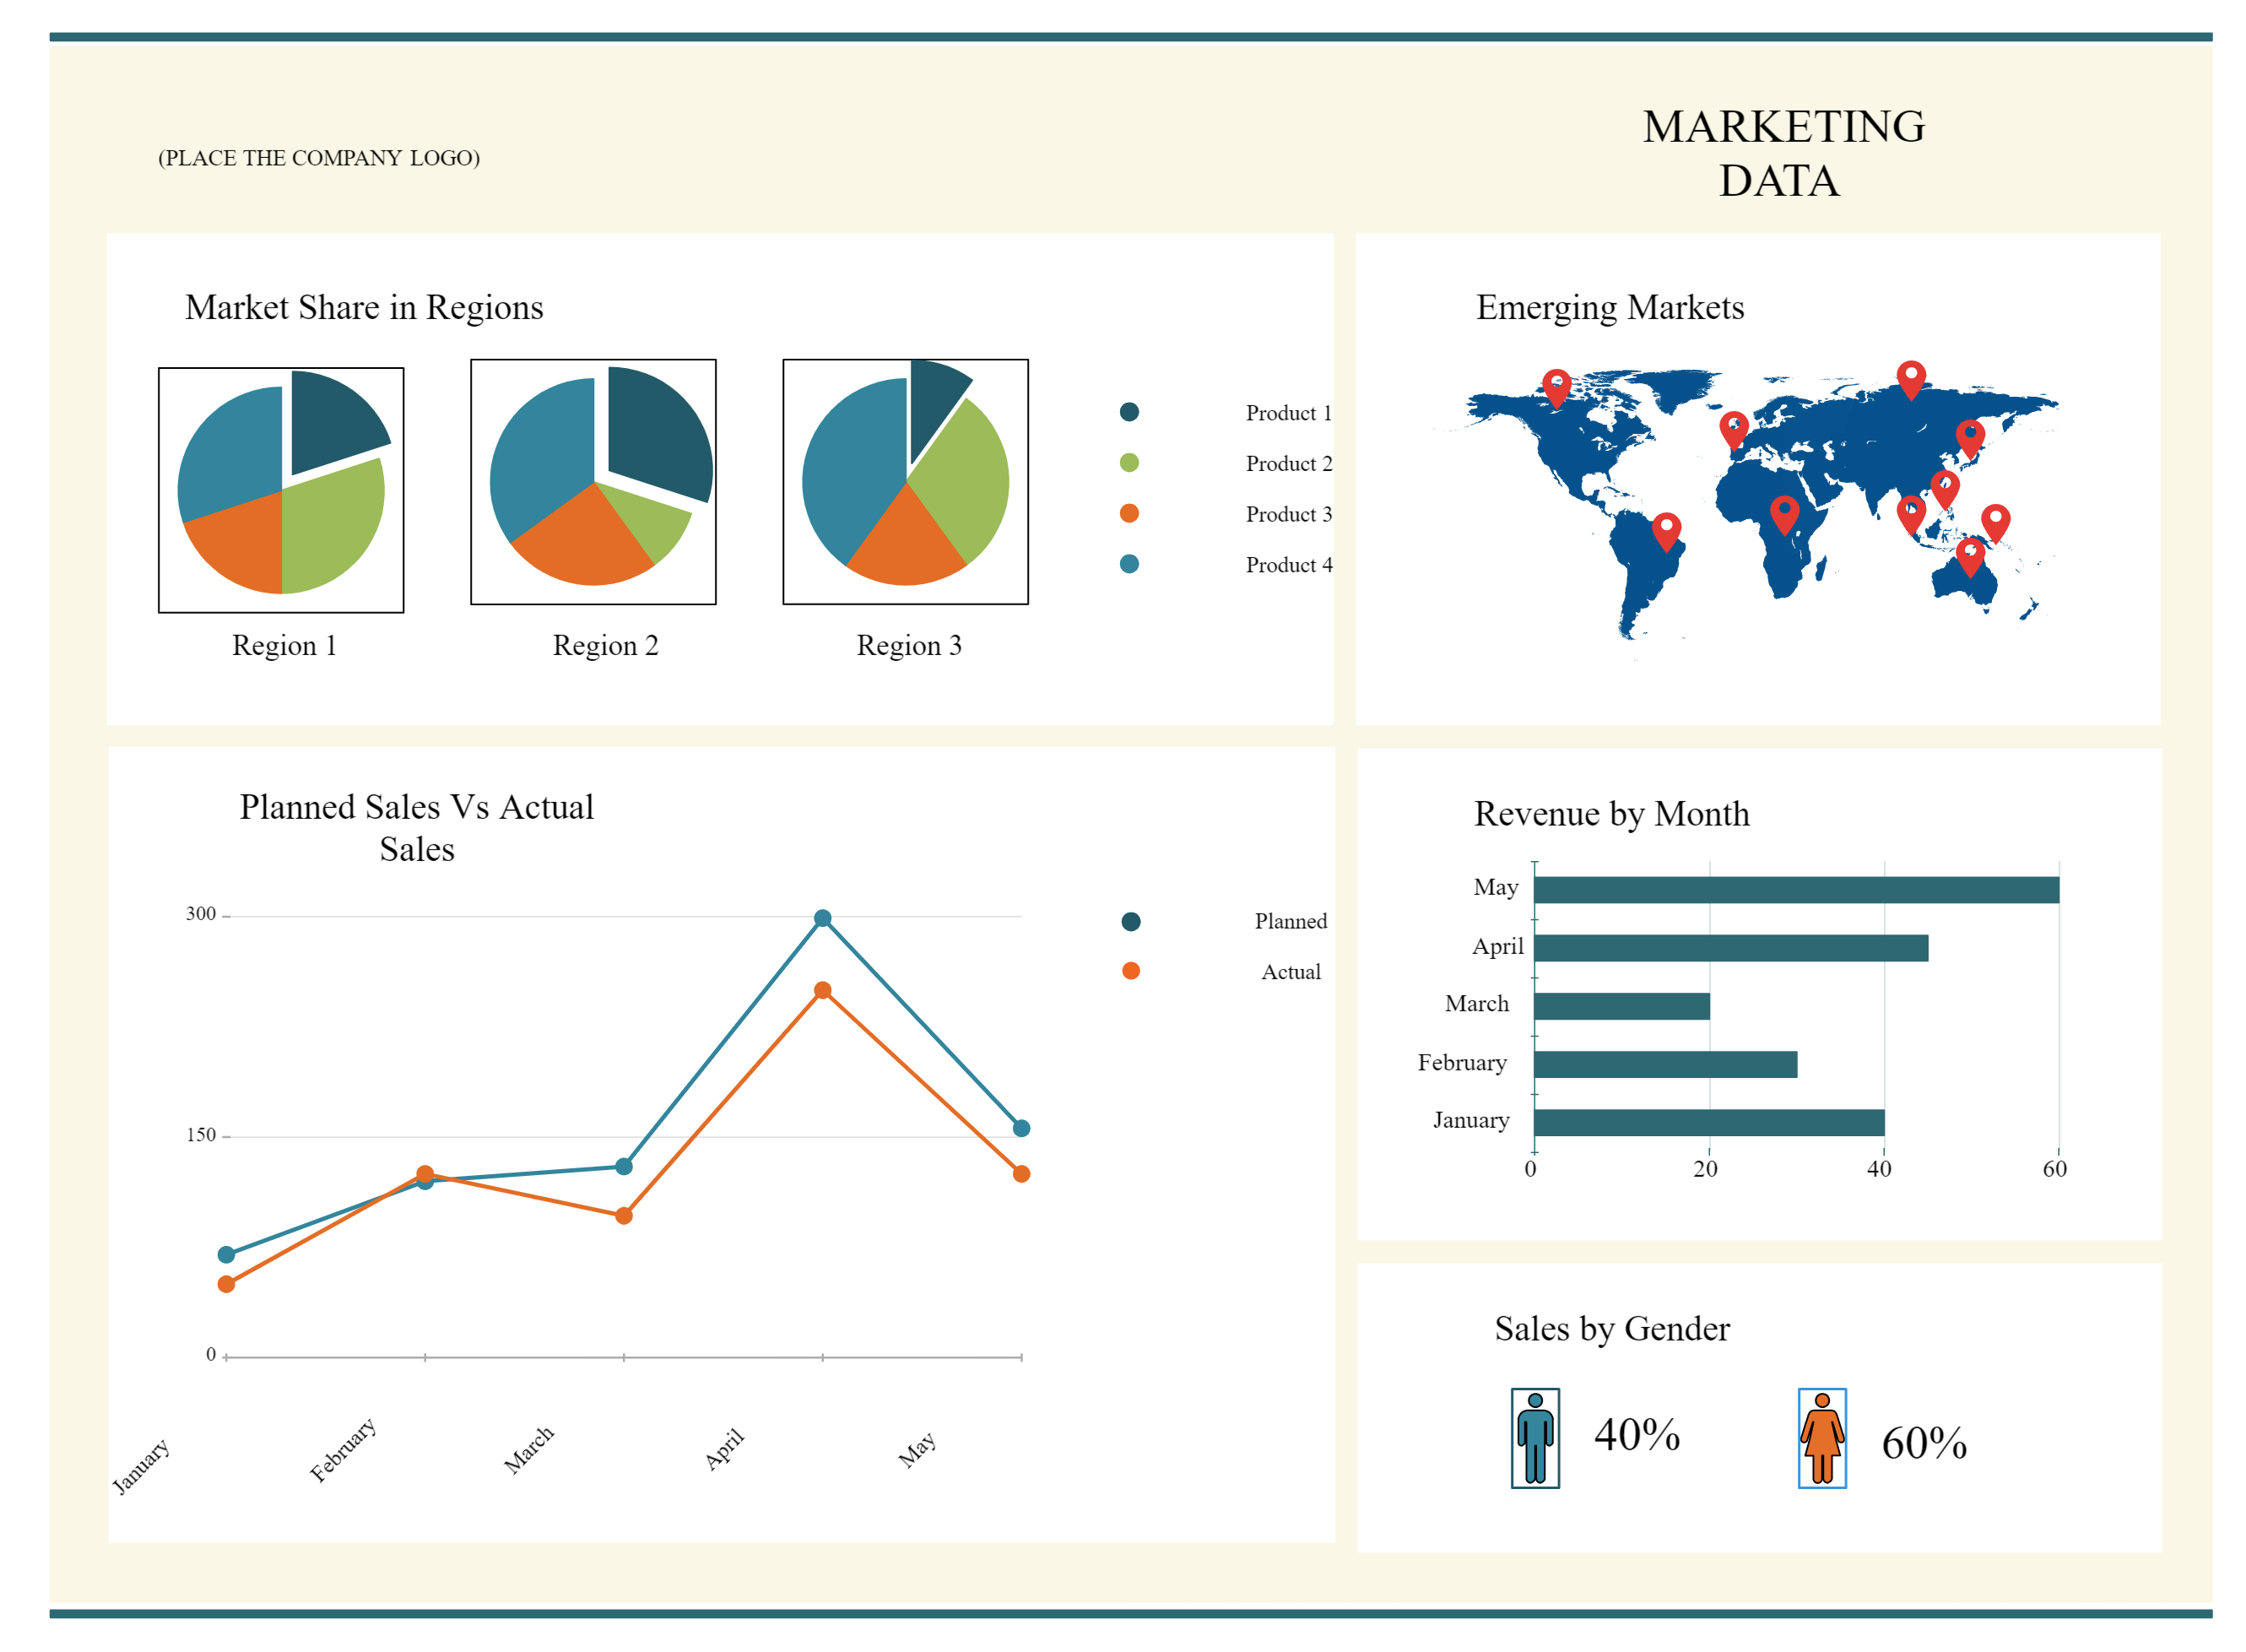
Infographics combine both graphics and text together and present information in an attractive way. Long lessons that tend to get a little boring and take a lot of explanation, can be effectively replaced with infographics by creating them with the infographic software.
Make sure you use graphics like graphs, charts or images meaningfully and don’t use too much text which would clutter up your infographic. Keep it simple and highlight the major points of the lesson that you want your students to remember.
Creating an infographic, here’s what you shouldn’t do.
Compare and Contrast with Venn Diagrams
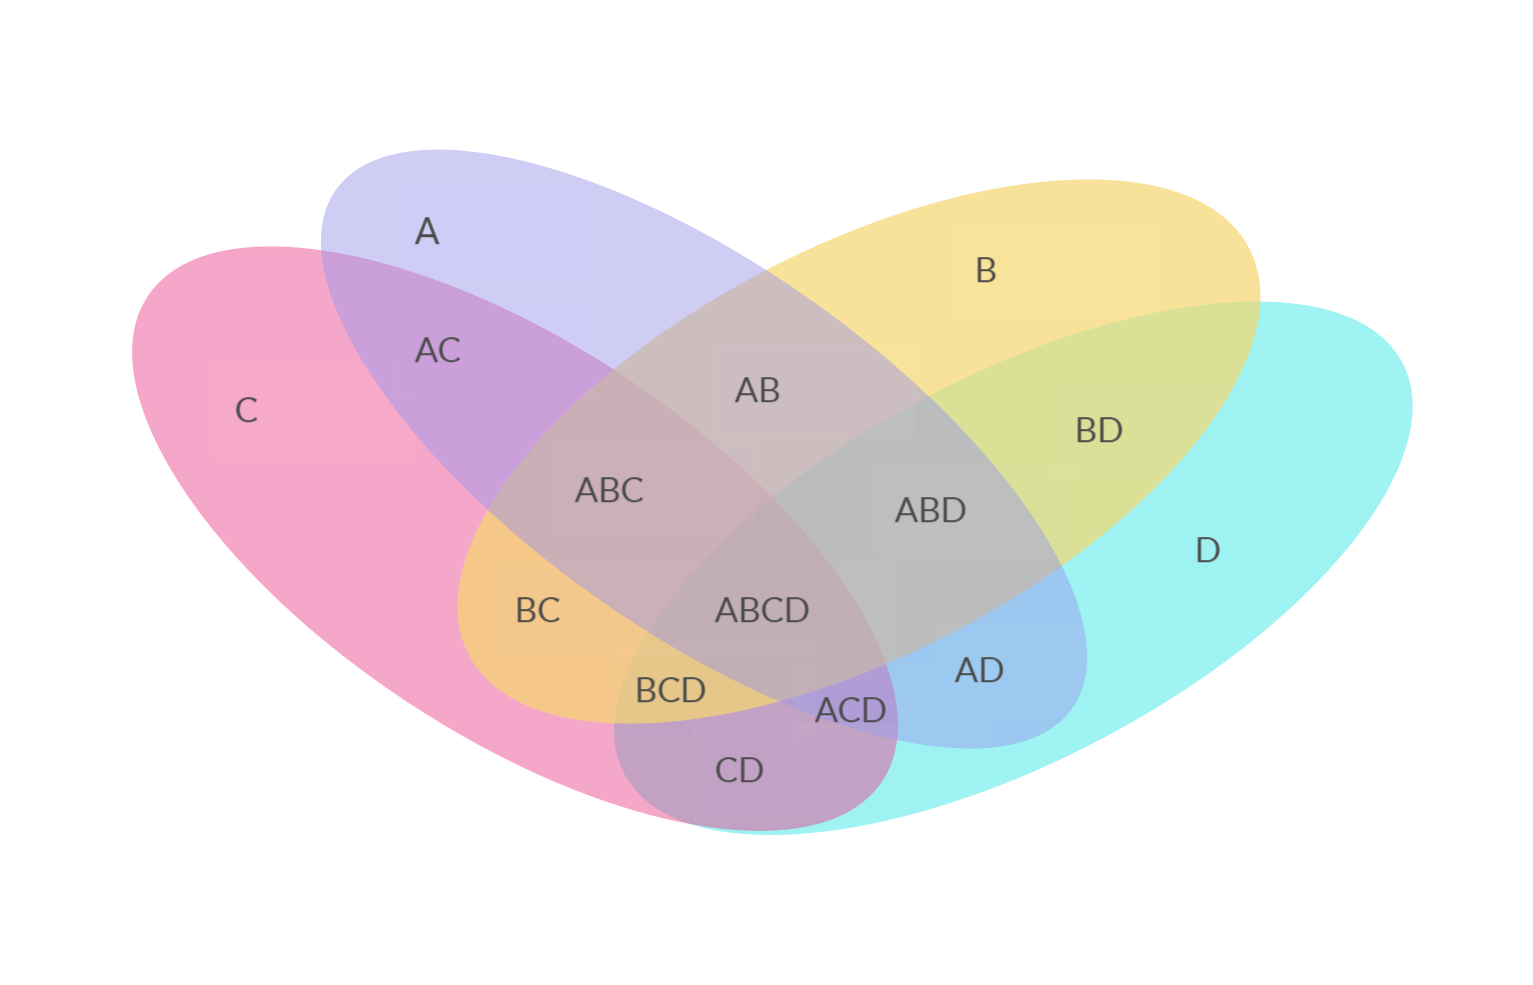
Venn diagrams are a powerful way to identify similarities and differences between two or more items.
An effective exercise you could do with Venn diagrams is having students fill a blank Venn diagram with a list of relevant information you’ve handed them.
Creately Tip: Choose from a wide variety of Venn diagram templates that you can quickly modify online. To make things more effective, add images instead of or with text on your Venn diagrams.
Clarify Complex Topics with Spider Diagrams
Spider diagrams help create an overview of a complex topic using branching spatial organization, images, and color coding – much like the mind map.
Getting students to create a spider diagram online around a topic prior to or after the lesson can help them demystify a complex subject easily.
These can also be used as an alternative note-taking method to help students remember lessons easily.
Want to Expand the Ultimate List of Visual Teaching Strategies?
Visual teaching strategies are popular because they are effective – effective in clarifying relationships, simplifying complex topics and facilitating communication. The tools we have listed here are simple to use and a lot useful in facilitating teaching and improving learning.
Make use of them in the classroom and share with us the results. And if you have more visual teaching strategies to add to the list, share them with us in the comment section below.






Do you have any other related research on the same topic but visualization in terms of role play, re enactment, video clips and picture analysis? Your insights are helpful in my study and I can use this as a reference to further my study and it caught my interests since visualization is cognition and I am interested in cognitive-behavioral study (own research). Thank you and Best regards.
Hi Johanna, glad you found the post resourceful. We’ve covered a post on creating a viral video using storyboards. https://creately.com/blog/diagrams/how-to-make-a-storyboard-for-video/ And although we haven’t included role play, this post includes many other visual brainstorming methods perhaps you would be interested in. https://creately.com/blog/diagrams/visual-brainstorming-techniques/