Spider Diagram Maker
Discover and Organize Your Best Ideas Visually
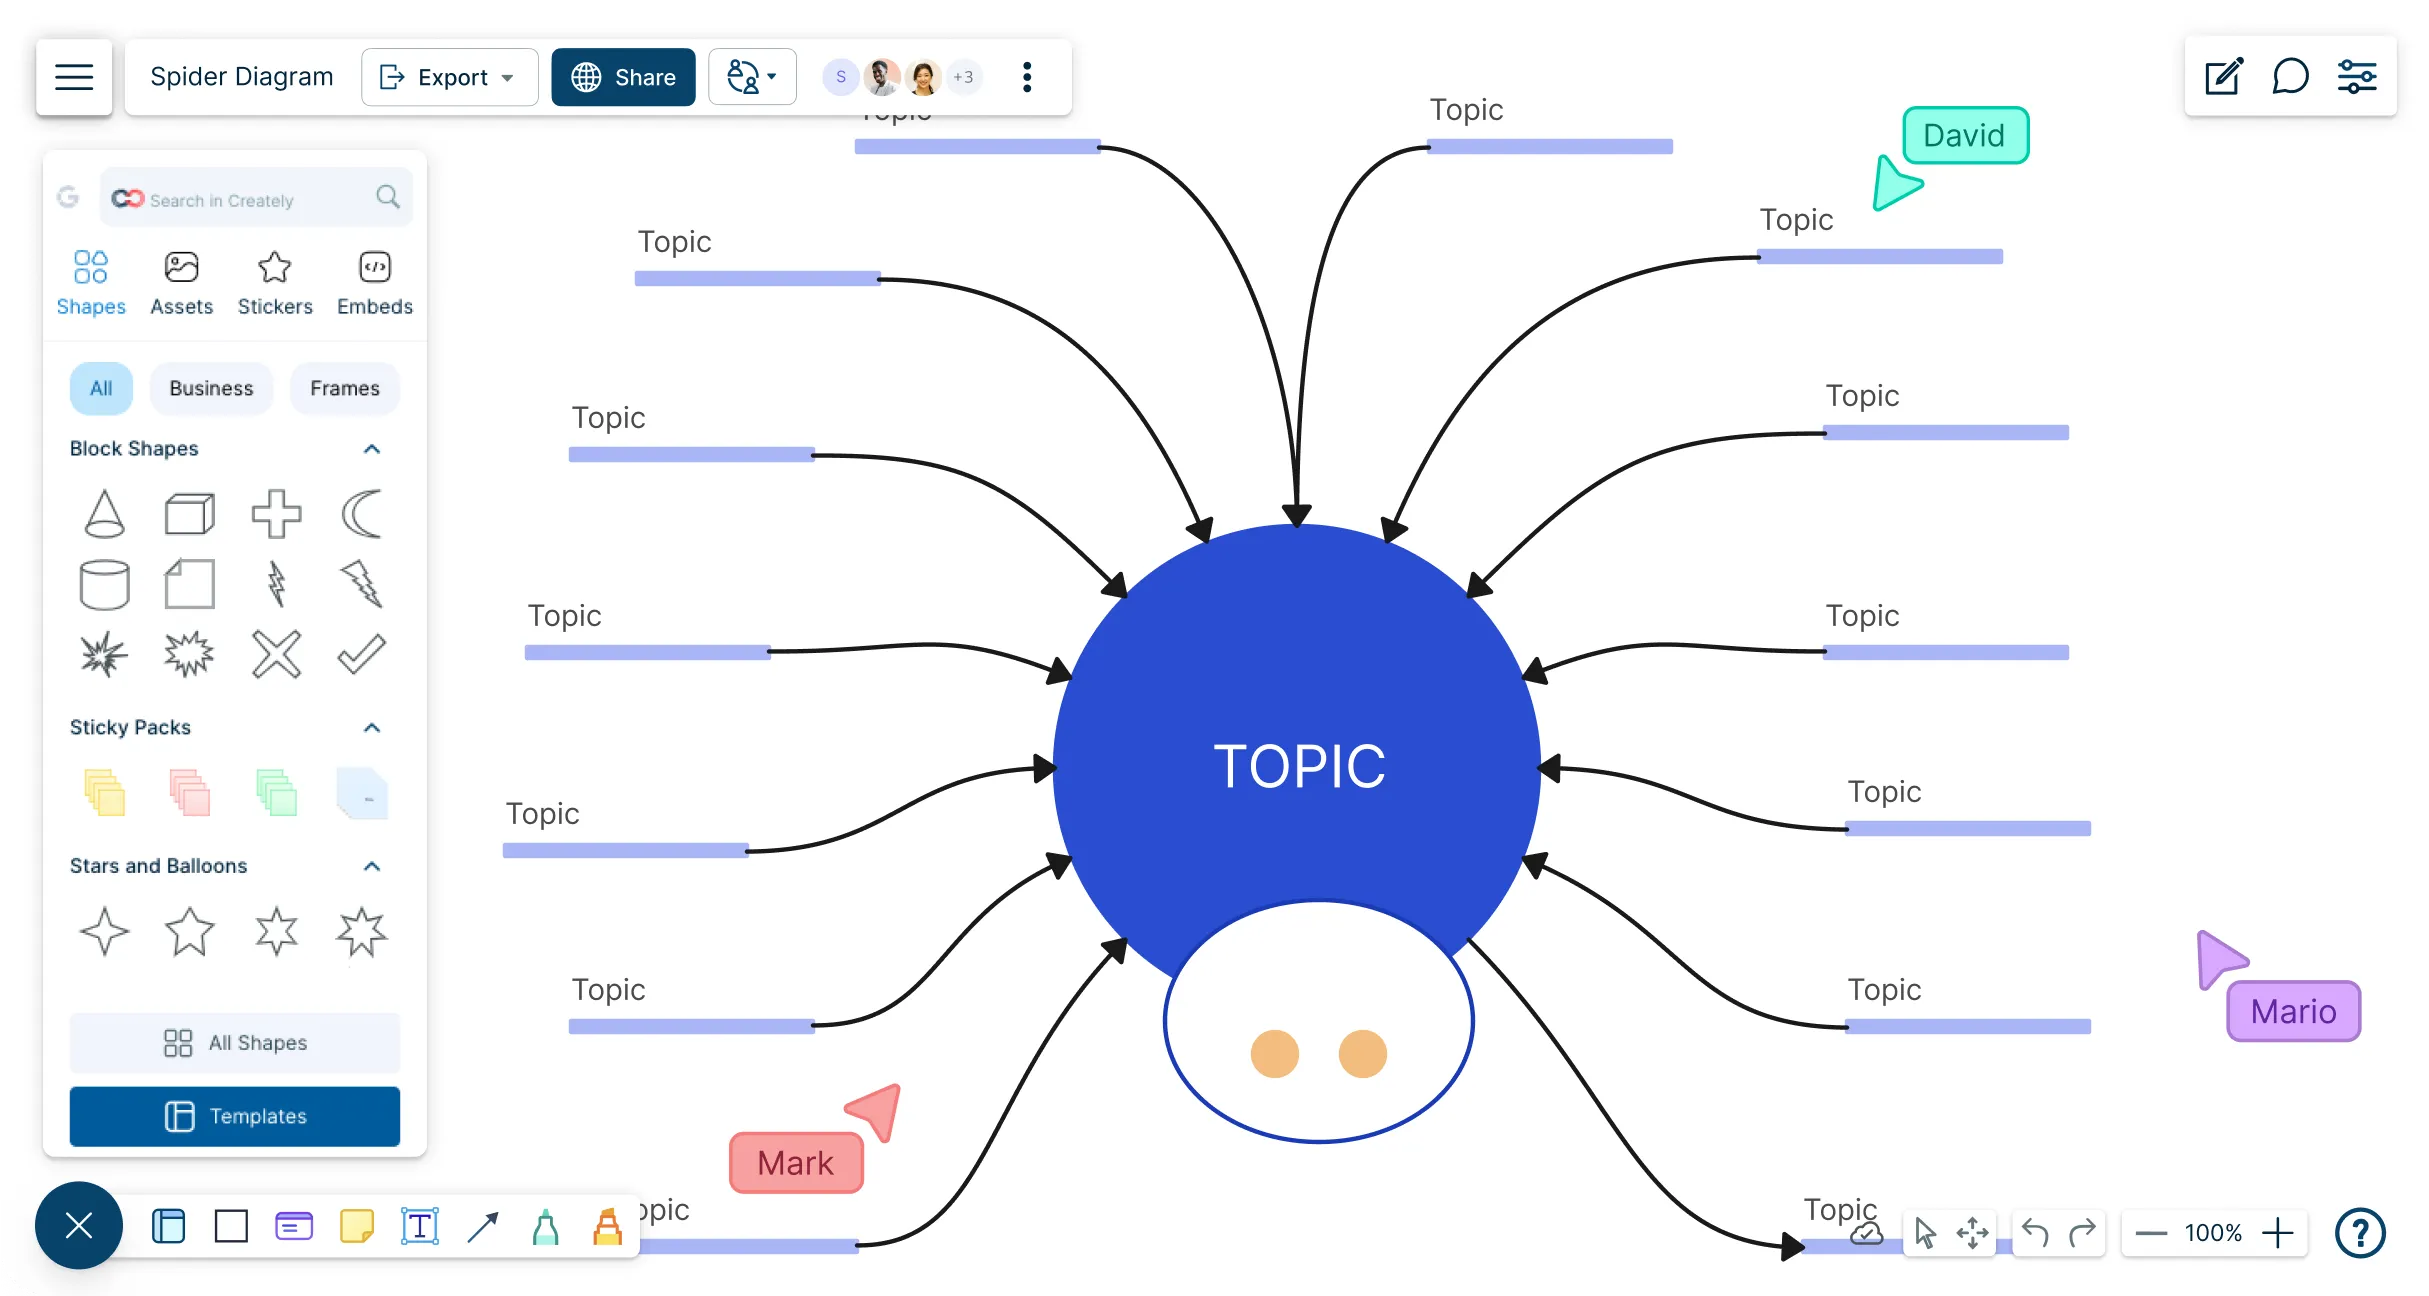
Spider chart maker to brainstorm, structure, and connect concepts in real time. Start with customizable templates and collaborate with your team on an infinite canvas.
Choose from ready-to-use spider web diagram templates
Work together with your team live or asynchronously on one shared canvas
Download as PNG, SVG, or PDF or share directly online


 Diagramming Visual Collaboration Org Chart


How to Make a Spider Diagram?
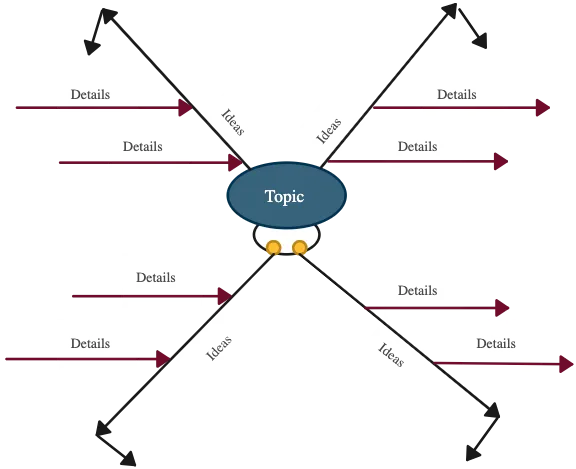
Let Ideas Flow Freely with a Spider Diagram

An online spider diagram maker with multiple spider diagram templates for brainstorming, project planning, and presentations.
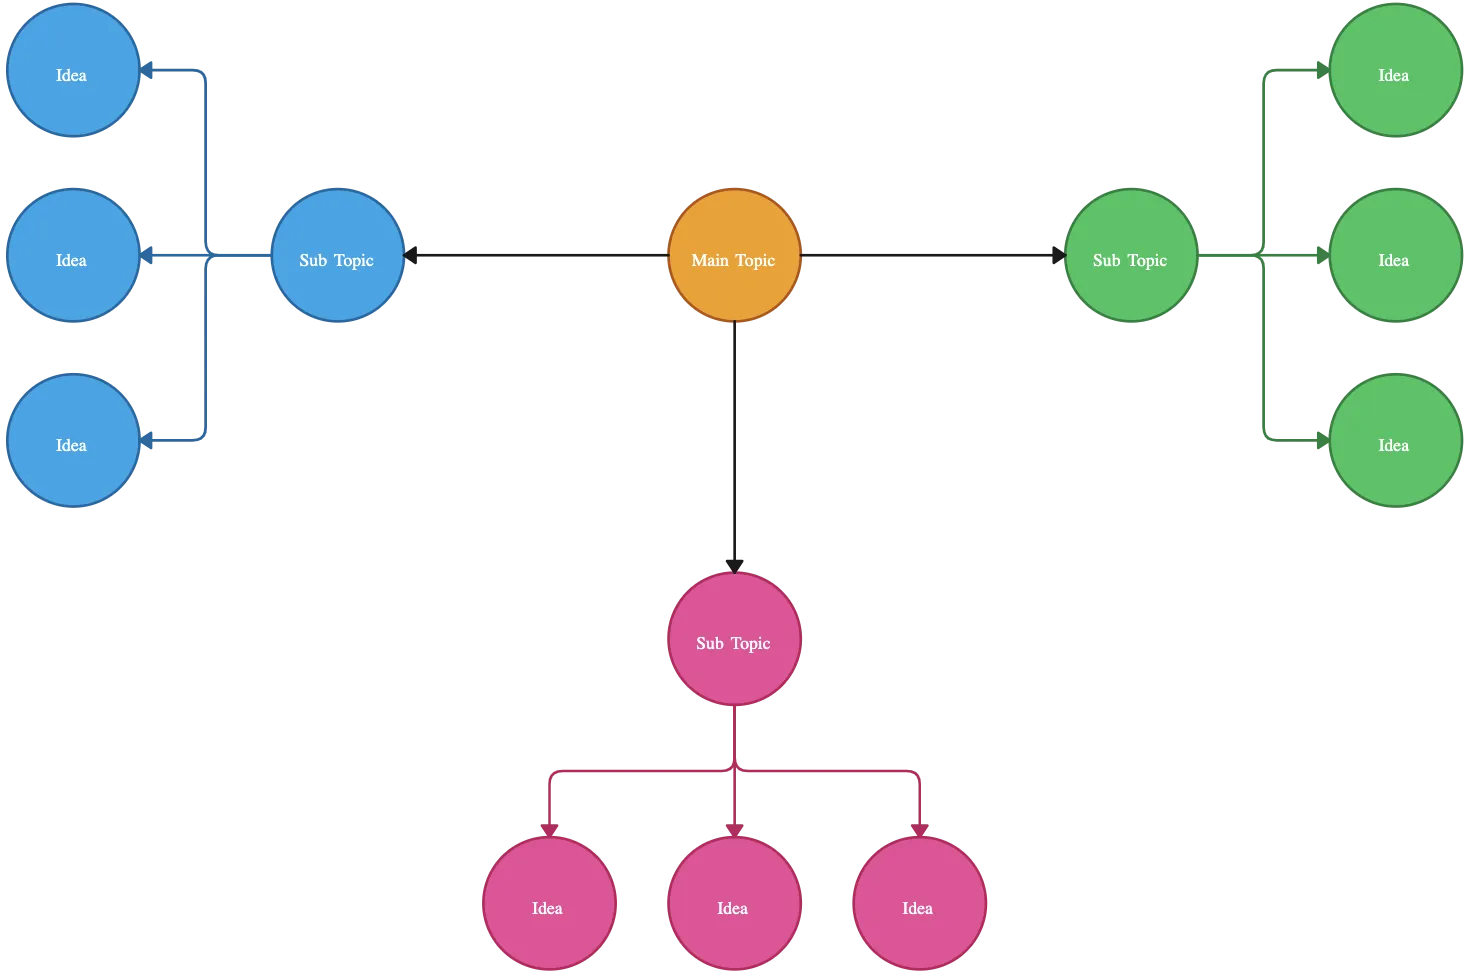
Quickly build a spider map with drag-and-drop shapes and automatic connectors.
Create structured spider web charts or free-form visual maps automatically with Plus Create.
Group related concepts and subtopics with color coding and frames.

Use Spider Diagrams to Add Context to Brainstorming Sessions
Drag and drop images, icons, or vector graphics to create data-rich and informative spider diagrams.
Add notes, links, and documents directly to diagram elements.
Built-in presentation tools to create and conduct interactive presentations.
Sketch ideas, arrows, and annotations directly on the canvas with free hand drawing.
Rapidly Generate & Structure Ideas with the Spider Diagram Technique

Collaborate on a shared canvas; add multiple collaborators and generate ideas together.
Comment with context, have discussions and follow-ups on the same canvas. Async!
Export as SVGs, PDFs, and PNGs to publish, present, print, or share.
Streamline sharing, reviewing, and editing with advanced collaborator controls.
Explore Ideas Without Losing the Big Picture
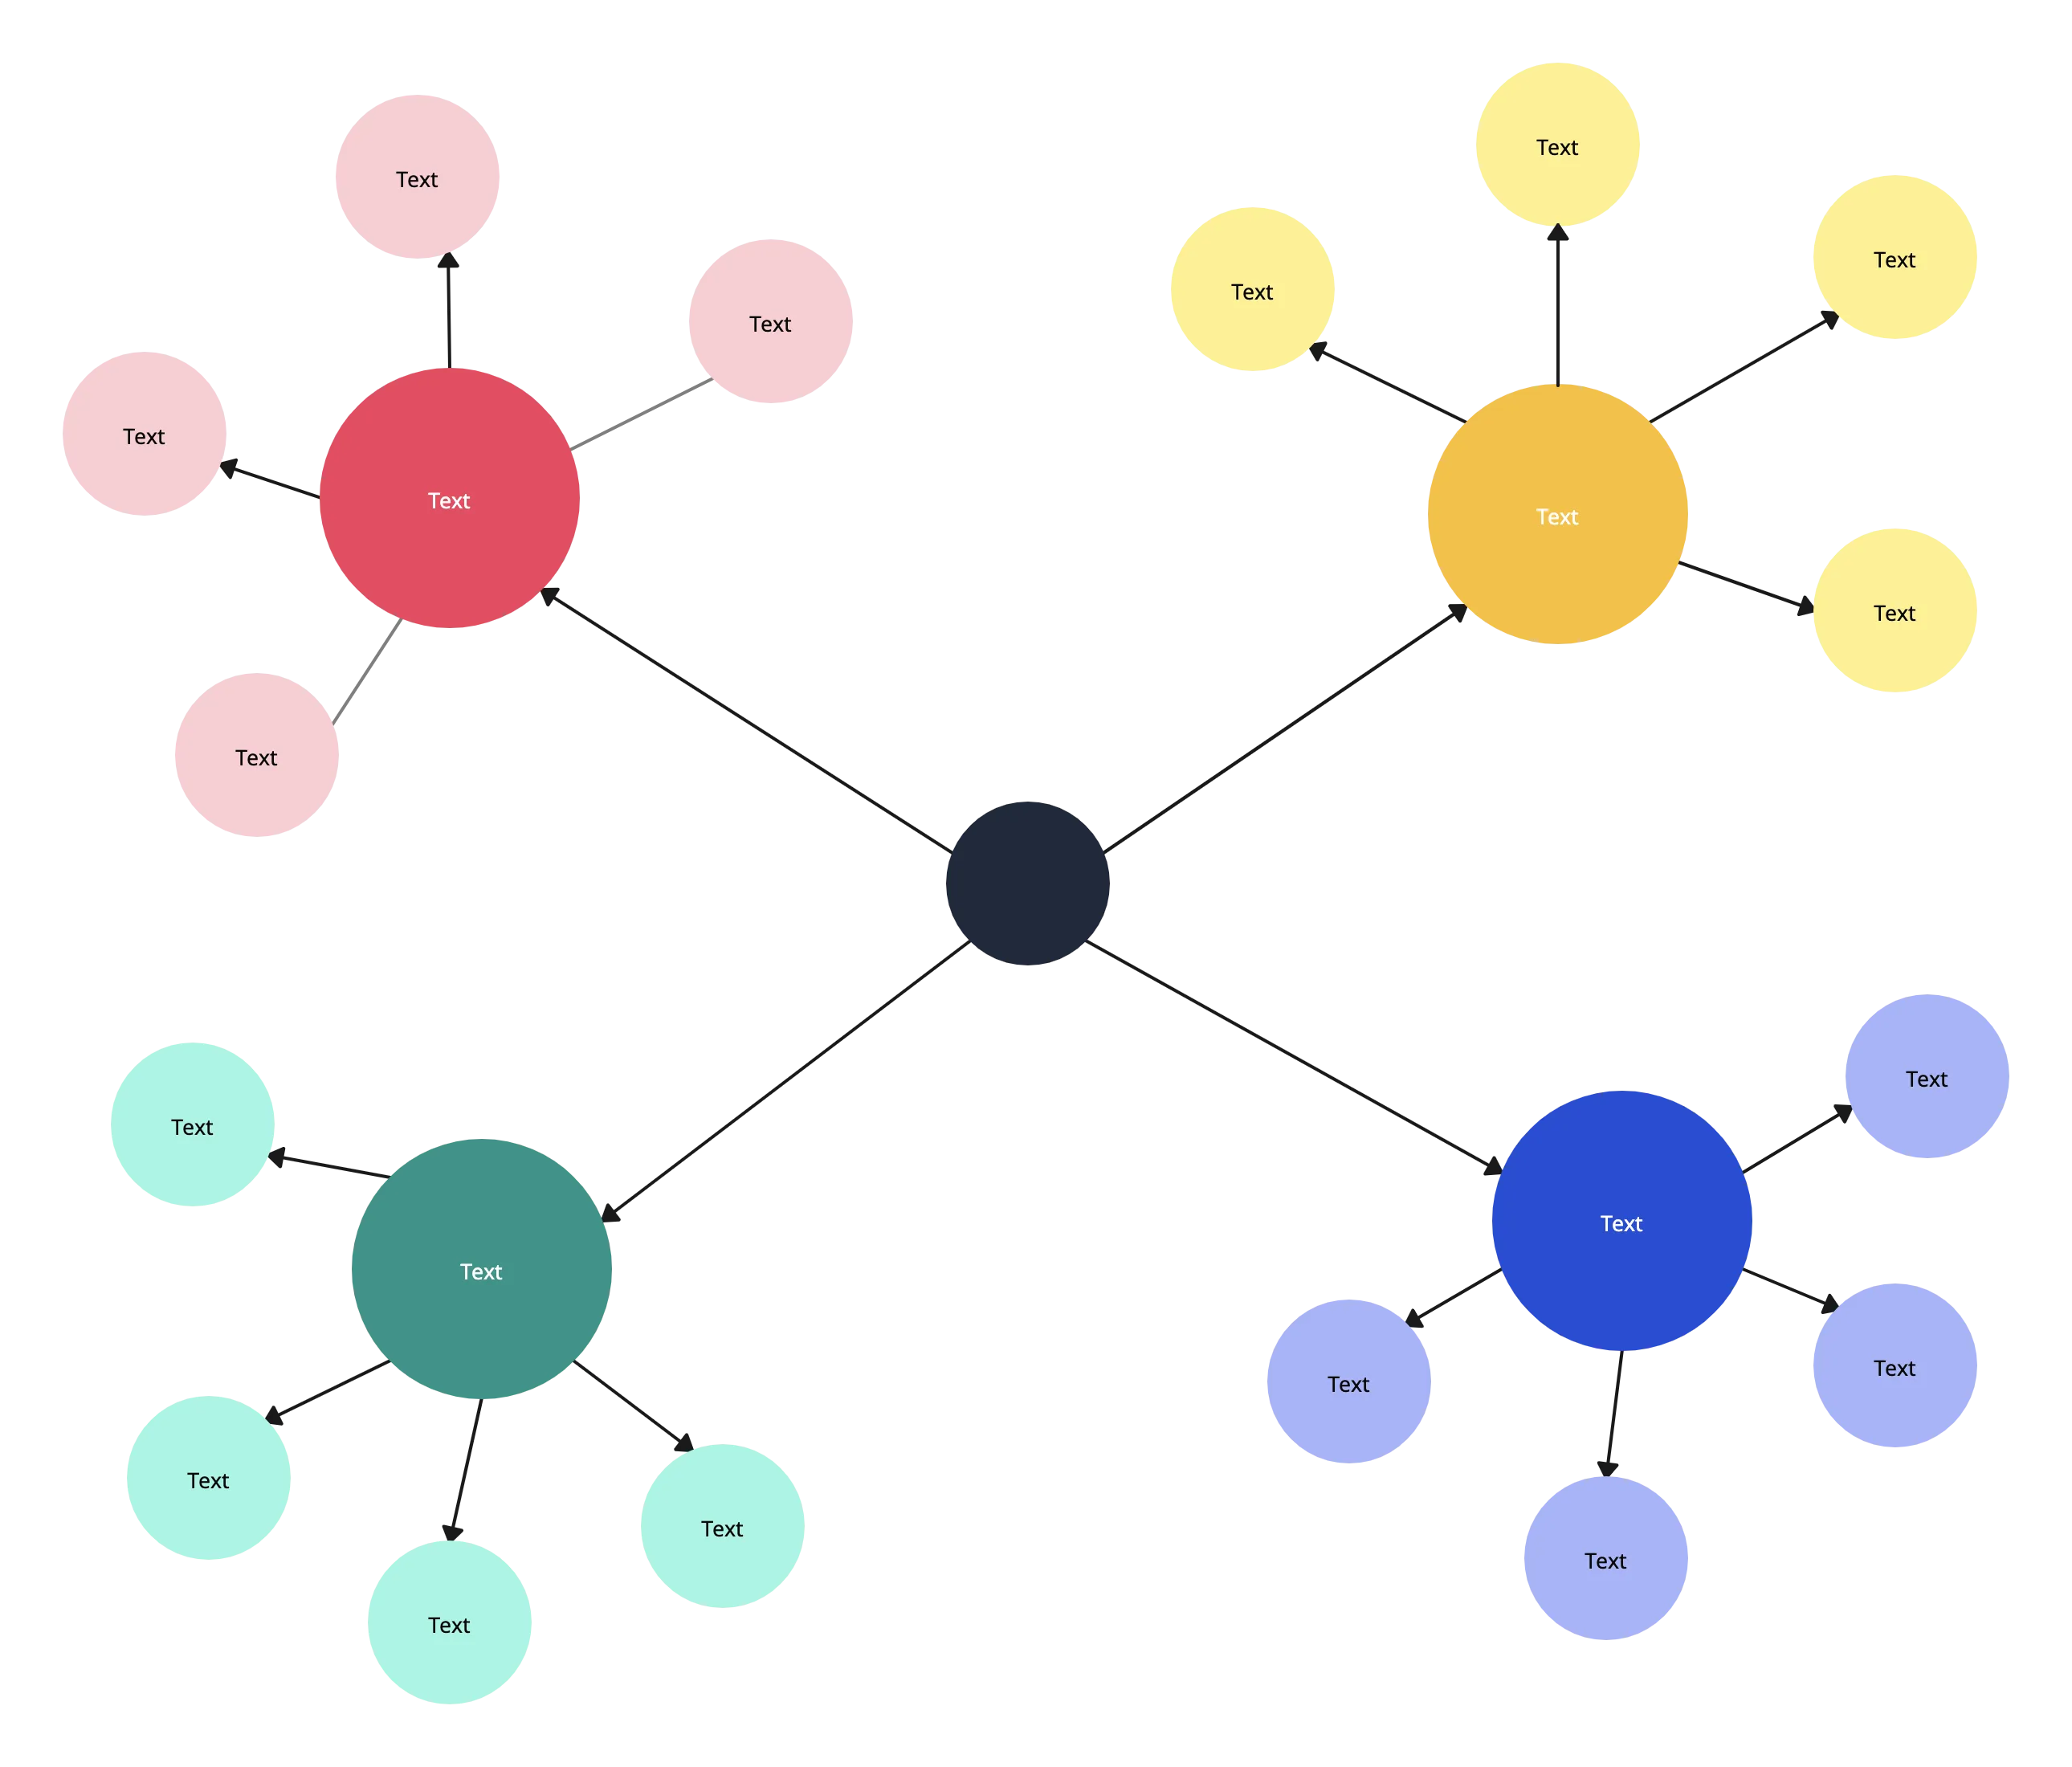
Spider diagrams help teachers and students capture thoughts around a central topic, then expand them into connected subtopics without losing structure.
When brainstorming starts with scattered thoughts, students can use ready-made spider diagram templates, drag-and-drop shapes, and automatic connectors to turn ideas into a clear visual map.
As more subtopics emerge, the infinite canvas gives them space to keep expanding the diagram without breaking the flow of thinking.
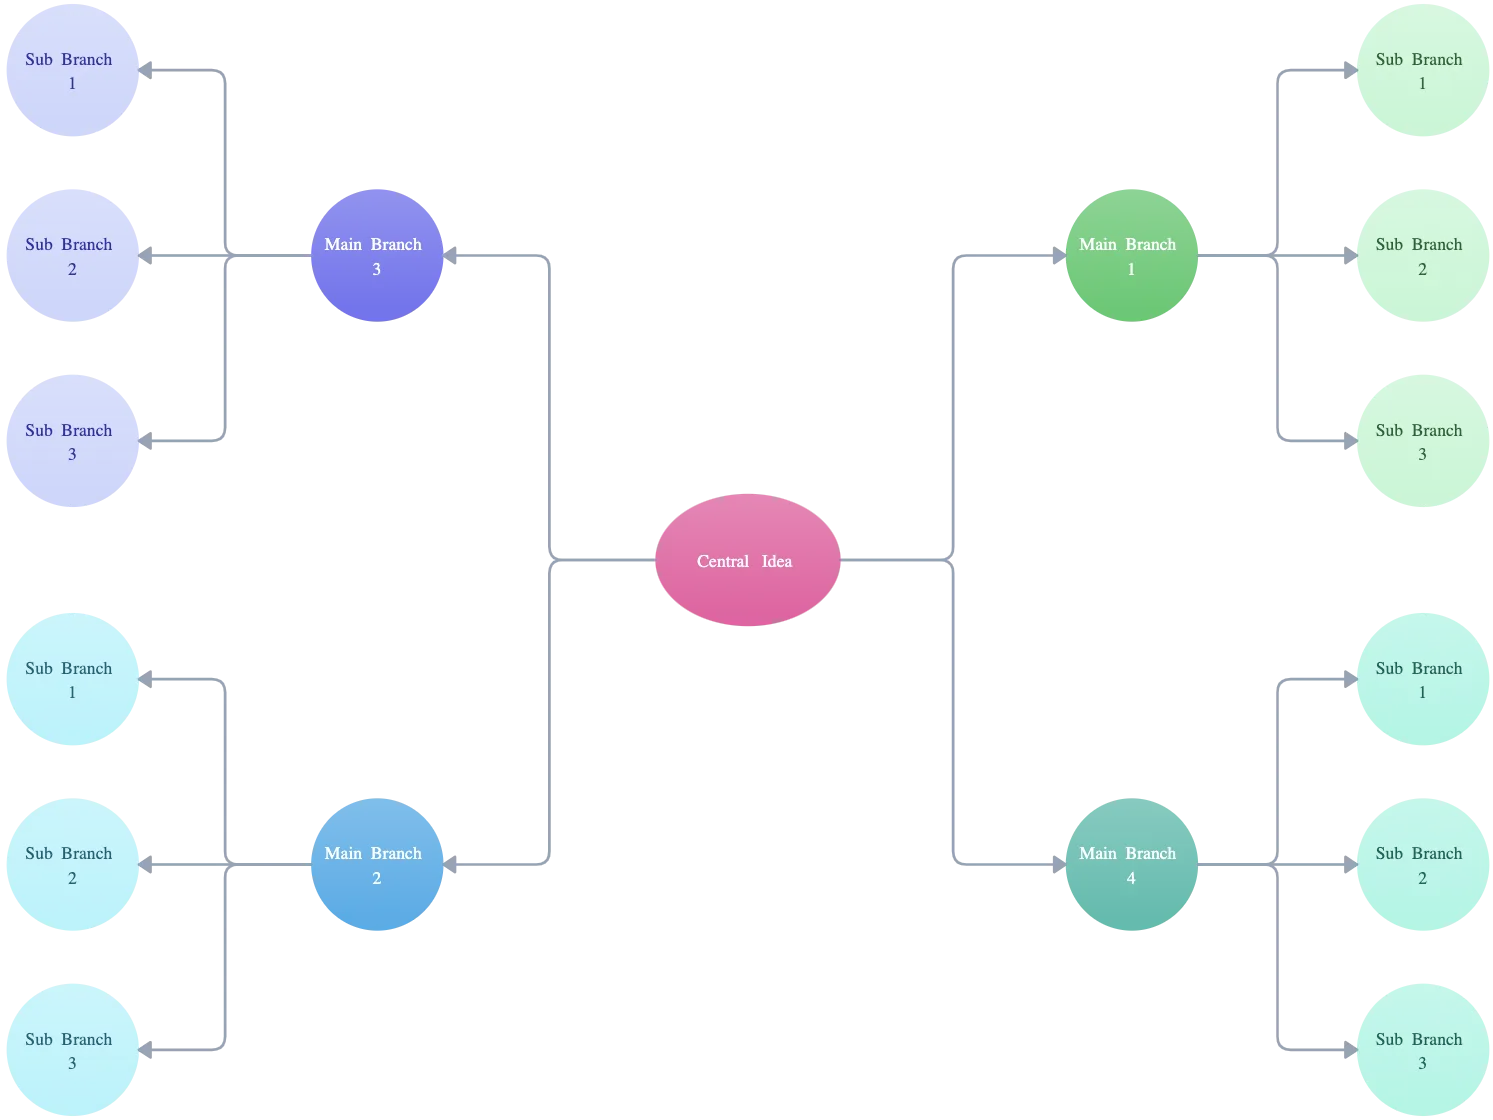
To move from rough thinking to clearer structure, they can build either free-form idea maps or more organized spider charts with Plus Create.
By grouping related concepts with color coding and frames, learners can quickly spot patterns, themes, and relationships worth exploring further.
Add Context That Makes Ideas Easier to Work With
A spider diagram becomes more useful when it holds not just ideas, but also the supporting information people need to understand and act on them.
When brainstorming needs more depth, teams can drag in images, icons, and vector graphics to make ideas easier to interpret and discuss.
To keep supporting information close to the main concept, they can attach notes, links, and documents directly to diagram elements.
If the diagram needs to guide a discussion or presentation, built-in presentation tools make it easy to walk others through the thinking without switching platforms.
During working sessions, freehand drawing and annotations help teams sketch connections, highlight priorities, and capture ideas as they happen.
Turn Brainstorming Into Shared Understanding
Spider diagrams work best when people can build, review, and refine ideas together instead of passing static files back and forth.
During ideation sessions, collaborators can work together on the same shared canvas in real time to generate and organize ideas faster.
When ideas need explanation or follow-up, comments and discussions on the canvas help keep context attached to the right part of the diagram.
To share progress with others, teams can send a secure workspace link or export the spider diagram as PNG, SVG, or PDF for review or presentation.
With advanced collaborator controls, it becomes easier to manage who can view, comment, or edit the workspace as the diagram evolves.
Why Use a Spider Web Diagram Maker?

How to Collaborate Effectively with Creately
Teams can collaborate around a spider diagram to develop a shared understanding, find patterns and insights and make informed decisions, especially in terms of complex data. Spider diagrams also encourage teamwork, collaboration and support to build a data-driven decision making culture in an organization.
- Brainstorm visually:
Use the infinite whiteboard, sticky notes, and freehand drawing tools to gather ideas and define the variables for your spider diagram online.
- Create a single source of truth:
Set up a dedicated workspace in Creately and assign permission levels so everyone can contribute ideas, research, and insights in one central location.
- Store and organize data:
Use the notes panel and data fields in the spider diagram creator to attach references, images, documents, and links directly to diagram elements.
- Present ideas clearly:
Format your spider map with frames, shapes, color themes, and advanced styling for a clear, presentation‑ready visual.
- Track changes over time:
Use version history to revisit earlier diagram versions, refine ideas, and keep your spider diagram evolving with your team’s progress.
Create a Spider DiagramPopular Use Cases on Spider Diagram Examples
How to Use Creately’s Spider Diagram Maker?
Identify the main topic or goal
Begin by defining the central idea your spider diagram will focus on. Gather your team and set clear guidelines for collaboration. Choose Creately’s infinite canvas and real-time features—an ideal platform to create a spider diagram online and foster innovation.
Brainstorm with your team
Use Creately’s whiteboard, freehand drawing, and conferencing tools to capture ideas and subtopics. Encourage everyone to actively participate and contribute to the spider diagram maker session.
Organize the subtopics
Group related ideas logically using Creately’s tables or clusters, helping to structure your spider map clearly for easier analysis.
Create the spider diagram
Collaborate to review the completed spider web diagram maker output, identifying patterns and insights to support informed decisions.
Analyze and discuss insights
Collaborate to review the completed spider web diagram maker output, identifying patterns and insights to support informed decisions.
Share and collect feedback
Share your spider diagram online via workspace links or exports. Use in-line comments and @mentions within Creately to gather targeted feedback.
Review and refine over time
Conduct final reviews, keep refining the diagram as new ideas emerge, and leverage Creately’s version history to track changes and revert if needed. This ensures your spider diagram maker stays relevant and actionable.
FAQs About the Spider Diagram Maker
What are Creately’s spider diagram maker pricing plans?
- Free Plan — $0/month for basic spider diagram creation and collaboration
- Starter & Team Plans — $8/month or $5/month billed annually
- Business Plan — $149/month or $89/month billed annually
Annual billing helps you save more while unlocking advanced collaboration, workspace management, and enhanced spider diagram features. You can compare all available plans and features on the Creately Pricing Page.
When to use a spider diagram?
- A visual brainstorming technique, spider diagrams are commonly used for organizing and visualizing ideas.
- Idea generation - helps brainstorm ideas around a topic
- Research - quickly organize ideas in an easy to understand manner during a research
- Note-taking - information you gather during lessons can be easily taken down with a spider diagram
- Presentation - Using spider diagrams, an idea or concept can be presented in an engaging way
How to edit a spider diagram template in Creately’s Spider web diagram maker?
How can I share my spider diagram?
What are the benefits of using a spider diagram template?
A spider diagram template, offers several advantages for note-taking, brainstorming, and organizing information:
- Visual Organization: Spider diagrams visually represent the relationships between ideas, making it easier to understand complex topics and see connections that might not be immediately apparent in linear notes.
- Enhanced Creativity: The non-linear structure of spider diagrams encourages creative thinking and brainstorming, allowing you to explore different perspectives and ideas freely.
- Improved Memory: Visual aids like spider diagrams can help you remember information more effectively by providing a mental anchor for key concepts and their relationships.
- Spider Web Diagrams are an Efficient Study Tool: Spider diagrams can be used as a study tool to review and summarize information before exams or presentations.
- Effective Communication: Sharing a spider diagram with others can help you communicate your ideas clearly and concisely, making it a valuable tool for collaboration and presentations.
Creately’s spider chart maker offers multiple customizable spider diagram templates, so that you can get a head start on brainstorming.
What is a spider diagram in note-taking?
What is the difference between a spider diagram and a mind map?
While the terms “spider diagram,” “mind map,” and “concept map” are often used interchangeably, there can be subtle differences in their approach and emphasis:
- Focus: Mind maps and concept maps generally emphasize the visual representation of ideas and their connections, while spider diagrams might have a slightly stronger focus on hierarchical organization.
- Layout: Spider diagrams often have a more structured layout with clearly defined branches, while mind maps can be more free-form and organic in their appearance.
- Keywords: Mind maps typically use keywords or images to represent ideas, while spider diagrams may include more detailed descriptions or explanations.
Guides and Resources to Visually Brainstorm Effectively