The business analysis models come into play when understanding the requirements of stakeholders in every organization whilst identifying opportunities for growth and problem-areas which needs attention. While there are many areas to look at, it would consume more time unless you have the correct tools at hand.
In this guide, we have compiled a list of business analysis models that you can use during a strategic, tactical or operational business analysis. They are as follow,
Analyzing Organizational Strengths and Weaknesses
Organizational Charts
Organizational charts help to visualize the hierarchy of your organization and the reporting relationships among employees. Org charts are useful when planning a project, allocating resources, planning for future projects or organizational developments.
Any change you want to make to your organizational structure should start with an organizational chart template like the one below.
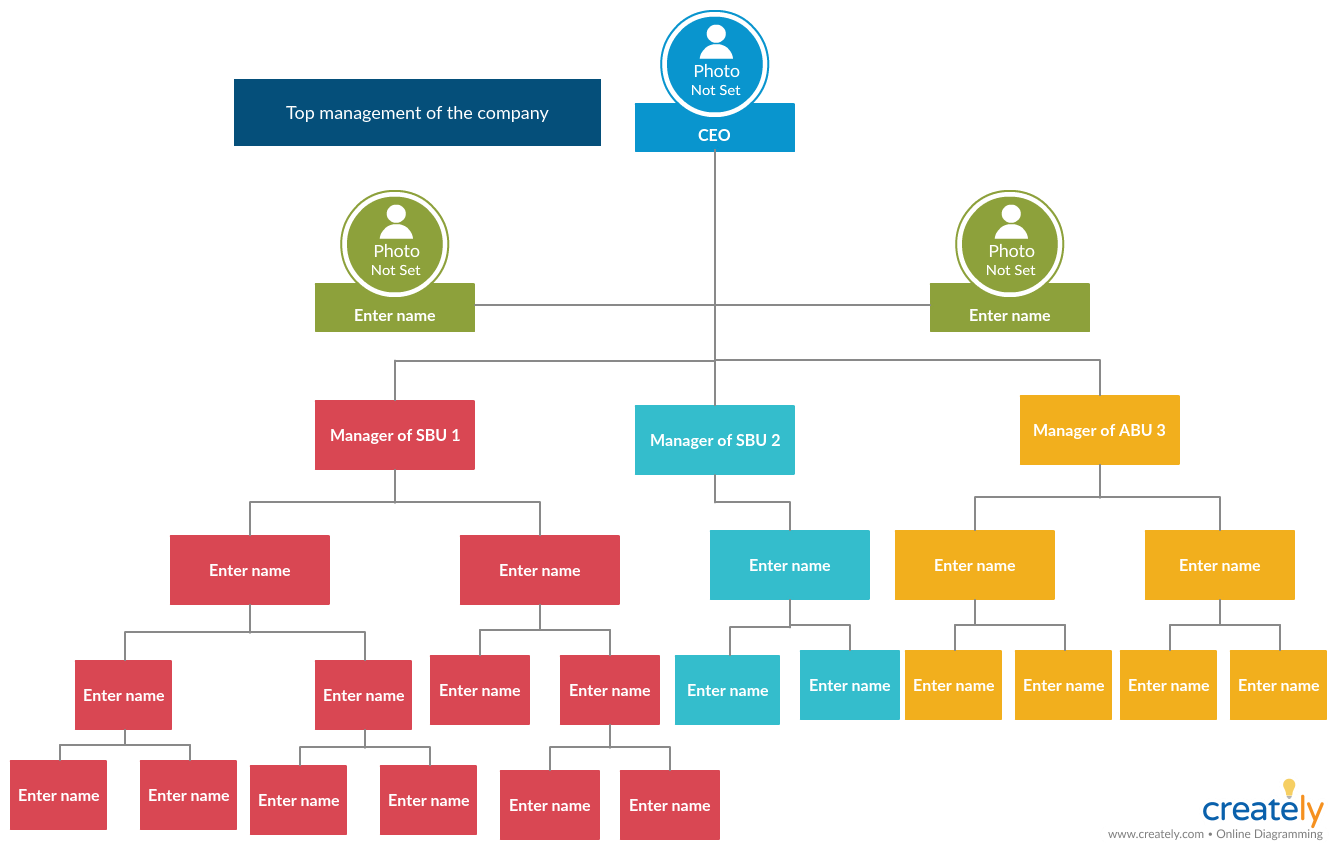
Organogram Template (Click on the template to edit it online)
More Organizational Chart Templates
MOST Analysis
Business analysts use the MOST analysis to plan and analyze organizational activities and make sure that they are centered around your business goals.
How to do it
MOST stand for,
Mission – Mission is basically what your organization wants to accomplish or its purpose. It should be centered around your stakeholders and benefits. Write down your mission statement in the Mission box of your MOST analysis template.
Objectives – These are the individual goals that will help you complete your mission.
Strategy – This section includes the different tasks you have to do to reach your objectives.
Tactics – Here you need to identify and list down the specific tactics you need to get your activities done.
Once you’ve filled out the template, you can get a quick overview of how you need to plan your organizational strategies.
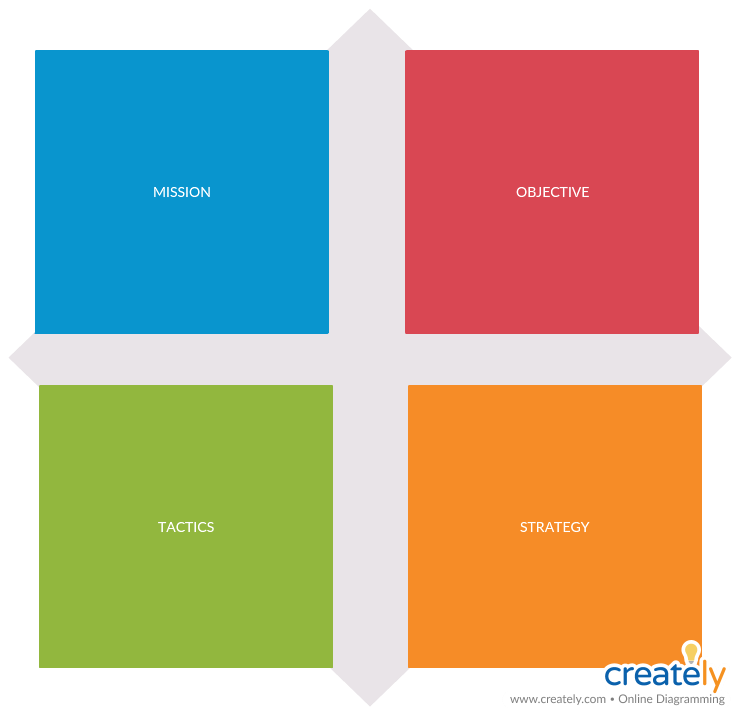
MOST analysis template ( click on the image to edit this online )
PESTLE Analysis
PESTLE analysis is a tool that is used to identify and examine the external factors that affect a business. These macro environmental factors the analysis try to identify are
- Political factors such as government policies, trading policies or elections
- Economic factors such as economic trends, taxes, or import/export ratios
- Social factors such as demographics, lifestyles, or ethnic issues
- Technological factors like advancing technology or technology legislation
- Legal factors such as employment laws or health and safety regulations
- Environmental factors such as climate change or environmental regulations
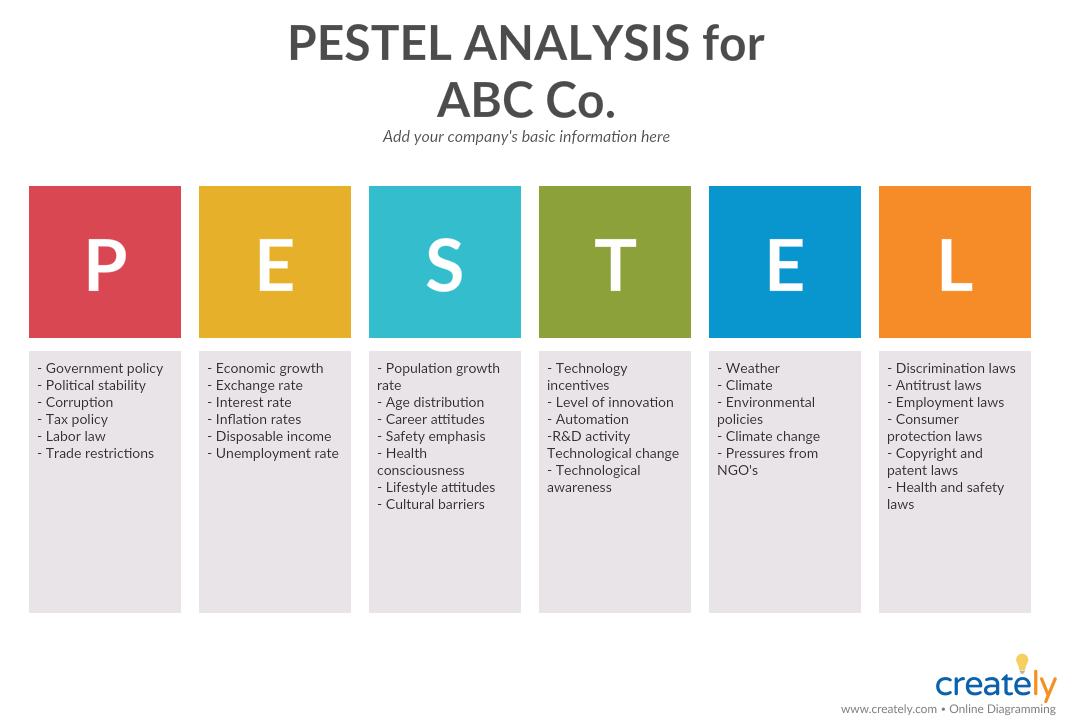
PESTLE Analysis for Business Analysis (Click on the template to edit online)
SWOT Analysis
SWOT analysis can be used to identify both internal and external factors that may affect a business. These are Strengths, Weaknesses, Opportunities and Threats.
Refer to our post on SWOT Analysis: What, Why and How to Use Them Effectively to learn about the technique in more detail.
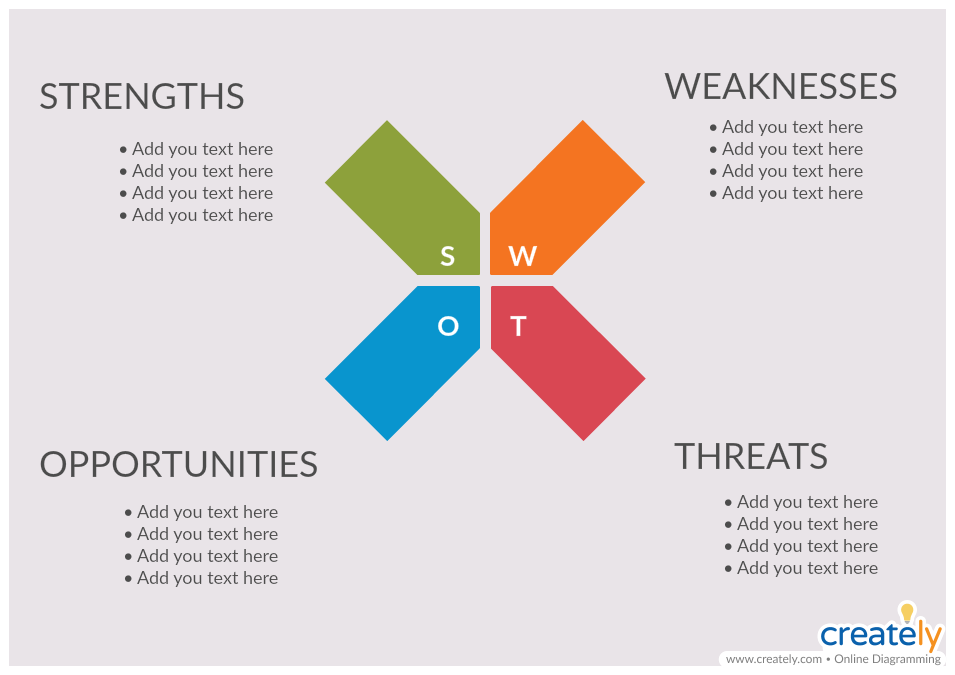
SWOT Analysis for Business Analysis (Click on the template to edit online)
Check out our post on Marketing Strategy Planning Tools to learn about more useful tools and techniques for business analysts.
Analyzing Competitors and the Market Trends
A competitive analysis lets you identify what makes your product or service unique from that of your competitors and develop strategies to attract your competitors.
There are many competitor analysis techniques like Porter’s Five Forces, value proposition canvas, radar chart etc. to conduct a research on your competitors. Refer to our post on Visual Techniques to Conduct a Competitive Analysis to learn about these techniques in detail.
Analyzing Products and Services
Product Roadmap
Product roadmaps are a great way to analyze the development or the evolution of a product over time. They highlight the goals, milestones, and deliverables of your product development project.
They can also be used
- To communicate product related details to stakeholders and customers
- As a guiding document for strategic planning
- To coordinate the product development process
- To track your progress in achieving your objectives
How to create it
Step 1: Decide the duration of your roadmap and who you are designing it for. While you need to tailor your roadmap for your audience (i.e. if it is for your product development team the map should detail all specific tasks and features and dates), the timeframe should be reasonable.
Step 2: Collect the information you need to create the roadmap. These include goals, tasks, deadlines, key milestones etc.
Step 3: Using a product roadmap template like the one below, you can easily visualize these details for quick reference
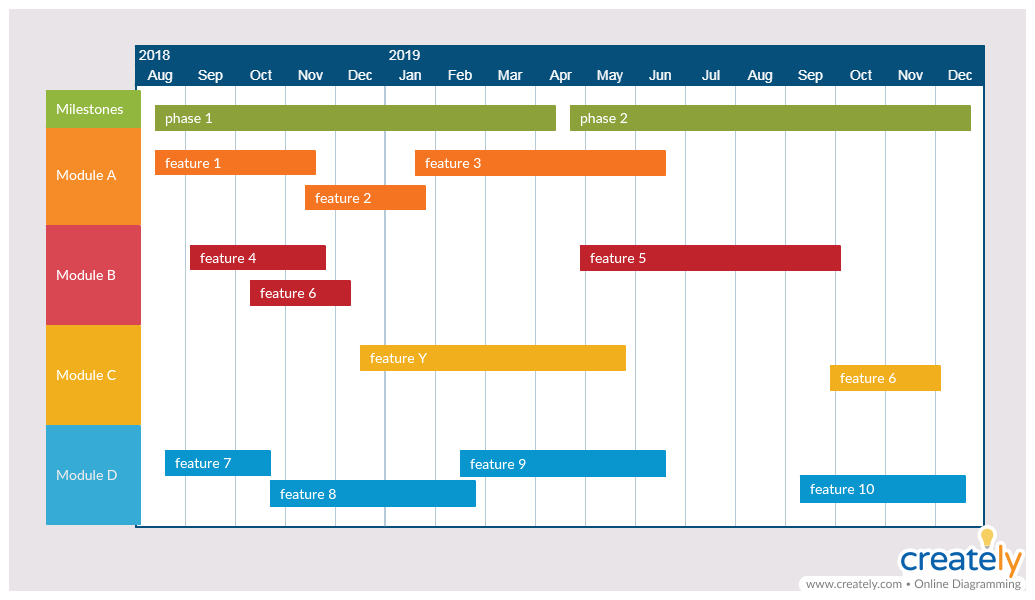
Product Roadmap (Click on the template to edit it online)
Mind Map of Product Features
The initial phase of a product development process or any other project usually make up of brainstorming sessions. There are a lot of ideas and opinions shared and requests made. Business analysts can use mind maps to capture and organize these ideas shared.
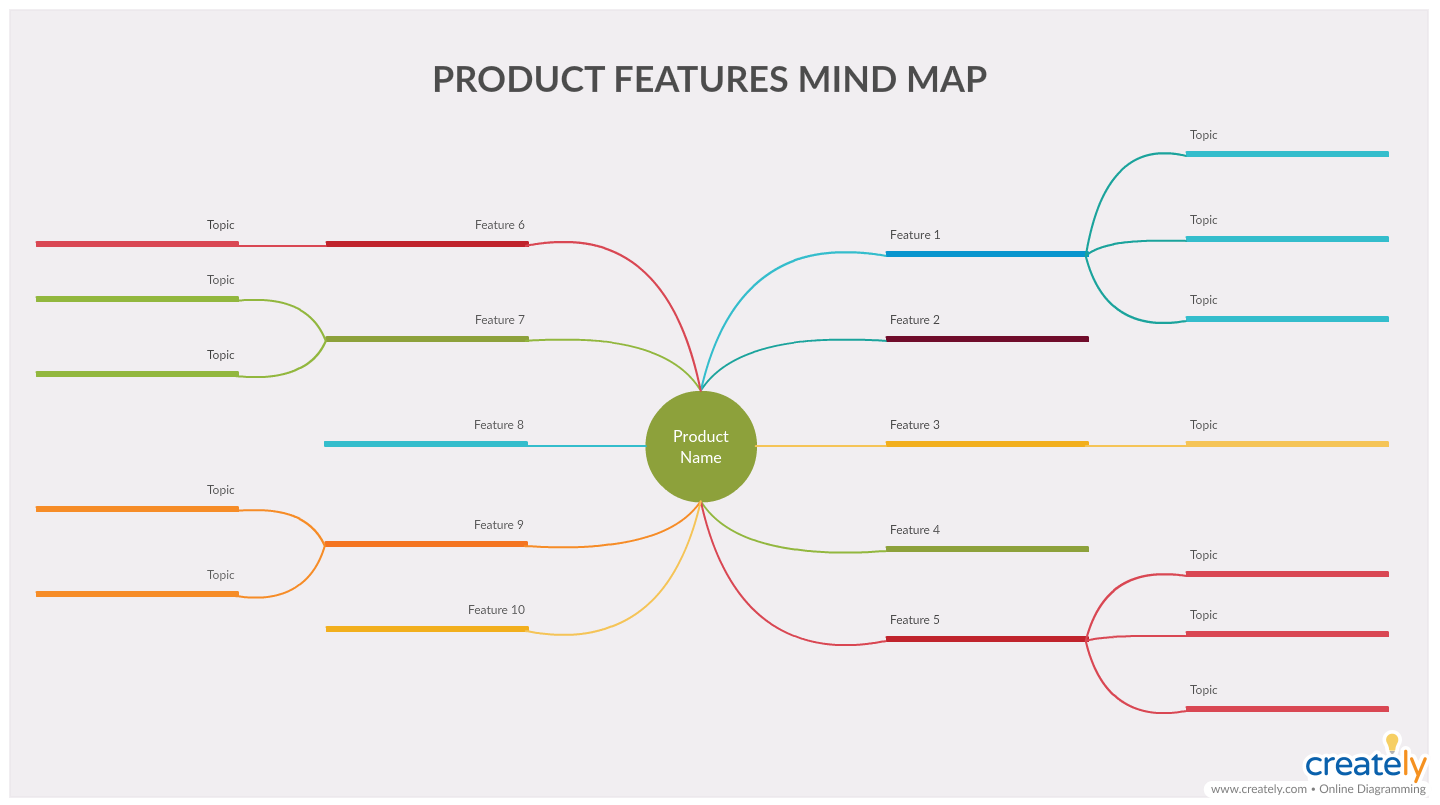
Product Feature Mind Map (Click on the template to edit online)
Analyzing Systems and Processes
Activity Diagrams
Activity diagrams visualize use cases at a more detailed level. Business analysts can use them to illustrate the flow of events in a business process, or the flow activities through a system.
How to use it
Step 1: Identify the various steps in your business process or the activities in your system
Step 2: Identify the actors involved in the process. If you know who they are, it would be easier for you to decide the steps performed by them
Step 3: Find the order in which each order the process steps flow
Step 4: Add swimlanes to your activity diagram to highlight the responsible actors
To learn about activity diagrams in more detail, refer to our Easy Guide to Activity Diagrams.
Use Case Diagrams
Use case diagrams let you identify the different roles in a system and how they interact with it. These come in handy when you want to communicate how a system functions to your stakeholders etc.
Here’s our use case diagram tutorial to learn how to draw a use case diagram.
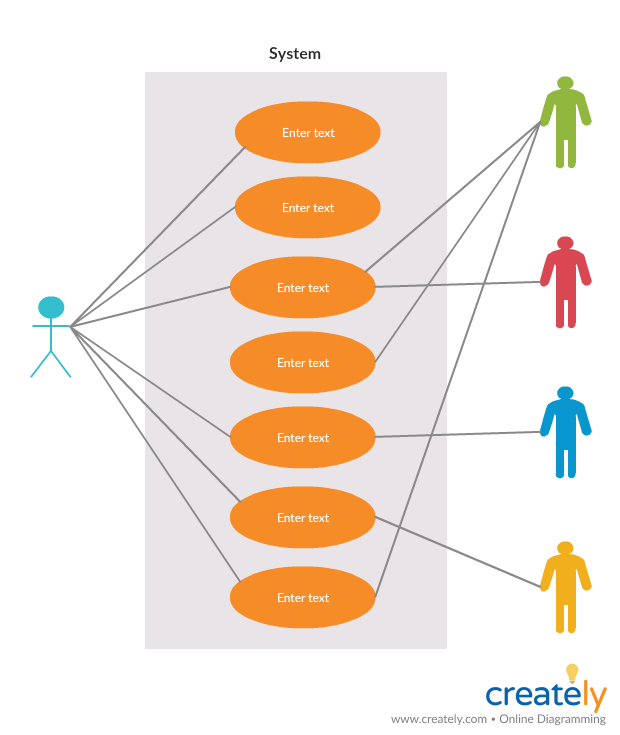
Use Case Diagram for Business Analysis (Click on the template to edit online)
Navigation Map
The website navigation map helps you design your wireframes and UI mockups. It basically outlines how the user interface flows, or how your customer would interact with your website.
To draw a navigation map, you need to know the touchpoints your ideal website visitor would interact with upon visiting your site. You can use a customer journey map to identify these touchpoints and then use the following navigation map template to outline the website journey of your visitors.
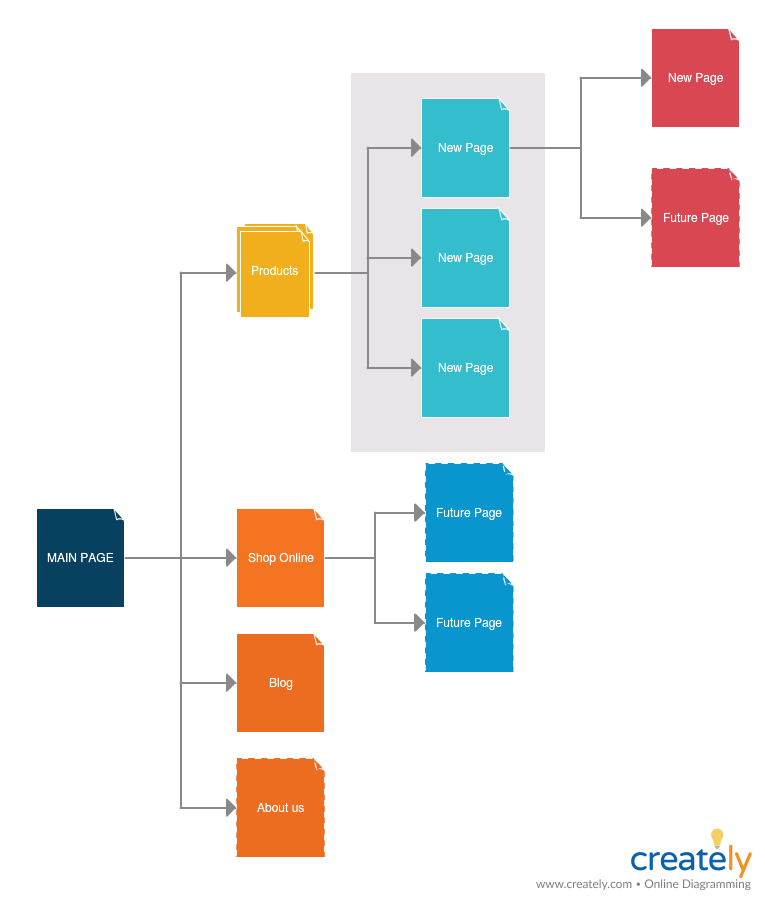
Website Navigation Flow for Business Analysis (Click on the template to edit online)
Wireframe and UI Mockup Templates
User Interface Wireframes
Wireframes present a blueprint of your website or application screen. It will help you define the information hierarchy of your design and in turn letting you plan your website or app in a user-friendly way.
How to use it
Step 1: Decide on all the details you want to add to your design.
Step 2: Create the layout by drawing boxes on the grid. It would be easier for you if you start adding information from top to bottom and left to right. Or you can simply select a wireframe like the one below from the Creately UI mockup and wireframe templates to get a head start.
Step 3: Add text to define the information hierarchy. Here you can use different font sizes to see how it would look.
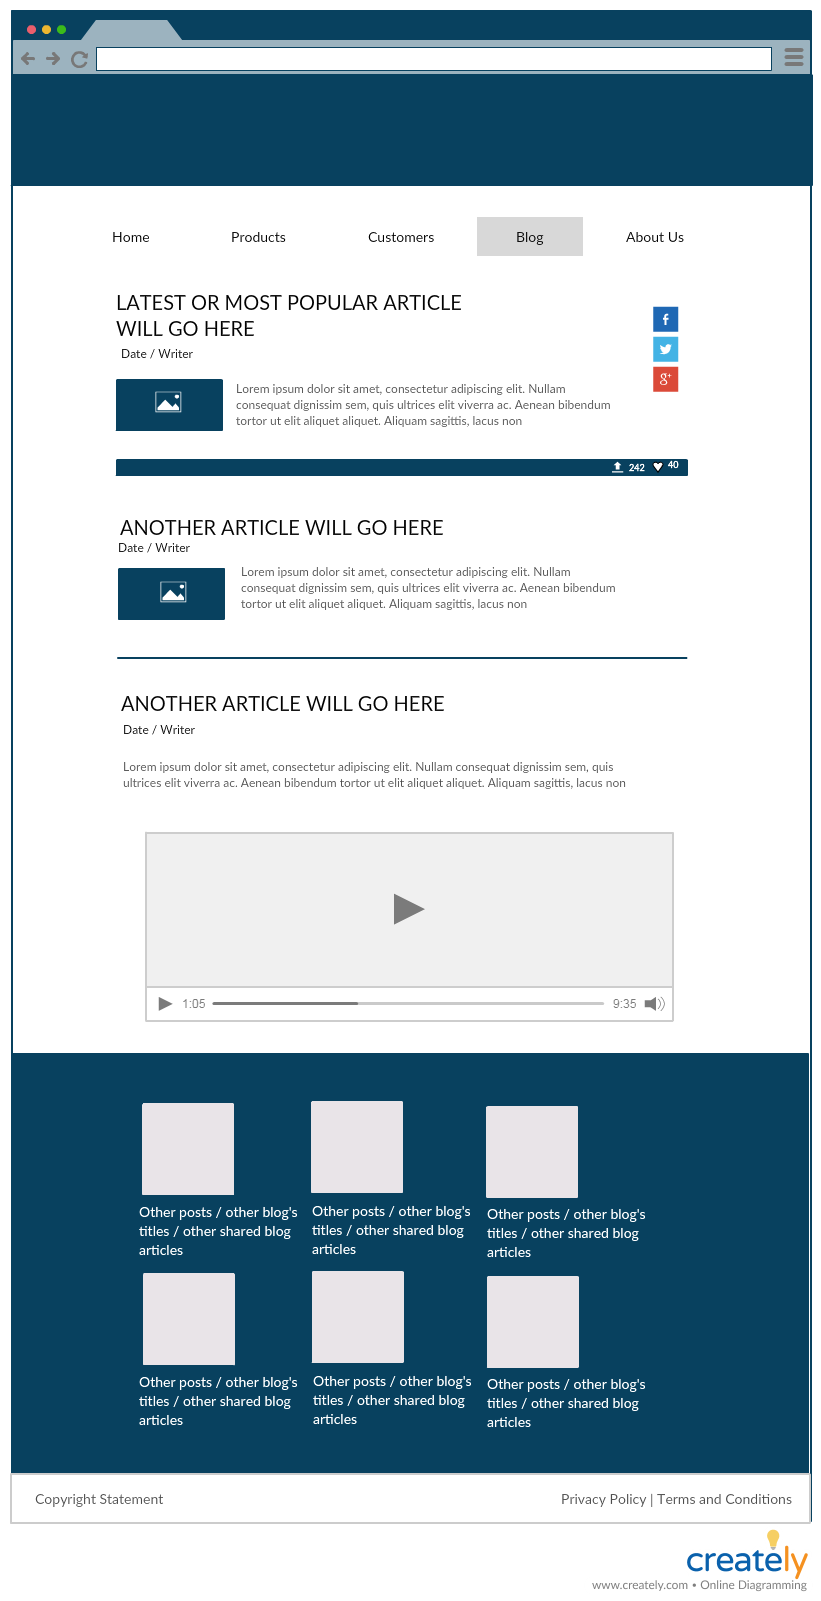
User Interface Wireframe for Business Analysis (Click on the template to edit online)
Process Maps
With process maps, it’s easier to understand processes and identify bottlenecks and blockers that might be slowing your business processes, as they visualize a process step-by-step.
You can use a current-state process map and future-state process map to identify gaps in your processes and communicate how your work gets done to your stakeholders.
Check out our process map tutorial to learn how to draw a process map. Our post on process map improvement techniques covers 9 process improvement methodologies that you can use to streamline your business processes.
Analyzing Stakeholders and Their Interests
Stakeholder Map
When planning a project, it’s important to know who the stakeholders are and why the project is important to them. It helps identify stakeholder roles and responsibilities.
How to use it
Step 1: Identify the stakeholders of your project. These are the people who may be affected by your project directly or indirectly. Remember to consider those who come from outside your company as well.
Step 2: Based on the stake they have in your project, group and prioritize them.
Step 3: Using a stakeholder map, categorize your stakeholders.
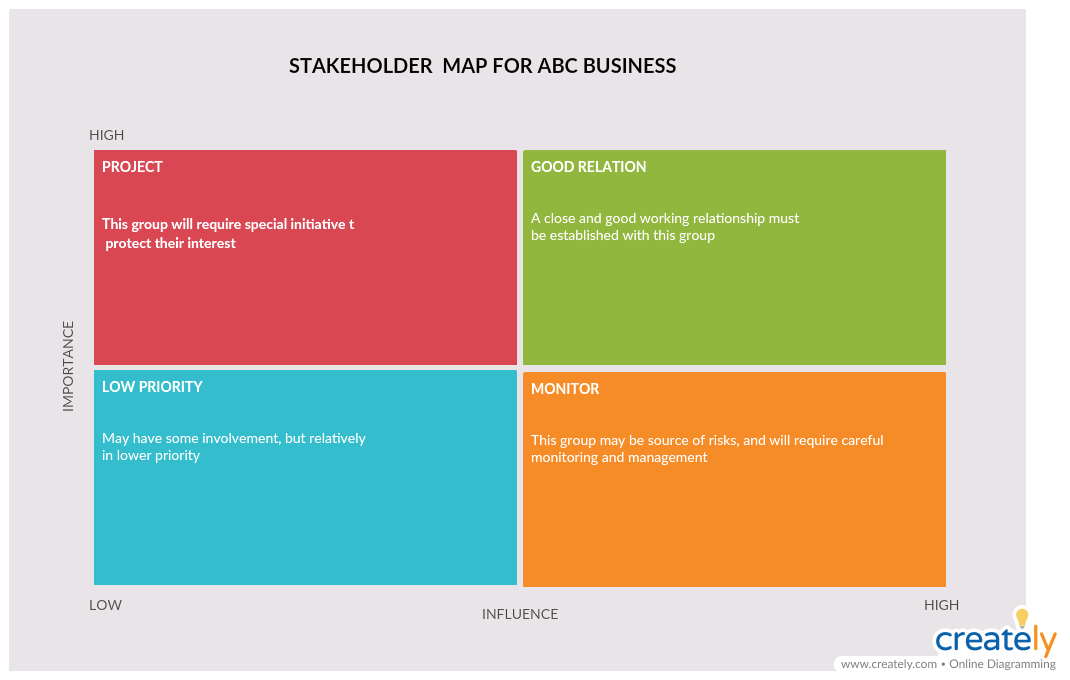
Stakeholder Map (Click on the template to edit online)
Threats and Opportunity Matrix for Stakeholders
Threats and opportunity matrix is used by business analysts to examine how project stakeholders will be affected by implementing and not implementing a proposed solution. It helps to make better decisions with regard to your stakeholders as it helps you look at things from their perspective.
How to do it
Step 1: Get a list of stakeholders and have a look at your project charter
Step 2: List down the reasons for the change you want to implement. Then list down the threats of not implementing the change, and the opportunities you can gain by implementing the change.
Step 3: Think of the reaction of stakeholders who would not like the change and list down the threats of implementing the change and opportunities of not making any changes.
Step 4: Get together your team and discuss the results. Arrive at a conclusion that won’t negatively affect your key stakeholders.
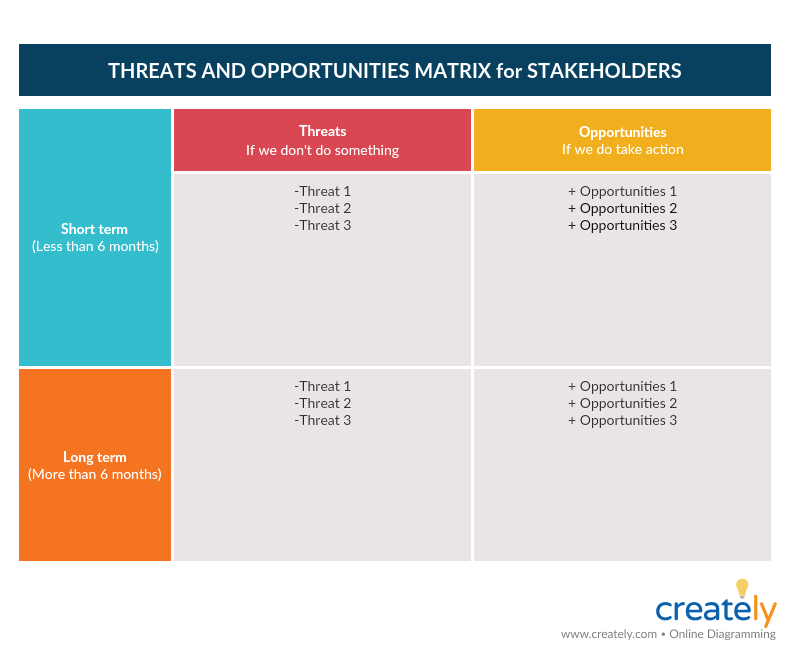
Threats and Opportunity Matrix for Stakeholders (Click on the template to edit online)
MoSCoW Method
MoSCoW method is used to understand priorities. With it, you can quickly decide which to prioritize when it comes to your customer requirements, projects, project tasks, and products etc.
While the o’s are added to make pronunciation easier the rest of the letters stand for
M – Must Have (a requirement you must have to meet a business need)
S – Should Have (a requirement you should have if possible)
C – Could Have (a requirement you could have if it doesn’t affect other project activities negatively)
W – Would Have (a requirement that you would like to have later)
By categorizing your requirements with a matrix like below, you can decide which requirements to prioritize, which you can do later and which to exclude.
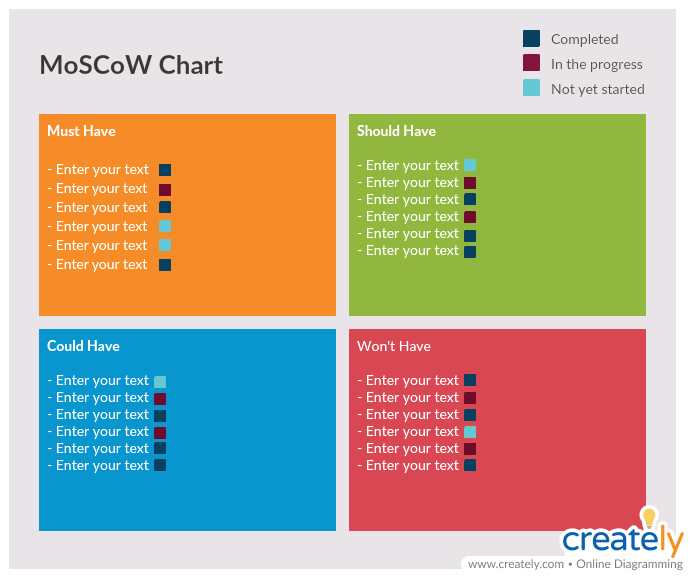
MoSCoW method template (Click on the image to edit this online )
Managing and Dealing with Change
In the context of business, implementing change is never easy, especially as it may affect so many aspects. By using the correct tools, you can make sure that you adapt to new changes seamlessly.
In our Guide to Change Management Tools, we discuss change management techniques that you can use to plan ahead for the changes in your organization.
Add to the List of Business Analysis Models
Whether planning a project, developing strategies, or improving business processes, you can use the business analysis models in this list, for quick solutions. These are just a few business analysis techniques from those that are out there.
What other business analysis models do you use in your organization? Do add them in the comment section below so we can expand this list.