Yes. A genogram can include LGBTQ+ people, transgender and nonbinary family members, same-gender couples, chosen family, adoptive and foster families, donor-conceived children, surrogacy, co-parenting arrangements, polyamorous relationships, and other family structures.
A genogram should reflect the family as the people involved understand and experience it. It does not have to be limited to heterosexual couples, binary gender symbols, biological relatives, or legally recognized relationships.
The most important thing is to show each person and relationship accurately, separate different family roles where needed, and explain any unfamiliar notation in a legend.
What Can an Inclusive Genogram Show?
An inclusive genogram may include:
- Gender identity and pronouns
- Sexual orientation, when relevant
- Same-gender and different-gender relationships
- Marriage, cohabitation, separation, divorce, and committed partnerships
- Transgender, nonbinary, intersex, and gender-diverse family members
- Biological, adoptive, foster, step, and intended parents
- Sperm donors, egg donors, surrogates, and donor-conceived children
- Guardians and non-romantic co-parents
- Polyamorous or multi-partner relationships
- Chosen family and important support figures
- Emotional relationships such as closeness, support, conflict, distance, or cutoff
You do not need to include every possible detail. Add the information that helps explain the family structure, history, support system, or pattern being explored.
How to Add LGBTQ+ Relationships to a Genogram
Use the same partner or union lines used for any other relationship.
These may show:
- Marriage
- Civil partnership
- Engagement
- Cohabitation
- Committed relationship
- Separation
- Divorce
- Former relationship
- Non-romantic co-parenting relationship
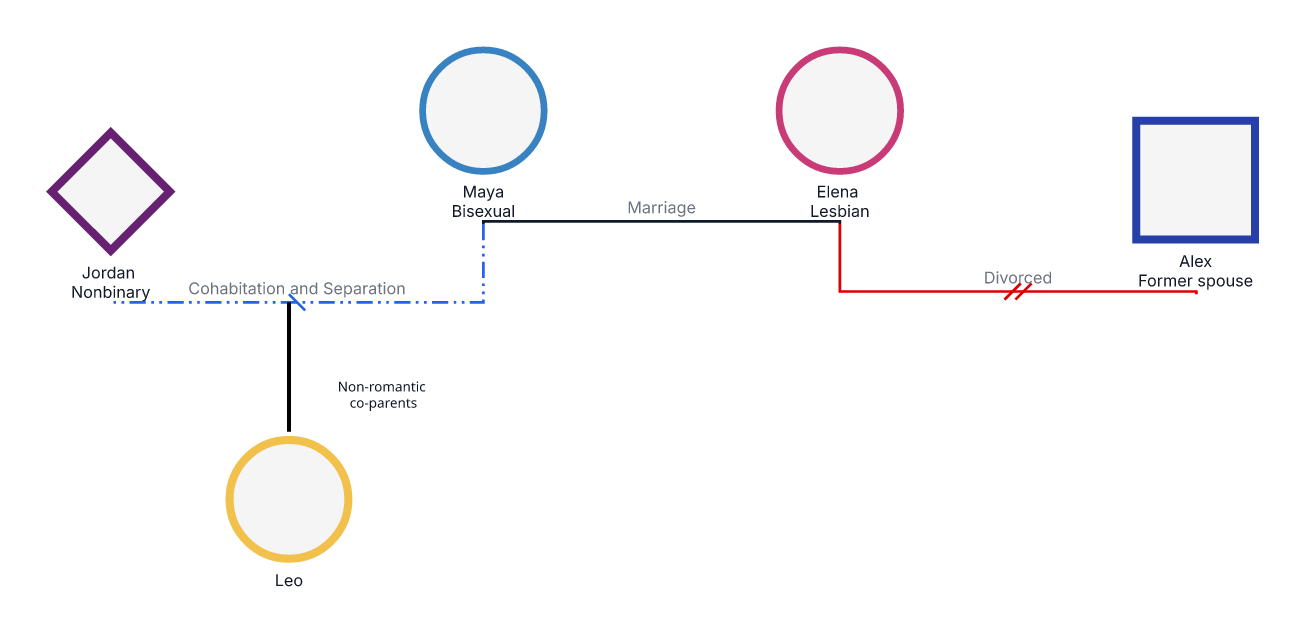
The genders of the people do not determine the relationship type. Two women, two men, nonbinary partners, or partners of any other identities can be connected using the same marriage, partnership, separation, or divorce notation.
Do not infer a person’s sexual orientation from their current partner. Someone in a same-gender relationship may identify as gay, lesbian, bisexual, pansexual, queer, or in another way.
Avoid relying on the traditional rule of placing a man on the left and a woman on the right. Arrange people according to chronology, generation, and diagram clarity.
In Creately: Choose the relationship type that matches the actual connection. Creately’s genogram maker includes partner, parent-child, emotional, adoptive, foster, step, and other relationship types, each with its own visual notation.
How to Represent Transgender and Nonbinary People
Traditional genograms commonly use:
- A square for a man
- A circle for a woman
- A diamond for unknown or unspecified gender
These genogram symbols may not represent every transgender, nonbinary, intersex, or gender-diverse person accurately.
Depending on the notation system being used, you may use:
- An expanded transgender marker
- A neutral person symbol
- A custom symbol
- A standard person symbol with gender identity and pronouns written beside it
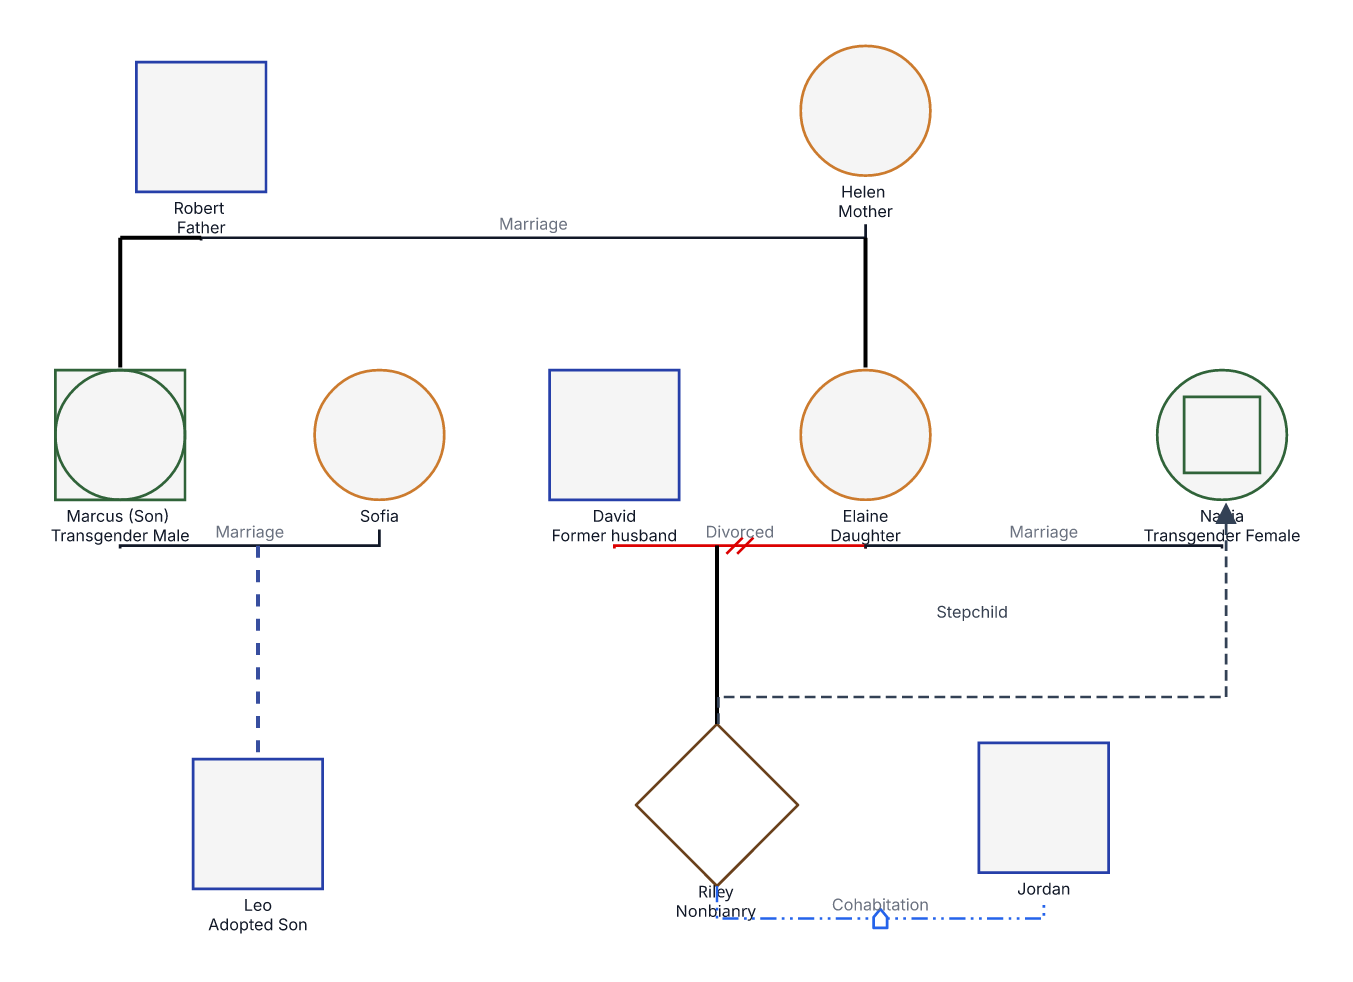
There is no single symbol used universally for every nonbinary identity. A diamond, for example, may mean nonbinary in one system and unknown gender in another. Always explain what the symbol means in the legend.
Where relevant, record these separately:
- Gender identity
- Pronouns
- Sex assigned at birth
- Sexual orientation
These are not interchangeable. Do not assume one from another.
Use the person’s current name and pronouns. Only include a previous name, transition history, sex assigned at birth, or other sensitive information when there is a clear and appropriate reason.
In Creately: Add gender, pronouns, dates, roles, and other relevant details to the person’s structured fields. Person shapes can update automatically based on the information recorded, including combined markers and deceased-status overlays.
How to Show Chosen Family
Chosen family may include friends, former partners, mentors, neighbours, community members, or others who provide family-level care, support, or belonging.
They may be described as:
- Chosen parent
- Chosen sibling
- Caregiver
- Support person
- Mentor
- Fictive kin
- Community elder
- Emergency caregiver
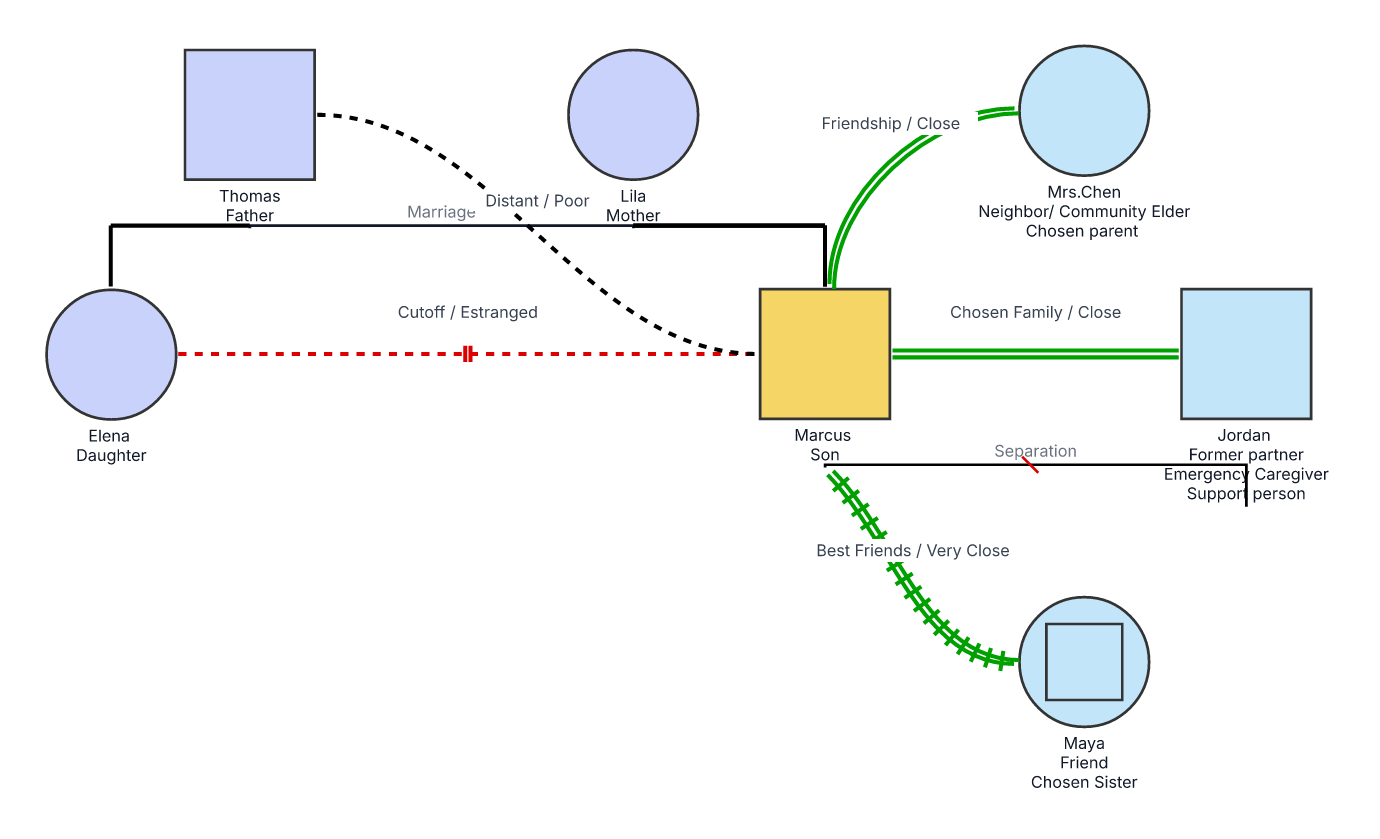
Use the term the person uses for the relationship.
Chosen-family members can be added to the genogram as individual people and connected using the genogram relationship types that best reflects their role. You can also add an emotional line to show that the relationship is close, supportive, distant, or conflictual.
A person can be central to the family system without being biologically or legally related.
In Creately: Add chosen-family members to the same canvas and use labels, notes, or emotional relationship lines to explain their role.
How to Diagram Adoptive, Foster, and Stepfamilies
Adoptive, foster, and step relationships should not be shown using the same line when their roles are different.
Use distinct notation for:
- Biological parent
- Adoptive parent
- Foster parent
- Stepparent
- Legal guardian
- Social or psychological parent
- Primary caregiver
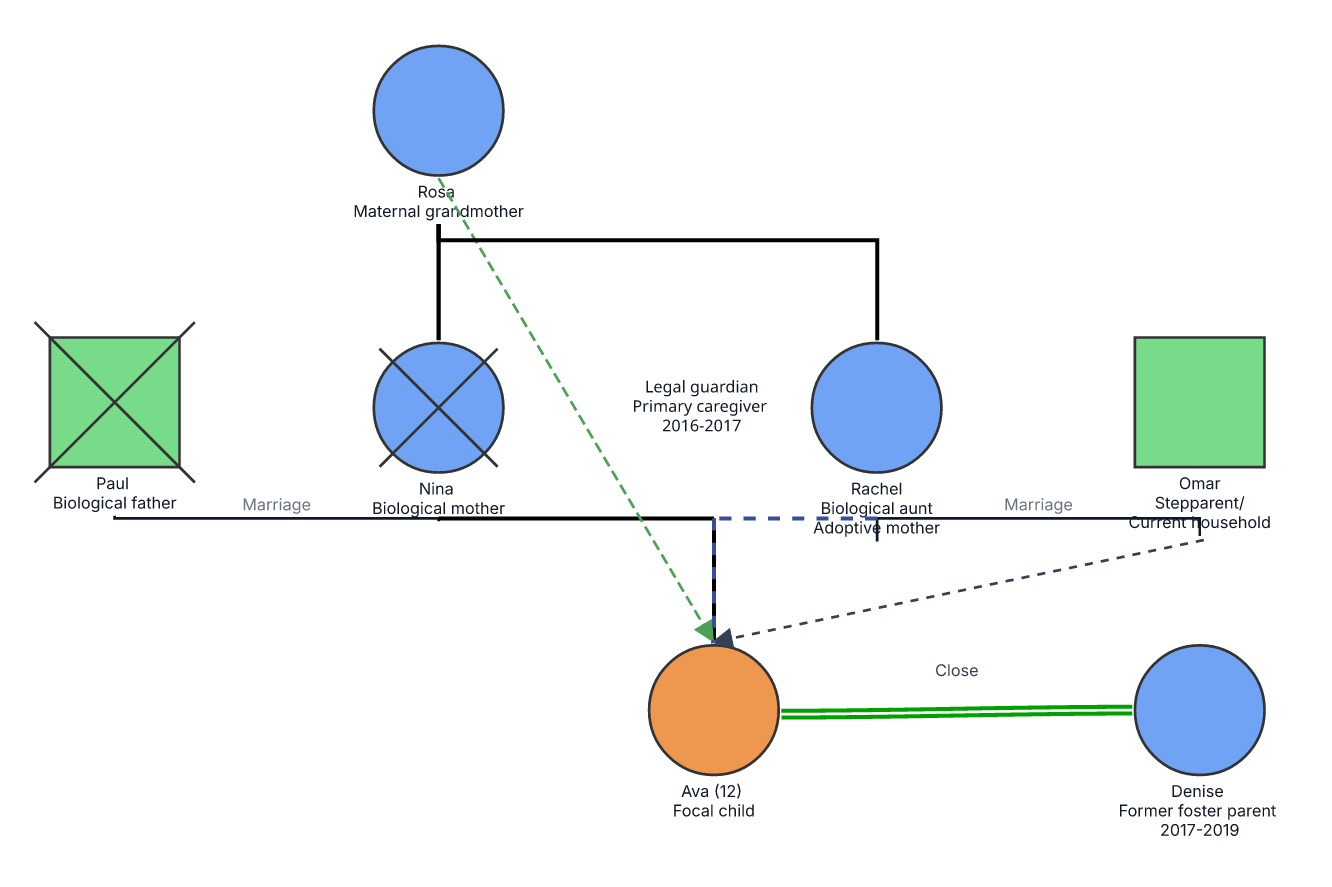
A child may have several meaningful parent-child relationships. For example, they may have biological parents, adoptive parents, a stepparent, and a foster caregiver.
Show each connection separately so the reader can understand how each person is related to the child.
In Creately: Use the appropriate biological, adoptive, foster, or step parent-child relationship type rather than relying on a generic line.
How to Document Donor Conception and Surrogacy
Donor conception and surrogacy may involve several different roles that should be mapped separately.
These may include:
- Egg donor
- Sperm donor
- Gestational parent
- Surrogate
- Intended parent
- Legal parent
- Social parent
- Primary caregiver
For example, a donor-conceived child may have:
- A known egg donor
- A gestational parent
- Two intended parents
- A stepparent
- A donor who has no parenting role
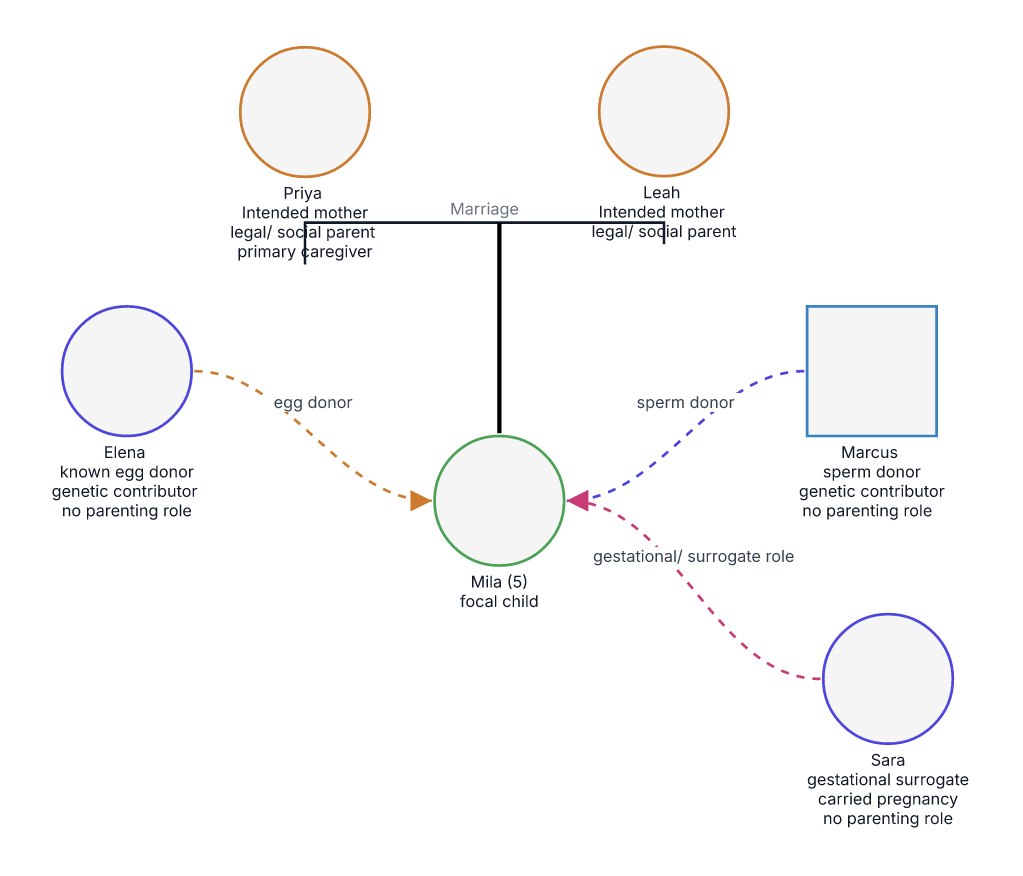
Do not automatically show a donor or surrogate as a parent. Show the genetic, gestational, legal, and caregiving connections according to the person’s actual role.
A medical genogram may place more emphasis on genetic links, while a therapy or social-work genogram may focus more on caregiving, attachment, contact, and decision-making.
In Creately: Use separate relationship lines, labels, structured fields, and notes to distinguish genetic, gestational, legal, and parenting roles.
How to Represent Multiple Parents or Co-Parents
A genogram can include more than two parents or caregivers.
These may include:
- Biological parents
- Adoptive parents
- Foster parents
- Intended parents
- Gestational parents
- Stepparents
- Legal guardians
- Social parents
- Non-romantic co-parents
- Primary caregivers
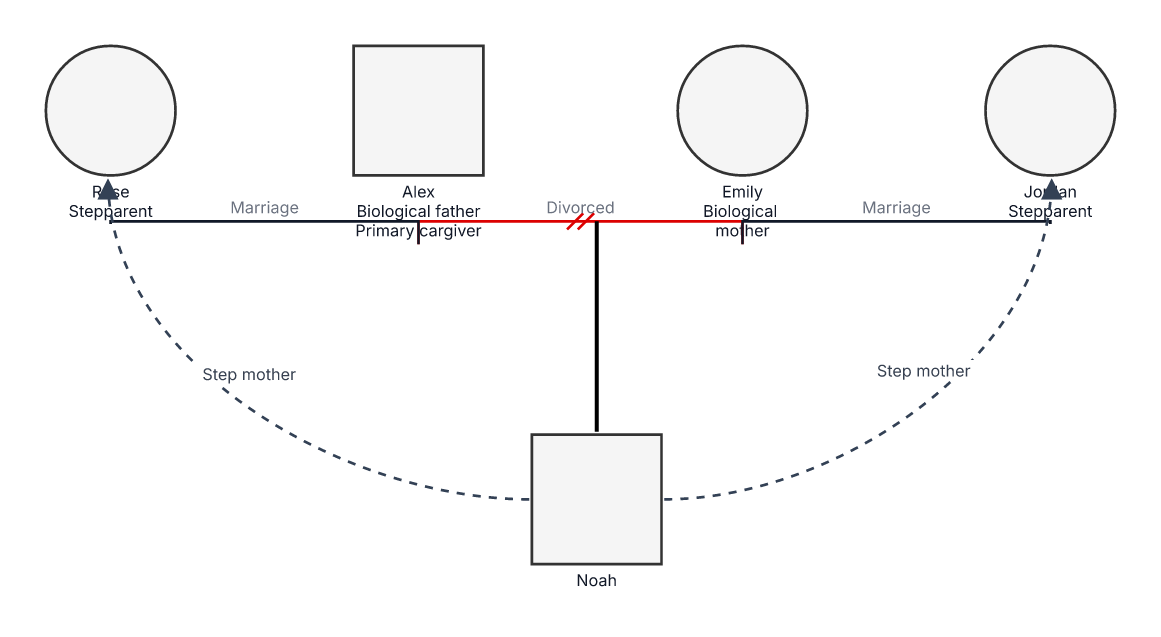
Connect each person to the child according to their actual role. Do not combine several relationships into one generic parent-child line.
This is especially important when a child has multiple adults involved in parenting, caregiving, legal decision-making, or emotional support.
How to Map Polyamorous or Multi-Partner Families
A genogram can show polyamorous or consensually non-monogamous relationships.
Draw each connection separately according to the relationship that actually exists.
Clarify:
- Who is romantically connected
- Who is not partnered with each other
- Which relationships are current or former
- Who shares a household
- Who has a parenting role
- Which relationships are legal or informal
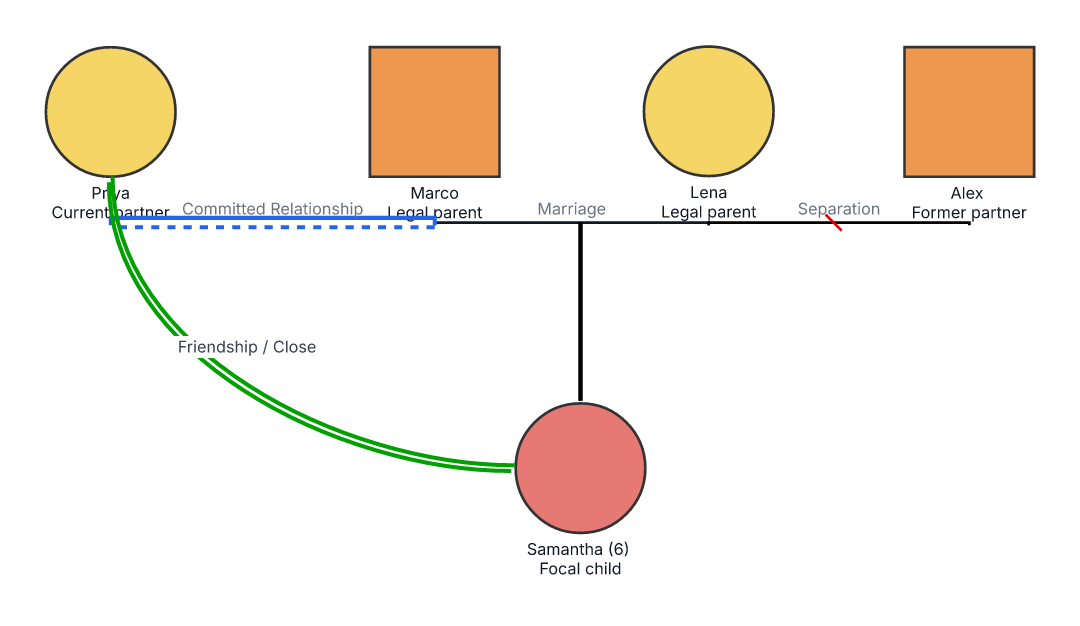
Do not use one connection to suggest that everyone in the group has the same relationship with every other person.
Use labels, dates, notes, or household boundaries when the structure cannot be explained clearly through lines alone.
In Creately: Add each relationship separately and rearrange the canvas as needed. Auto-layout can help maintain generational order and reduce crossing lines in larger family structures.
How to Map Emotional Relationships
An inclusive genogram can also show the quality of relationships within the family.
These may include:
- Close
- Supportive
- Enmeshed
- Distant
- Conflictual
- Hostile
- Cut off
- Reconciled
- Caregiving
- Abusive or controlling
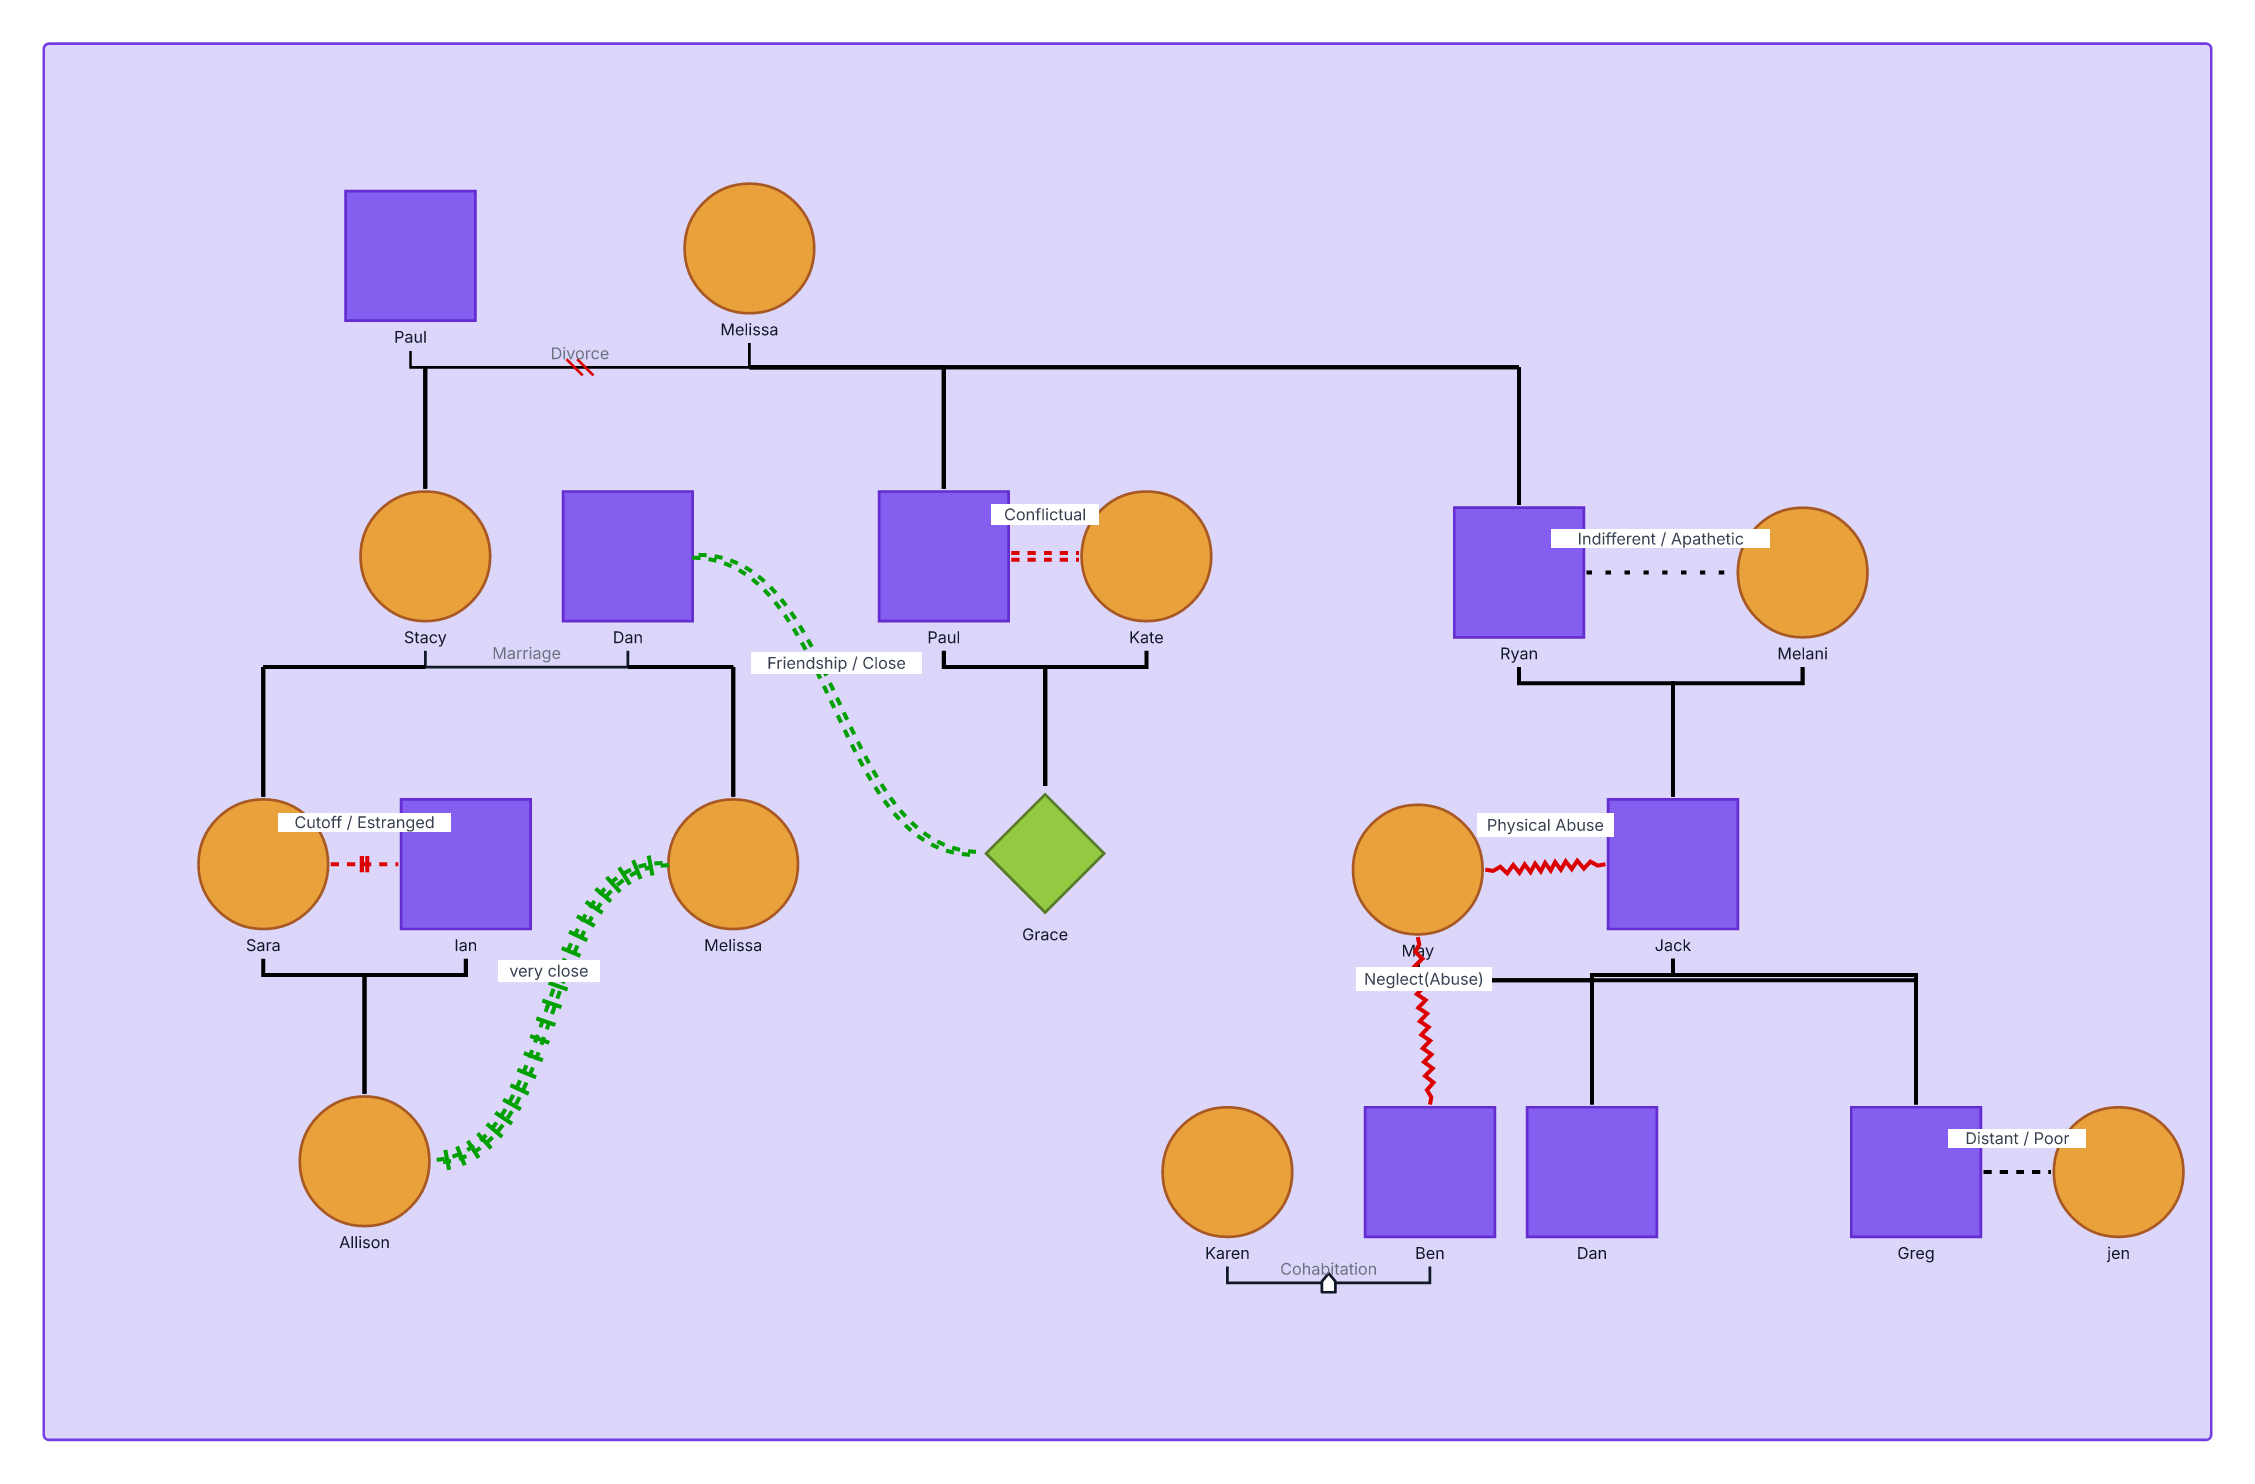
For LGBTQ+ and gender-diverse family members, emotional lines may help show experiences such as:
- Family acceptance
- Rejection
- Support after disclosure
- Estrangement
- Community support
- Reconnection
- Changes in family roles
The identity itself should not be treated as the problem. The genogram should show the relationships and experiences surrounding the person.
In Creately: Use the appropriate emotional relationship types to show support, conflict, distance, cutoff, or other dynamics. Creately includes a broad set of emotional and relational markers for professional genogram work.
Use Labels and a Legend to Avoid Confusion
A clear legend is essential when the genogram includes:
- Neutral or custom gender symbols
- Donor or surrogate relationships
- Chosen-family roles
- Polyamorous relationships
- Abbreviations
- Custom colors
- Less familiar emotional lines
Explain what each symbol, line style, label, and color means in that particular genogram.
This is especially important because symbols for nonbinary, transgender, donor, or non-traditional family roles are not always used consistently across textbooks, universities, and software.
In Creately: Add a legend beside the diagram and keep it visible when sharing or exporting the genogram. Structured case reports can also include a symbol legend.
How to Create an Inclusive LGBTQ+ Genogram in Creately
Creately lets you adapt the genogram to the family rather than forcing the family into a fixed structure.
You can:
- Add person shapes for different identities
- Record pronouns, roles, dates, and other details in structured fields
- Map partner, parent-child, foster, adoptive, step, and emotional relationships
- Show donors, surrogates, caregivers, and chosen-family members
- Add notes to explain complex or less familiar roles
- Create a custom legend
- Rearrange and update the genogram as the family structure changes
- Collaborate in real time with role-based permissions
- Use the Genogram Assistant to identify possible gaps or missing connections
- Export the diagram or create a structured PDF or DOCX case file
Creately supports 71 relationship subtypes across nine categories, more than 40 auto-derived person-shape variations, structured field packs, real-time collaboration, and professional report export.
FAQs About LGBTQ+, Nonbinary, or Non-Traditional Family Structure Genograms
How many generations should an inclusive genogram include?
Three generations is common, but the right number depends on the purpose of the genogram. Include enough generations to show the family structure or pattern being explored.
What should I do if someone does not want their identity included?
Respect their preference. Record only the information that is necessary, appropriate, and agreed upon.
How should I handle unknown or unconfirmed information?
Mark it as unknown, unconfirmed, or not reported. Do not guess someone’s identity, relationship role, or family history.
Can I use color to represent gender or sexual orientation?
You can, but color should not be the only way information is communicated. Define the colors in the legend and consider whether the information is relevant before including it.
Should everyone’s identity be shown in the same level of detail?
Not necessarily. The level of detail should depend on the purpose of the genogram and what each person has agreed to share.
How do I keep a complex inclusive genogram easy to read?
Use clear labels, consistent symbols, separate relationship types, short notes, and a visible legend. You may also create different views for medical, emotional, or caregiving information instead of showing everything at once.