User research methods help when you want to get a deep understanding of who your users are, how they behave, and their needs. The data you gather and assess will in turn allow you develop a product or service that will help solve user problems.
In this post, we will look at several visual methods that you can use when conducting user research. Pick what best suits your need and start using it right away with the editable templates below.
What is User Research?
The act of user research helps you understand the behaviors, characteristics, goals requirements and challenges of users. It involves a vast array of methods that differ from face-to-face interviews with customers to A/B testing.
Information gathered from user research is used to develop products that will offer a better user experience and solutions for the user’s problems.
There are 2 types of user research methods
- Quantitative methods – this refers to the type of research where the results can be conveyed in numbers. For example, surveys, eye tracking, field testing etc.
- Qualitative methods – this refers to the type of research where the results collected are comments, thoughts, feelings, or observations. For example, user personas, ethnographic studies, focus groups, scenario storyboards etc.
Visual User Research Methods
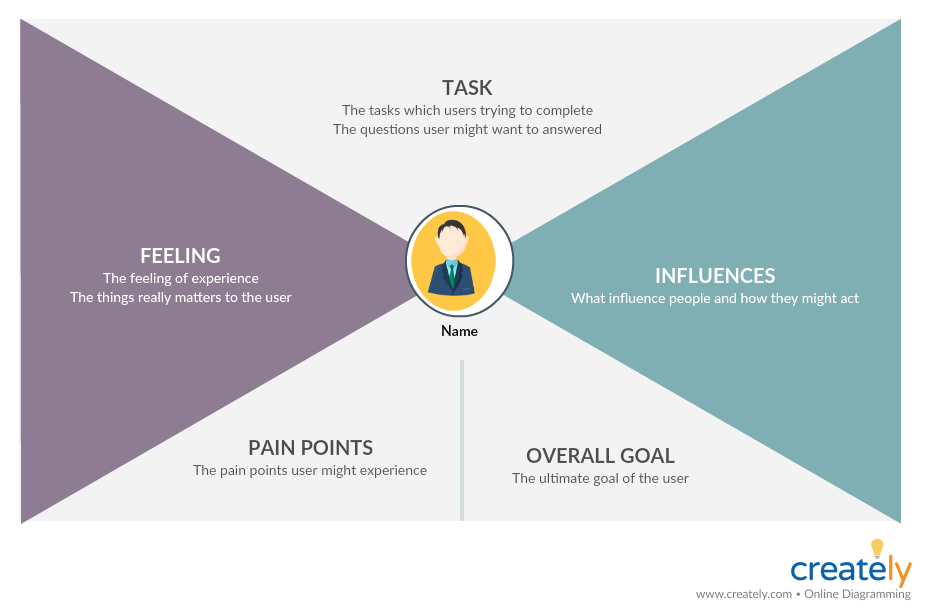
User Personas
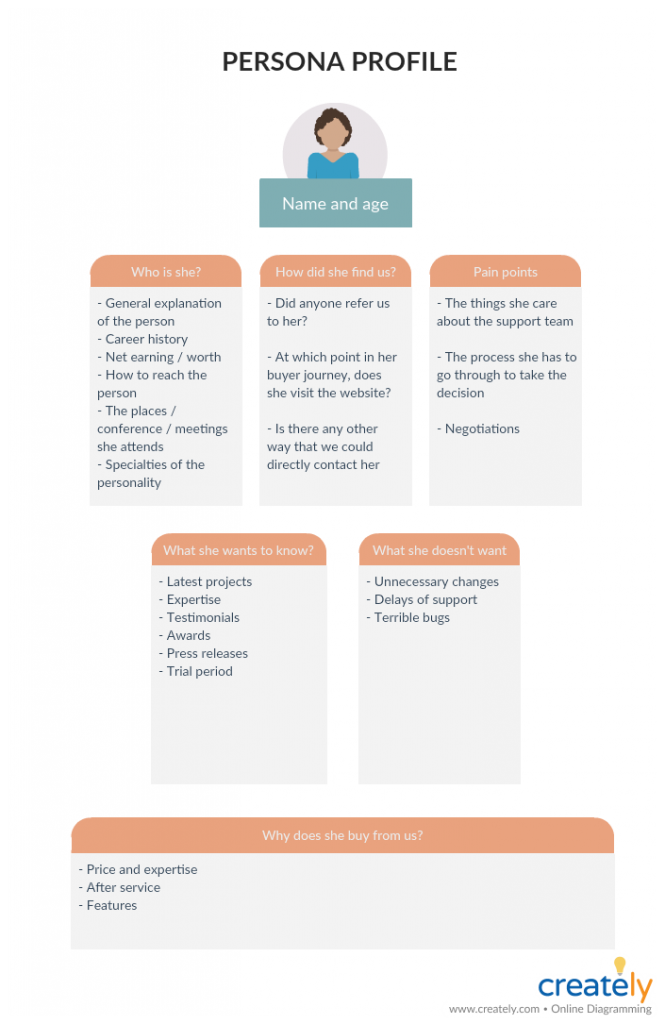
User personas are used to create fictional, yet reliable representations of key user segments. They should be created based on both quantitative and qualitative information about the users.
Creating user personas should be done at the beginning of product development, as it will help you identify the kind of product features, interfaces, content etc. you should design in order to attract the correct user.
While you should limit the number of personas you create to 3-4, keep your focus mainly on the major needs of the important personas you have identified during the development.
How to create a user persona
Step 1: Gather information on who your users are, their behaviors, expectations etc. through user research.
Step 2: Identify the different elements and group them into categories representing different user personas.
Step 3: Combine personas based on similarities and prioritize them. Select 3 or 4 of the top user persona creators you have.
Step 4: Provide an appropriate description of each persona’s background and expectations. Remove excess personal information.
Card Sorting
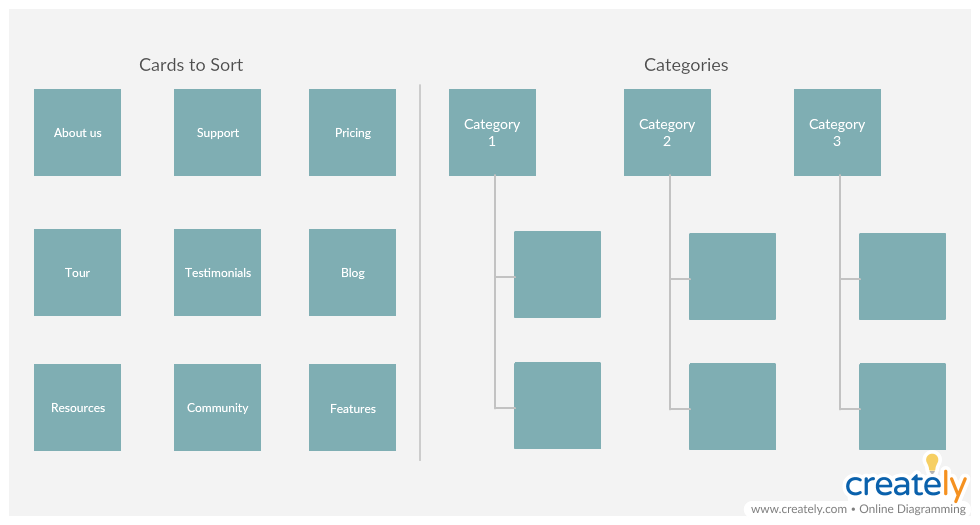
In card sorting, participants/ users are presented with cards with words written on it, and asked to sort them into groups or prioritize them.
This activity is used to understand what matters most to users. For example, by asking users to prioritize cards with navigational items on it, you will be able to discover how a user navigates through your system. This will in turn help you develop or evaluate the information architecture of your site.
You can use sticky notes and a whiteboard to do this activity manually. You can do it online with Creately using a template like the one below. Simply share the link to the diagram with the participants and watch them make changes in real-time.
How to do card sorting
Open card sorting: Here, the participants are asked to group the cards and name each category as it makes sense to them.
Closed card sorting: Here, participants are expected to place cards in categories that are already defined by you.
Customer Journey Mapping
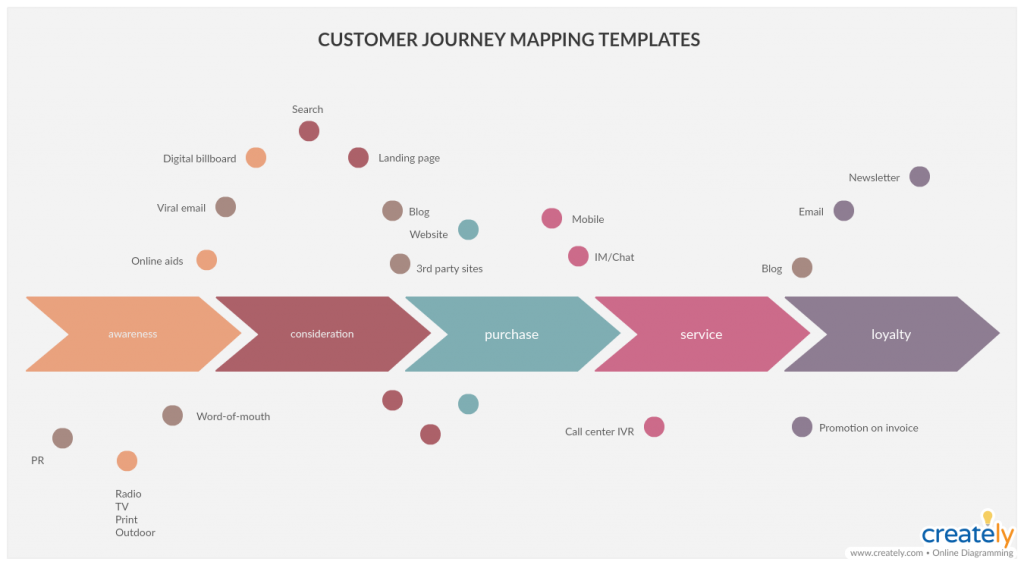
Customer journey maps are a great way to capture and visualize the key touchpoints of a user’s experience as she interacts with your site/ system. It helps you understand the motivations and the goals of your users.
How to create a customer journey map
Step 1: Gather as much information as needed, from both quantitative and qualitative research, to understand the customer’s experience with your organization.
Step 2: Get your team together and brainstorm a list of touchpoints and the channels in which these touchpoints occur.
Step 3: Using empathy maps, get a deeper understanding of what the customer thinks, feels, sees, hears, says and does as she interacts with you.
Step 4: Taking the touchpoints, channels, emotional reactions and timeline, map out the customer journey.
Service Blueprints
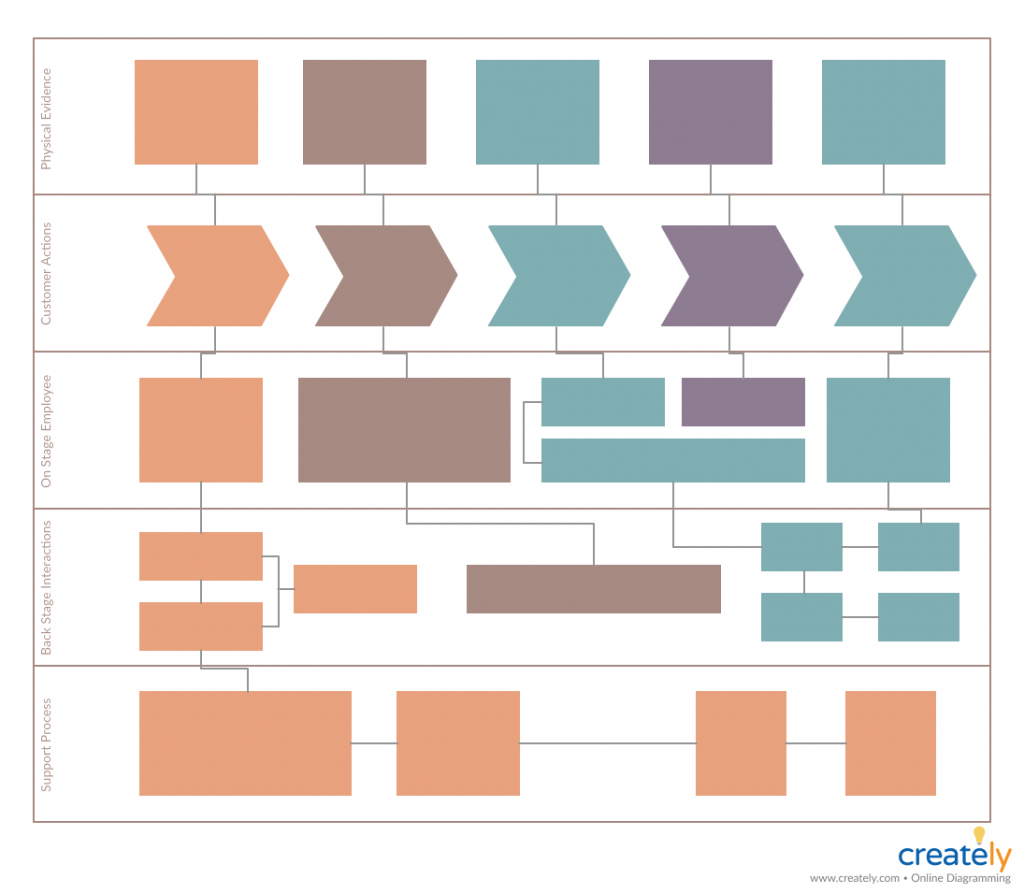
A service blueprint visualizes how a service works while detailing all the related aspects along a timeline.
It shows how processes and their components are linked together by incorporating the perspective of both the user and the employees in different departments that are involved in implementing it.
How to create a service blueprint
Step 1: Gather a team of employees from different departments involved in carrying out the process.
Step 2: Identify the process to be blueprinted and the corresponding customer. Referring to a customer journey map, identify the actions the customer takes as she interacts with your service.
Step 3: Interview the employees from the departments responsible for the process to gather information on how it works from their perspective.
Step 4: Create a swimlane diagram and outline the employee frontstage actions and follow them up with employee backstage actions.
Step 5: Add the actions that help carry out the process behind the scenes (support processes) on the map as well.
Empathy Maps
Empathy maps help understand the user in multiple viewpoints in relation to the product or service. It highlights how the user thinks, the user’s first impression of the service and their behavior and attitudes.
The empathy map takes observations made about the user and visualizes it in a systematic, easy-to-understand way.
How to use an empathy map
Step 1: Find relevant data on users, create user personas for different customer segments and gather a competent team.
Step 2: Create an empathy map template. It should have quadrants to mention what the user thinks and feels, sees, hears, and says and does.
Step 3: After you decide which user segment you want to analyze, define their situation, needs and goals.
Step 4: Examine the experiences of the user to make sense of what it is like to be her. Gather details on what she thinks and feels, sees, hears and says and does.
Step 5: Reflect on the information gathered and ask for the perspective and opinions of the team members.
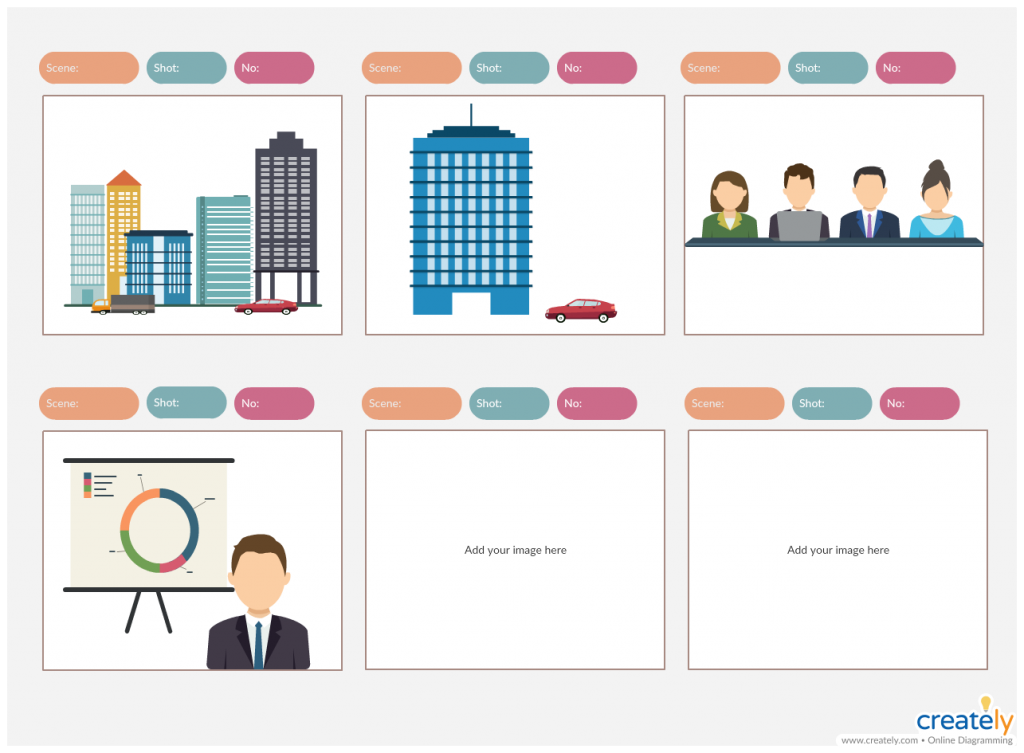
Storyboards
Storyboards are a handy tool that can be used to communicate design ideas to your team, stakeholders etc. It visualizes how a user would interact with or react to your site or app. Storyboards can take the form of sketches, illustrations, screenshots etc.
How to create a storyboard
Step 1: Define your character. This could be one of the user personas you have created.
Step 2: Set the scene by defining the environment or where you want the persona to be at and create a plot for the storyboard. You can take the input of your team as well.
Step 3: Choose a storyboard template like the one below, and start sketching the scenes. Below is a blank storyboard template that you can edit right away.
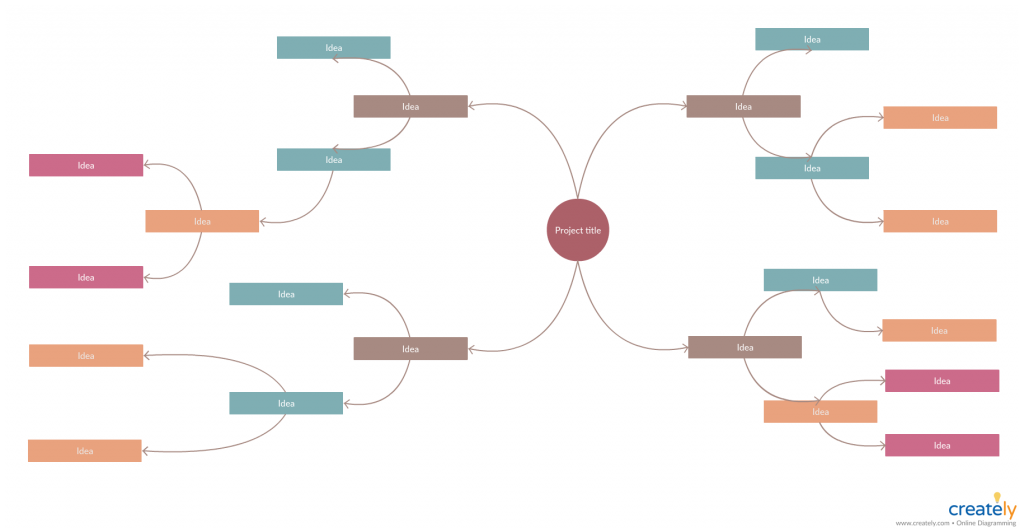
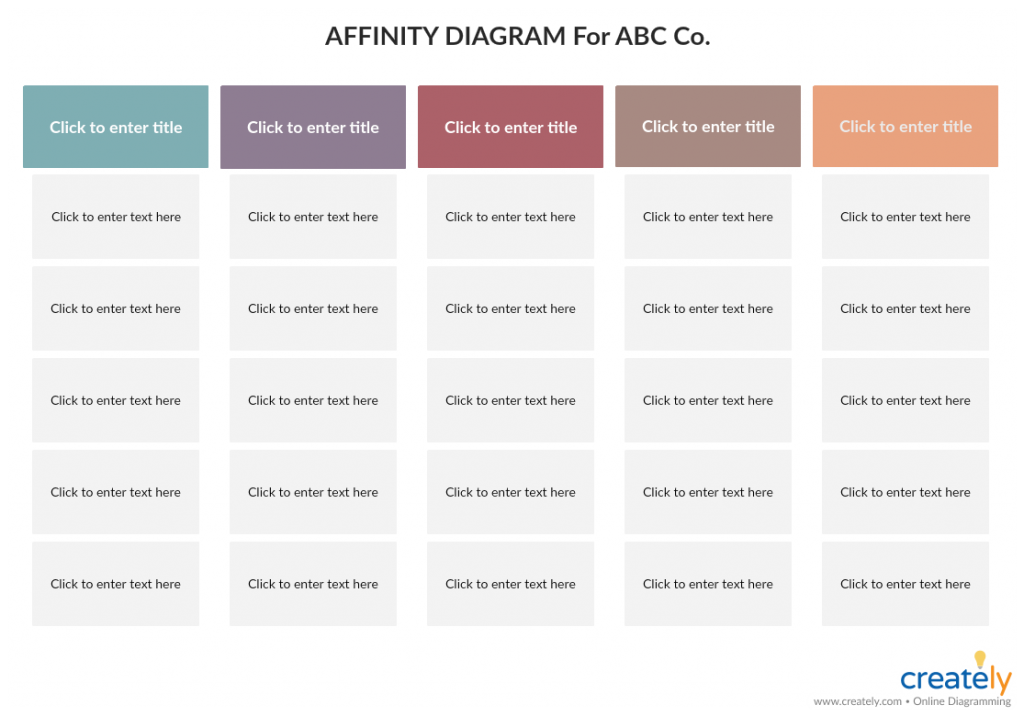
Mind Maps and Affinity Diagrams
Mind maps and affinity diagram tool are another two visual tools that help facilitate user research.
Mind maps can be used to capture, categorize and organize data collected from user research methods.
Affinity diagrams can help group similar ideas and identify patterns in a large amount of data.
Add to the List of Visual User Research Methods
We’ve covered several visual user research methods that can help simplify the process of collecting and analyzing user data. Use them and share your experience with us in the comment section below.
Do you know more visual user research methods? Help us extend the list by mentioning the methods you are familiar with.