For the past 20 years, I’ve been helping entrepreneurs and business owners write business plans. In doing so, I’ve learned that the perfect business plan must be both functional and easy to read.
With regards to functional, a business plan should provide a clear roadmap of how you’re going to grow your company. And with regards to “easy to read,” your plan can’t include pages and pages of text sure to make readers cringe. Creately online roadmap maker allows you to build comprehensive roadmaps. You can also use business plan software like Upmetrics to simplify the process and organize your full plan with clarity and structure.
Rather, you want people to enjoy reading your plan, so they take the action you desire such as funding your business.
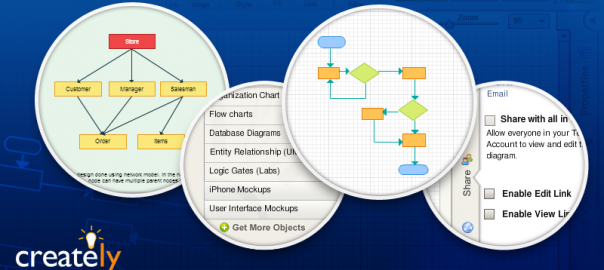
Fortunately, when adding Creately to your business plan, you can make your plan both more functional and easier to read.
To confirm this, I used my core business plan template and brainstormed the best places to add Creately diagrams to improve your business plan. Below are five areas I found where Creately can provide significant value.
Company Overview
In the Company Overview section of your business plan, you want to detail what your company has already accomplished to date. This is because past accomplishments are a great indicator of future success.
A Creately chart, like the one below, is a great way to show these accomplishments.

Industry Analysis
It’s very important for readers to understand the size of your marketplace.
And oftentimes your business may compete in more than one market. Using a Venn Diagram Maker within Creately is a great way to quickly explain to readers the markets you’re targeting and their sizes.

A great visualization technique to illustrate your company’s position within the industry is a SWOT analysis.
A SWOT analysis illustrates the strengths and weaknesses that exist within the internal environment of the company and opportunities and threats that exist within the external environment of the organization.
It can help you effectively present the current position and the circumstances of your company within the industry to the reader. Creately has many professionally designed SWOT analysis templates so you can get started instantly.

Key Operational Processes
Your business plan should detail the key day-to-day processes that your company performs to generate sales and profits.
Having a Creately flowchart, like the one below, allows you to easily document your processes and show them to others.

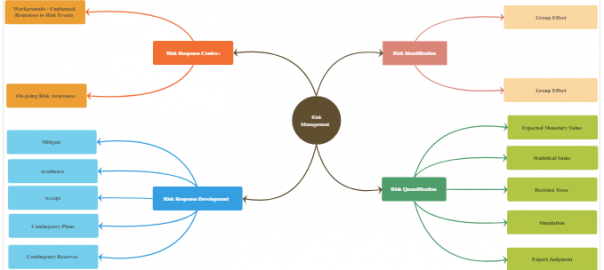
Risk Mitigating Milestones
A “risk mitigating milestone” is a milestone that, once completed, reduces the risk your venture will fail. As such, investors and lenders need to understand your milestones and how they relate to one another.
The Creately Gantt chart maker below allows the reader to quickly and easily see your company’s milestones. You can even add in times when additional funding might be required.

Management Team
Great ideas are a dime a dozen. Great management teams are not.
The fact is that the quality of your management team is crucial to your company’s success. In your business plan, you should detail who is on your team and your reporting structure.
Also, if you need to hire a key person to improve your team, you should include the title and responsibilities of that person in your plan.
A great way to show your management team in your plan is via a Creately Organization Chart software as shown below:

In summary, making your business plan both functional and easy to read will dramatically improve its success, and Creately is a great tool to achieve this most easily.
Author Bio
Dave Lavinsky is a serial entrepreneur and the president and founder of Growthink, which since 1999, has helped hundreds of thousands of entrepreneurs create business plans. Dave is also the founder of BusinessPlanTemplate.com which provides templates for specific niches ranging from restaurants to internet businesses.