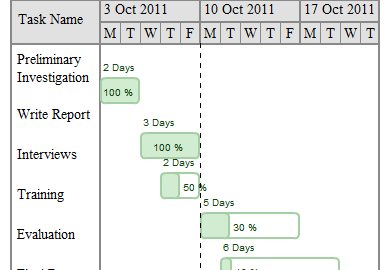
We are excited to announce our new Gantt Chart Objects! It’s really simple and easy to draw Gantt charts or come up with a quick time line for planning things.
Most times you simply need to explain your thinking about a project schedule, a sequence of events with creating a Gantt chart or by make a timeline, you end up having to use a tool like Microsoft Project or draw it manually using a drawing software. We have gotten rid of that complexity and have added some nifty features to make it faster and easier to draw Gantt charts, so you can have fun while planning your projects. Below are some templates created using our tools ( click to open in new window )
Below are some of the new Gantt chart features
1/ Quickly Draw Graphs with Drag and Drop Elements
Gantt Specific objects like Gantt Container, Timeline to quickly start drawing diagrams. Just drag and drop the elements to the drawing area.
2/ Easily Add Columns and Rows
Double click on the Gantt Container and You will be taken to a text editor. Add a row by simply adding a line break and add a column by adding a comma
3/ Smart Objects that Adjust Automatically
Increasing the length of the object automatically increases the unit number, dragging tasks adjust the connectors etc
4/ One Click Create to Add Dependent Tasks
Create dependent tasks easily with connecting arrows automatically created for you
5/ Show Completed Percentage Within Tasks
Easily track the progress of the task by showing completed percentage within the bar
6/ Timeline only Object for Simple Planning
Sometime people don’t want complicated graphs with columns and rows, and simple planning object is the tool to do exactly that.
The above new features combined with the already existing features of Creately makes it a great online tool to draw Gantt charts. Check out the below video to see how easy it is to create Gantt charts using Creately.
Have fun drawing Gantt charts and time lines with our tools and feel free to share your ideas and suggestions in the comments section.


looking for software to produce a bar chart showing schedule of different construction items , demo, drywall , acoustical , plumbing , hvac ?
could be nice to include in text editor columns for initdate and % of completion so gantt generates itself not only with cells but also with the progress bars
Great work. I have shared this with my team members and they are loving it. Thnaks.
Regards,
Jennifer
Hi Shruthim
Create an account and it will automatically be saved as a diagram in your account,
hw to save my created gantt chart to system??
Glad you like it George, have fun drawing Gantt charts and thanks for stopping by.
This is a great tool for Project management. Doing it online makes more collaborative.
[…] features mentioned above, Creately supports most of the diagram types. They also have support for drawing simple Gantt charts, which normally came only with project management software. There are many pre made diagram […]
You are welcome Rick, Have fun with the tool and let us know where we can improve.
Going to try this weekend. Thank you for this tool. Tweet coming up.
[…] types like Flowcharts, UML diagrams etc. But innovative companies like Creately created tools to draw Gantt charts online as well. Because these tools were affordable they just might make Gantt charts the common planning […]
[…] hope you had fun using our simple Gantt chart drawing tools and your Creately experience is going to get even better with the launch of Creately Diagramming […]
Well done! I love the simplicity of this tool. A home run.
Thanks Doug, Glad you liked the tools, have fun using them and be sure to give your suggestion for improvements.